Microsoft Excel 2016 BIBLE (2016)
Part III
Creating Charts and Graphics
Chapter 23
Enhancing Your Work with Pictures and Drawings
IN THIS CHAPTER
1. Inserting and customizing Shapes
2. Getting an overview of SmartArt and WordArt
3. Working with other types of graphics
When it comes to visual presentation, Excel has a lot more up its sleeve than charts. As you may know, you can insert a variety of graphics into your worksheet to add pizzazz to an otherwise boring report.
This chapter describes the non-chart-related graphics tools available in Excel. These tools consist of Shapes, SmartArt, WordArt, imported images, and more. In addition to enhancing your worksheets, you'll find that working with these objects can be a nice diversion. When you need a break from crunching numbers, you might enjoy creating an artistic masterpiece using Excel's graphics tools.
 Most of the examples in this chapter are available on this book's website at www.wiley.com/go/excel2016bible.
Using Shapes
Microsoft Office, including Excel, provides access to a variety of customizable graphics images known as Shapes. You might want to insert Shapes to create simple diagrams, display text, or just add some visual appeal to a worksheet.
Keep in mind that Shapes can add unnecessary clutter to a worksheet. Perhaps the best advice is to use Shapes sparingly. Ideally, Shapes can help draw attention to some aspect of your worksheet. They shouldn't be the main attraction.
Inserting a Shape
You can add a Shape to a worksheet's draw layer by choosing Insert ![]() Illustrations
Illustrations ![]() Shapes, which opens the Shapes gallery, shown in Figure 23.1. Shapes are organized into categories, and the category at the top displays the Shapes that you've used recently. To insert a Shape into a worksheet, you can do one of the following:
Shapes, which opens the Shapes gallery, shown in Figure 23.1. Shapes are organized into categories, and the category at the top displays the Shapes that you've used recently. To insert a Shape into a worksheet, you can do one of the following:
· Click the Shape in the Shapes gallery and then click in the worksheet. A default-sized shape is added to your worksheet.
· Click the Shape and then drag in the worksheet. This allows you to create a larger or a smaller Shape, or a Shape with different proportions than the default.
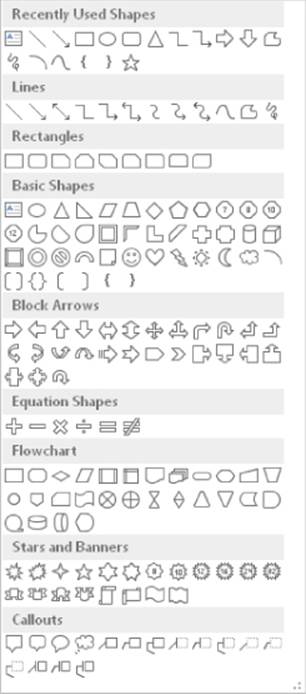
Figure 23.1 The Shapes gallery.
When you release the mouse button, the object is selected, and its name appears in the Name box (as shown in Figure 23.2).
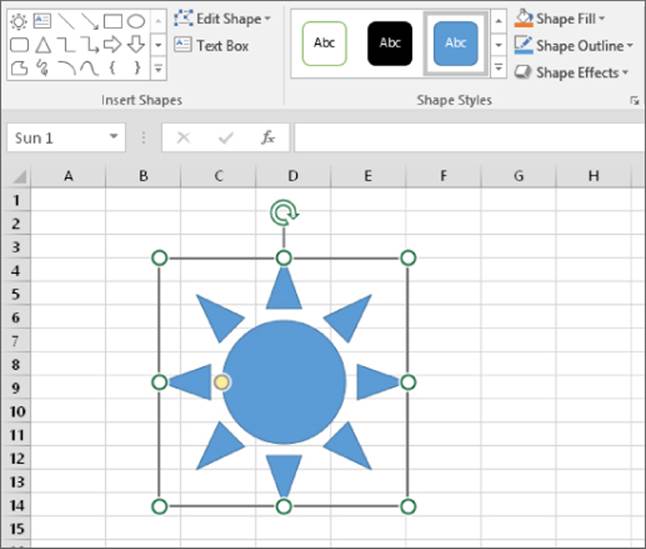
Figure 23.2 This Shape was drawn on the worksheet. Its name (Sun 1) appears in the Name box.
Tip
You can also insert a Shape into a chart. Just select the chart before you choose the Shape from the gallery and then click inside the chart to insert the Shape. The Shape is embedded in the chart. If you move the chart, the Shape comes along. The Shape also adjusts when you change the size of the chart.
A few Shapes require a slightly different approach. For example, when adding a FreeForm Shape (from the Lines category), you can click repeatedly to create lines. Or click and drag to create a nonlinear shape. Double-click to finish drawing and create the Shape. The Curve Shape (in the Lines category) also requires several clicks while drawing. If you choose the Scribble Shape, you just drag the mouse pointer across the worksheet to create your masterpiece. If you connect the ends, it will be a filled Shape.
Here are a few tips to keep in mind when creating Shapes:
· Every Shape has a name. Some have generic names like Shape 1 and Shape 2, but others are given more descriptive names (for example, Rectangle 1). To change the name of a Shape, select it, type a new name in the Name box, and press Enter.
· To select a specific Shape on a worksheet, just click it.
· When you create a Shape by dragging, hold down the Shift key to maintain the object's default proportions.
· You can control the way objects appear onscreen in the Advanced tab of the Excel Options dialog box. (Choose File ![]() Options.) This setting appears in the Display Options for This Workbook section. Normally, the All option is selected under For Objects Show. You can hide all objects by choosing Nothing (Hide Objects). Hiding objects may speed things up if your worksheet contains complex objects that take a long time to redraw.
Options.) This setting appears in the Display Options for This Workbook section. Normally, the All option is selected under For Objects Show. You can hide all objects by choosing Nothing (Hide Objects). Hiding objects may speed things up if your worksheet contains complex objects that take a long time to redraw.
About the Drawing Layer
Every worksheet and chart sheet has a drawing layer. This invisible surface can hold Shapes, SmartArt, WordArt, graphics images, embedded charts, inserted objects, and so on.
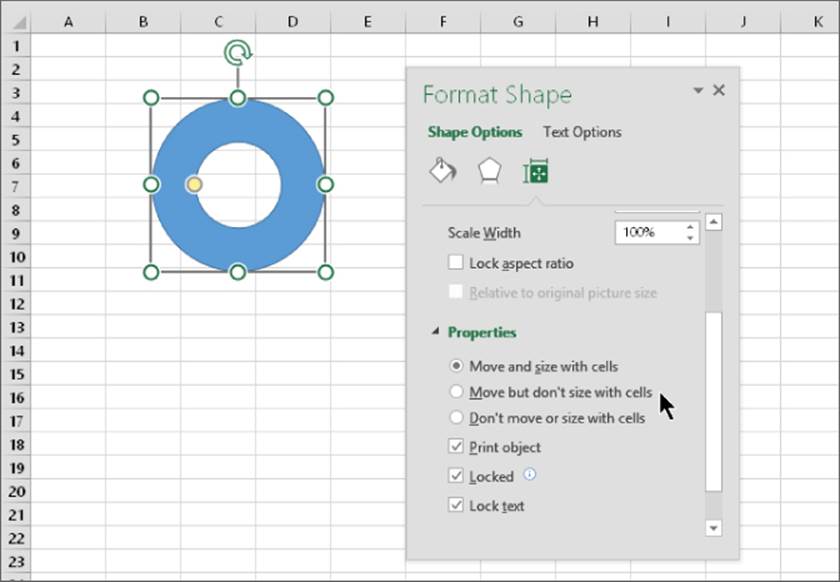
You can move, resize, copy, and delete objects placed on the drawing layer, with no effect on any other elements in the worksheet. Objects on the drawing layer have properties that relate to the way they're moved and sized when underlying cells are moved and sized. When you right-click a graphics object and choose Size and Position from the shortcut menu, Excel displays the Format task pane for the object. Expand the Properties section to adjust the way the object moves or resizes with its underlying cells. (See the accompanying figure.)
Your choices are as follows:
· Move and Size with Cells: If this option is selected, the object appears to be attached to the cells beneath it. For example, if you insert rows above the object, the object moves down. If you increase the column width, the object gets wider.
· Move but Don't Size with Cells: If this option is selected, the object moves whenever rows or columns are inserted, but it never changes its size when you change row heights or column widths.
· Don't Move or Size with Cells: This option makes the object completely independent of the underlying cells.
The preceding options control the way an object is moved or sized with respect to the underlying cells.
Excel also lets you attach an object to a cell. To do so, choose File ![]() Options to open the Excel Options dialog box, click the Advanced tab, and select the Cut, Copy, and Sort Inserted Objects with Their Parent Cells check box. After you do so, graphic objects on the drawing layer are attached to the underlying cells. If you copy a range of cells that includes an object, the object is also copied. Note that this is a general option that affects all objects. By default, this option is enabled.
Options to open the Excel Options dialog box, click the Advanced tab, and select the Cut, Copy, and Sort Inserted Objects with Their Parent Cells check box. After you do so, graphic objects on the drawing layer are attached to the underlying cells. If you copy a range of cells that includes an object, the object is also copied. Note that this is a general option that affects all objects. By default, this option is enabled.
Adding text to a Shape
Many Shape objects can display text. To add text to such a Shape, select the Shape and start typing the text.
To change the formatting for all text in a Shape, click the Shape object to select it. You can then use the formatting commands on the Font and Alignment groups of the Home tab of the Ribbon. To change the formatting of specific characters within the text, select only those characters, and use the Ribbon controls. Or right-click and use the Mini toolbar to format the selected text. In addition, you can dramatically change the look of the text by using the tools in the Drawing Tools ![]() Format
Format ![]() WordArt Styles group. You can read more about WordArt later in this chapter.
WordArt Styles group. You can read more about WordArt later in this chapter.
Selecting and Hiding Objects
An easy way to select an object is to use the Selection task pane. Just select any Shape and then choose Drawing Tools ![]() Format
Format ![]() Arrange
Arrange ![]() Selection Pane. Or if a Shape isn't selected, you can choose Home
Selection Pane. Or if a Shape isn't selected, you can choose Home ![]() Editing
Editing ![]() Find & Select
Find & Select ![]() Selection Pane.
Selection Pane.
As with all task panes, you can undock this pane from the side of the window and make it free-floating. The accompanying figure shows the Selection task pane as a floating window.
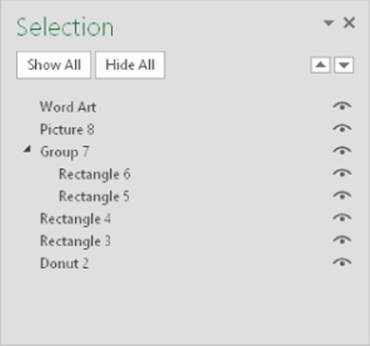
Each object on the active worksheet is listed in the Selection task pane. Just click the object's name to select it. To select multiple objects, press Ctrl while you click the names.
To hide an object, click the “eye” icon to the right of its name. Use the buttons at the top of the task pane to quickly hide (or show) all items.
Formatting Shapes
When you select a Shape, the Drawing Tools ![]() Format contextual tab is available, with the following groups of commands:
Format contextual tab is available, with the following groups of commands:
· Insert Shapes: Insert new Shapes; change a Shape to a different Shape.
· Shape Styles: Change the overall style of a Shape; modify the Shape's fill, outline, or effects.
· WordArt Styles: Modify the appearance of the text within a Shape.
· Arrange: Adjust the “stack order” of Shapes, align Shapes, group multiple Shapes, and rotate Shapes.
· Size: Change the size of a Shape by typing dimensions.
Additional commands are available from the Shape's shortcut menu (which you access by right-clicking the Shape). You can also use your mouse to perform some operations directly; for example, you can resize or rotate a Shape.
Figure 23.3 shows a worksheet with some Shapes that use various types of formatting.
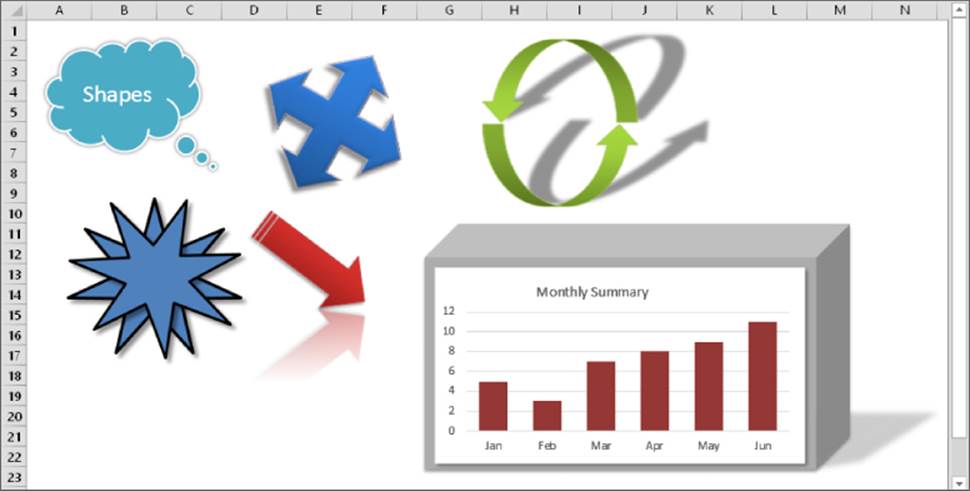
Figure 23.3 A variety of Shapes.
As an alternative to the Ribbon, you can use the Format Shape task pane. Right-click the Shape and choose Format Shape from the shortcut menu. The task pane contains some additional formatting options that aren't on the Ribbon. Changes appear immediately, and you can keep the Format Shape task pane open while you work.
I could probably write 20 pages about formatting Shapes, but it would be a waste of paper and certainly not an efficient way of learning about Shape formatting. The best way, by far, to learn about formatting Shapes is to experiment. Create some shapes, click some commands, and see what happens. The commands are fairly intuitive, and you can always use Undo if a command doesn't do what you expected it to do.
Stacking Shapes
Shapes (as well as other objects on the drawing layer) are arranged in a stack. Each object that is added is placed at the top of the stack. Therefore, a large Shape can be stacked on top of a smaller Shape, completely obscuring it.
The Selection task pane lists the objects in order. (The first object listed is at the top of the stack.) You can drag and drop item names in the Selection task pane to change the stack order.
Another way to change the stack order of a Shape is to right-click the Shape and choose one of these commands from the shortcut menu:
· Bring to Front ![]() Bring to Front: Sends the Shape to the top of the stack
Bring to Front: Sends the Shape to the top of the stack
· Bring to Front ![]() Bring Forward: Sends the Shape one level higher
Bring Forward: Sends the Shape one level higher
· Send to Back ![]() Send to Back: Sends the Shape to the bottom of the stack
Send to Back: Sends the Shape to the bottom of the stack
· Send to Back ![]() Send Backward: Sends the Shape one level lower
Send Backward: Sends the Shape one level lower
These commands are also available in the Drawing Tools ![]() Format
Format ![]() Arrange group of the Ribbon.
Arrange group of the Ribbon.
Grouping objects
Excel lets you group (combine) two or more Shape objects into a single object. For example, if you create a design that uses four separate Shapes, you can combine them into a group. Then you can manipulate this group as a single object (move it, resize it, apply formatting, and so on).
To group objects, press Ctrl while you click the objects to be included in the group. Then right-click any of the selected Shapes and choose Group ![]() Group from the shortcut menu.
Group from the shortcut menu.
You can even make a group of grouped Shapes. Notice that the Selection task pane displays grouped objects in an outline format, so you can easily see which Shapes make up a group.
Tip
You can also group a chart with a Shape. Just drag a chart onto a Shape, select both objects, right-click, and choose Group ![]() Group. You need to change the stack order if the chart is behind the Shape. This is a good way to make your charts stand out from the crowd. Figure 23.3 shows an example of a Shape grouped with a chart.
Group. You need to change the stack order if the chart is behind the Shape. This is a good way to make your charts stand out from the crowd. Figure 23.3 shows an example of a Shape grouped with a chart.
When objects are grouped, you can still work with an individual object. Click once to select the group; then click again to select the object.
To ungroup a group, right-click the group object and choose Group ![]() Ungroup from the shortcut menu. This command breaks the object into its original components.
Ungroup from the shortcut menu. This command breaks the object into its original components.
Aligning and spacing objects
When you have several objects on a worksheet, you may want to align and evenly space these objects. You can, of course, drag the objects with your mouse (which isn't very precise). Or you can use the navigation arrow keys to move a selected object one pixel at a time. The fastest way to align and space objects is to let Excel do it for you.
To align multiple objects, start by selecting them. (Press Ctrl and click the objects.) Then use the tools in the Drawing Tools ![]() Format
Format ![]() Arrange
Arrange ![]() Align drop-down list.
Align drop-down list.
Note
Unfortunately, you can't specify which object is used as the basis for the alignment. When you're aligning objects to the left (or right), they're always aligned with the leftmost (or rightmost) object that's selected. When you're aligning objects to the top (or bottom), they're always aligned with the topmost (or bottommost) object. Aligning the centers (or middles) of objects will align them along an axis halfway between the left and right (or top and bottom) extremes of the selected shapes. After you align the Shapes, they remain selected, so it's easy to drag them to the desired location.
You can instruct Excel to distribute three or more objects so that they're equally spaced horizontally or vertically. Choose Drawing Tools ![]() Format
Format ![]() Arrange
Arrange ![]() Align, and then select either Distribute Horizontally or Distribute Vertically.
Align, and then select either Distribute Horizontally or Distribute Vertically.
Reshaping Shapes
Excel has many Shapes to choose from, but sometimes the Shape you need isn't in the gallery. In such a case, you may be able to modify one of the existing shapes using one of these techniques:
· Rotate the Shape. When you select a Shape, it displays a small circular arrow. Click and drag this arrow to rotate the Shape.
· Group multiple Shapes. You may be able to create the Shape you need by combining two or more Shapes and then grouping them. (See “Grouping objects,” earlier in this chapter.)
· Reconfigure the Shape. Many Shapes display one or more small yellow squares when the Shape is selected. You can click and drag this square to change the Shape's outline. The exact behavior varies with the Shape, so you should experiment and see what happens. Figure 23.4 shows six variations of an up-down arrow. This particular shape, when selected, has two yellow squares, which allows lots of variations.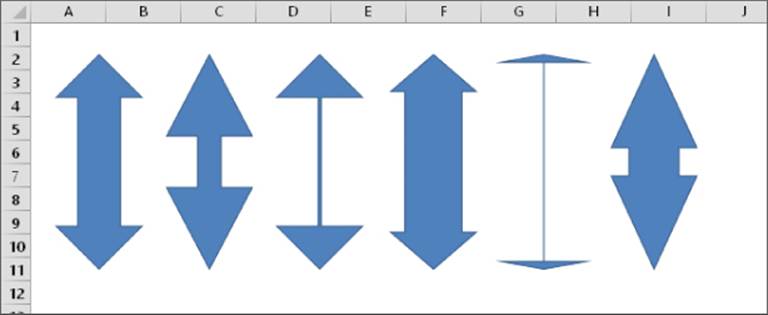
Figure 23.4 Six variations on a Shape.
· Create a Freeform Shape. Select the Freeform Shape (in the Lines category of the Shapes gallery) to create a custom Shape. Figure 23.5 shows a Freeform Shape, with eyes and a mouth added. The shadow effect completes the masterpiece.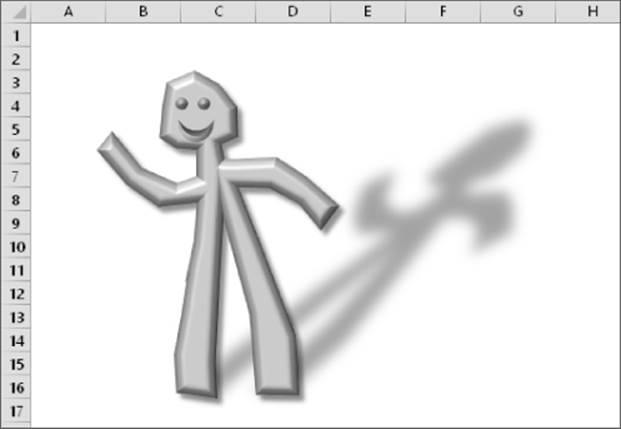
Figure 23.5 When none of the existing Shapes will do, create your own Freeform Shape.
· Editing a Shape's Points. Another way to create a unique Shape is to edit its points. Select the Shape and choose Drawing Tools ![]() Format
Format ![]() Insert Shapes
Insert Shapes ![]() Edit Shape
Edit Shape ![]() Edit Points. You can then drag the points to reconfigure the Shape. Figure 23.6 shows an example of a Shape (named Frame) that has been edited beyond all recognition.
Edit Points. You can then drag the points to reconfigure the Shape. Figure 23.6 shows an example of a Shape (named Frame) that has been edited beyond all recognition.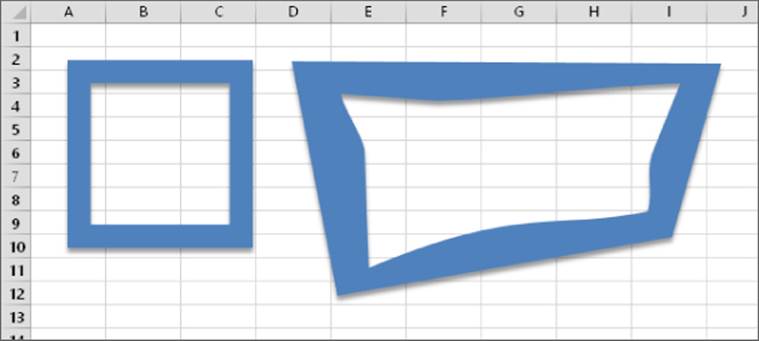
Figure 23.6 A Shape before and after editing its points.
Printing objects
By default, objects are printed along with the worksheet. To avoid printing a Shape, right-click the Shape and choose Size and Position. In the Format Shape task pane, expand the Properties section and then clear the Print Object check box.
Exporting Graphics Objects
If you create a graphic in Excel using Shapes, SmartArt, or WordArt, you may want to save the graphic as a separate file for use in another program. Unfortunately, Excel doesn't provide a direct way to export a graphic, but here's a useful trick. First, a bit of setup work is required:
1. Right-click the Quick Access toolbar and choose Customize the Quick Access Toolbar. The Quick Access Toolbar tab of the Excel Options dialog box appears.
2. In the upper-left drop-down control, choose Commands Not in the Ribbon.
3. In the list box, scroll down and select Web Options, and then click the Add button.
4. In the list box, select Web Page Preview, and then click the Add button.
5. Click OK to close the Excel Options dialog box. Your Quick Access toolbar will have two new buttons.
Here's how to use these tools to export graphics objects (including charts) from a worksheet:
1. Make sure that your graphics appear the way you want.
2. Click the Web Page Preview button in the Quick Access toolbar. A copy of your workbook is converted to an HTML file and is displayed in your default browser.
3. In the browser, right-click a graphics object, choose Save Image As, and specify a location for the file. Your browser may have a different but equivalent command. Or you can just drag the graphics image to your desktop.
If the quality of the images in your browser is lacking, click the Web Options button in your Quick Access toolbar.
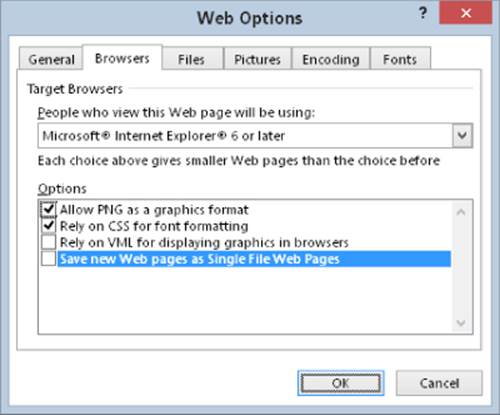
In the Web Options dialog box, click the Browser tab and make sure Allow PNG as a Graphics Format is enabled. If graphics don't appear in your browser at all, remove the check mark from Rely on VML for Displaying Graphics in Browser. Next, click the Pictures tab and choose the 120 Pixels Per Inch option. Click OK and do the web preview again. You should see better-quality graphics (transparent PNG files).
Using SmartArt
Excel's Shapes are certainly impressive, but the SmartArt feature is downright amazing. Using SmartArt, you can insert a variety of highly customizable diagrams into a worksheet, and you can change the overall look of the diagram with a few mouse clicks. This feature was introduced in Office 2007 and is probably more useful for PowerPoint users. But many Excel users will be able to make good use of SmartArt.
Inserting SmartArt
To insert SmartArt into a worksheet, choose Insert ![]() Illustrations
Illustrations ![]() SmartArt. Excel displays the dialog box shown in Figure 23.7. The diagrams are arranged in categories along the left. When you find one that looks appropriate, click it for a larger view in the panel on the right, which also provides some usage tips. Then click OK to insert the graphic.
SmartArt. Excel displays the dialog box shown in Figure 23.7. The diagrams are arranged in categories along the left. When you find one that looks appropriate, click it for a larger view in the panel on the right, which also provides some usage tips. Then click OK to insert the graphic.
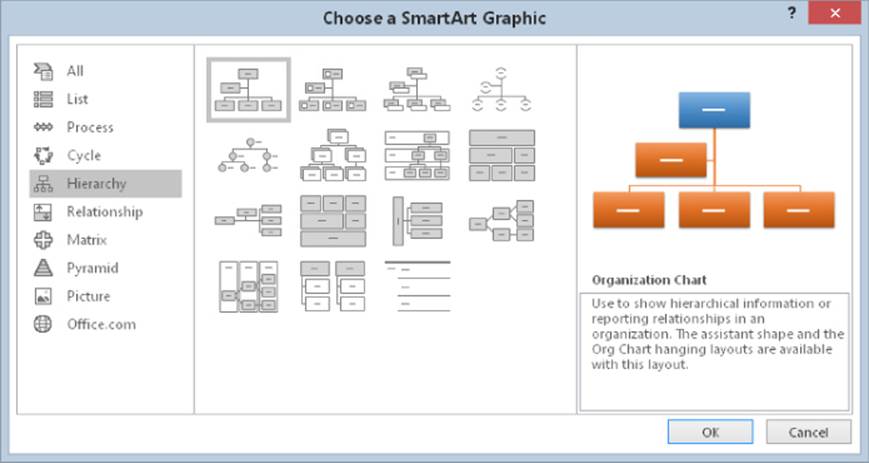
Figure 23.7 Inserting a SmartArt graphic.
Note
Don't be concerned about the number of elements contained in the SmartArt graphics. You can customize the SmartArt to display the number of elements you need.
When you insert or select a SmartArt diagram, Excel displays its SmartArt Tools contextual tab, which provides many customization options.
Customizing SmartArt
Figure 23.8 shows a SmartArt graphic (named Vertical Equation, from the Process category) immediately after I inserted it into a worksheet. The Type Your Text Here window makes it easy to enter text into the elements of the image. If you prefer, you can click one of the [Text] areas in the image and type the text directly.
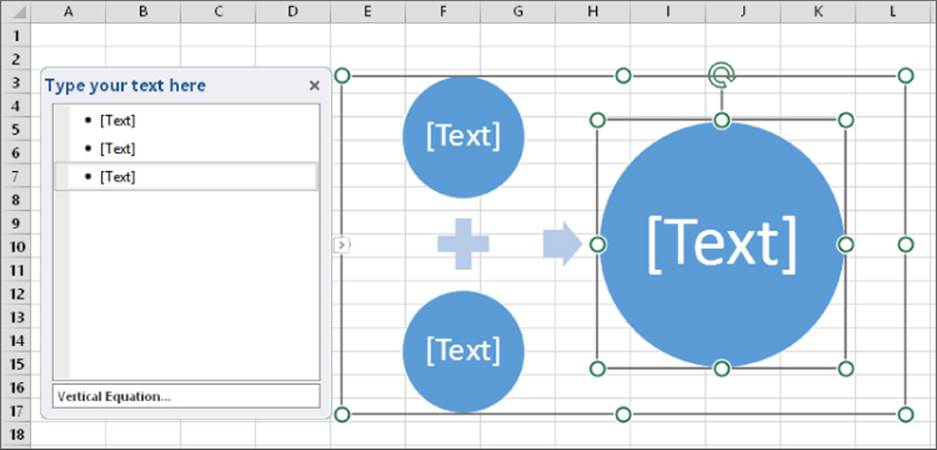
Figure 23.8 This SmartArt needs to be customized.
This particular diagram depicts two items combining into a third item. Suppose that your boss sees this graphic and tells you that you need a third item. To add an element to the SmartArt graphic, just select an item and choose SmartArt Tools ![]() Design
Design ![]() Create Graphic
Create Graphic ![]() Add Shape. Or you can just select an item and press Enter. Figure 23.9 shows the modified SmartArt, after adding a third item and providing text.
Add Shape. Or you can just select an item and press Enter. Figure 23.9 shows the modified SmartArt, after adding a third item and providing text.
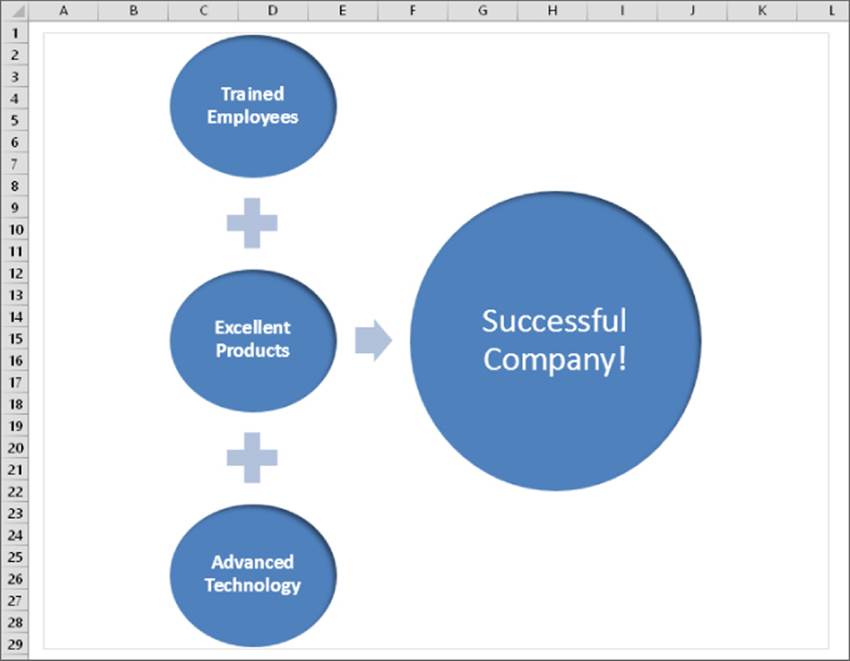
Figure 23.9 The SmartArt after you add a new element and text.
When working with SmartArt, keep in mind that you can move, resize, or format individually any element within the graphic. Select the element and then use the tools on the SmartArt Tools ![]() Format tab.
Format tab.
Changing the layout and style
You can easily change the layout of a SmartArt diagram. Select the object and then choose SmartArt Tools ![]() Design
Design ![]() Layouts. Any text that you've entered remains intact.
Layouts. Any text that you've entered remains intact.
After you decide on a layout, you may want to consider other styles or colors available in the SmartArt Tools ![]() Design
Design ![]() SmartArt Styles group.
SmartArt Styles group.
Tip
SmartArt styles available vary depending on the document theme assigned to the workbook. To change a workbook's theme, choose Page Layout ![]() Themes
Themes ![]() Themes. Switching to a different theme can have a dramatic impact on the appearance of SmartArt diagrams.
Themes. Switching to a different theme can have a dramatic impact on the appearance of SmartArt diagrams.
Learning more about SmartArt
This section provided a basic introduction to SmartArt. The topic is probably complex enough to warrant an entire book, but I recommend simply experimenting with the commands.
Using WordArt
You can use WordArt to create graphical effects in text. Figure 23.10 shows a few examples of WordArt.
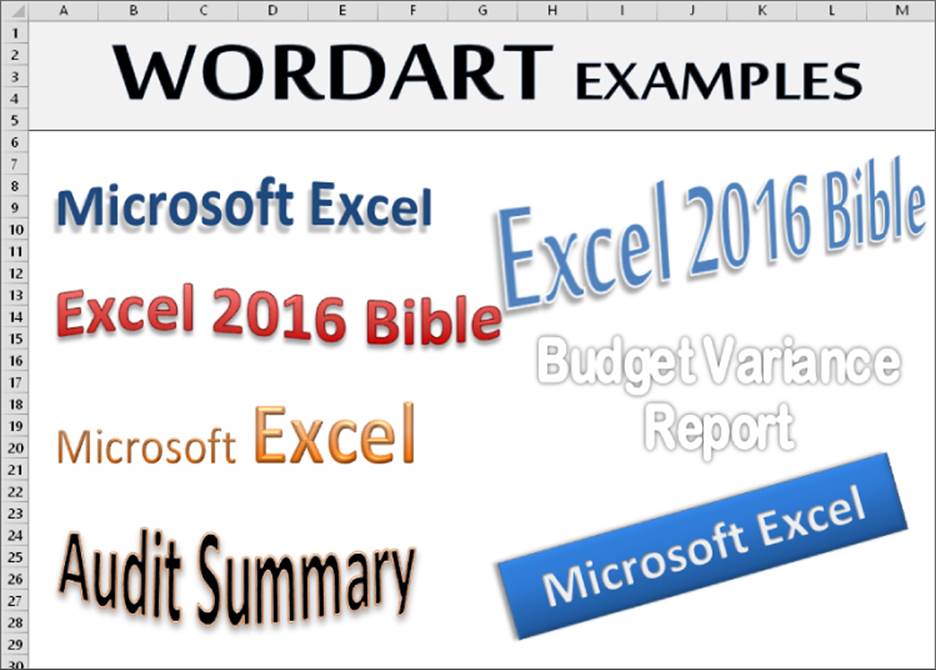
Figure 23.10 WordArt examples.
To insert a WordArt graphic on a worksheet, choose Insert ![]() Text
Text ![]() WordArt and then select a style from the gallery. Excel inserts an object with the placeholder text Your text here. Replace that text with your own, resize it, and apply other formatting if you like.
WordArt and then select a style from the gallery. Excel inserts an object with the placeholder text Your text here. Replace that text with your own, resize it, and apply other formatting if you like.
When you select a WordArt image, Excel displays its Drawing Tools contextual menu. Use the controls to vary the look of your WordArt. Or right-click and choose Format Shape to use the task pane.
Word Art consists of two components: the text and the Shape that contains the text. The Format Shape task pane has two headings (Shape Options and Text Options). The Ribbon controls in the Drawing Tools ![]() Format
Format ![]() Shape Styles group operate on the Shape that contains the text — not the text. To apply text formatting, use the controls in the Drawing Tools
Shape Styles group operate on the Shape that contains the text — not the text. To apply text formatting, use the controls in the Drawing Tools ![]() Format
Format ![]() WordArt Styles group. You can also use some of the standard formatting controls on the Home tab or the Mini toolbar.
WordArt Styles group. You can also use some of the standard formatting controls on the Home tab or the Mini toolbar.
Working with Other Graphics Types
Excel can import a variety of graphics into a worksheet. You have several choices:
· Inserting an image from your computer: If the graphics image that you want to insert is available in a file, you can easily import the file into your worksheet. Choose Insert ![]() Illustrations
Illustrations ![]() Pictures. The Insert Picture dialog box appears, allowing you to browse for the file. Oddly, you can't drag and drop an image into a worksheet, but you can drag an image from your web browser and drop it into a worksheet.
Pictures. The Insert Picture dialog box appears, allowing you to browse for the file. Oddly, you can't drag and drop an image into a worksheet, but you can drag an image from your web browser and drop it into a worksheet.
· Inserting an image from an online source: Choose Insert ![]() Illustrations
Illustrations ![]() Online Pictures. The Insert Pictures window appears, allowing you to search for an image. Figure 23.11 shows the results of an image search.
Online Pictures. The Insert Pictures window appears, allowing you to search for an image. Figure 23.11 shows the results of an image search.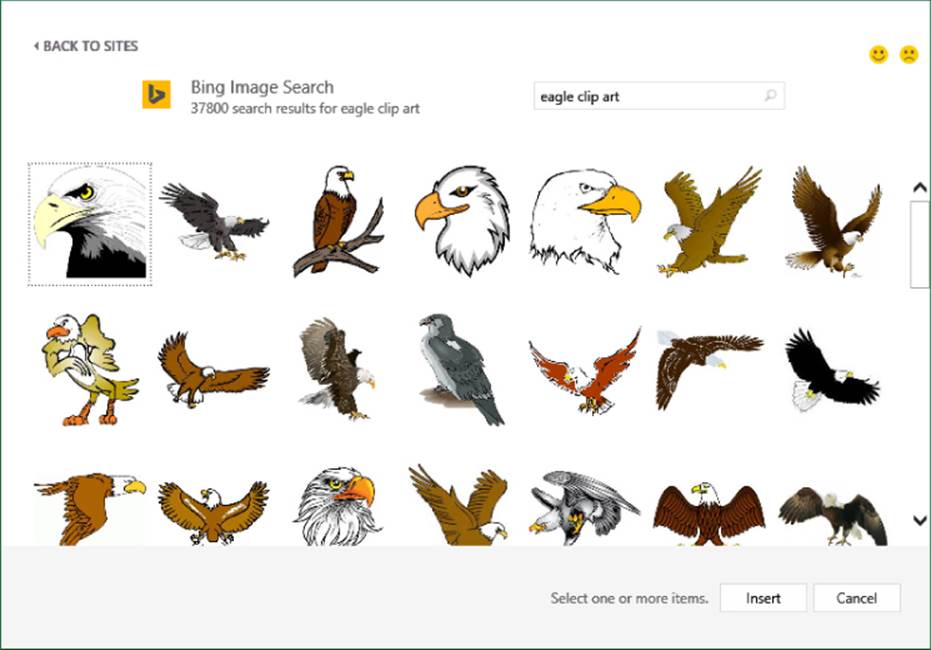
Figure 23.11 Use the Insert Pictures window to search for images online.
· Copying and pasting: If an image is on the Windows Clipboard, you can paste it into a worksheet by choosing Home ![]() Clipboard
Clipboard ![]() Paste (or by pressing Ctrl+V).
Paste (or by pressing Ctrl+V).
About graphics files
Graphics files come in two main categories:
· Bitmap: Bitmap images are made up of discrete dots. They usually look pretty good at their original size but often lose clarity if you increase the size. Examples of common bitmap file formats include BMP, PNG, JPEG, TIFF, and GIF.
· Vector: Vector-based images, on the other hand, are comprised of points and paths that are represented by mathematical equations, so they retain their crispness regardless of their size. Examples of common vector file formats include CGM, WMF, and EPS.
You can find millions of graphics files free for the taking on the Internet. Be aware, however, that some graphics files have copyright restrictions.
Caution
Using bitmap graphics in a worksheet can dramatically increase the size of your workbook.
When you insert a picture on a worksheet, you can modify the picture in a number of ways from the Picture Tools ![]() Format contextual tab, which becomes available when you select a picture object. For example, you can adjust the color, contrast, and brightness. In addition, you can add borders, shadows, reflections, and so on — similar to the operations available for Shapes.
Format contextual tab, which becomes available when you select a picture object. For example, you can adjust the color, contrast, and brightness. In addition, you can add borders, shadows, reflections, and so on — similar to the operations available for Shapes.
And don't overlook the Picture Tools ![]() Format
Format ![]() Picture Styles group. These commands can transform your image in some interesting ways. Figure 23.12 shows various styles for a picture.
Picture Styles group. These commands can transform your image in some interesting ways. Figure 23.12 shows various styles for a picture.
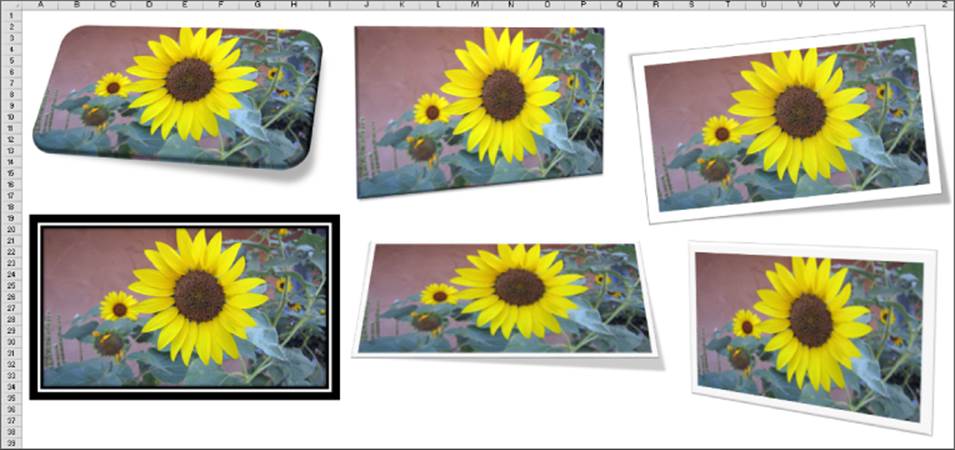
Figure 23.12 Displaying a picture in a number of different styles.
In addition, you can right-click and choose Format Picture to use the controls in the Format Picture task pane.
An interesting feature is Artistic Effects. This command can apply a number of Photoshop-like effects to an image. To access this feature, select an image and choose Picture Tools ![]() Format
Format ![]() Adjust
Adjust ![]() Artistic Effects. Each effect is somewhat customizable, so if you're not happy with the default effect, try adjusting some options.
Artistic Effects. Each effect is somewhat customizable, so if you're not happy with the default effect, try adjusting some options.
You might be surprised by some of the image enhancements that are available — including the ability to remove the background from photos. The best way to learn these features is to dig in and experiment. Even if you have no need for image enhancement, you might find that it's a fun diversion when you need a break from working with numbers.
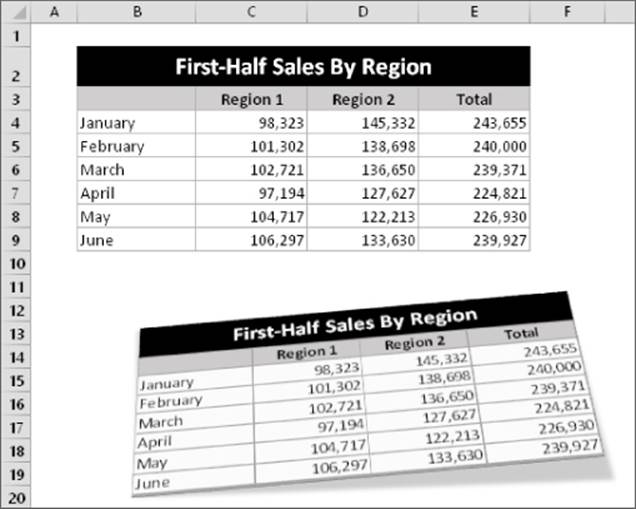
Taking Linked Pictures of Ranges
One of Excel's best-kept secrets is its ability to copy and paste “live” pictures of cells and charts. You can copy a cell or range and then paste a picture (as an object) of the cell or range on any worksheet or chart. If you change the contents of a cell that's in a picture, the picture changes. The accompanying image shows a picture of a range after applying some picture effects. For best results, apply a fill color of white to all cells that don't have a specific fill color.
To “take a picture” of a range, follow these steps:
1. Select the range.
2. Press Ctrl+C to copy the range.
3. Activate another cell.
4. Choose Home ![]() Clipboard
Clipboard ![]() Paste
Paste ![]() Linked Picture (I).
Linked Picture (I).
The result is a live picture of the range you selected in step 1.
If you use this feature frequently, you can save some time by adding the Excel Camera tool to your Quick Access toolbar:
1. Right-click the Quick Access toolbar and choose Customize Quick Access Toolbar from the shortcut menu that appears. The Excel Options dialog box appears, with the Quick Access Toolbar tab selected.
2. Select Command Not in the Ribbon from the drop-down list on the left.
3. Select Camera from the list and click Add.
4. Click OK to close the Excel Options dialog box.
After you add the Camera tool to your Quick Access toolbar, you can select a range of cells and click the Camera tool to take a “picture” of the range. Then click in the worksheet, and Excel places a live picture of the selected range on the worksheet's draw layer. If you make changes to the original ranges, the changes are shown in the picture of the range.
Inserting screenshots
Excel can also capture and insert a screenshot of any program currently running on your computer (including another Excel window). To use the screenshot feature, follow these steps:
1. Make sure that the window you want to use displays the content you want.
2. Choose Insert ![]() Illustrations
Illustrations ![]() Screenshot. You'll see a gallery that contains thumbnails of all windows open on your computer (except the current Excel window).
Screenshot. You'll see a gallery that contains thumbnails of all windows open on your computer (except the current Excel window).
3. Click the image you want. Excel inserts it into your worksheet.
You can use any of the normal picture tools to work with screenshots.
If you don't want to capture a complete window, choose Screen Clipping in step 2. Then click and drag your mouse to select the area of the screen to capture.
Displaying a worksheet background image
If you want to use a graphics image for a worksheet's background (similar to wallpaper on the Windows Desktop), choose Page Layout ![]() Page Setup
Page Setup ![]() Background and select a graphics file. The selected graphics file is tiled on the worksheet.
Background and select a graphics file. The selected graphics file is tiled on the worksheet.
Unfortunately, worksheet background images are for onscreen display only. These images do not appear when the worksheet is printed.
Using the Equation Editor
The final section in this chapter deals with the Equation Editor. Use this feature to insert a nicely formatted mathematical equation as a graphics object.
Figure 23.13 shows an example of an equation in a worksheet. Keep in mind that these equations do not perform calculations; they're for display purposes only.
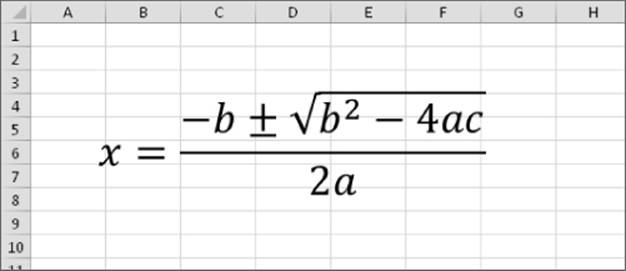
Figure 23.13 An equation created by the Equation Editor.
The best way to become familiar with the Equation Editor is to insert one of the premade equations. Choose Insert ![]() Symbols
Symbols ![]() Equation, and choose one of equations from the gallery. The equation is inserted into your worksheet.
Equation, and choose one of equations from the gallery. The equation is inserted into your worksheet.
When you select an Equation object, you have access to two contextual tabs:
· Drawing Tools: Used to format the container object
· Equation Tools: Used to edit the equation
The Equation Tools ![]() Design tab contains three groups of controls:
Design tab contains three groups of controls:
· Tools: Used to insert a new equation or control how the equation is displayed. Click the dialog box launcher in the bottom-right corner of the Tools group to display the Equation Options dialog box, where you can specify the way the equation is copied and define keyboard shortcuts (click Math AutoCorrect).
· Symbols: Contains common mathematical symbols and operators that you can use in your equations.
· Structures: Contains templates for various structures that are used in equations.
Describing how to use the Equation tools is more difficult than actually using them. Generally, you add a structure and then edit the various parts by adding text or symbols. You can put structures inside of structures, and there is no limit to the complexity of the equations. It might be a bit tricky at first, but it doesn't take long before you understand how it works.
All materials on the site are licensed Creative Commons Attribution-Sharealike 3.0 Unported CC BY-SA 3.0 & GNU Free Documentation License (GFDL)
If you are the copyright holder of any material contained on our site and intend to remove it, please contact our site administrator for approval.
© 2016-2026 All site design rights belong to S.Y.A.