Microsoft Business Intelligence Tools for Excel Analysts (2014)
PART II: Leveraging SQL for Business Intelligence
Chapter 12: Understanding Reporting Services
In This Chapter
· Getting to know Reporting Services
· Building Reporting Services solutions
· Deploying reports
· Managing subscriptions
SQL Server Reporting Services (SSRS) is a robust, flexible, and fully capable enterprise-grade reporting tool. It’s important to understand that SSRS is a reporting tool — not a dashboarding tool. Dashboarding refers to interactive analytics applications delivered over the Web to your desktop, tablet, or smartphone that allow you to slice and dice predefined data views that represent your most important metrics. Reporting, on the other hand, indicates a somewhat static presentation of the data with some parameterized options and minimal navigation functionality between reports. Reporting functionality is geared toward mass consumption in the form of e-mail subscriptions or an on-demand, browser-based review of the data.
This chapter gives you a high-level overview of SSRS and provides a solid understanding of what SSRS can do for you.
Reporting Services Overview
You may find it difficult to comprehend why you should make the leap from Excel reporting to the unfamiliar world of SSRS. The truth is that SSRS has several strengths and advantages that you should consider:
· Easier build-out of automated SQL reporting: Because SSRS is closely integrated into the SQL Server environment, you can build automated reporting mechanisms much easier than you can with Excel. Native links between SSRS and SQL Server bypass the need for the management of external data connections, or any sort of VBA scripting. SSRS allows for the automated processing of stored procedures. This gives your clients the most up-to-date reporting data with on-demand report execution.
· No need for SharePoint and Excel services: SSRS reports don’t require the extra layers of SharePoint server and Excel services. Requiring only a basic SQL Server environment, organizations can build and distribute robust reporting mechanisms without the additional cost of SharePoint.
· No need to install Silverlight: Power Pivot and Power View both require your clients to install Silverlight (Microsoft’s version of Flash) to run properly. SSRS has no such requirement.
· Implementation of dynamic filtering: Although query filtering can be achieved with Excel data connections, passing dynamic filters takes additional effort in the way of VBA scripting. And because VBA can’t be utilized on SharePoint, any Excel report using dynamic filters can’t be published to the Web. As a result, most Excel reporting mechanisms extract huge blocks of data from SQL Server databases in order to ensure all the data that will possibly be needed is included. SSRS reports, on the other hand, run in the SQL Server environment where dynamic filtering is supported. This allows your published reports to run faster because they can pull only the data requested by changing filters on the fly.
· Built-in user authentication: SSRS reports can piggy-back on SQL Server’s user logins and database roles. This effectively lets you leverage SQL Server authentication to better manage who can see which reports.
· Ability to export to multiple file formats: SharePoint and Excel services allow you to export reports only to Excel. SSRS provides multiple export options, including PDF, Excel, CSV, and Text File.
Reporting Services includes four major components: server, development environment, database repository, and Web portal. Each component plays a part in delivering SSRS solutions.
· Server component: The SSRS server component is the central engine behind the reporting service. Your database administrator typically performs the configuration of the SSRS server component. Most IT departments already have SSRS up and running. You just have to ask for the rights to build and publish SSRS reports.
· Development environment: SSRS solutions and reports are developed using the SQL Server Business Intelligence Development Studio, which is part of the Microsoft Visual Studio environment. This tool allows you to develop business intelligence applications including SSRS. You need to ask your IT department about installing Microsoft Visual Studio environment.
· Database repository: SSRS requires an SQL Server instance in order to create the service repository. The repository contains the metadata required to store all the reports and subscription details. The SSRS database repository is named ReportServer by default. Most IT departments running SSRS don’t change this name. However, you’ll want to confirm the name of the SSRS database with your own IT department.
· Web portal: SSRS includes a Web portal, which allows you to view reports and manage subscriptions. This portal is the primary user interface for the tool, and it allows you to perform certain administrative functions such as organizing reports into folders, assigning permissions for viewing certain reports, and configuring subscriptions and settings.
Developing a Reporting Services Report
In this section, you explore the mechanics of developing a Reporting Services report from scratch. Follow these steps to start an SSRS project file, define a data source connection, and build a basic layout for your report:
1. Open SQL Server Business Intelligence Development Studio and choose File → New → Project.
2. In the New Project dialog box (see Figure 12-1), select Report Server Project from the list of Visual Studio installed templates, enter a name for your project, and then click OK.
Visual Studio creates a new SSRS project and opens the Solution Explorer, as shown in Figure 12-2. Here, you see three folders: Shared Data Sources, Shared Data Sets, and Reports.
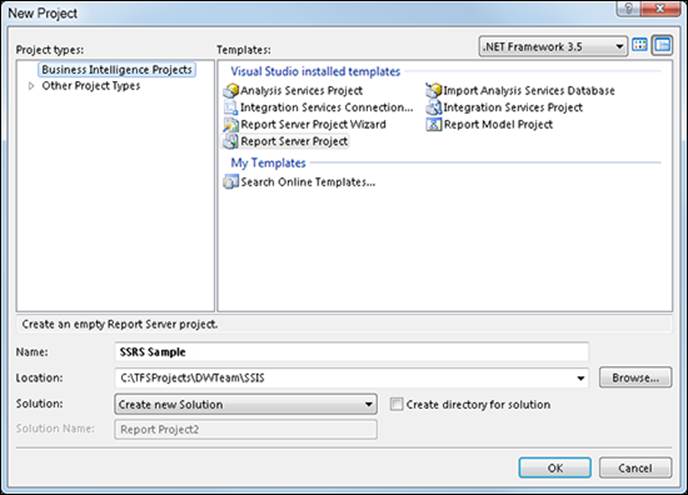
Figure 12-1: Open SQL Server Business Intelligence Development Studio and start a new Report Server Project.
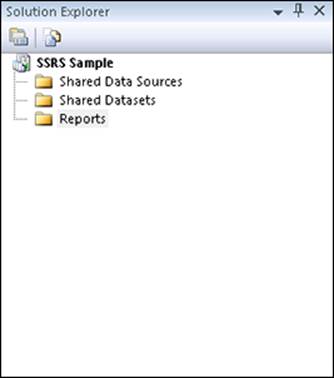
Figure 12-2: The Solution Explorer for your SSRS project.
3. Right-click the Reports folder in the Solution Explorer and choose Add New Report. When the Report Wizard opens, click Next.
The Select the Data Source screen of the wizard appears, as shown in Figure 12-3. Next you’ll define the connection to the SQL Server database you plan to use for sourcing the report data.
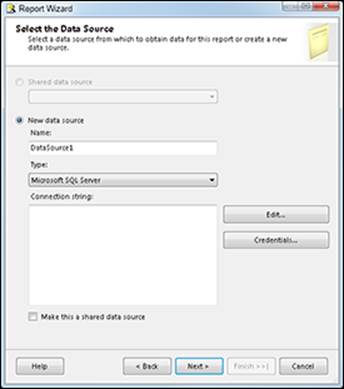
Figure 12-3: The Select the Data Source screen.
4. Select the New Data Source radio button, enter a name for your connection in the Name box, select Microsoft SQL Server from the Type drop-down list, and click Edit.
The Connection Properties dialog box shown in Figure 12-4 opens.
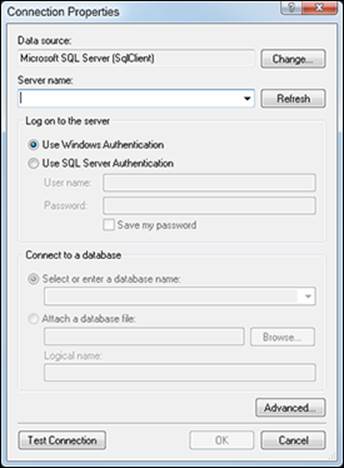
Figure 12-4: The Connection Properties dialog box.
5. Enter your server name in the Server Name box and select the database you're connecting to. Click OK when you’re done.
You’re taken back to the Select the Data Source screen. (Refer to Figure 12-3.)
6. Select the Make This a Shared Data Source check box and then click Next.
The Design the Query screen of the wizard appears. Here you can use the Query Builder to build the proper query for your report. (If you’re unfamiliar with Query Builder, see Chapter 9.)
7. Click the Query Builder button to open the Query Designer window.
8. In the Query Designer window (see Figure 12-5), choose the tables and views you want to add to your query and select the columns that will appear in the report.
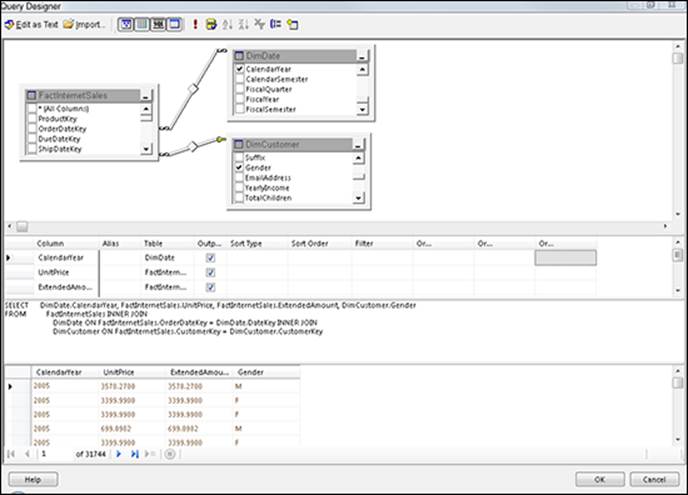
Figure 12-5: Use the Query Designer window to build the query to be used for your SSRS report.
9. Click OK when you're done designing your query. The Click Next in the Report Wizard.
The Select the Report Type screen of the wizard appears, as shown in Figure 12-6. This screen gives you two options for the layout of your report:
· Tabular produces a report that has columns only.
· Matrix builds a crosstab report that has rows and columns.
10. Choose the appropriate layout for your report and then click Next.
For this example, we selected the Matrix report type.
The Design the Matrix screen of the wizard appears, as shown in Figure 12-7.
11. Move the desired fields from the Available fields list box to the Columns, Rows, and Details list boxes. Click Next.
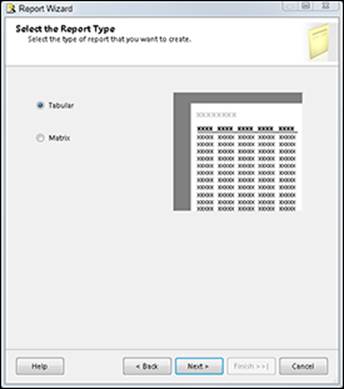
Figure 12-6: The Select the Report Type screen.
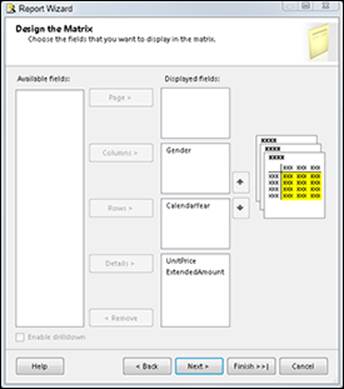
Figure 12-7: The Design the Matrix screen.
12. In the Choose the Matrix Style screen of the wizard (see Figure 12-8), select the style theme for your report and then click Next.
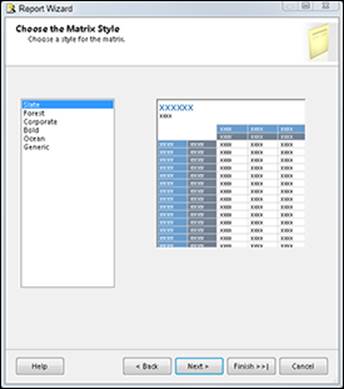
Figure 12-8: The Choose the Matrix Style screen.
13. Check the summary of your configurations and enter a name for your report and click the Finish button.
Upon completion, you’re taken to your SSRS project, where you see a Design tab, as shown in Figure 12-9.
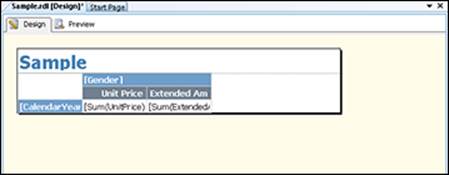
Figure 12-9: The Report Design tab.
14. When you’re happy with the report design, click the Preview tab to see the final report outcome. (See Figure 12-10.)
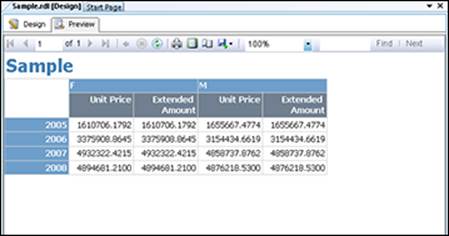
Figure 12-10: You can see a preview of your report by clicking the Preview tab.
The Report Preview window shows the report exactly as it will be presented on the client’s browser. You can keep modifying the report in the Design tab and switch to the Preview tab to see your changes in real time.
Defining a shared data source
In the previous section we showed you how to define the data source as a shared data source with the Report Wizard. When you define a data source as a shared data source, you’re essentially creating a template of sorts. This template contains all the information for connecting to the specified data source. Any new reports you create within your SSRS project can be pointed to that template (the shared data source).
This way, if you need to make any changes to your data source connection, you can simply make the change in the one shared data source. The change will take effect for all the reports in your project.
To create a new shared data source, follow these steps:
1. Right-click the Shared Data Sources folder in the Solution Explorer window and select Add New Data Source.
2. In the Shared Data Source Properties dialog box (see Figure 12-11), enter a descriptive name, select the type of connection you want, and then click Edit.
The Connection Properties dialog box opens. (Refer to Figure 12-4.)
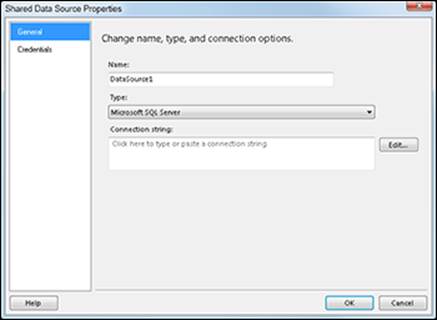
Figure 12-11: Shared Data Source Properties dialog box.
3. Enter the server name and select the database to connect to.
4. Click OK in the Connection Properties dialog box, and then click OK again in the Shared Data Source Properties dialog box.
The new source is now available under the Shared Data Sources folder in the Solution Explorer window.
Defining a shared dataset
Shared datasets are essentially queries that are defined once in your reporting solutions and used multiple times in the same report or different reports. Similar to shared data sources, a shared dataset can be thought of as a template of sorts that can be used in any new report you create in an SSRS project. Shared datasets come with a couple of advantages:
· Improved performance: Shared datasets can improve performance because they help avoid sending the same queries to the database multiple times. This can be accomplished by caching the dataset if necessary.
· Improved maintainability: Shared datasets are defined one time and used in different reports, so any changes required to the query for the dataset only needs to be changed one time.
To create a shared dataset, follow these steps:
1. Right-click the Shared Datasets folder in the Solution Explorer window and select Add New Dataset.
The Shared Dataset Properties dialog box opens, as shown in Figure 12-12.
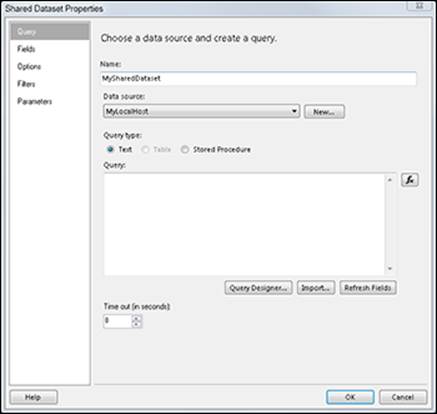
Figure 12-12: Shared Dataset Properties dialog box.
2. Select a query type: Text, Table, or Stored Procedure.
· Text: Allows you to build your own custom SQL statement to get the results you need
· Table: Allows you to point an existing table on the data source
· Stored Procedure: Allows you to use the results from an existing stored procedure
For this example, we selected Text.
3. Click the Query Designer button to build your query.
The Query Designer window opens. (Refer to Figure 12-5.)
![]() You can also enter the query for the dataset directly in the Query box (shown in Figure 12-12) to bypass the Query Designer.
You can also enter the query for the dataset directly in the Query box (shown in Figure 12-12) to bypass the Query Designer.
4. In the Query Designer window, choose the tables and views you want to add to your query and select the columns that will appear in the report. Click OK to close the Query Designer window.
5. Click OK in the Shared Dataset Properties dialog box to finalize your new dataset.
At this point, you can navigate to the Shared Datasets folder in the Solution Explorer to see your newly created shared dataset. (See Figure 12-13.)
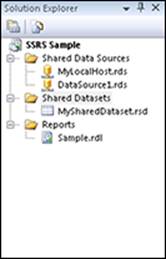
Figure 12-13: A new shared dataset in the Solution Explorer window.
Deploying Reports
Now that the development process of the report is done, you can publish the report to be accessed by your users. In this section, we show you how to start populating the Reporting Services portal with a report. After the report is deployed, you can send a link to the users and assign security access.
The deployment process
Report deployment is managed from SQL Server Business Development Intelligence Studio. Follow these steps:
1. Right-click the solution name and select Properties.
The Property Pages window opens, as shown in Figure 12-14.
![]() The Property Pages window is named for your specific solution. Figure 12-14 shows the SSRS Sample Property Pages window because our solution is named SSRS Sample.
The Property Pages window is named for your specific solution. Figure 12-14 shows the SSRS Sample Property Pages window because our solution is named SSRS Sample.
2. Configure the options for your project, including the following:
· TargetDatasetFolder: This folder holds the shared datasets. You typically want this to be different than the report folder, because only administrators have access to this folder.
· TargetDataSourceFolder: This folder holds the data sources. Again, you typically want this to be different than the report folder, because only administrators will have access to this folder.
· TargetReportFolder: This folder holds your published reports. You may have several folders and subfolders according to how you want to organize your reports. Organize reports by subject area so that you can grant each business function access to only their reports.
· TargetServerURL: This is the URL of the reporting server. The format is as follows: http://localhost/reportserver. Replace localhost with the exact server name. Replace reportserver with the name of the server location where you will publish your SSRS reports.
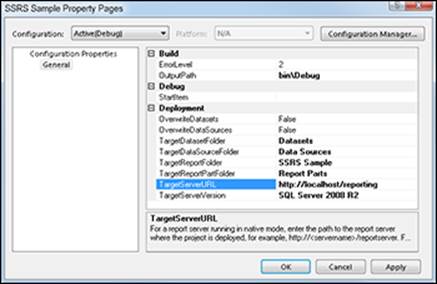
Figure 12-14: Property Pages window.
3. Click OK.
4. In the Solution Explorer window, right-click the name of your solution and select Deploy.
Your reports and data sources are deployed to the server.
You can open the Reporting Services administrative portal by entering the URL for your reporting services server into your favorite browser. In the Reporting Services portal, you can find your newly published report along with all your previously published reports and data sources. (See Figure 12-15.)
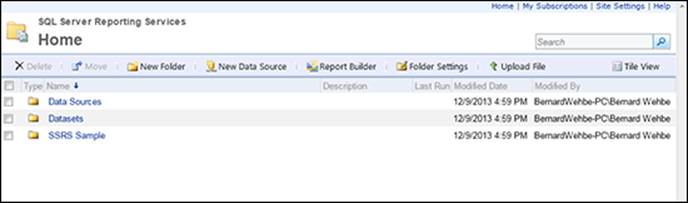
Figure 12-15: SSRS reports deployed to the portal.
Accessing reports
The report can now be accessed by your users. You have the option of allowing anyone in the organization to see your report or restricting access to a specific user or group. We discuss security in the next section. The users can see the report by clicking a URL that you send them. (See Figure 12-16.)
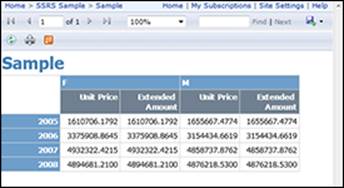
Figure 12-16: Accessing reports in the SSRS portal.
SSRS security
Securing your reports is an important step in the report deployment process. You want to be sure to comply with your organization’s security procedures and restrict report access to only those users who are supposed to see that information. The best approach is to set up Active Directory groups for the various business departments in your organization and give those groups access to the reports at the folder level.
To set up security at the folder level, follow these steps:
1. From the Home screen of the SSRS portal, select the folder you want to secure and click the Folder Settings button.
You are taken to the Security tab (see Figure 12-17).
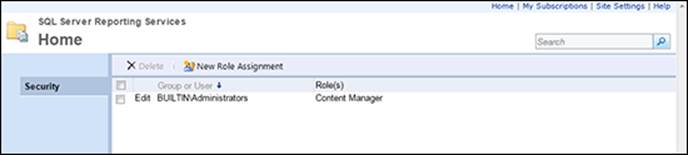
Figure 12-17: SSRS portal folder security.
2. Click the New Role Assignment button. Enter the user or group name in the input box at the top and select the role you want to assign the user. (See Figure 12-18.)
For example, if you want your business users to only be able to view reports, select the Browser check box.
3. Click OK.
You now see the new role you added on the Security tab.
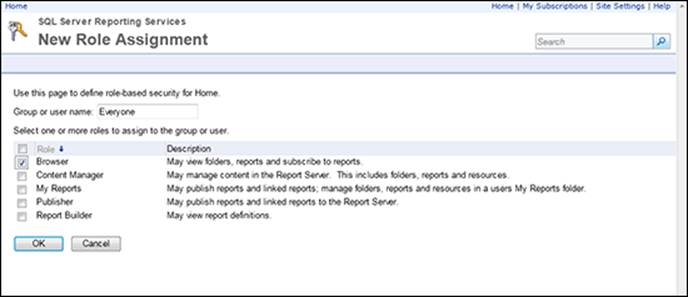
Figure 12-18: Add a role assignment.
Managing Subscriptions
Subscriptions, a powerful feature of SSRS, allow your users to receive any reports that you create via e-mail on a scheduled basis or whenever the underlying data in the report changes. In this section, we walk you through setting up the various types of subscriptions in the SSRS portal and highlight how you can take advantage of this feature.
Before activating subscriptions, you need to specify the credentials to use when the target report is run unattended. That is to say, when the report is automatically run from the system.
Follow these steps to store the credentials used to run the report:
1. Open the Reporting Services administrative portal by entering the URL for your reporting services server into your favorite browser.
2. Click the Data Sources folder and then click the data source for your report.
3. In the Properties window for the selected data source, select the radio button next to Credentials Stored Securely in the Report Server. (See Figure 12-19.)
4. Enter your username and password and select the Use As Windows Credentials When Connecting to the Data Source check box.
5. Click the Test Connection button to make sure you have access. When the test succeeds, click Apply to apply the changes.
After you’ve ensured that the credentials for the report have been stored, go to the report you want to subscribe to. Hover your mouse over the report and when the drop-down list appears, click Subscribe. (See Figure 12-20.)
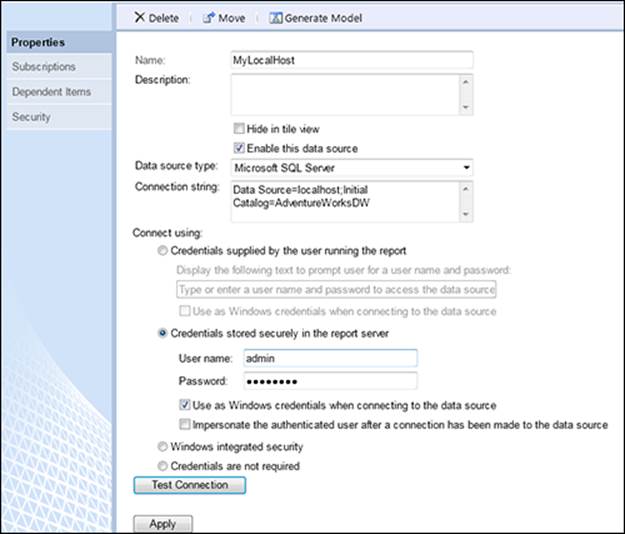
Figure 12-19: Configure the report data source to store credentials on the server.
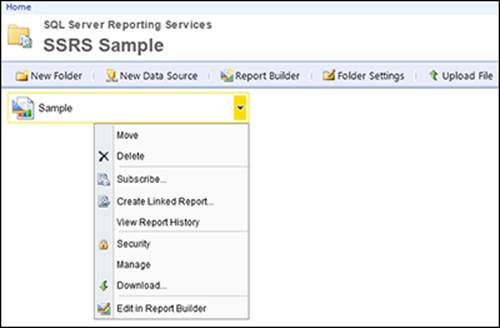
Figure 12-20: Select the Subscribe option.
The Subscription Settings window shown in Figure 12-21 appears. Here, you can apply the following subscription settings:
· Choose a delivery method. You can choose to have the report e-mailed do you. To enable e-mail delivery, you need to configure the E-Mail Settings in the Reporting Services Configuration Manager. Talk to your system administrator to get the e-mail information details required in this window. Alternatively, you can choose to have the report sent to a specified shared directory as archived PDF or Excel files.
· Define a schedule. Click the Select Schedule button in the Subscription window to see several options for setting up a schedule. These options are similar to those you see in an Outlook calendar appointment. Set the schedule you would like for receiving the report and then click OK.
· Set parameters for subscriptions. If your report has parameters, you can specify a value for these parameters in the Subscription window. Parameters allow you more control over what each subscription receives. Using the feature, you can build the report once and use it for different subscriptions by specifying the parameter value for each.
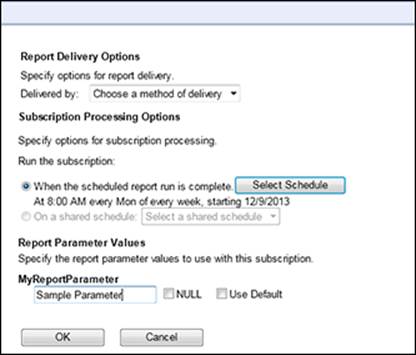
Figure 12-21: The Subscription Settings window.
 Reporting Services best practices
As we round out this chapter on Reporting Services, it’s worth taking a moment to review some best practices you can follow to ensure successful reporting adoption:
· Keep it simple. Complexity is the enemy of user adoption when it comes to information. Always keep your reports simple and easy to understand.
· Include standard metadata. Be sure to include metadata and methodology definition in your reports. The best approach is to drive your metadata off a central repository that allows you to define your metrics and attributes once and then reuse them on different reports.
· Include detailed data to back up your graphs. Sometimes using graphs makes it easier to spot trends and anomalies; however, most people need the underlying data for further analysis and confirmation. Make it a habit to give users access to graph data in a tabular format to avoid confusion and to increase user adoption.
· Take advantage of advanced formatting. SSRS has several advanced formatting options, including multi-axis support for graphs and exception highlighting. Be sure to explore these advanced options and take advantage of them to make your reporting more relevant to users’ business needs.
· Keep text and formatting consistent. One of the main turnoffs for users is inconsistency with how terms and definitions are presented, as well as an inconsistent approach to building reports. Make sure you adopt strict standards when it comes to building your reports so that they all have the same look and feel even if they’re built by different developers.
All materials on the site are licensed Creative Commons Attribution-Sharealike 3.0 Unported CC BY-SA 3.0 & GNU Free Documentation License (GFDL)
If you are the copyright holder of any material contained on our site and intend to remove it, please contact our site administrator for approval.
© 2016-2026 All site design rights belong to S.Y.A.