Microsoft Business Intelligence Tools for Excel Analysts (2014)
PART II: Leveraging SQL for Business Intelligence
Chapter 14: Using the Data Mining Add-In for Microsoft Office
In This Chapter
· Installing the Data Mining Add-In
· Leveraging the Data Mining Table Analysis Tools
The Data Mining Add-In for Microsoft Office provides you with a way to leverage the power of Analysis Services from within the familiar Excel interface. With the Data Mining Add-In, you can utilize powerful SQL Server Analysis algorithms to find data patterns, uncover hidden relationships, develop data-based predictions, and perform many more complex analyses.
In this chapter, you discover some of the ways you can use this robust analysis tool to develop analytics and reporting that would have been previously impossible with vanilla Excel.
Installing and Activating the Data Mining Add-In
Open Excel and look for a Data Mining tab on the Ribbon. If you see one, the Data Mining Add-In is already activated. If you don’t see the tab, you have to download and install it yourself.
Downloading the Data Mining Add-In
Type Excel Data Mining Add-In in your favorite search engine to find the free installation package. Note that Microsoft offers versions for SQL Server 2008 and SQL Server 2012. Be sure to download the version that matches the version of SQL Server your organization is using.
After it is installed, follow these steps to activate the add-in:
1. Choose File → Options.
2. Select the Add-Ins option on the left, and select COM Add-Ins from the Manage drop-down menu. Click Go.
3. Select SQLServer.DMClientXLAddIn and SQLServer.DMXLAddIn in the list of available COM Add-Ins. Click OK.
4. Close and restart Excel.
Pointing to an Analysis Services database
Upon restarting Excel, you're automatically walked through a wizard to connect your newly installed Data Mining Add-In to an Analysis Services database (see Figure 14-1). The Data Mining Add-In requires an existing 2008 (or later) Analysis Services database to serve as the engine for processing the analyses you eventually perform with it.
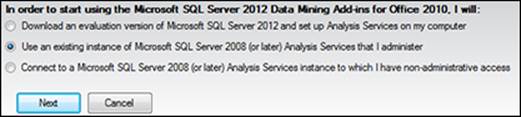
Figure 14-1: The Data Mining Add-In requires a connection to an Analysis Services database instance.
Select the appropriate option and follow the instructions in the setup wizard.
![]() If you inadvertently close the setup wizard, or if you need to point to a different Analysis Services database, you can open the setup wizard by choosing Help → Getting Started on the Data Mining tab.
If you inadvertently close the setup wizard, or if you need to point to a different Analysis Services database, you can open the setup wizard by choosing Help → Getting Started on the Data Mining tab.
 Starting with the sample workbook
A good way to start using the Data Mining Add-In is to practice using the sample workbook that installs with it. The DMAddins_SampleData workbook is used for all the examples in this chapter. Assuming you have installed the Data Mining Add-In on your PC, this workbook is usually located here: C:\Program Files\Microsoft SQL Server 2012 DM Add-Ins\DMAddins_SampleData.xlsx.
The full breadth of functionality that comes with the Data Mining Add-In is staggering. There are many features of the add-in you will likely never touch. Instead of focusing on all aspects of the Data Mining Add-In, the remainder of this chapter discusses the features found in the Data Mining Table Analysis Tools.
The Table Analysis Tools is an ideal set of analytical features if you aren’t a data mining expert, but you need to perform complex pattern recognition and predictive analytics.
![]() It’s important to note that you can use data from almost any source with the Data Mining Add-In. The data does not have to come from SQL Analysis Services. That being said, to use the Table Analysis Tools, you need to convert your data ranges to named Excel tables. Click anywhere inside your data range and press Ctrl+T. In the Create Table dialog box, ensure that the range for the table is correct and then click OK.
It’s important to note that you can use data from almost any source with the Data Mining Add-In. The data does not have to come from SQL Analysis Services. That being said, to use the Table Analysis Tools, you need to convert your data ranges to named Excel tables. Click anywhere inside your data range and press Ctrl+T. In the Create Table dialog box, ensure that the range for the table is correct and then click OK.
Click anywhere inside your named Excel table to see the Table Tools on the Analyze tab (see Figure 14-2).
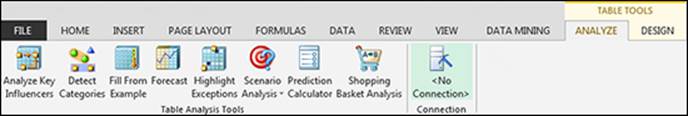
Figure 14-2: Click inside any defined Excel table to see the Table Analysis Tools on the Analyze tab.
· Analyze Key Influencers: Automatically detect relationships between columns in your input data so that you can understand which factors tend to influence other factors.
· Detect Categories: Find common characteristics that tend to form clusters within your input data.
· Fill From Example: Use expert knowledge about underlying data to fill in a few examples, which can be extrapolated by Analysis Services into a pattern to be applied to all of the rows in the input dataset.
· Forecast: Use a time series algorithm to predict future outcomes based on historical data.
· Highlight Exceptions: Relying on the same underlying method that is used to build categories, exceptions in your input data can be highlighted to call out erroneous or outlier data points that may need to be filtered out of analyses.
· Scenario Analysis: Play out goal-seeking or what-if modeling scenarios with your input data to optimize decision-making.
· Prediction Calculator: Decide whether to proceed with an action that assumes predictive accuracy by using input data to build a predictive model along with cost and profit inputs, which can be arbitrarily assigned.
· Shopping Basket Analysis: Identify which products tend to be purchased in combination with other products and what the relative amounts of different product bundles spell out from a profitability standpoint.
To work through the tools in the following sections, open the DMAddins_SampleData.xlsx sample workbook. Find the Table Analysis Tools Sample worksheet and select the Excel table. You're ready to use the Table Analysis Tools. This table contains demographic data for individuals and a column indicating whether those individuals purchased a bike (see Figure 14-3).
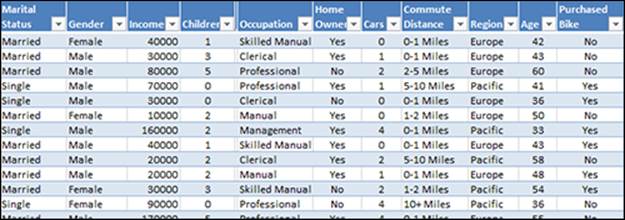
Figure 14-3: This dataset contains demographic data for a bike company.
Analyze Key Influencers
Generally speaking, a dataset is defined by its “structure” (cells, rows, columns) as well as its relationships with other datasets. But there is another way to think of a defined dataset, and that is the patterns that can be discovered in the data itself, irrespective of the data’s structure. A simple example of a data pattern can be shown in the following two number sequences:
· Sequence 1: {0, 1, 2, 3, 4}
· Sequence 2: {2687, 2696, 2589, 694, 466}
In these two sequences, a pattern can easily be discerned in which the values of Sequence 2 seem to be influenced by the values in Sequence 1 (the higher the value from Sequence 1, the lower the value in Sequence 2). Our brains are relatively good at detecting simple patterns, but more complex patterns and/or larger datasets require CPU power. The Analyze Key Influencers Table Analysis tool does exactly this.
When you use the Analyze Key Influencers tool, a lot of complex work is happening behind the scenes:
1. A temporary mining structure is created on the Analysis Services instance to hold the data in the table that is being analyzed.
2. Using the Microsoft Naïve Bayes algorithm, a mining model is generated that allows each column to be scored in terms of predicting the target column.
3. The results of this scoring process are inserted into a new report, which is added to a new worksheet automatically. Optionally, other reports can be added that further analyze any combination of target column with one input column.
Suppose you want to determine which of the demographic factors are key influencers in any one individual’s decision to buy a bike or not. Click the Analyze Key Influencers button on the Analyze tab.
In the Analyze Key Influencers window (see Figure 14-4), select the Purchased Bike column as the column to analyze for key factors and click Run.
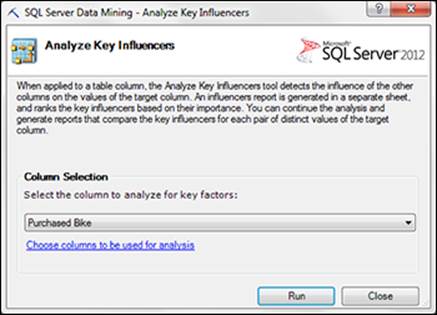
Figure 14-4: Select the column to use as the basis for evaluating key factors.
You get a similar report to the one shown in Figure 14-5.
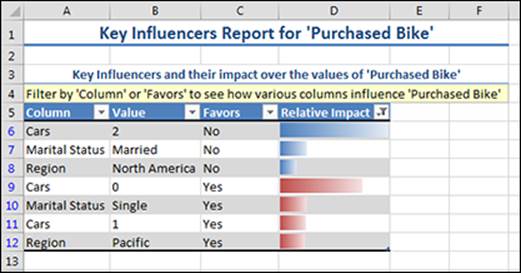
Figure 14-5: Results of the Key Influencers report.
The Key Influencers report shows each demographic data point that is likely to influence the purchase of a bike. In this case, the report tells you that cases where 0 cars are owned seems to be the key driver for bike purchases (see where there is a “Yes” in the Favors column). Conversely, cases where 2 cars are owned seems to be a likely indicator that a bike will not be purchased (see where there is a “No” in the Favors column). Following the values from top to bottom of the report, you can clearly see no cars or few cars owned lead to a higher likelihood of bike purchase.
Detect Categories
Another form of pattern recognition that can occur on a dataset is groupings of data based on like characteristics. A simple example of this would be the Detect Categories tool.
Use the Detect Categories tool to categorize records in a dataset based on the attributes of each record. Breaking the data into categories enables you to quickly identify the natural groupings in your data.
For example, if you want to create distinct lead lists from a larger dataset, you can use the Detect Categories tool to help understand the characteristics of your data and possibly identify the most appropriate way to parse your larger dataset into smaller lists for targeted marketing campaigns.
To see the Detect Categories tool in action, click the Detect Categories button on the Analyze tab. In the Detect Categories dialog box, select the columns you want to evaluate to create your distinct categories and click the Run button.
You get a report similar to the one shown in Figure 14-6.
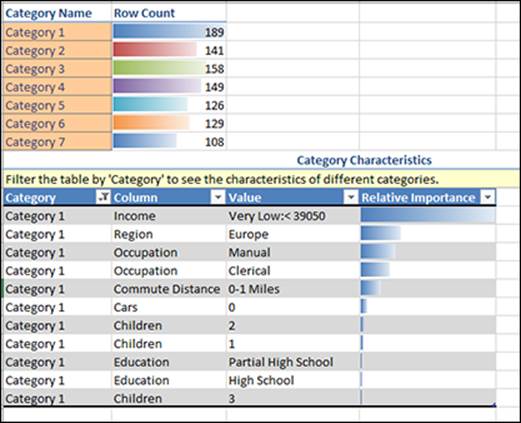
Figure 14-6: Results of the Detect Categories report.
After the Detect Categories tool runs, you get a report that tells you how many categories were identified, gives each category a name (Category Name) and tells you how many rows/records are included in each category (Row Count). The report also displays a Category Characteristics section that contains the attribute details of each category.
In the result set shown in Figure 14-6, the Detect Categories tool found seven distinct categories. Category 1 contains the most records. The primary attribute of Category 1 is the Income column. This means that having an annual income of less than $39,050 was the most important driver for this particular category. If you were creating lead lists, Category 1 could be a list targeting low-income customers.
Fill From Example
The Fill From Example tool automatically fills in missing data in a specified column for all rows in the selected table, based on detected patterns in a set of samples you provide, and applies those to the remaining missing values.
Figure 14-7 shows a table where the High Value Customer column is blank for most records. The first ten rows of this column are filled with sample values. Based on the sample values, the Fill From Example tool detects patterns that relate the other column values to the sample information we added to the High Value Customer column, then extends those patterns to all the remaining rows.
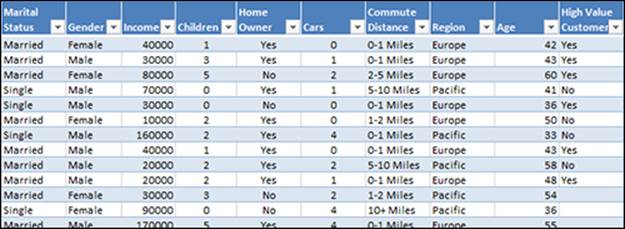
Figure 14-7: Start with a column (High Value Customer, in this case) that contains a handful of sample values.
Click the Fill From Example button on the Analyze tab. In the Fill From Example dialog box, select the column you want to use as both sample input and interpolation for filling in values (in this example, the High Value Customer column). Click the Run button and you get a report similar to the one shown in Figure 14-8.
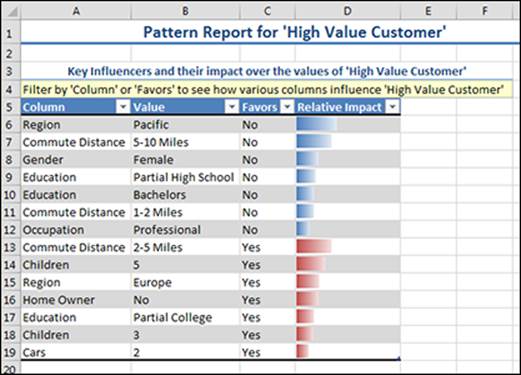
Figure 14-8: Results of the Fill From Example report.
The output is a Pattern Report (see Figure 14-8), which shows column and value states as they relate to the sample values column (High Value Customer). This report orders value states by relative impact. It’s useful to consider the results by each factor; for example, by considering the favors “Yes” states separately from the favors “No” states. A quick glance shows you that customers located in Europe with relatively short commute distances (2-5 miles) favors a high value customer status, while for customers in the Pacific, higher commute distances (5-10 miles) or very short commute distances (1-2 miles) do not favor high value customer status. Other factors can quickly be identified.
Forecast
The Forecast tool is similar to the Fill From Example tool, but with two important distinctions:
· The Forecast tool assumes a time-oriented dataset. The time column could be time of day, date, or a combination of the two (date + time). Why does it matter that one of the columns is specifically a date/time value? Because the underlying algorithm, Microsoft Time Series, is based on a time-ordered dataset.
· Where the Fill From Example tool fills in missing values for a single column based on relationships detected with other input columns (column-based pattern), the Forecast tool fills in missing rows for multiple columns based on relationships detected in other rows (row-based pattern).
Following is a list of prerequisites for using the Forecast tool:
· One of the columns must be time-oriented or a unique ordered set of numbers (which could substitute for an actual time/date column).
· The predictable column must be a continuous value. Bear in mind you will not be predicting values for the time/date column.
· Before the model is generated, you can provide a hint to specify that your time-oriented data has a cyclical pattern, as would be the case for monthly sales, for example.
The Forecast tool helps you make predictions based on data in an Excel data table or other data source, and optionally view the probabilities associated with each predicted value. For example, if your data contains a date column and a column that shows total sales for each day of the month, you could predict the sales for future days. You can also specify the number of predictions to make. For example, you can predict five days, or thirty.
To see the Forecast tool in action, click the Forecast button on the Analyze tab. In the Forecast dialog box, shown in Figure 14-9, identify the following inputs: Columns to be forecast, Number of time units to forecast, Time stamp (optional), and Periodicity of data (optional). Click the Run button and you get a report similar to the one shown in Figure 14-10.
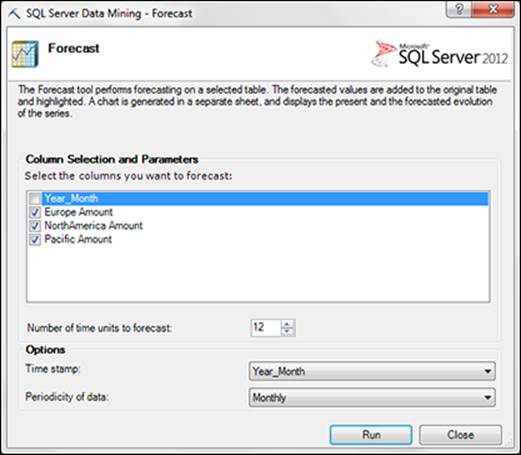
Figure 14-9: Configure the Forecast dialog box as needed.
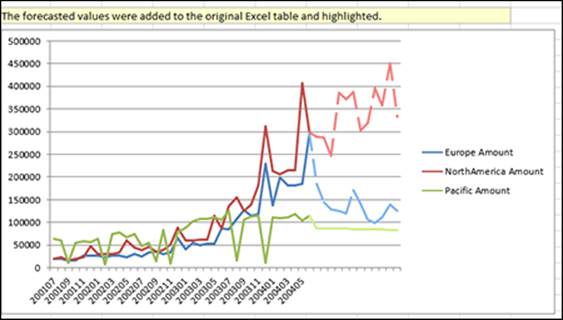
Figure 14-10: Results of the Forecast report.
When the tool completes, it appends the new predictions to the end of the source data table and highlights the new values. The tool also creates a new worksheet named Forecasting Report. This worksheet reports whether the wizard successfully created a prediction. The new worksheet also contains a line graph that shows the historical trends along with the predicted values that were added. The historical values are shown as a solid line and the predictions are shown as a dotted line.
Highlight Exceptions
Because “garbage in = garbage out” applies to data mining as much as with any data-oriented process, a specific tool has been provided to help identify the garbage or outliers in your data. This is the Highlight Exceptions tool, which relies on the Microsoft Clustering algorithm to identify rows with similar characteristics.
The Highlight Exceptions tool analyzes and highlights data rows that do not appear to match the general patterns found in the rest of the table. This not only highlights exception rows, it also highlights the specific column value in each row that is likely to be the cause of the exception.
To see the Highlight Exceptions tool in action, click the Highlight Exceptions button on the Analyze tab. In the Highlight Exceptions dialog box, select the columns you want to evaluate to create your distinct categories and click the Run button. You get a report similar to the one shown in Figure 14-11.
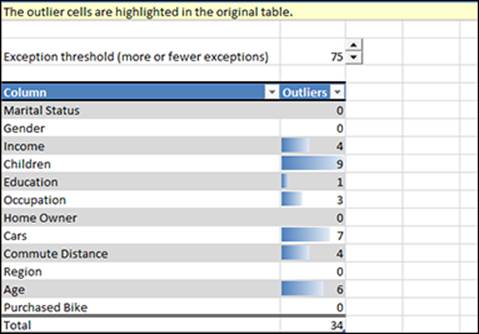
Figure 14-11: Results of the Highlight Exceptions report.
This report provides a threshold that shows 75 exceptions by default (you can change the threshold; the rows in the actual input table will be correspondingly highlighted). The data table shows you two columns, one for each input column where outliers were detected and another showing the number of outliers that were detected. In this report, you can see that there are 9 outliers for the Children input column. If you want to see which values actually constitute these outliers, you can go back to the source table and find them — they're highlighted.
![]() There is no simple way to isolate the outlier values in the input dataset other than sorting the columns (in the event that outliers are at the beginning or end of the value range) or scrolling through the dataset to find the highlighted outliers. For this reason, the Highlight Exceptions tool is not practical for large datasets.
There is no simple way to isolate the outlier values in the input dataset other than sorting the columns (in the event that outliers are at the beginning or end of the value range) or scrolling through the dataset to find the highlighted outliers. For this reason, the Highlight Exceptions tool is not practical for large datasets.
Scenario Analysis
A common data analysis scenario is understanding the impact to other columns given a hypothetical value (or set of values) in an input column that is designated as a target column. The Scenario Analysis tool does exactly this, but it is actually two different tools: Goal Seek Scenario and What-If Scenario.
Using the Goal Seek Scenario tool
The Goal Seek Scenario tool provides the following input options:
· Target: This is where you select the column that will contain the target values of your goal-seeking scenario. After you select the column, you must specify your target value(s) using one of the following input options:
· Exactly: Enter a number that specifies a target value for your target column.
· Percentage: Enter a number that will translate into a multiplier of the target column. For example, entering 120 would indicate that your target values should be 120 percent of the input values (or 20 percent higher).
· In Range: Enter a low and high value that will constitute a range where your target values should lie.
· What to Change: Select the column to change to achieve the target value specified in the Target input.
The Goal Seek Scenario tool provides useful recommendations when you know the desired value for a column of the current row (the Target column) and need to know how to change another column (the Change column) to reach that desired value. The recommendations are based on the patterns and rules detected in your table.
![]() In order to use the Goal Seek Scenario tool, your source table must contain at least 50 rows of data.
In order to use the Goal Seek Scenario tool, your source table must contain at least 50 rows of data.
In the example shown in Figure 14-12, the Goal Seek Scenario tool determines how many LevelTwoOperators are needed to reduce the ServiceGrade score to between 0 and .05.
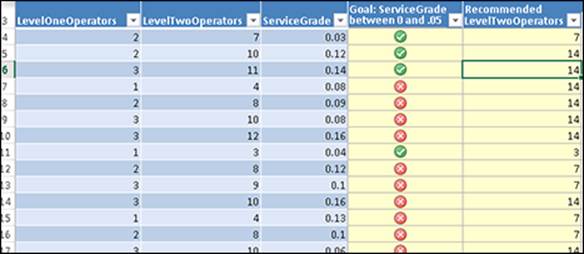
Figure 14-12: Results of the Goal Seek Scenario tool.
When the Goal Seek Scenario tool is run, two new columns are added to the source table: Goal (plus the goal name) and Recommended (plus the changeable column). The goal column shows a simple Yes/No response in the form of red and green status flags, with a green flag indicating the goal is achievable and the red flag indicating it is not. The recommended column provides a specific value that would be required for the input column value in order to achieve the goal.
For example, row 6 is highlighted, showing an example where the ServiceGrade score is 14. Note that the LevelTwoOperators is 11. Goal Seek Scenario predicts that if you add 3 more level two operators for a total of 14, you can meet the ServiceGrade goal of between 0 and 5 percent.
![]() Another way to work with the Goal Seek Scenario tool is to run it for individual rows. Select the row that you want analyzed. Then when running the wizard, select the On This Row option instead of the Entire Table option. When running the tool in this fashion, results display in the message box along with a confidence rating (poor, fair, very good, and so on).
Another way to work with the Goal Seek Scenario tool is to run it for individual rows. Select the row that you want analyzed. Then when running the wizard, select the On This Row option instead of the Entire Table option. When running the tool in this fashion, results display in the message box along with a confidence rating (poor, fair, very good, and so on).
Using the What-If Scenario tool
The What-If Scenario tool provides the following input options:
· Change: This is where you select the column that will contain the target values of your what-if scenario. This must be a continuous column. After you select the column, you must specify your target value(s) using one of the following input options:
· To Value: Enter a number that specifies a target value for your target column.
· Percentage: Enter a number that will translate into a multiplier of the target column. For example, entering 120 would indicate that your target values should be 120 percent of the input values (or 20 percent higher).
· What Happens To: Select the column that will be impacted as a result of changing the values in the Change column.
· Specify Row or Table: Specify whether you want the what-if analysis to be applied to the entire table or the selected row.
![]() In order to use the What-If Scenario tool, your source table must contain at least 50 rows of data.
In order to use the What-If Scenario tool, your source table must contain at least 50 rows of data.
In the example shown in Figure 14-13, the What-If Scenario tool determines how many LevelTwoOperators would be needed if you changed your AverageTime expectation to 70.
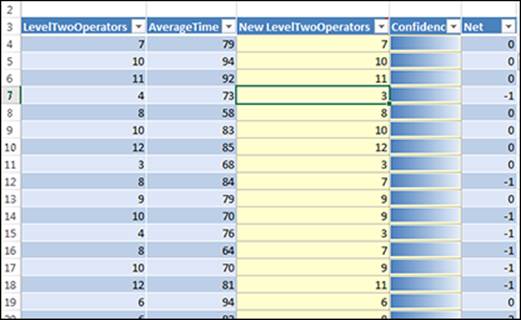
Figure 14-13: Results of the What-If Scenario tool.
As you can see, two new columns are added to the input spreadsheet: New (plus the adjustable column name) and Confidence. The New column shows the value that would be needed in order to fulfill the AverageTime goal of 70.
If you look at row 7, you’ll see that the actual LevelTwoOperators was 4 and the actual AverageTime was 73, which is 3 seconds above the target AverageTime of 70. In this case, the What-If Scenario tool suggests that removing one LevelTwoOperator (Net = -1) would still allow you to hit the goal of AverageTime of 70.
![]() Another way to work with the What-If Scenario tool is to run it for individual rows. Select the row that you want to analyze, then select the On This Row option instead of the Entire Table option in the wizard. When running the tool in this fashion, results display in the message box along with a confidence rating (poor, fair, very good, and so on). You can also select a different row while keeping the wizard open and run the analysis again.
Another way to work with the What-If Scenario tool is to run it for individual rows. Select the row that you want to analyze, then select the On This Row option instead of the Entire Table option in the wizard. When running the tool in this fashion, results display in the message box along with a confidence rating (poor, fair, very good, and so on). You can also select a different row while keeping the wizard open and run the analysis again.
Prediction Calculator
We’ve all heard the quote “You miss 100 percent of the shots you don’t take.” It’s easy to understand that this quote refers to the need to take risks in order to realize gains, but in realistic situations this is an oversimplification because generally speaking, the goal is to take those shots that you predict will lead to a profitable outcome while avoiding those shots that may lead to a loss. But what about the shots that you “should have” taken because they “would have” resulted in a gain? These missed opportunities, called false negatives in the Prediction Calculator, can be thought of as conditional or alternative outcomes and represent one of the four possible gain and loss categories to be considered when calculating the profitability of predicted scenarios. The other three — true positives, true negatives, and false positives — are discussed in this section. Using the Prediction Calculator Data Mining Add-In tool, this section discusses an approach for calculating prediction outcomes in the context of these four possible outcomes.
The Prediction Calculator tool allows you to use prior knowledge in the form of a table to ask the question: Should I take this shot? The answer to this Yes/No present-tense question is based not only on the statistical relationships in your input table containing historical data, but also the four gain/cost factors you provide. The result is a profit threshold that is either reached or not reached, leading to a go or no-go decision at the individual case level.
The underlying assumption behind the Prediction Calculator is that your input table has historical data points that fit into a regression model that holds the relationships between input columns (and their possible states) with a target predictable column. With this historical-based model, you can use the columns and states, such as HomeOwner = Yes, and predict the likelihood of obtaining a desired outcome state, such as Bike Buyer = Yes. When using the Prediction Calculator, the underlying algorithm is Microsoft Logistic Regression, which can handle both discrete data types (like Yes/No) and continuous data types (like salary amount).
To see the Prediction Calculator tool in action, click the Prediction Calculator button on the Analyze tab. In the Prediction Calculator dialog box, shown in Figure 14-14, identify the following inputs:
· Target: Select the column that will contain the target values of your prediction scenario. After you select the column, specify your target by using either the Exactly option (defines a specific value for your target column) or the In Range option (low and high numerical values that constitute a range where your target values should lie).
· Output Options: Choose to output an Operational Calculator (an interactive sheet where results can be manipulated) or a Printer-Ready Calculator (a single sheet with all results included).
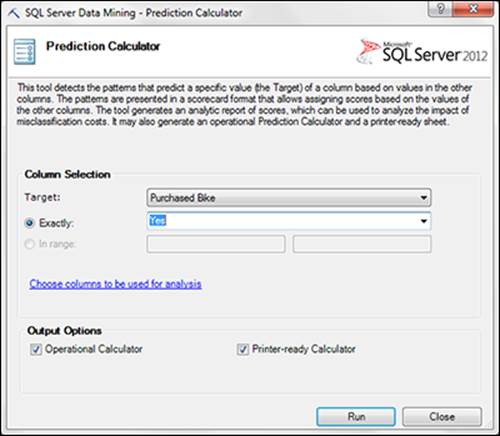
Figure 14-14: Configure the Prediction Calculator dialog box.
Click the Run button when you're done and you get a report similar to the one shown in Figure 14-15.
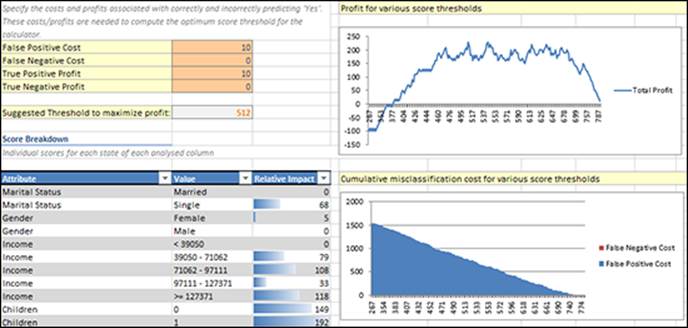
Figure 14-15: Results of the Prediction Calculator report.
The Prediction Calculator report facilitates the high-level scoring system that will be used to score predictions at the individual case level. The relevant question that can be answered by the report is “how high of a score should an individual case have in order to proceed?” The report provides the following components: Interactive cost and profit inputs, Score Breakdown, Data table, Profit for Various Score Thresholds, Cumulative Misclassification Cost for Various Score Thresholds. We discuss each of these in the following sections.
Interactive cost and profit inputs
In the upper left of the Prediction Calculator report (refer to Figure 14-15) you see the base calculation premise that includes values for profits and costs. This section allows you to specify how much profit can be gained from a true prediction, and on the flip side, how much a false prediction will cost.
Profits are associated with correct (true) predictions of the outcome state, which can be positive or negative. As a general rule, a positive outcome state is the desired outcome and leads to direct profit, while a negative outcome state simply means that you did not reach the desired positive outcome state. As expected, profits associated with true predictions vary widely depending on the scenario, which follows naturally when considering the enormous variability in economic profit between different kinds of products and services.
Costs associated with false predictions are called misclassification costs and also vary widely. For example, misclassification costs in targeted mail campaigns are probably small compared to misclassification costs associated with loan approvals, which in turn may be very small compared to misclassification costs associated with medical diagnoses.
The values are unique to each type of scenario being analyzed, but generally, there are two cost types and two profit types:
· False positive (FP): A prediction that targeting this customer would lead to a bicycle purchase was false (a cost was gained by targeting a customer that didn’t lead to a sale).
· False negative (FN): A prediction that targeting this customer would not lead to a bicycle purchase was false (an opportunity cost was gained because the customer would have purchased a bicycle had he been targeted).
· True positive (TP): A prediction that targeting this customer would lead to a bicycle purchase was true (a sale was made with a realized gain).
· True negative (TN): A prediction that targeting this customer would not lead to a bicycle purchase was true (the cost of targeting was avoided).
You can update the input values for the Prediction Calculator, which leads to instant updates in the maximum profit chart and suggested threshold. In Figure 14-15, the profits and costs in the Prediction Calculator report as follows: False Positive Cost = $10, False Negative Cost = $0, True Positive Profit = $10, True Negative Profit = $0. These inputs give you a Suggested Threshold to Maximize Profit of 512.
![]() Although there may be significant variability in the input data that is used to build the model, such as some products that produce very high profits and some that produce very low profits, the profits and costs are global factors. This means that a true positive (that is, a sale is predicted and you did make the sale) carries the same value regardless of product cost. To get around this, you can limit the input data to similar cases so that there is more consistency in terms of matching the global profits and costs to the individual cases.
Although there may be significant variability in the input data that is used to build the model, such as some products that produce very high profits and some that produce very low profits, the profits and costs are global factors. This means that a true positive (that is, a sale is predicted and you did make the sale) carries the same value regardless of product cost. To get around this, you can limit the input data to similar cases so that there is more consistency in terms of matching the global profits and costs to the individual cases.
Score Breakdown
Directly below the cost and profit inputs, the Score Breakdown section uses a point system and shaded bars to show the relative impact of each input column (and input column state) in terms of its tendency to lead to the target predicted column state, which in this case is Purchase Bike = Yes. By sorting the Relative Impact column by Largest to Smallest, you can see the strongest predictors of purchasing a bike: Children = 3, Cars = 0, and so on. Note that these predictive power scores are based on the underlying regression model and do not change when you change the cost and profit inputs.
Data table
Several dozen rows below the Score Breakdown is a data table that is used as an input for the remaining charts to be discussed in the next two sections of this chapter. This data table is automatically built for purposes of simulating a reasonable number of test cases. Each test case (each row in the table) has a number of prediction outcome states (remember that there are four prediction outcome states: false positives, false negatives, true positives, and true negatives). The data table includes columns for predicted Total Cost, predicted Total Profit, and Score. The values in these columns are calculated using our input data and cost/profit factors.
Profit for Various Score Thresholds
This report section to the right of cost and profit inputs uses a line chart to show where the suggested profit maximization threshold falls. The horizontal axis represents all of the possible scores from the Score column in the data table (described in the previous section) and the vertical axis represents the Total Profit column from that same table.
Cumulative Misclassification Cost for Various Score Thresholds
Cumulative Misclassification Cost for Various Score Thresholds section is located below the Profit for Various Score Thresholds chart (refer to Figure 14-15) and shows two area segments to represent both FPs in blue and FNs in red. This example only shows an area plot for FP because there isn't a cost to be associated with FNs.
Shopping Basket Analysis
You're probably familiar with shopping basket algorithms from shopping online. Though not the only weapon in the arsenal for Web storefront businesses, this approach to maximizing customer transactions is simple and has been around for years. The idea is that historical data shows which items customers tend to buy in bundles, and this information can be used in future transactions by suggesting to you other items you should purchase. This targeting is relatively non-intrusive and can even be seen as a helpful reminder to buy something useful (given the other items in the cart) that you would have otherwise forgotten to purchase. From the business perspective, the targeting is a way to maximize the value of each transaction.
To see the Shopping Basket Analysis tool in action, follow these steps:
1. In the DMAddins_SampleData.xlsx sample workbook, go to the worksheet called Associate and click inside the Excel table.
2. From the Analyze tab, click the Shopping Basket Analysis button.
3. In the Shopping Basket Analysis dialog box, shown in Figure 14-16, choose the following inputs:
· Transaction ID: This is where you identify a column that represents a transaction ID. This column gives the association algorithm a way to group rows that belong to the same transaction. This column could be called OrderID or something else, as long as it is the identifier of a transaction.
· Item: This is where you specify the column that represents the item being sold. Common examples of the kinds of columns used as the Item would be Product Name, Product Category, and Product Type.
· Item Value: This is an optional input that allows you to introduce a column of quantitative data. Typical columns used as Item Values are Product Price and Product Count.
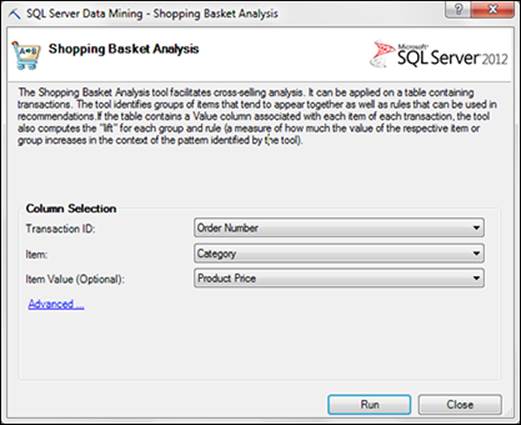
Figure 14-16: Configure the Shopping Basket Analysis dialog box as needed.
4. Click the Run button.
You get a report similar to the one shown in Figure 14-17.
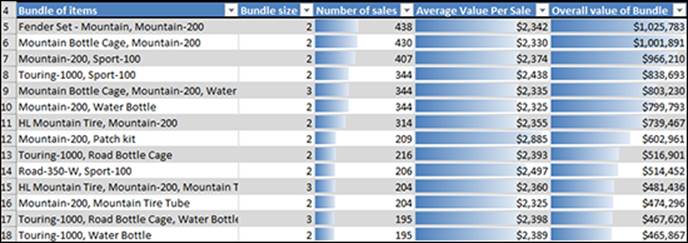
Figure 14-17: Results of the Shopping Basket Analysis.
The final output contains the following columns:
· Bundle of Items: Each bundle that has been identified in the input table is listed as item 1, item 2, and so on. For example, the bundle in row 8 consists of a Touring-1000 (bicycle) and Sport-100 (helmet), while the bundle in row 13 also lists the Touring-1000 but this time bundled with the Road Bottle Cage.
· Bundle Size: This column tells how many items are included in the bundle. Although you can determine the bundle size by examining the bundle description that appears in the column to the left, the Bundle Size column proves to be useful in other ways. For example, you can sort the results based on bundle size if you're interested in studying only those bundles that are at least a certain size.
· Number of Sales: This column tells how many cases (rows) from the input table are included in the bundle. For example, the bundle in row 8 (Touring-1000 bicycle and Sport-100 helmet) resulted in 344 sales transactions, but the bundle in row 13, which also includes a Touring-1000 bicycle, resulted in only 216 transactions.
· Average Value Per Sale: While the main point of this report is to identify bundles of items, it is even more useful to identify those bundles that tend to produce higher revenues on the whole. Suppose you have two different bundles, Bundle 1 and Bundle 2, which both include a particular item that costs $100 (“Item A”). If Bundle 1 packages Item A with a low-cost item, say $10, while Bundle 2 packages it with a higher-priced item, say $50, you'd prefer Bundle 2 to Bundle 1 because it generates higher sales revenue. The only thing that might stop you from suggesting the item from Bundle 2 when customers put Item A into their carts is data that shows Bundle 2 is not sufficiently likely to occur, which can be determined based on the Number of Sales column. The Average Value Per Sale column helps you make these kinds of decisions by giving you the average price of each bundle. In the report output, you can see that the first bundle resulted in an average bundle price of $2,341. Note: The average is used here because some transactions may price the same item differently.
· Overall Value of Bundle: When it comes to analyzing bundles of items, another useful measure is the overall revenues realized by all instances of a given bundle. Although you could probably do the math, this column does the math for you. In the report output, you can see that the Touring-1000 bicycle and Sport-100 helmet bundle in row 8 resulted in aggregate sales of $838,693, and the Touring-1000 bicycle and Road Bottle Cage bundle in row 13 resulted in sales of $516,901. You should also notice that the rows in the table are sorted by this column in descending order.
In addition to the Shopping Basket bundled items report, the Data Mining Add-In creates a worksheet that provides recommendations on what to do with the bundles. This report output (see Figure 14-18) consists of the following columns:
· Selected Item: Of the items identified to be commonly included in bundles, each is listed separately in this column. You can think of the values in this column as a starting point; that is, the first item a customer puts into her cart. In the report output, the first item listed is Mountain Tire Tube.
· Recommendation: If you're focusing on an item as a starting point for a bundle recommendation, this column provides that recommendation. Put another way, this column recommends a second item that should be “hinted” or “suggested” to accompany the first item in the customer’s cart. Looking at the report, you can see that if a customer puts a Mountain Tire Tube into her cart, you should suggest the Sport-100.
· Sales of Selected Items: What is the proof behind the recommendation? The Sales of Selected Items column, along with the next two columns (Linked Sales and % of Linked Sales), provide the proof. The Sales of Selected Items column tells you the aggregate sales volume for the item that appears in the Selected Item column. For example, you had 749 sales that included the Mountain Tire Tube item.
· Linked Sales: The Linked Sales column represents the power of the relationship between the item in the Recommendation column and the item in the Selected Item column.
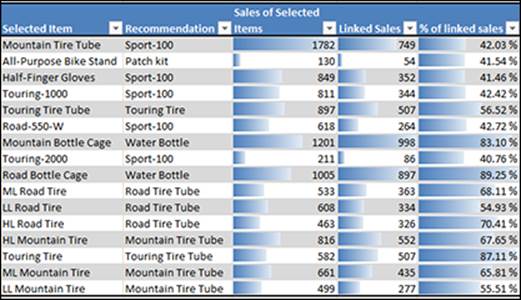
Figure 14-18: The Shopping Basket recommendations report.
All materials on the site are licensed Creative Commons Attribution-Sharealike 3.0 Unported CC BY-SA 3.0 & GNU Free Documentation License (GFDL)
If you are the copyright holder of any material contained on our site and intend to remove it, please contact our site administrator for approval.
© 2016-2026 All site design rights belong to S.Y.A.