Microsoft Business Intelligence Tools for Excel Analysts (2014)
PART III: Delivering Business Intelligence with SharePoint and Excel Services
Chapter 15: Publishing Your BI Tools to SharePoint
Chapter 16: Leveraging PerformancePoint Services
Chapter 15: Publishing Your BI Tools to SharePoint
In This Chapter
· Understanding SharePoint and Excel Services
· Publishing an Excel workbook to SharePoint
· Using the Power Pivot Gallery
· Refreshing Power Pivot data connections
· Managing Power Pivot performance
Each version of Microsoft Office has demonstrated a greater ability to integrate with SharePoint. The most exciting aspect of this new paradigm is that you can publish interactive BI solutions to a Web site.
By publishing your Excel reports and dashboards to SharePoint, you can make them available to others in your organization via a browser. This avoids multiple users having separate versions of your workbooks on their computers. This also enables you to make your BI solutions easier to find, share, and use.
In this chapter, you gain a basic understanding of what SharePoint is and how it helps organizations share and collaborate data. You also explore how to publish your Excel reports and dashboards to SharePoint.
Understanding SharePoint
SharePoint is Microsoft’s premier collaborative server environment, providing tools for sharing documents and data across various organizations within your company network.
SharePoint is typically deployed on a company’s network as a series of intranet sites, giving various departments the ability to control their own security, workgroups, documents, and data. As with any other Web site, a SharePoint site — even an individual page within the site — is accessible through a URL.
SharePoint is most often used to store version-controlled documents, such as Word documents and Excel worksheets. In many environments, documents are passed back and forth between users via e-mail. There is considerable potential for mixing up different versions of the same document. Also, storing multiple copies of the same document takes up a lot of disk space. Because SharePoint provides a single source for storing, viewing, and updating documents, many of these issues are eliminated entirely. Because SharePoint easily handles any type of document, it's frequently used to consolidate and store various types of documentation (such as project drawings, videos, schematics, photographs, and workbooks) required for large projects where multiple teams must collaborate.
Why SharePoint?
Microsoft chose SharePoint as the platform for Excel publishing because of the significant features built into SharePoint, including the following:
· Security: SharePoint supports users and groups of users. Users and groups may be granted or denied access to various parts of a SharePoint Web site, and designated users may be granted permission to add, delete, or modify the site.
· Versioning: SharePoint automatically maintains a version history of objects and data. Changes can be rolled back to an earlier state at virtually any time. The ability to roll back changes can be granted to individual users, and DBA support is not required.
· Recycle bin: Deleted data and objects are held in a recycle bin so that they may be recovered. SharePoint supports an undo feature for its data.
· Alerts: Users and groups can be sent e-mail when a specific document in SharePoint is added, deleted, or changed. If granted the proper permissions, users can manage their own alerts.
· End-user maintenance: SharePoint sites are meant to be maintained by their users, without the intervention of IT departments. Although SharePoint pages are not as flexible as typical Web pages, a SharePoint developer can add or remove features from pages; change fonts, headings, colors, and other attributes of pages; create sub-sites and lists; and perform many other maintenance and enhancement tasks.
· Other features: Every SharePoint site includes a number of features, such as a calendar, a task list, and announcements that users can turn off or remove.
![]() Most IT organizations have already implemented a SharePoint environment, so it's likely that your organization already has SharePoint running on your network. No one user can simply stand up a SharePoint site. If you're interested in using SharePoint, contact your IT department about getting access to a SharePoint site.
Most IT organizations have already implemented a SharePoint environment, so it's likely that your organization already has SharePoint running on your network. No one user can simply stand up a SharePoint site. If you're interested in using SharePoint, contact your IT department about getting access to a SharePoint site.
Understanding Excel Services for SharePoint
The mechanism that allows for the publishing of Excel documents to SharePoint as interactive Web pages is Excel Services. Excel Services is a broad term that describes the following three components:
· Excel Calculation Services: Serves as the primary engine of Excel Services. This component loads Excel documents, runs calculations on the Excel sheet, and runs the refresh process for any embedded data connection.
· Excel Web Access: This component allows users to interact with Excel through a Web server.
· Excel Web Services: This component is hosted in SharePoint Services and provides developers with an application programming interface (API) to build custom applications based on the Excel workbook.
When you publish a workbook to Excel Services, your audience can interact with your Excel file in several ways:
· View workbooks that contain a Data Model and Power View reports
· Navigate between worksheets
· Sort and filter data
· Work with PivotTables
· Use slicers and PivotTable report filters
· Refresh data for embedded data connections
Limitations of Excel Services
It’s important to understand that workbooks on the Web are running in an environment that is quite different from the Excel client application you have on your PC. Excel Services has limitations on the features it can render on the Web browser. Some limitations are due to security issues, while others are simply because Microsoft hasn’t had time to evolve Excel Services to include the broad set of features that come with standard Excel.
Limitations include the following:
· Data validation does not work on the Web. This feature is simply ignored when you publish your workbook to the Web.
· No form of VBA, including macros, runs in the Excel Web App. Your VBA procedures simply do not transfer with the workbook.
· Worksheet protection does not work on the Web. Instead, you need to use the options shown in the Browser View Options dialog box (look ahead to Figure 15-2).
· Links to external workbooks no longer work after publishing to the Web.
· You can use any PivotTables with full fidelity on the Web, but you cannot create any new PivotTables while your workbook is on the Web. You need to create any PivotTables in the desktop version of Excel on your PC before publishing on the Web.
· OfficeArt, including Shapes, WordArt, SmartArt, diagrams, signature lines, and ink annotations, doesn't render on the Web.
 SharePoint requirements and Office 365
Excel Services is a SharePoint implementation that is available only with SharePoint 2010 or 2013, so you’ll want to ensure that your SharePoint site is one of those two versions.
You most likely work in a SharePoint 2010 or 2013 environment. However, if you don’t have access to an existing SharePoint environment, hundreds of service providers offer subscription-based SharePoint services. Many of these providers provide volume-based pricing on a subscription model.
In fact, Microsoft offers Office 365, a cloud-based Microsoft environment that gives you a line of collaborative Microsoft Office-like tools that you can access through the Web. Similar to Google Docs or Google Spreadsheets, Microsoft offers Word, Excel, and PowerPoint in Office 365. This means you can use Office 365 to publish and host your Excel solutions.
Subscribing to a commercial SharePoint service provider may be the fastest and most affordable way to host Microsoft Excel solutions on SharePoint. Again, the only caveat is that the commercial service provider you choose must offer either SharePoint 2010 or 2013 with Excel Services implemented.
Publishing an Excel Workbook to SharePoint
In order to take advantage of the functionality afforded by Excel Services, you must have permission to publish to a SharePoint site that is running Excel Services. You’ll need to speak with your IT department to obtain access.
When you have access to publish to SharePoint, follow these steps:
1. Choose File → Save As, select Other Web Locations, and then click the Browse button.
The Save As dialog box opens, as shown in Figure 15-1.
2. Enter the URL address of your SharePoint site in the File Name box and click the Browser View Options button.
The Browser View Options dialog box opens, as shown in Figure 15-2.
3. Select which parts of your workbook you want to make available on the Web, and then click OK.
You can choose to show the entire workbook, only certain sheets, or only specific objects (charts, PivotTables, and so on). You can also define parameters to allow certain named ranges to be editable in the Web browser.
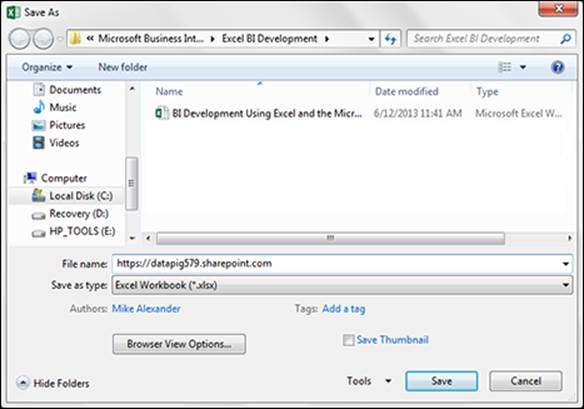
Figure 15-1: Enter your SharePoint URL in the File Name box of the Save As dialog box.
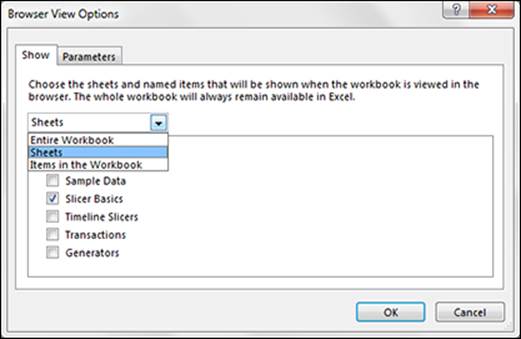
Figure 15-2: Select which parts of your workbook to make available on the Web.
4. Click Save in the Save As dialog box.
You then connect to the SharePoint site and get a list of the document libraries, as shown in Figure 15-3.
![]() Think of these libraries as folders on the SharePoint site.
Think of these libraries as folders on the SharePoint site.
5. Enter the name of the file in the File Name box, double-click the library where you want to save your file, and then click Save.
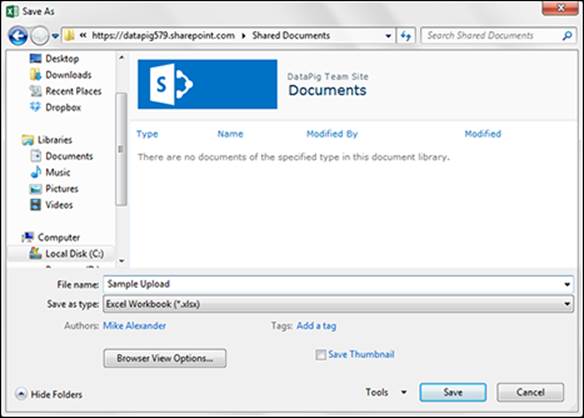
Figure 15-3: Double-click the library where you want to save your file, and then click Save.
After you have published the workbook, you can view it on the Web by going to your SharePoint site and finding the document in the appropriate library. When you open the workbook, it shows in the browser with several menu options (see Figure 15-4):
· Edit Workbook: Either download the workbook or edit the workbook in the browser.
· Share: E-mail a link to your newly published workbook.
· Data: Refresh any external data connections you have in your workbook.
· Find: Search for specific text in the workbook.
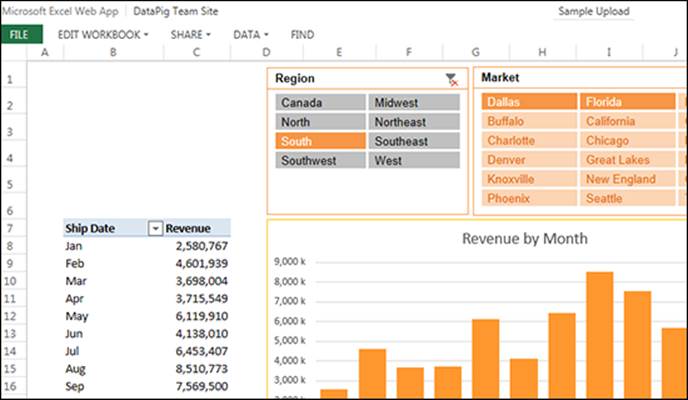
Figure 15-4: A workbook as shown in Excel Services.
Publishing to a Power Pivot Gallery
A Power Pivot Gallery is a type of document library that showcases Power Pivot reports and allows for scheduled refresh cycles.
For your end users, the Power Pivot Gallery provides an attractive portal that serves as a one-stop shop for all the reports and dashboards you publish. For you, the Power Pivot Gallery enables better management of your Power Pivot solutions by allowing you to schedule nightly refreshes of the data in them.
You need to speak with your SharePoint administrator about your organization’s SharePoint instance and ask him to consider adding a Power Pivot Gallery to your site. When you have access to a Power Pivot Gallery, you can upload your Power Pivot workbooks using the same steps you took to publish a standard workbook to SharePoint.
Figure 15-5 shows a typical Power Pivot Gallery. Note that each workbook is shown as a thumbnail, providing users with a snapshot of the each report. Clicking a thumbnail opens the report as a Web page.
![]() If you're using an Office 365 SharePoint subscription, you unfortunately have no option for a Power Pivot Gallery, as Office 365 doesn’t support it. This may change in the future as Microsoft continues to add improvements to Office 365.
If you're using an Office 365 SharePoint subscription, you unfortunately have no option for a Power Pivot Gallery, as Office 365 doesn’t support it. This may change in the future as Microsoft continues to add improvements to Office 365.
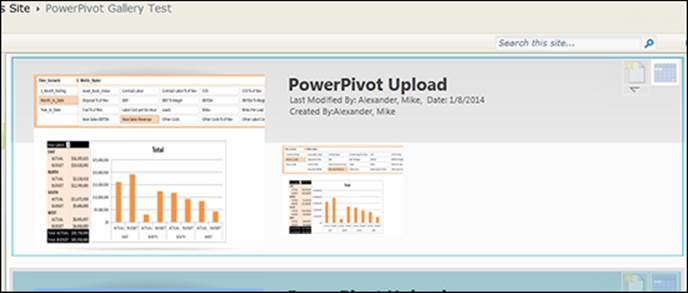
Figure 15-5: A Power Pivot Gallery.
You can manually refresh the data connections within your published Power Pivot report by opening the workbook and selecting the Data drop-down menu, as shown in Figure 15-6. You have the option of refreshing a single selected connection or all connections in the workbook.
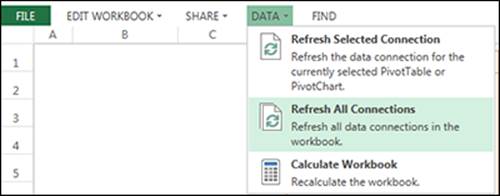
Figure 15-6: Use the Data drop-down menu to manually refresh data connections.
If you don't want to go through the trouble to manually refresh your connections, you can set a schedule. Click the Manage Data icon in the upper right-hand corner of the target report (see Figure 15-7).
SharePoint opens the Manage Data Refresh window shown in Figure 15-8. The idea is to configure each setting to achieve the desired refresh schedule.
· Data Refresh: The Data Refresh setting is the On/Off switch for your schedule. Select the Enable check box to make the schedule active. Deselect the check box to stop automatic refreshes.
· Schedule Details: The Schedule Details section allows you to specify the frequency and intervals of your schedule. In addition to selecting your time intervals, you have the option to refresh as soon as possible. Selecting this option starts a refresh within a minute, letting you test your refresh process and ensure that it runs properly.
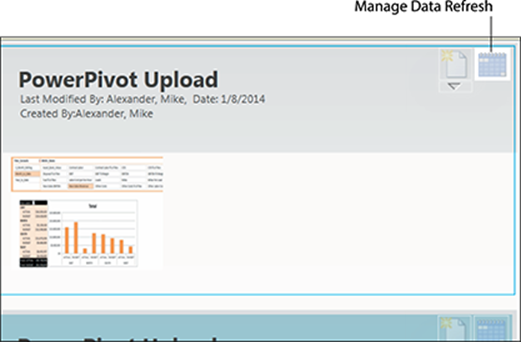
Figure 15-7: Refresh your data with this icon.
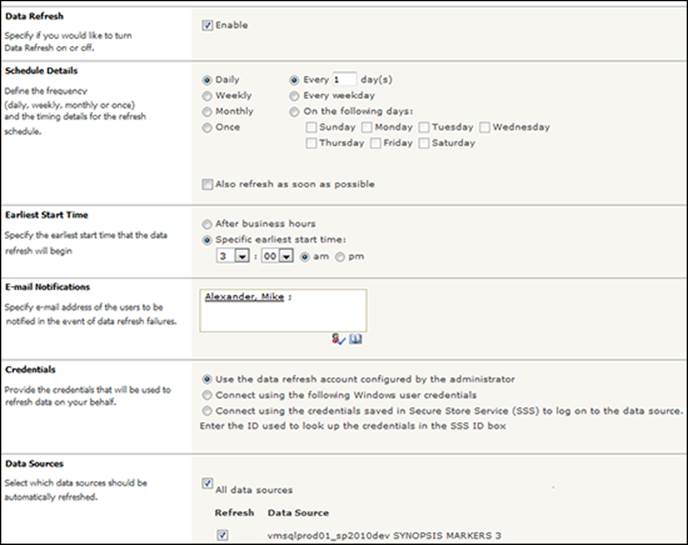
Figure 15-8: Set a schedule to refresh your data.
· Earliest Start Time: The Earliest Start Time specifies the time of day to run the refresh process.
· E-mail Notifications: The E-mail Notifications setting lets you specify who should receive an e-mail from SharePoint each time the scheduled refresh is run. Note that individuals specified will receive an e-mail whether the process ran with errors or ran successfully.
· Credentials: Most data sources require authentication in order to pull data in a refresh process. The Credentials setting specifies how authentication is passed to external data sources. There are three options:
· Use the Data Refresh Account Configured by the Administrator: This means that a SharePoint system account authenticates to the data source. You typically have to work with your SharePoint administrator to set up this authentication method and ensure that the data source can use SharePoint’s system account.
· Connect Using the Following Windows User Credentials: This enables you to enter a username and password for authentication. It’s not a good idea to use your own personal username and password here. Instead, this option is best used with an application account — a dummy account created by your database administrators.
· Connect Using the Credentials Saved in Secure Store Service (SSS) to Log On to the Data Source: This option allows you to refresh data connections without a password. To do so, you need to acquire a Secure Store ID from your SharePoint administrator.
· Data Sources: This setting lets you define whether all data connections are refreshed, or only specific connections. Deselect the All Data Sources check box to enable the selection of individual connections in your workbook.
Managing Power Pivot Performance
When you publish Power Pivot reports to the Web, you want to give your audience the best experience possible. A large part of that experience is ensuring that performance is not an issue. In terms of applications and reporting, performance is typically synonymous with speed. Speed is how quickly your application performs certain actions, such as opening within the browser, running queries, and filtering.
Because Power Pivot inherently paves the way for large amounts of data with fairly liberal restrictions, it’s common to end up with BI solutions that work, but are unbearably slow. And nothing turns your intended audience away from your slick new BI solution faster than sluggish performance.
To help you create the best interactive experience for your users, and ultimately improve user adoption of your published BI solutions, we wrap up this chapter with some best practices for optimizing the performance of your Power Pivot reports.
Limit the number of columns in your Data Model tables
One of the biggest influences on Power Pivot performance is the number of columns you import into the Data Model. Every column you import is one more dimension Power Pivot has to process when loading your workbook. If you’re not certain you will use certain columns, don’t bring them in “just in case.” You can easily add columns if you find you need them later.
Limit the number of rows in your Data Model
This one is simple. More rows mean more data to load, more data to filter, and more data to calculate through. Avoid selecting an entire table if you don’t have to. Use a query or a view at the source database to filter for only the rows you need to import. Why import 400,000 rows of data when you can use a simple Where clause and import 100,000?
Avoid multi-level relationships
Both the number of relationships and the number of relationship layers have an impact on the performance of your Power Pivot reports. When building your model, it’s a best practice to have a single fact table containing primarily quantitative numerical data (facts) and dimension tables that relate to the facts directly. In database-speak, this configuration is called a star schema (see Figure 15-9).
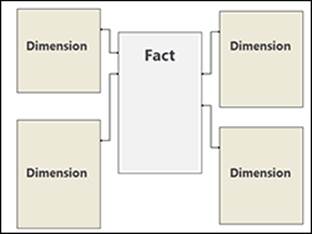
Figure 15-9: A star schema is the most efficient model, with a single fact table and dimensions relating directly to it.
Avoid building models where dimension tables relate to other dimension tables. Figure 15-10 illustrates this configuration, also known as a snowflake schema. This configuration forces Power Pivot to perform relationship lookups across several dimension levels. This can be particularly inefficient depending on the volume of data in the model.
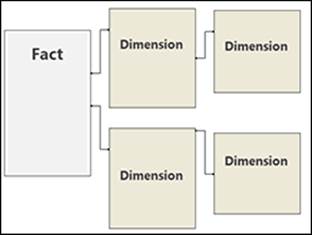
Figure 15-10: Snowflake schemas are less efficient, causing Power Pivot to perform chain lookups.
Let your back-end database servers do the crunching
Most Excel analysts who are new to Power Pivot have the tendency to pull raw data directly from the tables on their external database servers. When the raw data is in Power Pivot, they then build calculated columns and measures to transform and aggregate the data as needed. For example, it’s common to pull revenue and cost data, then create a calculated column in Power Pivot to compute profit. So why make Power Pivot do this calculation when the back-end server could have handled it?
The reality is that back-end database systems like SQL Server have the ability to shape, aggregate, clean, and transform data much more efficiently than Power Pivot. Why not utilize their powerful capabilities to massage and shape your data before importing into Power Pivot?
Instead of pulling raw table data, consider leveraging queries, views, and stored procedures to perform much of the data aggregation and crunching work for you. This reduces the amount of processing Power Pivot has to do and naturally improves performance.
Beware of columns with non-distinct values
Columns that have a high number of unique values are particularly hard on Power Pivot performance. Columns like Transaction ID, Order ID, and Invoice Number are often unnecessary in high-level Power Pivot reports and dashboards. So unless they are needed to establish relationships to other tables, leave them out of your model.
Avoid the excessive use of slicers
Slicers are one of the best BI features added to Excel in recent years. With slicers, you can provide your audience with an intuitive interface that allows for interactive filtering of your Excel reports and dashboards.
One of the more attractive benefits of slicers is that they respond to one another, giving you a cascading filter effect. For example, in Figure 15-11, clicking Midwest in the Region slicer not only filters the PivotTable, but also the Market slicer responds by highlighting the markets that belong to the Midwest region. Microsoft calls this behavior cross-filtering.
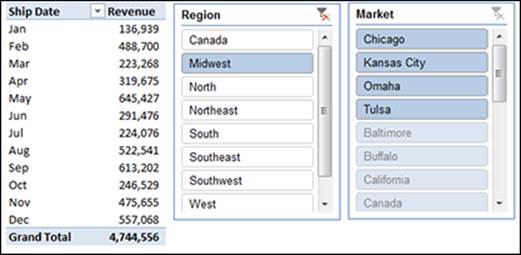
Figure 15-11: Slicers work together to show you relevant data items based on your selection.
As useful as slicers are, they are, unfortunately, extremely bad for Power Pivot performance. Take a moment to think about this. Each time a slicer is changed, Power Pivot must recalculate all the values and measures in the PivotTable. In order to do that, Power Pivot must evaluate each tile in the selected slicer and process the appropriate calculations based on the selection.
Take that a step further and think about what happens when you add a second slicer. Because slicers cross-filter, each time you click one slicer, the other slicer also changes, so it’s almost as if you clicked both of them. Power Pivot must respond to both slicers, evaluating each tile in both slicers for each calculated measure in the PivotTable. So adding a second slicer is tantamount to doubling the processing time. Add a third slicer, and you have tripled the processing time.
In short, slicers are bad for Power Pivot performance. However, the functionality slicers bring to Excel BI solutions is too good to give up completely.
The following is a list of actions you can take to mitigate any performance issues you may be having with your Power Pivot reports:
· Limit the number of slicers in your report. Remove the slicers one at a time, testing the performance of your Power Pivot report after each removal. You‘ll often find that removing one of your slicers is enough to correct performance issues.
· Only create slicers on dimension fields. Consider building slicers using the fields in smaller dimension tables — not the considerably larger fact tables in your model. Note that slicers with many tiles often cause a larger performance hit than those containing only a handful of tiles. Avoid slicers that contain a large number of tiles, opting instead to use a PivotTable Filter drop-down menu instead.
· Remove slicers that aren’t clicked very often. Some slicers hold filter values that frankly aren’t touched very often. For example, you may have a slicer that allows users to select current year or last year. If the last year view is not often called up, consider removing the slicer or using PivotTable Filter drop-down menu instead.
· Disable the cross-filter behavior for some slicers. Disabling the cross-filter behavior of a slicer essentially prevents that slicer from changing selections when other slicers are clicked. This prevents the need for Power Pivot to evaluate the titles in the disabled slicer, thus reducing processing cycles. To disable the cross-filter behavior, right-click the target slicer and select Slicer Settings. In the Slicer Settings dialog box, deselect the Visually Indicate Items with No Data check box, as shown in Figure 15-12.
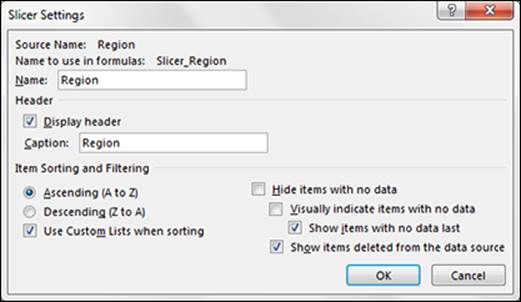
Figure 15-12: Deselect the Visually Indicate Items with No Data check box to disable the slicer’s cross-filter behavior.
All materials on the site are licensed Creative Commons Attribution-Sharealike 3.0 Unported CC BY-SA 3.0 & GNU Free Documentation License (GFDL)
If you are the copyright holder of any material contained on our site and intend to remove it, please contact our site administrator for approval.
© 2016-2026 All site design rights belong to S.Y.A.