Windows Internals, Sixth Edition, Part 1 (2012)
Chapter 3. System Mechanisms
The Windows operating system provides several base mechanisms that kernel-mode components such as the executive, the kernel, and device drivers use. This chapter explains the following system mechanisms and describes how they are used:
§ Trap dispatching, including interrupts, deferred procedure calls (DPCs), asynchronous procedure calls (APCs), exception dispatching, and system service dispatching
§ The executive object manager
§ Synchronization, including spinlocks, kernel dispatcher objects, how waits are implemented, as well as user-mode-specific synchronization primitives that avoid trips to kernel mode (unlike typical dispatcher objects)
§ System worker threads
§ Miscellaneous mechanisms such as Windows global flags
§ Advanced Local Procedure Calls (ALPCs)
§ Kernel event tracing
§ Wow64
§ User-mode debugging
§ The image loader
§ Hypervisor (Hyper-V)
§ Kernel Transaction Manager (KTM)
§ Kernel Patch Protection (KPP)
§ Code integrity
Trap Dispatching
Interrupts and exceptions are operating system conditions that divert the processor to code outside the normal flow of control. Either hardware or software can detect them. The term trap refers to a processor’s mechanism for capturing an executing thread when an exception or an interrupt occurs and transferring control to a fixed location in the operating system. In Windows, the processor transfers control to a trap handler, which is a function specific to a particular interrupt or exception. Figure 3-1 illustrates some of the conditions that activate trap handlers.
The kernel distinguishes between interrupts and exceptions in the following way. An interrupt is an asynchronous event (one that can occur at any time) that is unrelated to what the processor is executing. Interrupts are generated primarily by I/O devices, processor clocks, or timers, and they can be enabled (turned on) or disabled (turned off). An exception, in contrast, is a synchronous condition that usually results from the execution of a particular instruction. (Aborts, such as machine checks, is a type of processor exception that’s typically not associated with instruction execution.) Running a program a second time with the same data under the same conditions can reproduce exceptions. Examples of exceptions include memory-access violations, certain debugger instructions, and divide-by-zero errors. The kernel also regards system service calls as exceptions (although technically they’re system traps).
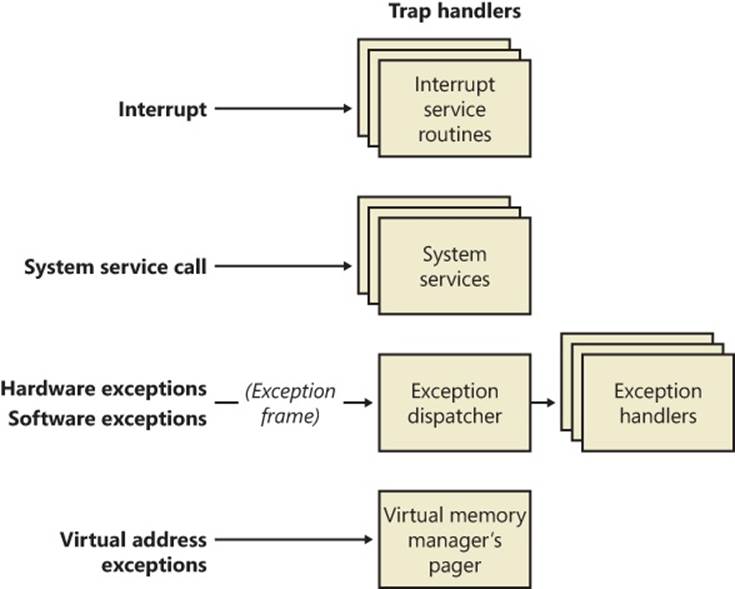
Figure 3-1. Trap dispatching
Either hardware or software can generate exceptions and interrupts. For example, a bus error exception is caused by a hardware problem, whereas a divide-by-zero exception is the result of a software bug. Likewise, an I/O device can generate an interrupt, or the kernel itself can issue a software interrupt (such as an APC or DPC, both of which are described later in this chapter).
When a hardware exception or interrupt is generated, the processor records enough machine state on the kernel stack of the thread that’s interrupted to return to that point in the control flow and continue execution as if nothing had happened. If the thread was executing in user mode, Windows switches to the thread’s kernel-mode stack. Windows then creates a trap frame on the kernel stack of the interrupted thread into which it stores the execution state of the thread. The trap frame is a subset of a thread’s complete context, and you can view its definition by typing dt nt!_ktrap_frame in the kernel debugger. (Thread context is described in Chapter 5.) The kernel handles software interrupts either as part of hardware interrupt handling or synchronously when a thread invokes kernel functions related to the software interrupt.
In most cases, the kernel installs front-end, trap-handling functions that perform general trap-handling tasks before and after transferring control to other functions that field the trap. For example, if the condition was a device interrupt, a kernel hardware interrupt trap handler transfers control to the interrupt service routine (ISR) that the device driver provided for the interrupting device. If the condition was caused by a call to a system service, the general system service trap handler transfers control to the specified system service function in the executive. The kernel also installs trap handlers for traps that it doesn’t expect to see or doesn’t handle. These trap handlers typically execute the system function KeBugCheckEx, which halts the computer when the kernel detects problematic or incorrect behavior that, if left unchecked, could result in data corruption. (For more information on bug checks, see Chapter 14, “Crash Dump Analysis,” in Part 2.) The following sections describe interrupt, exception, and system service dispatching in greater detail.
Interrupt Dispatching
Hardware-generated interrupts typically originate from I/O devices that must notify the processor when they need service. Interrupt-driven devices allow the operating system to get the maximum use out of the processor by overlapping central processing with I/O operations. A thread starts an I/O transfer to or from a device and then can execute other useful work while the device completes the transfer. When the device is finished, it interrupts the processor for service. Pointing devices, printers, keyboards, disk drives, and network cards are generally interrupt driven.
System software can also generate interrupts. For example, the kernel can issue a software interrupt to initiate thread dispatching and to asynchronously break into the execution of a thread. The kernel can also disable interrupts so that the processor isn’t interrupted, but it does so only infrequently—at critical moments while it’s programming an interrupt controller or dispatching an exception, for example.
The kernel installs interrupt trap handlers to respond to device interrupts. Interrupt trap handlers transfer control either to an external routine (the ISR) that handles the interrupt or to an internal kernel routine that responds to the interrupt. Device drivers supply ISRs to service device interrupts, and the kernel provides interrupt-handling routines for other types of interrupts.
In the following subsections, you’ll find out how the hardware notifies the processor of device interrupts, the types of interrupts the kernel supports, the way device drivers interact with the kernel (as a part of interrupt processing), and the software interrupts the kernel recognizes (plus the kernel objects that are used to implement them).
Hardware Interrupt Processing
On the hardware platforms supported by Windows, external I/O interrupts come into one of the lines on an interrupt controller. The controller, in turn, interrupts the processor on a single line. Once the processor is interrupted, it queries the controller to get the interrupt request (IRQ). The interrupt controller translates the IRQ to an interrupt number, uses this number as an index into a structure called the interrupt dispatch table (IDT), and transfers control to the appropriate interrupt dispatch routine. At system boot time, Windows fills in the IDT with pointers to the kernel routines that handle each interrupt and exception.
Windows maps hardware IRQs to interrupt numbers in the IDT, and the system also uses the IDT to configure trap handlers for exceptions. For example, the x86 and x64 exception number for a page fault (an exception that occurs when a thread attempts to access a page of virtual memory that isn’t defined or present) is 0xe (14). Thus, entry 0xe in the IDT points to the system’s page-fault handler. Although the architectures supported by Windows allow up to 256 IDT entries, the number of IRQs a particular machine can support is determined by the design of the interrupt controller the machine uses.
EXPERIMENT: VIEWING THE IDT
You can view the contents of the IDT, including information on what trap handlers Windows has assigned to interrupts (including exceptions and IRQs), using the !idt kernel debugger command. The !idt command with no flags shows simplified output that includes only registered hardware interrupts (and, on 64-bit machines, the processor trap handlers).
The following example shows what the output of the !idt command looks like:
lkd> !idt
Dumping IDT:
00: fffff80001a7ec40 nt!KiDivideErrorFault
01: fffff80001a7ed40 nt!KiDebugTrapOrFault
02: fffff80001a7ef00 nt!KiNmiInterrupt Stack = 0xFFFFF80001865000
03: fffff80001a7f280 nt!KiBreakpointTrap
04: fffff80001a7f380 nt!KiOverflowTrap
05: fffff80001a7f480 nt!KiBoundFault
06: fffff80001a7f580 nt!KiInvalidOpcodeFault
07: fffff80001a7f7c0 nt!KiNpxNotAvailableFault
08: fffff80001a7f880 nt!KiDoubleFaultAbort Stack = 0xFFFFF80001863000
09: fffff80001a7f940 nt!KiNpxSegmentOverrunAbort
0a: fffff80001a7fa00 nt!KiInvalidTssFault
0b: fffff80001a7fac0 nt!KiSegmentNotPresentFault
0c: fffff80001a7fc00 nt!KiStackFault
0d: fffff80001a7fd40 nt!KiGeneralProtectionFault
0e: fffff80001a7fe80 nt!KiPageFault
10: fffff80001a80240 nt!KiFloatingErrorFault
11: fffff80001a803c0 nt!KiAlignmentFault
12: fffff80001a804c0 nt!KiMcheckAbort Stack = 0xFFFFF80001867000
13: fffff80001a80840 nt!KiXmmException
1f: fffff80001a5ec10 nt!KiApcInterrupt
2c: fffff80001a80a00 nt!KiRaiseAssertion
2d: fffff80001a80b00 nt!KiDebugServiceTrap
2f: fffff80001acd590 nt!KiDpcInterrupt
37: fffff8000201c090 hal!PicSpuriousService37 (KINTERRUPT fffff8000201c000)
3f: fffff8000201c130 hal!PicSpuriousService37 (KINTERRUPT fffff8000201c0a0)
51: fffffa80045babd0 dxgkrnl!DpiFdoLineInterruptRoutine (KINTERRUPT fffffa80045bab40)
52: fffffa80029f1390 USBPORT!USBPORT_InterruptService (KINTERRUPT fffffa80029f1300)
62: fffffa80029f15d0 USBPORT!USBPORT_InterruptService (KINTERRUPT fffffa80029f1540)
USBPORT!USBPORT_InterruptService (KINTERRUPT fffffa80029f1240)
72: fffffa80029f1e10 ataport!IdePortInterrupt (KINTERRUPT fffffa80029f1d80)
81: fffffa80045bae10 i8042prt!I8042KeyboardInterruptService (KINTERRUPT fffffa80045bad80)
82: fffffa80029f1ed0 ataport!IdePortInterrupt (KINTERRUPT fffffa80029f1e40)
90: fffffa80045bad50 Vid+0x7918 (KINTERRUPT fffffa80045bacc0)
91: fffffa80045baed0 i8042prt!I8042MouseInterruptService (KINTERRUPT fffffa80045bae40)
a0: fffffa80045bac90 vmbus!XPartPncIsr (KINTERRUPT fffffa80045bac00)
a2: fffffa80029f1210 sdbus!SdbusInterrupt (KINTERRUPT fffffa80029f1180)
rimmpx64+0x9FFC (KINTERRUPT fffffa80029f10c0)
rimspx64+0x7A14 (KINTERRUPT fffffa80029f1000)
rixdpx64+0x9C50 (KINTERRUPT fffffa80045baf00)
a3: fffffa80029f1510 USBPORT!USBPORT_InterruptService (KINTERRUPT fffffa80029f1480)
HDAudBus!HdaController::Isr (KINTERRUPT fffffa80029f1c00)
a8: fffffa80029f1bd0 NDIS!ndisMiniportMessageIsr (KINTERRUPT fffffa80029f1b40)
a9: fffffa80029f1b10 NDIS!ndisMiniportMessageIsr (KINTERRUPT fffffa80029f1a80)
aa: fffffa80029f1a50 NDIS!ndisMiniportMessageIsr (KINTERRUPT fffffa80029f19c0)
ab: fffffa80029f1990 NDIS!ndisMiniportMessageIsr (KINTERRUPT fffffa80029f1900)
ac: fffffa80029f18d0 NDIS!ndisMiniportMessageIsr (KINTERRUPT fffffa80029f1840)
ad: fffffa80029f1810 NDIS!ndisMiniportMessageIsr (KINTERRUPT fffffa80029f1780)
ae: fffffa80029f1750 NDIS!ndisMiniportMessageIsr (KINTERRUPT fffffa80029f16c0)
af: fffffa80029f1690 NDIS!ndisMiniportMessageIsr (KINTERRUPT fffffa80029f1600)
b0: fffffa80029f1d50 NDIS!ndisMiniportMessageIsr (KINTERRUPT fffffa80029f1cc0)
b1: fffffa80029f1f90 ACPI!ACPIInterruptServiceRoutine (KINTERRUPT fffffa80029f1f00)
b3: fffffa80029f1450 USBPORT!USBPORT_InterruptService (KINTERRUPT fffffa80029f13c0)
c1: fffff8000201c3b0 hal!HalpBroadcastCallService (KINTERRUPT fffff8000201c320)
d1: fffff8000201c450 hal!HalpHpetClockInterrupt (KINTERRUPT fffff8000201c3c0)
d2: fffff8000201c4f0 hal!HalpHpetRolloverInterrupt (KINTERRUPT fffff8000201c460)
df: fffff8000201c310 hal!HalpApicRebootService (KINTERRUPT fffff8000201c280)
e1: fffff80001a8e1f0 nt!KiIpiInterrupt
e2: fffff8000201c270 hal!HalpDeferredRecoveryService (KINTERRUPT fffff8000201c1e0)
e3: fffff8000201c1d0 hal!HalpLocalApicErrorService (KINTERRUPT fffff8000201c140)
fd: fffff8000201c590 hal!HalpProfileInterrupt (KINTERRUPT fffff8000201c500)
fe: fffff8000201c630 hal!HalpPerfInterrupt (KINTERRUPT fffff8000201c5a0)
On the system used to provide the output for this experiment, the keyboard device driver’s (I8042prt.sys) keyboard ISR is at interrupt number 0x81. You can also see that interrupt 0xe corresponds to KiPageFault, as explained earlier.
Each processor has a separate IDT so that different processors can run different ISRs, if appropriate. For example, in a multiprocessor system, each processor receives the clock interrupt, but only one processor updates the system clock in response to this interrupt. All the processors, however, use the interrupt to measure thread quantum and to initiate rescheduling when a thread’s quantum ends. Similarly, some system configurations might require that a particular processor handle certain device interrupts.
x86 Interrupt Controllers
Most x86 systems rely on either the i8259A Programmable Interrupt Controller (PIC) or a variant of the i82489 Advanced Programmable Interrupt Controller (APIC); today’s computers include an APIC. The PIC standard originates with the original IBM PC. The i8259A PIC works only with uniprocessor systems and has only eight interrupt lines. However, the IBM PC architecture defined the addition of a second PIC, called the slave, whose interrupts are multiplexed into one of the master PIC’s interrupt lines. This provides 15 total interrupts (seven on the master and eight on the slave, multiplexed through the master’s eighth interrupt line). APICs and Streamlined Advanced Programmable Interrupt Controllers (SAPICs, discussed shortly) work with multiprocessor systems and have 256 interrupt lines. Intel and other companies have defined the Multiprocessor Specification (MP Specification), a design standard for x86 multiprocessor systems that centers on the use of APIC. To provide compatibility with uniprocessor operating systems and boot code that starts a multiprocessor system in uniprocessor mode, APICs support a PIC compatibility mode with 15 interrupts and delivery of interrupts to only the primary processor. Figure 3-2 depicts the APIC architecture.
The APIC actually consists of several components: an I/O APIC that receives interrupts from devices, local APICs that receive interrupts from the I/O APIC on the bus and that interrupt the CPU they are associated with, and an i8259A-compatible interrupt controller that translates APIC input into PIC-equivalent signals. Because there can be multiple I/O APICs on the system, motherboards typically have a piece of core logic that sits between them and the processors. This logic is responsible for implementing interrupt routing algorithms that both balance the device interrupt load across processors and attempt to take advantage of locality, delivering device interrupts to the same processor that has just fielded a previous interrupt of the same type. Software programs can reprogram the I/O APICs with a fixed routing algorithm that bypasses this piece of chipset logic. Windows does this by programming the APICs in an “interrupt one processor in the following set” routing mode.
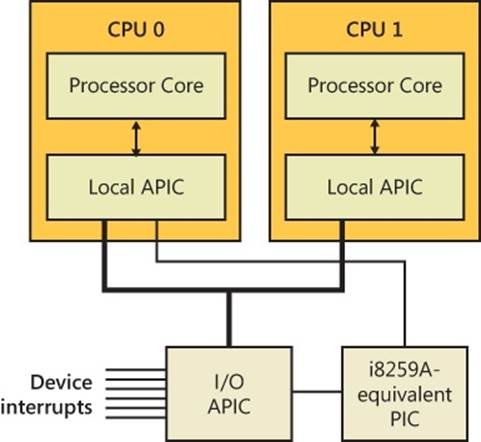
Figure 3-2. x86 APIC architecture
x64 Interrupt Controllers
Because the x64 architecture is compatible with x86 operating systems, x64 systems must provide the same interrupt controllers as the x86. A significant difference, however, is that the x64 versions of Windows will not run on systems that do not have an APIC because they use the APIC for interrupt control.
IA64 Interrupt Controllers
The IA64 architecture relies on the Streamlined Advanced Programmable Interrupt Controller (SAPIC), which is an evolution of the APIC. Even if load balancing and routing are present in the firmware, Windows does not take advantage of it; instead, it statically assigns interrupts to processors in a round-robin manner.
EXPERIMENT: VIEWING THE PIC AND APIC
You can view the configuration of the PIC on a uniprocessor and the current local APIC on a multiprocessor by using the !pic and !apic kernel debugger commands, respectively. Here’s the output of the !pic command on a uniprocessor. (Note that the !pic command doesn’t work if your system is using an APIC HAL.)
lkd> !pic
----- IRQ Number ----- 00 01 02 03 04 05 06 07 08 09 0A 0B 0C 0D 0E 0F
Physically in service: . . . . . . . . . . . . . . . .
Physically masked: . . . Y . . Y Y . . Y . . Y . .
Physically requested: . . . . . . . . . . . . . . . .
Level Triggered: . . . . . Y . . . Y . Y . . . .
Here’s the output of the !apic command on a system running with an APIC HAL. Note that during local kernel debugging, this command shows the APIC associated with the current processor—in other words, whichever processor the debugger’s thread happens to be running on as you enter the command. When looking at a crash dump or remote system, you can use the ~(tilde) command followed by the processor number to switch the processor of whose local APIC you want to see.
lkd> !apic
Apic @ fffe0000 ID:0 (50014) LogDesc:01000000 DestFmt:ffffffff TPR 20
TimeCnt: 00000000clk SpurVec:3f FaultVec:e3 error:0
Ipi Cmd: 01000000'0000002f Vec:2F FixedDel Ph:01000000 edg high
Timer..: 00000000'000300fd Vec:FD FixedDel Dest=Self edg high m
Linti0.: 00000000'0001003f Vec:3F FixedDel Dest=Self edg high m
Linti1.: 00000000'000004ff Vec:FF NMI Dest=Self edg high
TMR: 51-52, 62, A3, B1, B3
IRR:
ISR::
The various numbers following the Vec labels indicate the associated vector in the IDT with the given command. For example, in this output, interrupt number 0xFD is associated with the APIC Timer, and interrupt number 0xE3 handles APIC errors. Because this experiment was run on the same machine as the earlier !idt experiment, you can notice that 0xFD is the HAL’s Profiling Interrupt (which uses a timer for profile intervals), and 0xe3 is the HAL’s Local APIC Error Handler, as expected.
The following output is for the !ioapic command, which displays the configuration of the I/O APICs, the interrupt controller components connected to devices:
lkd> !ioapic
IoApic @ FEC00000 ID:0 (51) Arb:A951
Inti00.: 0000a951'0000a951 Vec:51 LowestDl Lg:0000a951 lvl low
Software Interrupt Request Levels (IRQLs)
Although interrupt controllers perform interrupt prioritization, Windows imposes its own interrupt priority scheme known as interrupt request levels (IRQLs). The kernel represents IRQLs internally as a number from 0 through 31 on x86 and from 0 to 15 on x64 and IA64, with higher numbers representing higher-priority interrupts. Although the kernel defines the standard set of IRQLs for software interrupts, the HAL maps hardware-interrupt numbers to the IRQLs. Figure 3-3 shows IRQLs defined for the x86 architecture, and Figure 3-4 shows IRQLs for the x64 and IA64 architectures.
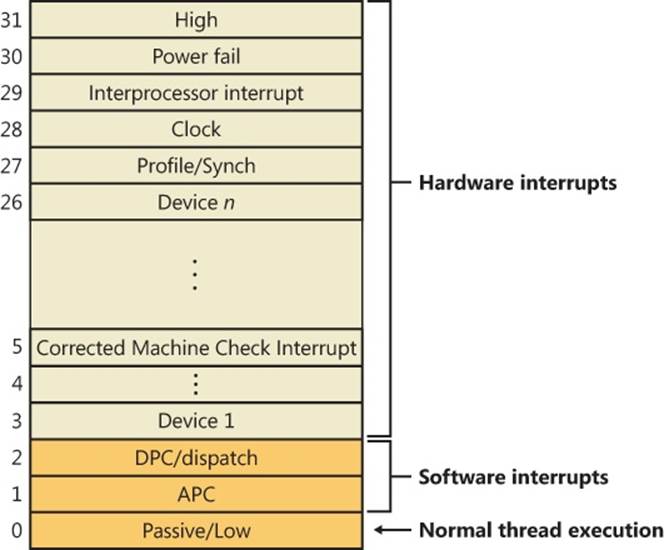
Figure 3-3. x86 interrupt request levels (IRQLs)
Interrupts are serviced in priority order, and a higher-priority interrupt preempts the servicing of a lower-priority interrupt. When a high-priority interrupt occurs, the processor saves the interrupted thread’s state and invokes the trap dispatchers associated with the interrupt. The trap dispatcher raises the IRQL and calls the interrupt’s service routine. After the service routine executes, the interrupt dispatcher lowers the processor’s IRQL to where it was before the interrupt occurred and then loads the saved machine state. The interrupted thread resumes executing where it left off. When the kernel lowers the IRQL, lower-priority interrupts that were masked might materialize. If this happens, the kernel repeats the process to handle the new interrupts.
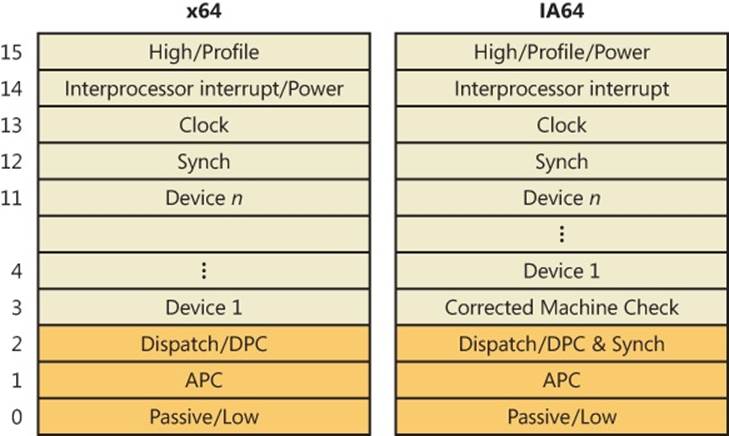
Figure 3-4. x64 and IA64 interrupt request levels (IRQLs)
IRQL priority levels have a completely different meaning than thread-scheduling priorities (which are described in Chapter 5). A scheduling priority is an attribute of a thread, whereas an IRQL is an attribute of an interrupt source, such as a keyboard or a mouse. In addition, each processor has an IRQL setting that changes as operating system code executes.
Each processor’s IRQL setting determines which interrupts that processor can receive. IRQLs are also used to synchronize access to kernel-mode data structures. (You’ll find out more about synchronization later in this chapter.) As a kernel-mode thread runs, it raises or lowers the processor’s IRQL either directly by calling KeRaiseIrql and KeLowerIrql or, more commonly, indirectly via calls to functions that acquire kernel synchronization objects. As Figure 3-5 illustrates, interrupts from a source with an IRQL above the current level interrupt the processor, whereas interrupts from sources with IRQLs equal to or below the current level are masked until an executing thread lowers the IRQL.
Because accessing a PIC is a relatively slow operation, HALs that require accessing the I/O bus to change IRQLs, such as for PIC and 32-bit Advanced Configuration and Power Interface (ACPI) systems, implement a performance optimization, called lazy IRQL, that avoids PIC accesses. When the IRQL is raised, the HAL notes the new IRQL internally instead of changing the interrupt mask. If a lower-priority interrupt subsequently occurs, the HAL sets the interrupt mask to the settings appropriate for the first interrupt and does not quiesce the lower-priority interrupt until the IRQL is lowered (thus keeping the interrupt pending). Thus, if no lower-priority interrupts occur while the IRQL is raised, the HAL doesn’t need to modify the PIC.
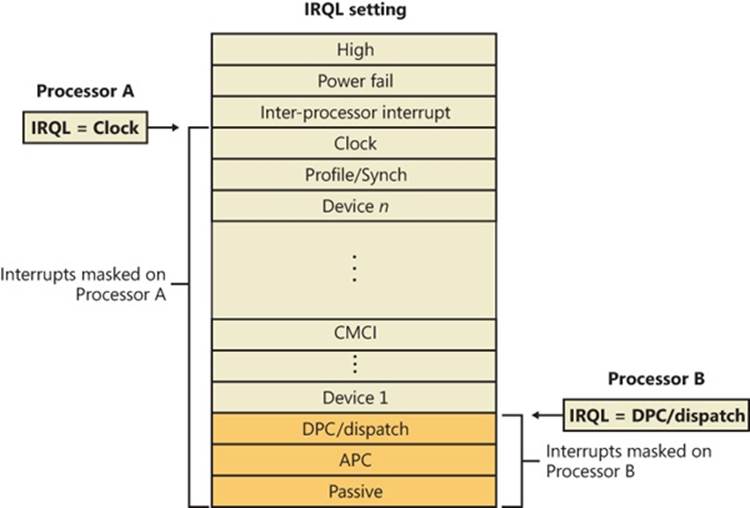
Figure 3-5. Masking interrupts
A kernel-mode thread raises and lowers the IRQL of the processor on which it’s running, depending on what it’s trying to do. For example, when an interrupt occurs, the trap handler (or perhaps the processor) raises the processor’s IRQL to the assigned IRQL of the interrupt source. This elevation masks all interrupts at and below that IRQL (on that processor only), which ensures that the processor servicing the interrupt isn’t waylaid by an interrupt at the same level or a lower level. The masked interrupts are either handled by another processor or held back until the IRQL drops. Therefore, all components of the system, including the kernel and device drivers, attempt to keep the IRQL at passive level (sometimes called low level). They do this because device drivers can respond to hardware interrupts in a timelier manner if the IRQL isn’t kept unnecessarily elevated for long periods.
NOTE
An exception to the rule that raising the IRQL blocks interrupts of that level and lower relates to APC-level interrupts. If a thread raises the IRQL to APC level and then is rescheduled because of a dispatch/DPC-level interrupt, the system might deliver an APC-level interrupt to the newly scheduled thread. Thus, APC level can be considered a thread-local rather than processor-wide IRQL.
EXPERIMENT: VIEWING THE IRQL
You can view a processor’s saved IRQL with the !irql debugger command. The saved IRQL represents the IRQL at the time just before the break-in to the debugger, which raises the IRQL to a static, meaningless value:
kd> !irql
Debugger saved IRQL for processor 0x0 -- 0 (LOW_LEVEL)
Note that the IRQL value is saved in two locations. The first, which represents the current IRQL, is the processor control region (PCR), while its extension, the processor region control block (PRCB), contains the saved IRQL in the DebuggerSaveIrql field. The PCR and PRCB contain information about the state of each processor in the system, such as the current IRQL, a pointer to the hardware IDT, the currently running thread, and the next thread selected to run. The kernel and the HAL use this information to perform architecture-specific and machine-specific actions. Portions of the PCR and PRCB structures are defined publicly in the Windows Driver Kit (WDK) header file Ntddk.h.
You can view the contents of the current processor’s PCR with the kernel debugger by using the !pcr command. To view the PCR of a specific processor, add the processor’s number after the command, separated with a space:
lkd> !pcr 0
KPCR for Processor 0 at fffff80001bfad00:
Major 1 Minor 1
NtTib.ExceptionList: fffff80001853000
NtTib.StackBase: fffff80001854080
NtTib.StackLimit: 000000000026ea28
NtTib.SubSystemTib: fffff80001bfad00
NtTib.Version: 0000000001bfae80
NtTib.UserPointer: fffff80001bfb4f0
NtTib.SelfTib: 000007fffffdb000
SelfPcr: 0000000000000000
Prcb: fffff80001bfae80
Irql: 0000000000000000
IRR: 0000000000000000
IDR: 0000000000000000
InterruptMode: 0000000000000000
IDT: 0000000000000000
GDT: 0000000000000000
TSS: 0000000000000000
CurrentThread: fffff80001c08c40
NextThread: 0000000000000000
IdleThread: fffff80001c08c40
DpcQueue:
Because changing a processor’s IRQL has such a significant effect on system operation, the change can be made only in kernel mode—user-mode threads can’t change the processor’s IRQL. This means that a processor’s IRQL is always at passive level when it’s executing user-mode code. Only when the processor is executing kernel-mode code can the IRQL be higher.
Each interrupt level has a specific purpose. For example, the kernel issues an interprocessor interrupt (IPI) to request that another processor perform an action, such as dispatching a particular thread for execution or updating its translation look-aside buffer (TLB) cache. The system clock generates an interrupt at regular intervals, and the kernel responds by updating the clock and measuring thread execution time. If a hardware platform supports two clocks, the kernel adds another clock interrupt level to measure performance. The HAL provides a number of interrupt levels for use by interrupt-driven devices; the exact number varies with the processor and system configuration. The kernel uses software interrupts (described later in this chapter) to initiate thread scheduling and to asynchronously break into a thread’s execution.
Mapping Interrupts to IRQLs
IRQL levels aren’t the same as the interrupt requests (IRQs) defined by interrupt controllers—the architectures on which Windows runs don’t implement the concept of IRQLs in hardware. So how does Windows determine what IRQL to assign to an interrupt? The answer lies in the HAL. In Windows, a type of device driver called a bus driver determines the presence of devices on its bus (PCI, USB, and so on) and what interrupts can be assigned to a device. The bus driver reports this information to the Plug and Play manager, which decides, after taking into account the acceptable interrupt assignments for all other devices, which interrupt will be assigned to each device. Then it calls a Plug and Play interrupt arbiter, which maps interrupts to IRQLs. (The root arbiter is used on non-ACPI systems, while the ACPI HAL has its own arbiter on ACPI-compatible systems.)
The algorithm for assignment differs for the various HALs that Windows includes. On ACPI systems (including x86, x64, and IA64), the HAL computes the IRQL for a given interrupt by dividing the interrupt vector assigned to the IRQ by 16. As for selecting an interrupt vector for the IRQ, this depends on the type of interrupt controller present on the system. On today’s APIC systems, this number is generated in a round-robin fashion, so there is no computable way to figure out the IRQ based on the interrupt vector or the IRQL. However, an experiment later in this section shows how the debugger can query this information from the interrupt arbiter.
Predefined IRQLs
Let’s take a closer look at the use of the predefined IRQLs, starting from the highest level shown in Figure 3-4:
§ The kernel uses high level only when it’s halting the system in KeBugCheckEx and masking out all interrupts.
§ Power fail level originated in the original Windows NT design documents, which specified the behavior of system power failure code, but this IRQL has never been used.
§ Interprocessor interrupt level is used to request another processor to perform an action, such as updating the processor’s TLB cache, system shutdown, or system crash.
§ Clock level is used for the system’s clock, which the kernel uses to track the time of day as well as to measure and allot CPU time to threads.
§ The system’s real-time clock (or another source, such as the local APIC timer) uses profile level when kernel profiling (a performance-measurement mechanism) is enabled. When kernel profiling is active, the kernel’s profiling trap handler records the address of the code that was executing when the interrupt occurred. A table of address samples is constructed over time that tools can extract and analyze. You can obtain Kernrate, a kernel profiling tool that you can use to configure and view profiling-generated statistics, from the Windows Driver Kit (WDK). See the Kernrate experiment for more information on using this tool.
§ The synchronization IRQL is internally used by the dispatcher and scheduler code to protect access to global thread scheduling and wait/synchronization code. It is typically defined as the highest level right after the device IRQLs.
§ The device IRQLs are used to prioritize device interrupts. (See the previous section for how hardware interrupt levels are mapped to IRQLs.)
§ The corrected machine check interrupt level is used to signal the operating system after a serious but corrected hardware condition or error that was reported by the CPU or firmware through the Machine Check Error (MCE) interface.
§ DPC/dispatch-level and APC-level interrupts are software interrupts that the kernel and device drivers generate. (DPCs and APCs are explained in more detail later in this chapter.)
§ The lowest IRQL, passive level, isn’t really an interrupt level at all; it’s the setting at which normal thread execution takes place and all interrupts are allowed to occur.
EXPERIMENT: USING KERNEL PROFILER (KERNRATE) TO PROFILE EXECUTION
You can use the Kernel Profiler tool (Kernrate) to enable the system-profiling timer, collect samples of the code that is executing when the timer fires, and display a summary showing the frequency distribution across image files and functions. It can be used to track CPU usage consumed by individual processes and/or time spent in kernel mode independent of processes (for example, interrupt service routines). Kernel profiling is useful when you want to obtain a breakdown of where the system is spending time.
In its simplest form, Kernrate samples where time has been spent in each kernel module (for example, Ntoskrnl, drivers, and so on). For example, after installing the Windows Driver Kit, try performing the following steps:
1. Open a command prompt.
2. Type cd C:\WinDDK\7600.16385.1\tools\other (the path to your installation of the Windows 7/Server 2008R2 WDK).
3. Type dir. (You will see directories for each platform.)
4. Run the image that matches your platform (with no arguments or switches). For example, i386\kernrate.exe is the image for an x86 system.
5. While Kernrate is running, perform some other activity on the system. For example, run Windows Media Player and play some music, run a graphics-intensive game, or perform network activity such as doing a directory listing of a remote network share.
6. Press Ctrl+C to stop Kernrate. This causes Kernrate to display the statistics from the sampling period.
In the following sample output from Kernrate, Windows Media Player was running, playing a recorded movie from disk:
C:\WinDDK\7600.16385.1\tools\Other\i386>kernrate.exe
/==============================\
< KERNRATE LOG >
\==============================/
Date: 2011/03/09 Time: 16:44:24
Machine Name: TEST-LAPTOP
Number of Processors: 2
PROCESSOR_ARCHITECTURE: x86
PROCESSOR_LEVEL: 6
PROCESSOR_REVISION: 0f06
Physical Memory: 3310 MB
Pagefile Total: 7285 MB
Virtual Total: 2047 MB
PageFile1: \??\C:\pagefile.sys, 4100MB
OS Version: 6.1 Build 7601 Service-Pack: 1.0
WinDir: C:\Windows
Kernrate Executable Location: C:\WINDDK\7600.16385.1\TOOLS\OTHER\I386
Kernrate User-Specified Command Line:
kernrate.exe
Kernel Profile (PID = 0): Source= Time,
Using Kernrate Default Rate of 25000 events/hit
Starting to collect profile data
***> Press ctrl-c to finish collecting profile data
===> Finished Collecting Data, Starting to Process Results
------------Overall Summary:--------------
P0 K 0:00:00.000 ( 0.0%) U 0:00:00.234 ( 4.7%) I 0:00:04.789 (95.3%)
DPC 0:00:00.000 ( 0.0%) Interrupt 0:00:00.000 ( 0.0%)
Interrupts= 9254, Interrupt Rate= 1842/sec.
P1 K 0:00:00.031 ( 0.6%) U 0:00:00.140 ( 2.8%) I 0:00:04.851 (96.6%)
DPC 0:00:00.000 ( 0.0%) Interrupt 0:00:00.000 ( 0.0%)
Interrupts= 7051, Interrupt Rate= 1404/sec.
TOTAL K 0:00:00.031 ( 0.3%) U 0:00:00.374 ( 3.7%) I 0:00:09.640 (96.0%)
DPC 0:00:00.000 ( 0.0%) Interrupt 0:00:00.000 ( 0.0%)
Total Interrupts= 16305, Total Interrupt Rate= 3246/sec.
Total Profile Time = 5023 msec
BytesStart BytesStop BytesDiff.
Available Physical Memory , 1716359168, 1716195328, -163840
Available Pagefile(s) , 5973733376, 5972783104, -950272
Available Virtual , 2122145792, 2122145792, 0
Available Extended Virtual , 0, 0, 0
Committed Memory Bytes , 1665404928, 1666355200, 950272
Non Paged Pool Usage Bytes , 66211840, 66211840, 0
Paged Pool Usage Bytes , 189083648, 189087744, 4096
Paged Pool Available Bytes , 150593536, 150593536, 0
Free System PTEs , 37322, 37322, 0
Total Avg. Rate
Context Switches , 30152, 6003/sec.
System Calls , 110807, 22059/sec.
Page Faults , 226, 45/sec.
I/O Read Operations , 730, 145/sec.
I/O Write Operations , 1038, 207/sec.
I/O Other Operations , 858, 171/sec.
I/O Read Bytes , 2013850, 2759/ I/O
I/O Write Bytes , 28212, 27/ I/O
I/O Other Bytes , 19902, 23/ I/O
-----------------------------
Results for Kernel Mode:
-----------------------------
OutputResults: KernelModuleCount = 167
Percentage in the following table is based on the Total Hits for the Kernel
Time 3814 hits, 25000 events per hit --------
Module Hits msec %Total Events/Sec
NTKRNLPA 3768 5036 98 % 18705321
NVLDDMKM 12 5036 0 % 59571
HAL 12 5036 0 % 59571
WIN32K 10 5037 0 % 49632
DXGKRNL 9 5036 0 % 44678
NETW4V32 2 5036 0 % 9928
FLTMGR 1 5036 0 % 4964
================================= END OF RUN ==================================
============================== NORMAL END OF RUN ==============================
The overall summary shows that the system spent 0.3 percent of the time in kernel mode, 3.7 percent in user mode, 96.0 percent idle, 0.0 percent at DPC level, and 0.0 percent at interrupt level. The module with the highest hit rate was Ntkrnlpa.exe, the kernel for machines with Physical Address Extension (PAE) or NX support. The module with the second highest hit rate was nvlddmkm.sys, the driver for the video card on the machine used for the test. This makes sense because the major activity going on in the system was Windows Media Player sending video I/O to the video driver.
If you have symbols available, you can zoom in on individual modules and see the time spent by function name. For example, profiling the system while rapidly dragging a window around the screen resulted in the following (partial) output:
C:\WinDDK\7600.16385.1\tools\Other\i386>kernrate.exe -z ntkrnlpa -z win32k
/==============================\
< KERNRATE LOG >
\==============================/
Date: 2011/03/09 Time: 16:49:56
Time 4191 hits, 25000 events per hit --------
Module Hits msec %Total Events/Sec
NTKRNLPA 3623 5695 86 % 15904302
WIN32K 303 5696 7 % 1329880
INTELPPM 141 5696 3 % 618855
HAL 61 5695 1 % 267778
CDD 30 5696 0 % 131671
NVLDDMKM 13 5696 0 % 57057
----- Zoomed module WIN32K.SYS (Bucket size = 16 bytes, Rounding Down) --------
Module Hits msec %Total Events/Sec
BltLnkReadPat 34 5696 10 % 149227
memmove 21 5696 6 % 92169
vSrcTranCopyS8D32 17 5696 5 % 74613
memcpy 12 5696 3 % 52668
RGNOBJ::bMerge 10 5696 3 % 43890
HANDLELOCK::vLockHandle 8 5696 2 % 35112
----- Zoomed module NTKRNLPA.EXE (Bucket size = 16 bytes, Rounding Down) --------
Module Hits msec %Total Events/Sec
KiIdleLoop 3288 5695 87 % 14433713
READ_REGISTER_USHORT 95 5695 2 % 417032
READ_REGISTER_ULONG 93 5695 2 % 408252
RtlFillMemoryUlong 31 5695 0 % 136084
KiFastCallEntry 18 5695 0 % 79016
The module with the second hit rate was Win32k.sys, the windowing system driver. Also high on the list were the video driver and Cdd.dll, a global video driver used for the 3D-accelerated Aero desktop theme. These results make sense because the main activity in the system was drawing on the screen. Note that in the zoomed display for Win32k.sys, the functions with the highest hits are related to merging, copying, and moving bits, the main GDI operations for painting a window dragged on the screen.
One important restriction on code running at DPC/dispatch level or above is that it can’t wait for an object if doing so necessitates the scheduler to select another thread to execute, which is an illegal operation because the scheduler relies on DPC-level software interrupts to schedule threads. Another restriction is that only nonpaged memory can be accessed at IRQL DPC/dispatch level or higher.
This rule is actually a side effect of the first restriction because attempting to access memory that isn’t resident results in a page fault. When a page fault occurs, the memory manager initiates a disk I/O and then needs to wait for the file system driver to read the page in from disk. This wait would, in turn, require the scheduler to perform a context switch (perhaps to the idle thread if no user thread is waiting to run), thus violating the rule that the scheduler can’t be invoked (because the IRQL is still DPC/dispatch level or higher at the time of the disk read). A further problem results in the fact that I/O completion typically occurs at APC_LEVEL, so even in cases where a wait wouldn’t be required, the I/O would never complete because the completion APC would not get a chance to run.
If either of these two restrictions is violated, the system crashes with an IRQL_NOT_LESS_OR_EQUAL or a DRIVER_IRQL_NOT_LESS_OR_EQUAL crash code. (See Chapter 14 in Part 2 for a thorough discussion of system crashes.) Violating these restrictions is a common bug in device drivers. The Windows Driver Verifier (explained in the section “Driver Verifier” in Chapter 10, “Memory Management,” in Part 2) has an option you can set to assist in finding this particular type of bug.
Interrupt Objects
The kernel provides a portable mechanism—a kernel control object called an interrupt object—that allows device drivers to register ISRs for their devices. An interrupt object contains all the information the kernel needs to associate a device ISR with a particular level of interrupt, including the address of the ISR, the IRQL at which the device interrupts, and the entry in the kernel’s interrupt dispatch table (IDT) with which the ISR should be associated. When an interrupt object is initialized, a few instructions of assembly language code, called the dispatch code, are copied from an interrupt-handling template, KiInterruptTemplate, and stored in the object. When an interrupt occurs, this code is executed.
This interrupt-object resident code calls the real interrupt dispatcher, which is typically either the kernel’s KiInterruptDispatch or KiChainedDispatch routine, passing it a pointer to the interrupt object. KiInterruptDispatch is the routine used for interrupt vectors for which only one interrupt object is registered, and KiChainedDispatch is for vectors shared among multiple interrupt objects. The interrupt object contains information that this second dispatcher routine needs to locate and properly call the ISR the device driver provides.
The interrupt object also stores the IRQL associated with the interrupt so that KiInterruptDispatch or KiChainedDispatch can raise the IRQL to the correct level before calling the ISR and then lower the IRQL after the ISR has returned. This two-step process is required because there’s no way to pass a pointer to the interrupt object (or any other argument for that matter) on the initial dispatch because the initial dispatch is done by hardware. On a multiprocessor system, the kernel allocates and initializes an interrupt object for each CPU, enabling the local APIC on that CPU to accept the particular interrupt.
On x64 Windows systems, the kernel optimizes interrupt dispatch by using specific routines that save processor cycles by omitting functionality that isn’t needed, such as KiInterruptDispatchNoLock, which is used for interrupts that do not have an associated kernel-managed spinlock (typically used by drivers that want to synchronize with their ISRs), and KiInterruptDispatchNoEOI, which is used for interrupts that have programmed the APIC in “Auto-End-of-Interrupt” (Auto-EOI) mode—because the interrupt controller will send the EOI signal automatically, the kernel does not need to the extra code to do perform the EOI itself. Finally, for the performance/profiling interrupt specifically, the KiInterruptDispatchLBControl handler is used, which supports the Last Branch Control MSR available on modern CPUs. This register enables the kernel to track/save the branch instruction when tracing; during an interrupt, this information would be lost because it’s not stored in the normal thread register context, so special code must be added to preserve it. The HAL’s performance and profiling interrupts use this functionality, for example, while the other HAL interrupt routines take advantage of the “no-lock” dispatch code, because the HAL does not require the kernel to synchronize with its ISR.
Another kernel interrupt handler is KiFloatingDispatch, which is used for interrupts that require saving the floating-point state. Unlike kernel-mode code, which typically is not allowed to use floating-point (MMX, SSE, 3DNow!) operations because these registers won’t be saved across context switches, ISRs might need to use these registers (such as the video card ISR performing a quick drawing operation). When connecting an interrupt, drivers can set the FloatingSave argument to TRUE, requesting that the kernel use the floating-point dispatch routine, which will save the floating registers. (However, this greatly increases interrupt latency.) Note that this is supported only on 32-bit systems.
Figure 3-6 shows typical interrupt control flow for interrupts associated with interrupt objects.
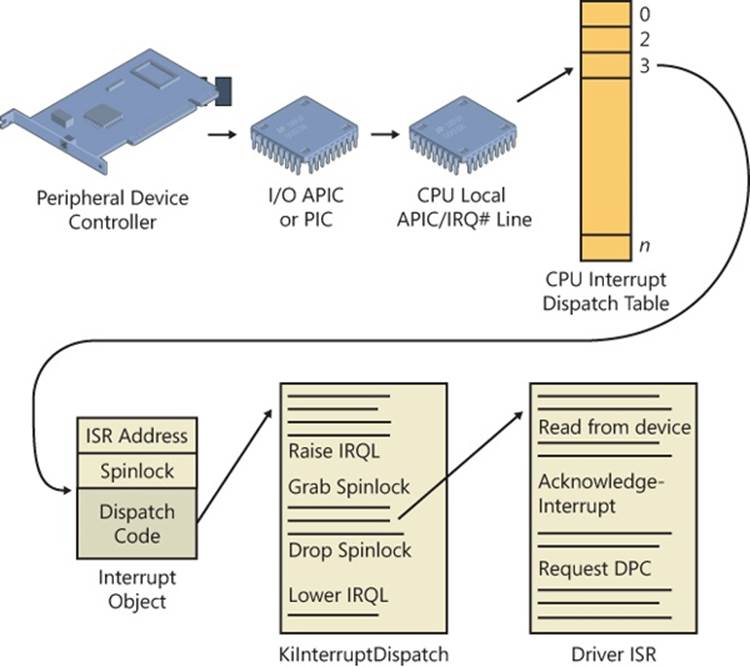
Figure 3-6. Typical interrupt control flow
EXPERIMENT: EXAMINING INTERRUPT INTERNALS
Using the kernel debugger, you can view details of an interrupt object, including its IRQL, ISR address, and custom interrupt-dispatching code. First, execute the !idt command and locate the entry that includes a reference to I8042KeyboardInterruptService, the ISR routine for the PS2 keyboard device:
81: fffffa80045bae10 i8042prt!I8042KeyboardInterruptService (KINTERRUPT
fffffa80045bad80)
To view the contents of the interrupt object associated with the interrupt, execute dt nt!_kinterrupt with the address following KINTERRUPT:
lkd> dt nt!_KINTERRUPT fffffa80045bad80
+0x000 Type : 22
+0x002 Size : 160
+0x008 InterruptListEntry : _LIST_ENTRY [ 0x00000000'00000000 - 0x0 ]
+0x018 ServiceRoutine : 0xfffff880'0356ca04 unsigned char
i8042prt!I8042KeyboardInterruptService+0
+0x020 MessageServiceRoutine : (null)
+0x028 MessageIndex : 0
+0x030 ServiceContext : 0xfffffa80'02c839f0
+0x038 SpinLock : 0
+0x040 TickCount : 0
+0x048 ActualLock : 0xfffffa80'02c83b50 -> 0
+0x050 DispatchAddress : 0xfffff800'01a7db90 void nt!KiInterruptDispatch+0
+0x058 Vector : 0x81
+0x05c Irql : 0x8 ''
+0x05d SynchronizeIrql : 0x9 ''
+0x05e FloatingSave : 0 ''
+0x05f Connected : 0x1 ''
+0x060 Number : 0
+0x064 ShareVector : 0 ''
+0x065 Pad : [3] ""
+0x068 Mode : 1 ( Latched )
+0x06c Polarity : 0 ( InterruptPolarityUnknown )
+0x070 ServiceCount : 0
+0x074 DispatchCount : 0
+0x078 Rsvd1 : 0
+0x080 TrapFrame : 0xfffff800'0185ab00 _KTRAP_FRAME
+0x088 Reserved : (null)
+0x090 DispatchCode : [4] 0x8d485550
In this example, the IRQL that Windows assigned to the interrupt is 8. Although there is no direct mapping between an interrupt vector and an IRQ, Windows does keep track of this translation when managing device resources through what are called arbiters. For each resource type, an arbiter maintains the relationship between virtual resource usage (such as an interrupt vector) and physical resources (such as an interrupt line). As such, you can query either the root IRQ arbiter (on systems without ACPI) or the ACPI IRQ arbiter and obtain this mapping. Use the !apciirqarb command to obtain information on the ACPI IRQ arbiter:
lkd> !acpiirqarb
Processor 0 (0, 0):
Device Object: 0000000000000000
Current IDT Allocation:
...
0000000000000081 - 0000000000000081 D fffffa80029b4c20 (i8042prt)
A:0000000000000000 IRQ:0
...
If you don’t have an ACPI system, you can use !arbiter 4 (4 tells the debugger to display only IRQ arbiters):
lkd> !arbiter 4
DEVNODE fffffa80027c6d90 (HTREE\ROOT\0)
Interrupt Arbiter "RootIRQ" at fffff80001c82500
Allocated ranges:
0000000000000081 - 0000000000000081 Owner fffffa80029b4c20 (i8042prt)
In both cases, you will be given the owner of the vector, in the type of a device object. You can then use the !devobj command to get information on the i8042prt device in this example (which corresponds to the PS/2 driver):
lkd> !devobj fffffa80029b4c20
Device object (fffffa80029b4c20) is for:
00000061 \Driver\ACPI DriverObject fffffa8002888e70
Current Irp 00000000 RefCount 1 Type 00000032 Flags 00003040
Dacl fffff9a100096a41 DevExt fffffa800299f740 DevObjExt fffffa80029b4d70 DevNode fffffa80029b54b0
The device object is associated to a device node, which stores all the device's physical resources.
You can now dump these resources with the !devnode command, and using the 6 flag to ask
for resource information:
lkd> !devnode fffffa80029b54b0 6
DevNode 0xfffffa80029b54b0 for PDO 0xfffffa80029b4c20
Parent 0xfffffa800299b390 Sibling 0xfffffa80029b5230 Child 0000000000
InstancePath is "ACPI\PNP0303\4&17aa870d&0"
ServiceName is "i8042prt"
...
CmResourceList at 0xfffff8a00185bf40 Version 1.1 Interface 0xf Bus #0
Entry 0 - Port (0x1) Device Exclusive (0x1)
Flags (0x11) - PORT_MEMORY PORT_IO 16_BIT_DECODE
Range starts at 0x60 for 0x1 bytes
Entry 1 - Port (0x1) Device Exclusive (0x1)
Flags (0x11) - PORT_MEMORY PORT_IO 16_BIT_DECODE
Range starts at 0x64 for 0x1 bytes
Entry 2 - Port (0x1) Device Exclusive (0x1)
Flags (0x11) - PORT_MEMORY PORT_IO 16_BIT_DECODE
Range starts at 0x62 for 0x1 bytes
Entry 3 - Port (0x1) Device Exclusive (0x1)
Flags (0x11) - PORT_MEMORY PORT_IO 16_BIT_DECODE
Range starts at 0x66 for 0x1 bytes
Entry 4 - Interrupt (0x2) Device Exclusive (0x1)
Flags (0x01) - LATCHED
Level 0x1, Vector 0x1, Group 0, Affinity 0xffffffff
The device node tells you that this device has a resource list with 4 entries, one of which is an interrupt entry corresponding to IRQ 1. (The level and vector numbers represent the IRQ vector, not the interrupt vector.) IRQ 1 is the traditional PC/AT IRQ number associated with the PS/2 keyboard device, so this is the expected value. (A USB keyboard would have a different interrupt.)
On ACPI systems, you can obtain this information in a slightly easier way by reading the extended output of the !acpiirqarb command introduced earlier. As part of its output, it displays the IRQ to IDT mapping table:
Interrupt Controller (Inputs: 0x0-0x17 Dev: 0000000000000000):
(00)Cur:IDT-a1 Ref-1 edg hi Pos:IDT-00 Ref-0 edg hi
(01)Cur:IDT-81 Ref-1 edg hi Pos:IDT-00 Ref-0 edg hi
(02)Cur:IDT-00 Ref-0 edg hi Pos:IDT-00 Ref-0 edg hi
(03)Cur:IDT-00 Ref-0 edg hi Pos:IDT-00 Ref-0 edg hi
(04)Cur:IDT-00 Ref-0 edg hi Pos:IDT-00 Ref-0 edg hi
(05)Cur:IDT-00 Ref-0 edg hi Pos:IDT-00 Ref-0 edg hi
(06)Cur:IDT-00 Ref-0 edg hi Pos:IDT-00 Ref-0 edg hi
(07)Cur:IDT-00 Ref-0 edg hi Pos:IDT-00 Ref-0 edg hi
(08)Cur:IDT-71 Ref-1 edg hi Pos:IDT-00 Ref-0 edg hi
(09)Cur:IDT-b1 Ref-1 lev hi Pos:IDT-00 Ref-0 edg hi
(0a)Cur:IDT-00 Ref-0 edg hi Pos:IDT-00 Ref-0 edg hi
(0b)Cur:IDT-00 Ref-0 edg hi Pos:IDT-00 Ref-0 edg hi
(0c)Cur:IDT-91 Ref-1 edg hi Pos:IDT-00 Ref-0 edg hi
(0d)Cur:IDT-61 Ref-1 edg hi Pos:IDT-00 Ref-0 edg hi
(0e)Cur:IDT-82 Ref-1 edg hi Pos:IDT-00 Ref-0 edg hi
(0f)Cur:IDT-72 Ref-1 edg hi Pos:IDT-00 Ref-0 edg hi
(10)Cur:IDT-51 Ref-3 lev low Pos:IDT-00 Ref-0 edg hi
(11)Cur:IDT-b2 Ref-1 lev low Pos:IDT-00 Ref-0 edg hi
(12)Cur:IDT-a2 Ref-5 lev low Pos:IDT-00 Ref-0 edg hi
(13)Cur:IDT-92 Ref-1 lev low Pos:IDT-00 Ref-0 edg hi
(14)Cur:IDT-62 Ref-2 lev low Pos:IDT-00 Ref-0 edg hi
(15)Cur:IDT-a3 Ref-2 lev low Pos:IDT-00 Ref-0 edg hi
(16)Cur:IDT-b3 Ref-1 lev low Pos:IDT-00 Ref-0 edg hi
(17)Cur:IDT-52 Ref-1 lev low Pos:IDT-00 Ref-0 edg hi
As expected, IRQ 1 is associated with IDT entry 0x81. For more information on device objects, resources, and other related concepts, see Chapter 8, “I/O System,” in Part 2.
The ISR’s address for the interrupt object is stored in the ServiceRoutine field (which is what !idt displays in its output), and the interrupt code that actually executes when an interrupt occurs is stored in the DispatchCode array at the end of the interrupt object. The interrupt code stored there is programmed to build the trap frame on the stack and then call the function stored in theDispatchAddress field (KiInterruptDispatch in the example), passing it a pointer to the interrupt object.
WINDOWS AND REAL-TIME PROCESSING
Deadline requirements, either hard or soft, characterize real-time environments. Hard real-time systems (for example, a nuclear power plant control system) have deadlines the system must meet to avoid catastrophic failures, such as loss of equipment or life. Soft real-time systems (for example, a car’s fuel-economy optimization system) have deadlines the system can miss, but timeliness is still a desirable trait. In real-time systems, computers have sensor input devices and control output devices. The designer of a real-time computer system must know worst-case delays between the time an input device generates an interrupt and the time the device’s driver can control the output device to respond. This worst-case analysis must take into account the delays the operating system introduces as well as the delays the application and device drivers impose.
Because Windows doesn’t enable controlled prioritization of device IRQs and user-level applications execute only when a processor’s IRQL is at passive level, Windows isn’t typically suitable as a real-time operating system. The system’s devices and device drivers—not Windows—ultimately determine the worst-case delay. This factor becomes a problem when the real-time system’s designer uses off-the-shelf hardware. The designer can have difficulty determining how long every off-the-shelf device’s ISR or DPC might take in the worst case. Even after testing, the designer can’t guarantee that a special case in a live system won’t cause the system to miss an important deadline. Furthermore, the sum of all the delays a system’s DPCs and ISRs can introduce usually far exceeds the tolerance of a time-sensitive system.
Although many types of embedded systems (for example, printers and automotive computers) have real-time requirements, Windows Embedded Standard 7 doesn’t have real-time characteristics. It is simply a version of Windows 7 that makes it possible to produce small-footprint versions of Windows 7 suitable for running on devices with limited resources. For example, a device that has no networking capability would omit all the Windows 7 components related to networking, including network management tools and adapter and protocol stack device drivers.
Still, there are third-party vendors that supply real-time kernels for Windows. The approach these vendors take is to embed their real-time kernel in a custom HAL and to have Windows run as a task in the real-time operating system. The task running Windows serves as the user interface to the system and has a lower priority than the tasks responsible for managing the device.
Associating an ISR with a particular level of interrupt is called connecting an interrupt object, and dissociating an ISR from an IDT entry is called disconnecting an interrupt object. These operations, accomplished by calling the kernel functions IoConnectInterruptEx andIoDisconnectInterruptEx, allow a device driver to “turn on” an ISR when the driver is loaded into the system and to “turn off” the ISR if the driver is unloaded.
Using the interrupt object to register an ISR prevents device drivers from fiddling directly with interrupt hardware (which differs among processor architectures) and from needing to know any details about the IDT. This kernel feature aids in creating portable device drivers because it eliminates the need to code in assembly language or to reflect processor differences in device drivers.
Interrupt objects provide other benefits as well. By using the interrupt object, the kernel can synchronize the execution of the ISR with other parts of a device driver that might share data with the ISR. (See Chapter 8 in Part 2 for more information about how device drivers respond to interrupts.)
Furthermore, interrupt objects allow the kernel to easily call more than one ISR for any interrupt level. If multiple device drivers create interrupt objects and connect them to the same IDT entry, the interrupt dispatcher calls each routine when an interrupt occurs at the specified interrupt line. This capability allows the kernel to easily support daisy-chain configurations, in which several devices share the same interrupt line. The chain breaks when one of the ISRs claims ownership for the interrupt by returning a status to the interrupt dispatcher.
If multiple devices sharing the same interrupt require service at the same time, devices not acknowledged by their ISRs will interrupt the system again once the interrupt dispatcher has lowered the IRQL. Chaining is permitted only if all the device drivers wanting to use the same interrupt indicate to the kernel that they can share the interrupt; if they can’t, the Plug and Play manager reorganizes their interrupt assignments to ensure that it honors the sharing requirements of each. If the interrupt vector is shared, the interrupt object invokes KiChainedDispatch, which will invoke the ISRs of each registered interrupt object in turn until one of them claims the interrupt or all have been executed. In the earlier sample !idt output (in the EXPERIMENT: Viewing the IDT section), vector 0xa2 is connected to several chained interrupt objects. On the system it was run on, it happens to correspond to an integrated 7-in-1 media card reader, which is a combination of Secure Digital (SD), Compact Flash (CF), MultiMedia Card (MMC) and other types of readers, each having their individual interrupt. Because it’s packaged as one device by the same vendor, it makes sense that its interrupts share the same vector.
LINE-BASED VS. MESSAGE SIGNALED-BASED INTERRUPTS
Shared interrupts are often the cause of high interrupt latency and can also cause stability issues. They are typically undesirable and a side effect of the limited number of physical interrupt lines on a computer. For example, in the previous example of the 7-in-1 media card reader, a much better solution is for each device to have its own interrupt and for one driver to manage the different interrupts knowing which device they came from. However, consuming four IRQ lines for a single device quickly leads to IRQ line exhaustion. Additionally, PCI devices are each connected to only one IRQ line anyway, so the media card reader cannot use more than one IRQ in the first place.
Other problems with generating interrupts through an IRQ line is that incorrect management of the IRQ signal can lead to interrupt storms or other kinds of deadlocks on the machine, because the signal is driven “high” or “low” until the ISR acknowledges it. (Furthermore, the interrupt controller must typically receive an EOI signal as well.) If either of these does not happen due to a bug, the system can end up in an interrupt state forever, further interrupts could be masked away, or both. Finally, line-based interrupts provide poor scalability in multiprocessor environments. In many cases, the hardware has the final decision as to which processor will be interrupted out of the possible set that the Plug and Play manager selected for this interrupt, and there is little device drivers can do.
A solution to all these problems is a new interrupt mechanism first introduced in the PCI 2.2 standard called message-signaled interrupts (MSI). Although it remains an optional component of the standard that is seldom found in client machines, an increasing number of servers and workstations implement MSI support, which is fully supported by the all recent versions of Windows. In the MSI model, a device delivers a message to its driver by writing to a specific memory address. This action causes an interrupt, and Windows then calls the ISR with the message content (value) and the address where the message was delivered. A device can also deliver multiple messages (up to 32) to the memory address, delivering different payloads based on the event.
Because communication is based across a memory value, and because the content is delivered with the interrupt, the need for IRQ lines is removed (making the total system limit of MSIs equal to the number of interrupt vectors, not IRQ lines), as is the need for a driver ISR to query the device for data related to the interrupt, decreasing latency. Due to the large number of device interrupts available through this model, this effectively nullifies any benefit of sharing interrupts, decreasing latency further by directly delivering the interrupt data to the concerned ISR.
Finally, MSI-X, an extension to the MSI model, which is introduced in PCI 3.0, adds support for 32-bit messages (instead of 16-bit), a maximum of 2048 different messages (instead of just 32), and more importantly, the ability to use a different address (which can be dynamically determined) for each of the MSI payloads. Using a different address allows the MSI payload to be written to a different physical address range that belongs to a different processor, or a different set of target processors, effectively enabling nonuniform memory access (NUMA)-aware interrupt delivery by sending the interrupt to the processor that initiated the related device request. This improves latency and scalability by monitoring both load and closest NUMA node during interrupt completion.
INTERRUPT AFFINITY AND PRIORITY
On systems that both support ACPI and contain an APIC, Windows enables driver developers and administrators to somewhat control the processor affinity (selecting the processor or group of processors that receives the interrupt) and affinity policy (selecting how processors will be chosen and which processors in a group will be chosen). Furthermore, it enables a primitivemechanism of interrupt prioritization based on IRQL selection. Affinity policy is defined according to Table 3-1, and it’s configurable through a registry value called InterruptPolicyValue in the Interrupt Management\Affinity Policy key under the device’s instance key in the registry. Because of this, it does not require any code to configure—an administrator can add this value to a given driver’s key to influence its behavior. Microsoft provides such a tool, called the Interrupt Affinity policy Tool, which can be downloaded from http://www.microsoft.com/whdc/system/sysperf/intpolicy.mspx.
TABLE 3-1. IRQ AFFINITY POLICIES
|
Policy |
Meaning |
|
IrqPolicyMachineDefault |
The device does not require a particular affinity policy. Windows uses the default machine policy, which (for machines with less than eight logical processors) is to select any available processor on the machine. |
|
IrqPolicyAllCloseProcessors |
On a NUMA machjne, the Plug and Play manager assigns the interrupt to all the processors that are close to the device (on the same node). On non-NUMA machines, this is the same as IrqPolicyAllProcessorsInMachine. |
|
IrqPolicyOneCloseProcessor |
On a NUMA machjne, the Plug and Play manager assigns the interrupt to one processor that is close to the device (on the same node). On non-NUMA machines, the chosen processor will be any available on the system. |
|
IrqPolicyAllProcessorsInMachine |
The interrupt is processed by any available processor on the machine. |
|
IrqPolicySpecifiedProcessors |
The interrupt is processed only by one of the processors specified in the affinity mask under the AssignmentSetOverride registry value. |
|
IrqPolicySpreadMessagesAcrossAllProcessors |
Different message-signaled interrupts are distributed across an optimal set of eligible processors, keeping track of NUMA topology issues, if possible. This requires MSI-X support on the device and platform. |
Other than setting this affinity policy, another registry value can also be used to set the interrupt’s priority, based on the values in Table 3-2.
TABLE 3-2. IRQ PRIORITIES
|
Priority |
Meaning |
|
IrqPriorityUndefined |
No particular priority is required by the device. It receives the default priority (IrqPriorityNormal). |
|
IrqPriorityLow |
The device can tolerate high latency and should receive a lower IRQL than usual. |
|
IrqPriorityNormal |
The device expects average latency. It receives the default IRQL associated with its interrupt vector. |
|
IrqPriorityHigh |
The device requires as little latency as possible. It receives an elevated IRQL beyond its normal assignment. |
As discussed earlier, it is important to note that Windows is not a real-time operating system, and as such, these IRQ priorities are hints given to the system that control only the IRQL associated with the interrupt and provide no extra priority other than the Windows IRQL priority-scheme mechanism. Because the IRQ priority is also stored in the registry, administrators are free to set these values for drivers should there be a requirement of lower latency for a driver not taking advantage of this feature.
Software Interrupts
Although hardware generates most interrupts, the Windows kernel also generates software interrupts for a variety of tasks, including these:
§ Initiating thread dispatching
§ Non-time-critical interrupt processing
§ Handling timer expiration
§ Asynchronously executing a procedure in the context of a particular thread
§ Supporting asynchronous I/O operations
These tasks are described in the following subsections.
Dispatch or Deferred Procedure Call (DPC) Interrupts
When a thread can no longer continue executing, perhaps because it has terminated or because it voluntarily enters a wait state, the kernel calls the dispatcher directly to effect an immediate context switch. Sometimes, however, the kernel detects that rescheduling should occur when it is deep within many layers of code. In this situation, the kernel requests dispatching but defers its occurrence until it completes its current activity. Using a DPC software interrupt is a convenient way to achieve this delay.
The kernel always raises the processor’s IRQL to DPC/dispatch level or above when it needs to synchronize access to shared kernel structures. This disables additional software interrupts and thread dispatching. When the kernel detects that dispatching should occur, it requests a DPC/dispatch-level interrupt; but because the IRQL is at or above that level, the processor holds the interrupt in check. When the kernel completes its current activity, it sees that it’s going to lower the IRQL below DPC/dispatch level and checks to see whether any dispatch interrupts are pending. If there are, the IRQL drops to DPC/dispatch level and the dispatch interrupts are processed. Activating the thread dispatcher by using a software interrupt is a way to defer dispatching until conditions are right. However, Windows uses software interrupts to defer other types of processing as well.
In addition to thread dispatching, the kernel also processes deferred procedure calls (DPCs) at this IRQL. A DPC is a function that performs a system task—a task that is less time-critical than the current one. The functions are called deferred because they might not execute immediately.
DPCs provide the operating system with the capability to generate an interrupt and execute a system function in kernel mode. The kernel uses DPCs to process timer expiration (and release threads waiting for the timers) and to reschedule the processor after a thread’s quantum expires. Device drivers use DPCs to process interrupts. To provide timely service for hardware interrupts, Windows—with the cooperation of device drivers—attempts to keep the IRQL below device IRQL levels. One way that this goal is achieved is for device driver ISRs to perform the minimal work necessary to acknowledge their device, save volatile interrupt state, and defer data transfer or other less time-critical interrupt processing activity for execution in a DPC at DPC/dispatch IRQL. (See Chapter 8 in Part 2 for more information on DPCs and the I/O system.)
A DPC is represented by a DPC object, a kernel control object that is not visible to user-mode programs but is visible to device drivers and other system code. The most important piece of information the DPC object contains is the address of the system function that the kernel will call when it processes the DPC interrupt. DPC routines that are waiting to execute are stored in kernel-managed queues, one per processor, called DPC queues. To request a DPC, system code calls the kernel to initialize a DPC object and then places it in a DPC queue.
By default, the kernel places DPC objects at the end of the DPC queue of the processor on which the DPC was requested (typically the processor on which the ISR executed). A device driver can override this behavior, however, by specifying a DPC priority (low, medium, medium-high, or high, where medium is the default) and by targeting the DPC at a particular processor. A DPC aimed at a specific CPU is known as a targeted DPC. If the DPC has a high priority, the kernel inserts the DPC object at the front of the queue; otherwise, it is placed at the end of the queue for all other priorities.
When the processor’s IRQL is about to drop from an IRQL of DPC/dispatch level or higher to a lower IRQL (APC or passive level), the kernel processes DPCs. Windows ensures that the IRQL remains at DPC/dispatch level and pulls DPC objects off the current processor’s queue until the queue is empty (that is, the kernel “drains” the queue), calling each DPC function in turn. Only when the queue is empty will the kernel let the IRQL drop below DPC/dispatch level and let regular thread execution continue. DPC processing is depicted in Figure 3-7.
DPC priorities can affect system behavior another way. The kernel usually initiates DPC queue draining with a DPC/dispatch-level interrupt. The kernel generates such an interrupt only if the DPC is directed at the current processor (the one on which the ISR executes) and the DPC has a priority higher than low. If the DPC has a low priority, the kernel requests the interrupt only if the number of outstanding DPC requests for the processor rises above a threshold or if the number of DPCs requested on the processor within a time window is low.
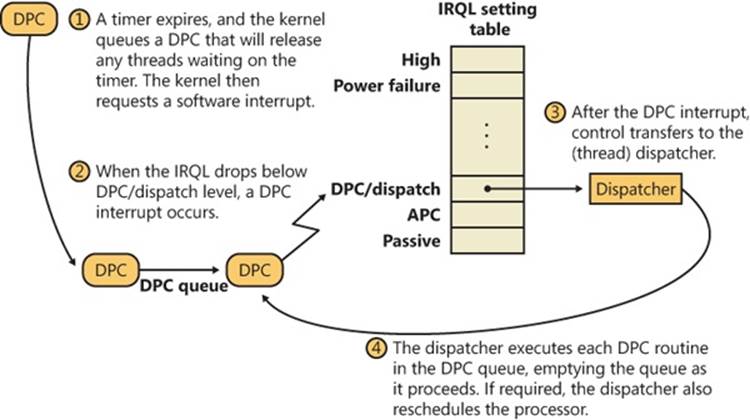
Figure 3-7. Delivering a DPC
If a DPC is targeted at a CPU different from the one on which the ISR is running and the DPC’s priority is either high or medium-high, the kernel immediately signals the target CPU (by sending it a dispatch IPI) to drain its DPC queue, but only as long as the target processor is idle. If the priority is medium or low, the number of DPCs queued on the target processor must exceed a threshold for the kernel to trigger a DPC/dispatch interrupt. The system idle thread also drains the DPC queue for the processor it runs on. Although DPC targeting and priority levels are flexible, device drivers rarely need to change the default behavior of their DPC objects. Table 3-3 summarizes the situations that initiate DPC queue draining. Medium-high and high appear and are, in fact, equal priorities when looking at the generation rules. The difference comes from their insertion in the list, with high interrupts being at the head and medium-high interrupts at the tail.
Table 3-3. DPC Interrupt Generation Rules
|
DPC Priority |
DPC Targeted at ISR’s Processor |
DPC Targeted at Another Processor |
|
Low |
DPC queue length exceeds maximum DPC queue length, or DPC request rate is less than minimum DPC request rate |
DPC queue length exceeds maximum DPC queue length, or system is idle |
|
Medium |
Always |
DPC queue length exceeds maximum DPC queue length, or system is idle |
|
Medium-High |
Always |
Target processor is idle |
|
High |
Always |
Target processor is idle |
Because user-mode threads execute at low IRQL, the chances are good that a DPC will interrupt the execution of an ordinary user’s thread. DPC routines execute without regard to what thread is running, meaning that when a DPC routine runs, it can’t assume what process address space is currently mapped. DPC routines can call kernel functions, but they can’t call system services, generate page faults, or create or wait for dispatcher objects (explained later in this chapter). They can, however, access nonpaged system memory addresses, because system address space is always mapped regardless of what the current process is.
DPCs are provided primarily for device drivers, but the kernel uses them too. The kernel most frequently uses a DPC to handle quantum expiration. At every tick of the system clock, an interrupt occurs at clock IRQL. The clock interrupt handler (running at clock IRQL) updates the system time and then decrements a counter that tracks how long the current thread has run. When the counter reaches 0, the thread’s time quantum has expired and the kernel might need to reschedule the processor, a lower-priority task that should be done at DPC/dispatch IRQL. The clock interrupt handler queues a DPC to initiate thread dispatching and then finishes its work and lowers the processor’s IRQL. Because the DPC interrupt has a lower priority than do device interrupts, any pending device interrupts that surface before the clock interrupt completes are handled before the DPC interrupt occurs.
Because DPCs execute regardless of whichever thread is currently running on the system (much like interrupts), they are a primary cause for perceived system unresponsiveness of client systems or workstation workloads because even the highest-priority thread will be interrupted by a pending DPC. Some DPCs run long enough that users might perceive video or sound lagging, and even abnormal mouse or keyboard latencies, so for the benefit of drivers with long-running DPCs, Windows supports threaded DPCs.
Threaded DPCs, as their name implies, function by executing the DPC routine at passive level on a real-time priority (priority 31) thread. This allows the DPC to preempt most user-mode threads (because most application threads don’t run at real-time priority ranges), but it allows other interrupts, nonthreaded DPCs, APCs, and higher-priority threads to preempt the routine.
The threaded DPC mechanism is enabled by default, but you can disable it by adding a DWORD value HKEY_LOCAL_MACHINE\System\CurrentControlSet\Control\Session Manager\kernel\ThreadDpcEnable and setting it to 0. Because threaded DPCs can be disabled, driver developers who make use of threaded DPCs must write their routines following the same rules as for nonthreaded DPC routines and cannot access paged memory, perform dispatcher waits, or make assumptions about the IRQL level at which they are executing. In addition, they must not use the KeAcquire/ReleaseSpinLockAtDpcLevel APIs because the functions assume the CPU is at dispatch level. Instead, threaded DPCs must use KeAcquire/ReleaseSpinLockForDpc, which performs the appropriate action after checking the current IRQL.
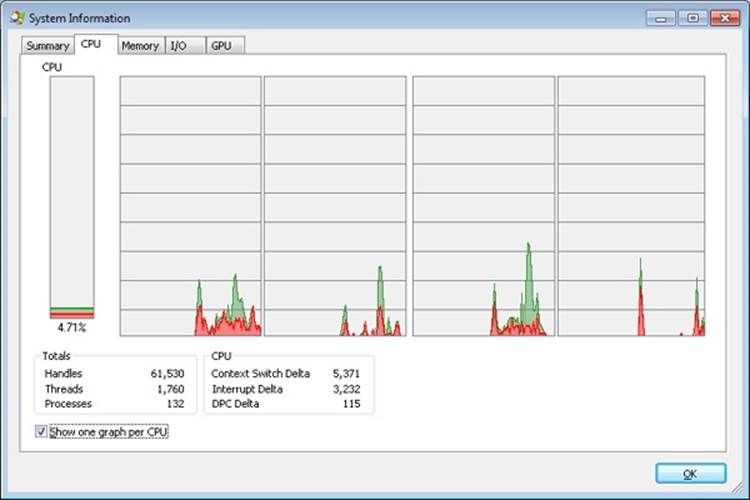
EXPERIMENT: MONITORING INTERRUPT AND DPC ACTIVITY
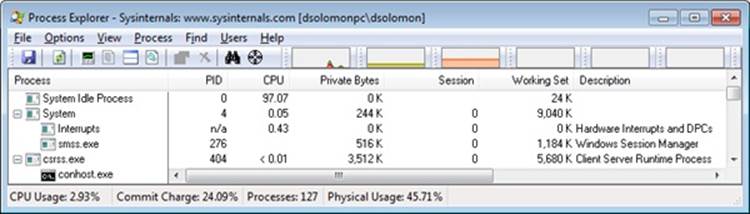
You can use Process Explorer to monitor interrupt and DPC activity by opening the System Information dialog and switching to the CPU tab, where it lists the number of interrupts and DPCs executed each time Process Explorer refreshes the display (1 second by default):
You can also trace the execution of specific interrupt service routines and deferred procedure calls with the built-in event tracing support (described later in this chapter):
1. Start capturing events by opening an elevated command prompt, navigating to the Microsoft Windows Performance Toolkit directory (typically in c:\Program Files) and typing the following command (make sure no other program is capturing events, such as Process Explorer or Process Monitor, or this will fail with an error):
xperf –on PROC_THREAD+LOADER+DPC+INTERRUPT
2. Stop capturing events by typing the following:
xperf –d dpcisr.etl
3. Generate reports for the event capture by typing this:
4. xperf dpcisr.etl
tracerpt \kernel.etl –report dpcisr.html –f html
This will generate a web page called dpcisr.html.
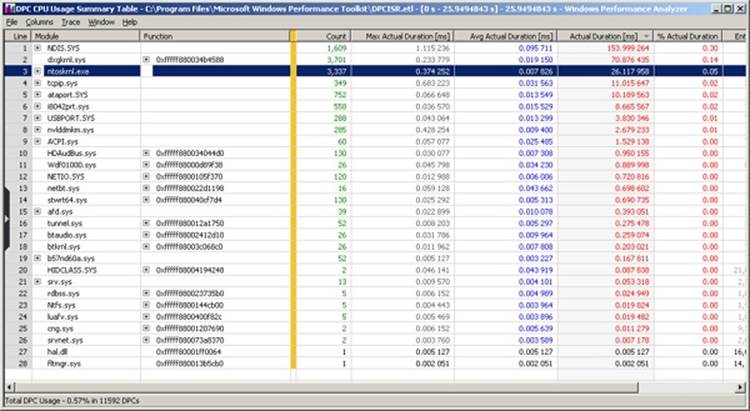
5. Open report.html, and expand the DPC/ISR subsection. Expand the DPC/ISR Breakdown area, and you will see summaries of the time spent in ISRs and DPCs by each driver. For example:

Running an ln command in the kernel debugger on the address of each event record shows the name of the function that executed the DPC or ISR:
lkd> ln 0x806321C7
(806321c7) ndis!ndisInterruptDpc
lkd> ln 0x820AED3F
(820aed3f) nt!IopTimerDispatch
lkd> ln 0x82051312
(82051312) nt!PpmPerfIdleDpc
The first is a DPC queued by a network card NDIS miniport driver. The second is a DPC for a generic I/O timer expiration. The third address is the address of a DPC for an idle performance operation.
Other than using it to get an HTML report, you can use the Xperf Viewer to show a detailed overview of all DPC and ISR events by right-clicking on the DPC and/or ISR CPU Usage graphs in the main Xperf window and choosing Summary Table. You will be able to see a per-driver view of each DPC and ISR in detail, along with its duration and count, just as shown in the following graphic:
Asynchronous Procedure Call Interrupts
Asynchronous procedure calls (APCs) provide a way for user programs and system code to execute in the context of a particular user thread (and hence a particular process address space). Because APCs are queued to execute in the context of a particular thread and run at an IRQL less than DPC/dispatch level, they don’t operate under the same restrictions as a DPC. An APC routine can acquire resources (objects), wait for object handles, incur page faults, and call system services.
APCs are described by a kernel control object, called an APC object. APCs waiting to execute reside in a kernel-managed APC queue. Unlike the DPC queue, which is systemwide, the APC queue is thread-specific—each thread has its own APC queue. When asked to queue an APC, the kernel inserts it into the queue belonging to the thread that will execute the APC routine. The kernel, in turn, requests a software interrupt at APC level, and when the thread eventually begins running, it executes the APC.
There are two kinds of APCs: kernel mode and user mode. Kernel-mode APCs don’t require permission from a target thread to run in that thread’s context, while user-mode APCs do. Kernel-mode APCs interrupt a thread and execute a procedure without the thread’s intervention or consent. There are also two types of kernel-mode APCs: normal and special. Special APCs execute at APC level and allow the APC routine to modify some of the APC parameters. Normal APCs execute at passive level and receive the modified parameters from the special APC routine (or the original parameters if they weren’t modified).
Both normal and special APCs can be disabled by raising the IRQL to APC level or by calling KeEnterGuardedRegion. KeEnterGuardedRegion disables APC delivery by setting the SpecialApcDisable field in the calling thread’s KTHREAD structure (described further in Chapter 5). A thread can disable normal APCs only by calling KeEnterCriticalRegion, which sets the KernelApcDisable field in the thread’s KTHREAD structure. Table 3-4 summarizes the APC insertion and delivery behavior for each type of APC.
The executive uses kernel-mode APCs to perform operating system work that must be completed within the address space (in the context) of a particular thread. It can use special kernel-mode APCs to direct a thread to stop executing an interruptible system service, for example, or to record the results of an asynchronous I/O operation in a thread’s address space. Environment subsystems use special kernel-mode APCs to make a thread suspend or terminate itself or to get or set its user-mode execution context. The Subsystem for UNIX Applications uses kernel-mode APCs to emulate the delivery of UNIX signals to Subsystem for UNIX Application processes.
Another important use of kernel-mode APCs is related to thread suspension and termination. Because these operations can be initiated from arbitrary threads and directed to other arbitrary threads, the kernel uses an APC to query the thread context as well as to terminate the thread. Device drivers often block APCs or enter a critical or guarded region to prevent these operations from occurring while they are holding a lock; otherwise, the lock might never be released, and the system would hang.
Table 3-4. APC Insertion and Delivery
|
APC Type |
Insertion Behavior |
Delivery Behavior |
|
Special (kernel) |
Inserted at the tail of the kernel-mode APC list |
Delivered at APC level as soon as IRQL drops and the thread is not in a guarded region. It is given pointers to arguments specified when inserting the APC. |
|
Normal (kernel) |
Inserted right after the last special APC (at the head of all other normal APCs) |
Delivered at PASSIVE_LEVEL after the associated special APC was executed. It is given arguments returned by the associated special APC (which can be the original arguments used during insertion or new ones). |
|
Normal (user) |
Inserted at the tail of the user-mode APC list |
Delivered at PASSIVE_LEVEL as soon as IRQL drops, the thread is not in a critical (or guarded) region, and the thread is in an alerted state. It is given arguments returned by the associated special APC (which can be the original arguments used during insertion or new ones). |
|
Normal (user) Thread Exit (PsExitSpecialApc) |
Inserted at the head of the user-mode APC list |
Delivered at PASSIVE_LEVEL on return to user mode, if the thread is doing an alerted user-mode wait. It is given arguments returned by the thread-termination special APC. |
Device drivers also use kernel-mode APCs. For example, if an I/O operation is initiated and a thread goes into a wait state, another thread in another process can be scheduled to run. When the device finishes transferring data, the I/O system must somehow get back into the context of the thread that initiated the I/O so that it can copy the results of the I/O operation to the buffer in the address space of the process containing that thread. The I/O system uses a special kernel-mode APC to perform this action, unless the application used the SetFileIoOverlappedRangeAPI or I/O completion ports—in which case, the buffer will either be global in memory or copied only after the thread pulls a completion item from the port. (The use of APCs in the I/O system is discussed in more detail in Chapter 8 in Part 2.)
Several Windows APIs—such as ReadFileEx, WriteFileEx, and QueueUserAPC—use user-mode APCs. For example, the ReadFileEx and WriteFileEx functions allow the caller to specify a completion routine to be called when the I/O operation finishes. The I/O completion is implemented by queuing an APC to the thread that issued the I/O. However, the callback to the completion routine doesn’t necessarily take place when the APC is queued because user-mode APCs are delivered to a thread only when it’s in an alertable wait state. A thread can enter a wait state either by waiting for an object handle and specifying that its wait is alertable (with the Windows WaitForMultipleObjectsEx function) or by testing directly whether it has a pending APC (using SleepEx). In both cases, if a user-mode APC is pending, the kernel interrupts (alerts) the thread, transfers control to the APC routine, and resumes the thread’s execution when the APC routine completes. Unlike kernel-mode APCs, which can execute at APC level, user-mode APCs execute at passive level.
APC delivery can reorder the wait queues—the lists of which threads are waiting for what, and in what order they are waiting. (Wait resolution is described in the section Low-IRQL Synchronization, later in this chapter.) If the thread is in a wait state when an APC is delivered, after the APC routine completes, the wait is reissued or re-executed. If the wait still isn’t resolved, the thread returns to the wait state, but now it will be at the end of the list of objects it’s waiting for. For example, because APCs are used to suspend a thread from execution, if the thread is waiting for any objects, its wait is removed until the thread is resumed, after which that thread will be at the end of the list of threads waiting to access the objects it was waiting for. A thread performing an alertable kernel-mode wait will also be woken up during thread termination, allowing such a thread to check whether it woke up as a result of termination or for a different reason.
Timer Processing
The system’s clock interval timer is probably the most important device on a Windows machine, as evidenced by its high IRQL value (CLOCK_LEVEL) and due to the critical nature of the work it is responsible for. Without this interrupt, Windows would lose track of time, causing erroneous results in calculations of uptime and clock time—and worse, causing timers not to expire anymore and threads never to lose their quantum anymore. Windows would also not be a preemptive operating system, and unless the current running thread yielded the CPU, critical background tasks and scheduling could never occur on a given processor.
Windows programs the system clock to fire at the most appropriate interval for the machine, and subsequently allows drivers, applications, and administrators to modify the clock interval for their needs. Typically, the system clock is maintained either by the PIT (Programmable Interrupt Timer) chip that is present on all computers since the PC/AT, or the RTC (Real Time Clock). The PIT works on a crystal that is tuned at one-third the NTSC color carrier frequency (because it was originally used for TV-Out on the first CGA video cards), and the HAL uses various achievable multiples to reach millisecond-unit intervals, starting at 1 ms all the way up to 15 ms. The RTC, on the other hand, runs at 32.768 KHz, which, by being a power of two, is easily configured to run at various intervals that are also powers of two. On today’s machines, the APIC Multiprocessor HAL configures the RTC to fire every 15.6 milliseconds, which corresponds to about 64 times a second.
Some types of Windows applications require very fast response times, such as multimedia applications. In fact, some multimedia tasks require rates as low as 1 ms. For this reason, Windows implements APIs and mechanisms that enable lowering the interval of the system’s clock interrupt, which results in more clock interrupts (at least on processor 0). Note that this increases the resolution of all timers in the system, potentially causing other timers to expire more frequently.
Windows tries its best to restore the clock timer back to its original value whenever it can. Each time a process requests a clock interval change, Windows increases an internal reference count and associates it with the process. Similarly, drivers (which can also change the clock rate) get added to the global reference count. When all drivers have restored the clock and all processes that modified the clock either have exited or restored it, Windows restores the clock to its default value (or, barring that, to the next highest value that’s been required by a process or driver).
EXPERIMENT: IDENTIFYING HIGH-FREQUENCY TIMERS
Due to the problems that high-frequency timers can cause, Windows uses Event Tracing for Windows (ETW) to trace all processes and drivers that request a change in the system’s clock interval, displaying the time of the occurrence and the requested interval. The current interval is also shown. This data is of great use to both developers and system administrators in identifying the causes of poor battery performance on otherwise healthy systems, and to decrease overall power consumption on large systems as well. To obtain it, simply run powercfg /energy and you should obtain an HTML file called energy-report.html similar to the one shown here:
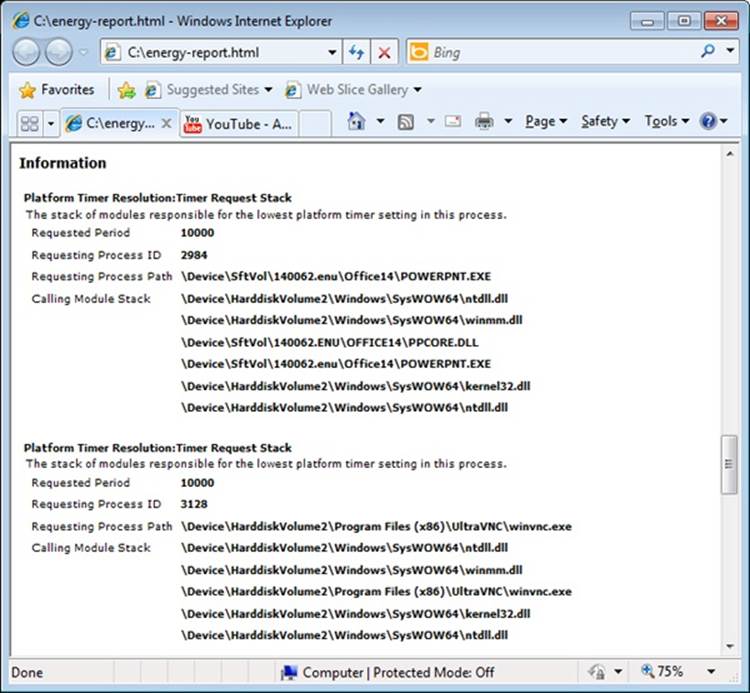
Scroll down to the section on Platform Timer Resolution, and you will be shown all the applications that have modified the timer resolution and are still active, along with the call stacks that caused this call. Timer resolutions are shown in hundreds of nanoseconds, so a period of 20,000 corresponds to 2 ms. In the sample shown, two applications—namely, Microsoft PowerPoint and the UltraVNC remote desktop server—each requested a higher resolution.
You can also use the debugger to obtain this information. For each process, the EPROCESS structure contains a number of fields, shown next, that help identify changes in timer resolution:
+0x4a8 TimerResolutionLink : _LIST_ENTRY [ 0xfffffa80'05218fd8 - 0xfffffa80'059cd508 ]
+0x4b8 RequestedTimerResolution : 0
+0x4bc ActiveThreadsHighWatermark : 0x1d
+0x4c0 SmallestTimerResolution : 0x2710
+0x4c8 TimerResolutionStackRecord : 0xfffff8a0'0476ecd0 _PO_DIAG_STACK_RECORD
Note that the debugger shows you an additional piece of information: the smallest timer resolution that was ever requested by a given process. In this example, the process shown corresponds to PowerPoint 2010, which typically requests a lower timer resolution during slide-shows, but not during slide editing mode. The EPROCESS fields of PowerPoint, shown in the preceding code, prove this, and the stack could be parsed by dumping the PO_DIAG_STACK_RECORD structure.
Finally, the TimerResolutionLink field connects all processes that have made changes to timer resolution, through the ExpTimerResolutionListHead doubly linked list. Parsing this list with the !list debugger command can reveal all processes on the system that have, or had, made changes to the timer resolution, when the powercfg command is unavailable or information on past processes is required:
lkd> !list "-e -x \"dt nt!_EPROCESS @$extret-@@(#FIELD_OFFSET(nt!_EPROCESS,
TimerResolutionLink))
ImageFileName SmallestTimerResolution RequestedTimerResolution\"
nt!ExpTimerResolutionListHead"
dt nt!_EPROCESS @$extret-@@(#FIELD_OFFSET(nt!_EPROCESS, TimerResolutionLink))
ImageFileName
SmallestTimerResolution RequestedTimerResolution
+0x2e0 ImageFileName : [15] "audiodg.exe"
+0x4b8 RequestedTimerResolution : 0
+0x4c0 SmallestTimerResolution : 0x2710
dt nt!_EPROCESS @$extret-@@(#FIELD_OFFSET(nt!_EPROCESS, TimerResolutionLink))
ImageFileName
SmallestTimerResolution RequestedTimerResolution
+0x2e0 ImageFileName : [15] "chrome.exe"
+0x4b8 RequestedTimerResolution : 0
+0x4c0 SmallestTimerResolution : 0x2710
dt nt!_EPROCESS @$extret-@@(#FIELD_OFFSET(nt!_EPROCESS, TimerResolutionLink))
ImageFileName
SmallestTimerResolution RequestedTimerResolution
+0x2e0 ImageFileName : [15] "calc.exe"
+0x4b8 RequestedTimerResolution : 0
+0x4c0 SmallestTimerResolution : 0x2710
dt nt!_EPROCESS @$extret-@@(#FIELD_OFFSET(nt!_EPROCESS, TimerResolutionLink))
ImageFileName
SmallestTimerResolution RequestedTimerResolution
+0x2e0 ImageFileName : [15] "devenv.exe"
+0x4b8 RequestedTimerResolution : 0
+0x4c0 SmallestTimerResolution : 0x2710
dt nt!_EPROCESS @$extret-@@(#FIELD_OFFSET(nt!_EPROCESS, TimerResolutionLink))
ImageFileName
SmallestTimerResolution RequestedTimerResolution
+0x2e0 ImageFileName : [15] "POWERPNT.EXE"
+0x4b8 RequestedTimerResolution : 0
+0x4c0 SmallestTimerResolution : 0x2710
dt nt!_EPROCESS @$extret-@@(#FIELD_OFFSET(nt!_EPROCESS, TimerResolutionLink))
ImageFileName
SmallestTimerResolution RequestedTimerResolution
+0x2e0 ImageFileName : [15] "winvnc.exe"
+0x4b8 RequestedTimerResolution : 0x2710
+0x4c0 SmallestTimerResolution : 0x2710
Timer Expiration
As we said, one of the main tasks of the ISR associated with the interrupt that the RTC or PIT will generate is to keep track of system time, which is mainly done by the KeUpdateSystemTime routine. Its second job is to keep track of logical run time, such as process/thread execution times and the system tick time, which is the underlying number used by APIs such as GetTickCount that developers use to time operations in their applications. This part of the work is performed by KeUpdateRunTime. Before doing any of that work, however, KeUpdateRunTimechecks whether any timers have expired.
Windows timers can be either absolute timers, which implies a distinct expiration time in the future, or relative timers, which contain a negative expiration value used as a positive offset from the current time during timer insertion. Internally, all timers are converted to an absolute expiration time, although the system keeps track of whether or not this is the “true” absolute time or a converted relative time. This difference is important in certain scenarios, such as Daylight Savings Time (or even manual clock changes). An absolute timer would still fire at “8PM” if the user moved the clock from 1PM to 7PM, but a relative timer—say, one set to expire “in two hours”—would not feel the effect of the clock change because two hours haven’t really elapsed. During system time-change events such as these, the kernel reprograms the absolute time associated with relative timers to match the new settings.
Because the clock fires at known interval multiples, the bottom bits of the current system time will be at one of 64 known positions (on an APIC HAL). Windows uses that fact to organize all driver and application timers into linked lists based on an array where each entry corresponds to a possible multiple of the system time. This table, called the timer table, is located in the PRCB, which enables each processor to perform its own independent timer expiration without needing to acquire a global lock, as shown in Figure 3-8. Later, you will see what determines which logical processor’s timer table a timer is inserted on. Because each processor has its own timer table, each processor also does its own timer expiration work. As each processor gets initialized, the table is filled with absolute timers with an infinite expiration time, to avoid any incoherent state. Each multiple of the system time that a timer can be associated with is called the hand, and it’s stored in the timer object’s dispatcher header. Therefore, to determine if a clock has expired, it is only necessary to check if there are any timers on the linked list associated with the current hand.
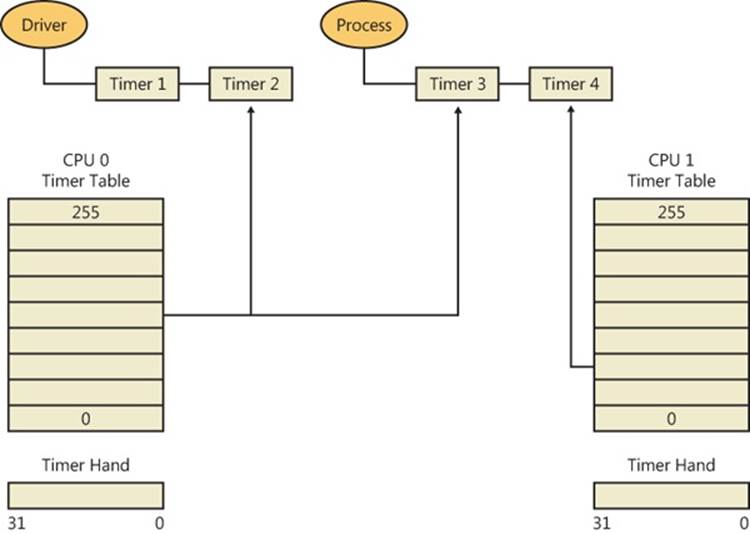
Figure 3-8. Example of per-processor timer lists
Although updating counters and checking a linked list are fast operations, going through every timer and expiring it is a potentially costly operation—keep in mind that all this work is currently being performed at CLOCK_LEVEL, an exceptionally elevated IRQL. Similarly to how a driver ISR queues a DPC to defer work, the clock ISR requests a DPC software interrupt, setting a flag in the PRCB so that the DPC draining mechanism knows timers need expiration. Likewise, when updating process/thread runtime, if the clock ISR determines that a thread has expired its quantum, it also queues a DPC software interrupt and sets a different PRCB flag. These flags are per-PRCB because each processor normally does its own processing of run-time updates, because each processor is running a different thread and has different tasks associated with it. Table 3-5 displays the various fields used in timer expiration and processing.
Once the IRQL eventually drops down back to DISPATCH_LEVEL, as part of DPC processing, these two flags will be picked up.
Table 3-5. Timer Processing KPRCB Fields
KPRCB Field
Type
Description
ReadySummary
Bitmask (32 bits)
Bitmask of priority levels that have one or more ready threads
DeferredReadyListHead
Singly linked list
Single list head for the deferred ready queue
DispatcherReadyListHead
Array of 32 list entries
List heads for the 32 ready queues
Chapter 5 covers the actions related to thread scheduling and quantum expiration. Here we will take a look at the timer expiration work. Because the timers are linked together by hand, the expiration code (executed by the DPC associated with the PRCB in the TimerExpiryDpc field) parses this list from head to tail. (At insertion time, the timers nearest to the clock interval multiple will be first, followed by timers closer and closer to the next interval, but still within this hand.) There are two primary tasks to expiring a timer:
§ The timer is treated as a dispatcher synchronization object (threads are waiting on the timer as part of a timeout or directly as part of a wait). The wait-testing and wait-satisfaction algorithms will be run on the timer. This work is described in a later section on synchronization in this chapter. This is how user-mode applications, and some drivers, make use of timers.
§ The timer is treated as a control object associated with a DPC callback routine that executes when the timer expires. This method is reserved only for drivers and enables very low latency response to timer expiration. (The wait/dispatcher method requires all the extra logic of wait signaling.) Additionally, because timer expiration itself executes at DISPATCH_LEVEL, where DPCs also run, it is perfectly suited as a timer callback.
As each processor wakes up to handle the clock interval timer to perform system-time and run-time processing, it therefore also processes timer expirations after a slightly latency/delay in which the IRQL drops from CLOCK_LEVEL to DISPATCH_LEVEL. Figure 3-9 shows this behavior on two processors—the solid arrows indicate the clock interrupt firing, while the dotted arrows indicate any timer expiration processing that might occur if the processor had associated timers.
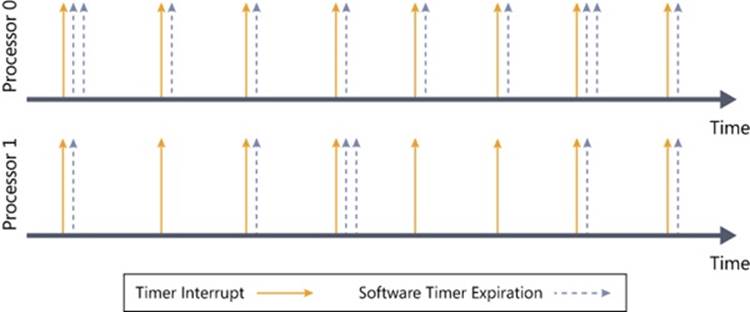
Figure 3-9. Timer expiration
Processor Selection
A critical determination that must be made when a timer is inserted is to pick the appropriate table to use—in other words, the most optimal processor choice. If the timer has no DPC associated with it, the kernel scans all processors in the current processor’s group that have not been parked. (For more information on Core Parking, see Chapter 5.) If the current processor is parked, it picks the next processor in the group; otherwise, the current processor is used. On the other hand, if the timer does have an associated DPC, the insertion code simply looks at the target processor associated with the DPC and selects that processor’s timer table.
In the case where the driver developer did not specify a target processor for the DPC, the kernel must make the choice. Because driver developers typically expect the DPC to execute on the same processor as the one the driver code was running on at insertion time, the kernel typically chooses CPU 0, since CPU 0 is the timekeeping processor that will always be active to pick up clock interrupts (more on this later). However, on server systems, the kernel picks a processor, just as it normally does when there is no DPC, by using the same checks just described.
This behavior is intended to improve performance and scalablity on server systems that make use of Hyper-V, although it can improve performance on any heavily loaded system. As system timers pile up—because most drivers do not affinitize their DPCs—CPU 0 becomes more and more congested with the execution of timer expiration code, which increases latency and can even cause heavy delays or missed DPCs. Additionally, the timer expiration can start competing with the DPC timer typically associated with driver interrupt processing, such as network packet code, causing systemwide slowdowns. This process is exacerbated in a Hyper-V scenario, where CPU 0 must process the timers and DPCs associated with potentially numerous virtual machines, each with their own timers and associated devices.
By spreading the timers across processors, as shown in Figure 3-10, each processor’s timer-expiration load is fully distributed among unparked logical processors. The timer object stores its associated processor number in the dispatcher header on 32-bit systems and in the object itself on 64-bit systems.
NOTE
This behavior is controlled by the kernel variable KiDistributeTimers, which is initialized based on a registry key whose value is different between a server and client installation. By modifying, or creating, the value DistributeTimers under HKLM\SYSTEM\CurrentControlSet\Control\Session Manager\kernel, this behavior can be configured differently from its SKU-based default.
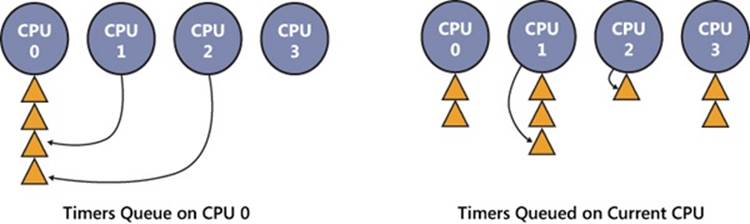
Figure 3-10. Timer queuing behaviors
EXPERIMENT: LISTING SYSTEM TIMERS
You can use the kernel debugger to dump all the current registered timers on the system, as well as information on the DPC associated with each timer (if any). See the following output for a sample:
[lkd> !timer
Dump system timers
Interrupt time: 61876995 000003df [ 4/ 5/2010 18:58:09.189]
List Timer Interrupt Low/High Fire Time DPC/thread
PROCESSOR 0 (nt!_KTIMER_TABLE fffff80001bfd080)
5 fffffa8003099810 627684ac 000003df [ 4/ 5/2010 18:58:10.756]
NDIS!ndisMTimerObjectDpc (DPC @ fffffa8003099850)
13 fffffa8003027278 272dde78 000004cf [ 4/ 6/2010 23:34:30.510] NDIS!ndisMWakeUpDpcX
(DPC @ fffffa80030272b8)
fffffa8003029278 272e0588 000004cf [ 4/ 6/2010 23:34:30.511] NDIS!ndisMWakeUpDpcX
(DPC @ fffffa80030292b8)
fffffa8003025278 272e0588 000004cf [ 4/ 6/2010 23:34:30.511] NDIS!ndisMWakeUpDpcX
(DPC @ fffffa80030252b8)
fffffa8003023278 272e2c99 000004cf [ 4/ 6/2010 23:34:30.512] NDIS!ndisMWakeUpDpcX
(DPC @ fffffa80030232b8)
16 fffffa8006096c20 6c1613a6 000003df [ 4/ 5/2010 18:58:26.901] thread
fffffa8006096b60
19 fffff80001c85c40 64f9aeb5 000003df [ 4/ 5/2010 18:58:14.971]
nt!CmpLazyFlushDpcRoutine (DPC @ fffff80001c85c00)
31 fffffa8002c43660 P dc527b9b 000003e8 [ 4/ 5/2010 20:06:00.673]
intelppm!LongCapTraceDpc (DPC @ fffffa8002c436a0)
40 fffff80001c86f60 62ca1080 000003df [ 4/ 5/2010 18:58:11.304] nt!CcScanDpc (DPC @
fffff80001c86f20)
fffff88004039710 62ca1080 000003df [ 4/ 5/2010 18:58:11.304]
luafv!ScavengerTimerRoutine (DPC @ fffff88004039750)
...
252 fffffa800458ed50 62619a91 000003df [ 4/ 5/2010 18:58:10.619] netbt!TimerExpiry (DPC
@ fffffa800458ed10)
fffffa8004599b60 fe2fc6ce 000003e0 [ 4/ 5/2010 19:09:41.514] netbt!TimerExpiry (DPC
@ fffffa8004599b20)
PROCESSOR 1 (nt!_KTIMER_TABLE fffff880009ba380)
0 fffffa8004ec9700 626be121 000003df [ 4/ 5/2010 18:58:10.686] thread
fffffa80027f3060
fffff80001c84dd0 P 70b3f446 000003df [ 4/ 5/2010 18:58:34.647]
nt!IopIrpStackProfilerTimer (DPC @ fffff80001c84e10)
11 fffffa8005c26cd0 62859842 000003df [ 4/ 5/2010 18:58:10.855] afd!AfdTimeoutPoll (DPC
@ fffffa8005c26c90)
fffffa8002ce8160 6e6c45f4 000003df [ 4/ 5/2010 18:58:30.822] thread
fffffa80053c2b60
fffffa8004fdb3d0 77f0c2cb 000003df [ 4/ 5/2010 18:58:46.789] thread
fffffa8004f4bb60
13 fffffa8005051c20 60713a93 800003df [ NEVER ] thread
fffffa8005051b60
15 fffffa8005ede120 77f9fb8c 000003df [ 4/ 5/2010 18:58:46.850] thread
fffffa8005ede060
20 fffffa8004f40ef0 629a3748 000003df [ 4/ 5/2010 18:58:10.990] thread
fffffa8004f4bb60
22 fffffa8005195120 6500ec7a 000003df [ 4/ 5/2010 18:58:15.019] thread
fffffa8005195060
28 fffffa8004760e20 62ad4e07 000003df [ 4/ 5/2010 18:58:11.115] btaudio (DPC @
fffffa8004760e60)+12d10
31 fffffa8002c40660 P dc527b9b 000003e8 [ 4/ 5/2010 20:06:00.673]
intelppm!LongCapTraceDpc (DPC @ fffffa8002c406a0)
...
232 fffff80001c85040 P 62317a00 000003df [ 4/ 5/2010 18:58:10.304] nt!IopTimerDispatch
(DPC @ fffff80001c85080)
fffff80001c26fc0 P 6493d400 000003df [ 4/ 5/2010 18:58:14.304]
nt!EtwpAdjustBuffersDpcRoutine (DPC @ fffff80001c26f80)
235 fffffa80047471a8 6238ba5c 000003df [ 4/ 5/2010 18:58:10.351] stwrt64 (DPC @
fffffa80047471e8)+67d4
242 fffff880023ae480 11228580 000003e1 [ 4/ 5/2010 19:10:13.304] dfsc!DfscTimerDispatch
(DPC @ fffff880023ae4c0)
245 fffff800020156b8 P 72fb2569 000003df [ 4/ 5/2010 18:58:38.469]
hal!HalpCmcDeferredRoutine (DPC @ fffff800020156f8)
248 fffffa80029ee460 P 62578455 000003df [ 4/ 5/2010 18:58:10.553]
ataport!IdePortTickHandler (DPC @ fffffa80029ee4a0)
fffffa8002776460 P 62578455 000003df [ 4/ 5/2010 18:58:10.553]
ataport!IdePortTickHandler (DPC @ fffffa80027764a0)
fffff88001678500 fe2f836f 000003e0 [ 4/ 5/2010 19:09:41.512] cng!seedFileDpcRoutine
(DPC @ fffff880016784c0)
fffff80001c25b80 885e52b3 0064a048 [12/31/2099 23:00:00.008]
nt!ExpCenturyDpcRoutine (DPC @ fffff80001c25bc0)
Total Timers: 254, Maximum List: 8
In this example, there are multiple driver-associated timers, due to expire shortly, associated with the Ndis.sys and Afd.sys drivers (both related to networking), as well as audio, Bluetooth, and ATA/IDE drivers. There are also background housekeeping timers due to expire, such as those related to power management, ETW, registry flushing, and Users Account Control (UAC) virtualization. Additionally, there are a dozen or so timers that don’t have any DPC associated with them—this likely indicates user-mode or kernel-mode timers that are used for wait dispatching. You can use !thread on the thread pointers to verify this. Finally, three interesting timers that are always present on a Windows system are the timer that checks for Daylight Savings Time time-zone changes, the timer that checks for the arrival of the upcoming year, and the timer that checks for entry into the next century. One can easily locate them based on their typically distant expiration time, unless this experiment is performed on the eve of one of these events.
Intelligent Timer Tick Distribution
Figure 3-11, which shows processors handling the clock ISR and expiring timers, reveals that processor 1 wakes up a number of times (the solid arrows) even when there are no associated expiring timers (the dotted arrows). Although that behavior is required as long as processor 1 is running (to update the thread/process run times and scheduling state), what if processor 1 is idle (and has no expiring timers). Does it still need to handle the clock interrupt? Because the only other work required that was referenced earlier is to update the overall system time/clock ticks, it’s sufficient to designate merely one processor as the time-keeping processor (in this case, processor 0) and allow other processors to remain in their sleep state; if they wake, any time-related adjustments can be performed by resynchronizing with processor 0.
Windows does, in fact, make this realization (internally called intelligent timer tick distribution), and Figure 3-11 shows the processor states under the scenario where processor 1 is sleeping (unlike earlier, when we assumed it was running code). As you can see, processor 1 wakes up only 5 times to handle its expiring timers, creating a much larger gap (sleeping period). The kernel uses a variable KiPendingTimer, which contains an array of affinity mask structures that indicate which logical processors need to receive a clock interval for the given timer hand (clock-tick interval). It can then appropriately program the interrupt controller, as well as determine to which processors it will send an IPI to initiate timer processing.
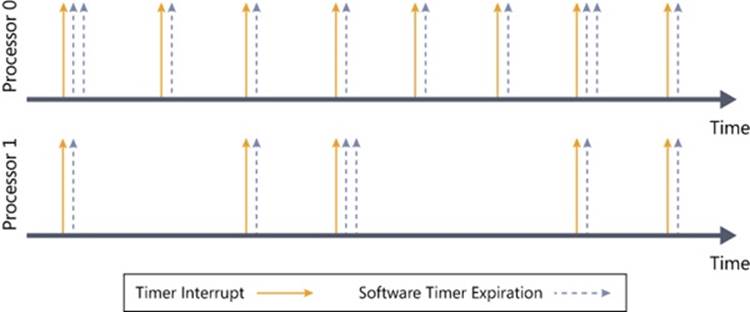
Figure 3-11. Intelligent timer tick distribution applied to processor 1
Leaving as large a gap as possible is important due to the way power management works in processors: as the processor detects that the work load is going lower and lower, it decreases its power consumption (P states), until it finally reaches an idle state. The processor then has the ability to selectively turn off parts of itself and enter deeper and deeper idle/sleep states, such as turning off caches. However, if the processor has to wake again, it will consume energy and take time to power up; for this reason, processor designers will risk entering these lower idle/sleep states (C states) only if the time spent in a given state outweighs the time and energy it takes to enter and exit the state. Obviously, it makes no sense to spend 10 ms to enter a sleep state that will last only 1 ms. By preventing clock interrupts from waking sleeping processors unless needed (due to timers), they can enter deeper C-states and stay there longer.
Timer Coalescing
Although minimizing clock interrupts to sleeping processors during periods of no timer expiration gives a big boost to longer C-state intervals, with a timer granularity of 15 ms, many timers likely will be queued at any given hand and expiring often, even if just on processor 0. Reducing the amount of software timer-expiration work would both help to decrease latency (by requiring less work at DISPATCH_LEVEL) as well as allow other processors to stay in their sleep states even longer (because we’ve established that the processors wake up only to handle expiring timers, fewer timer expirations result in longer sleep times). In truth, it is not just the amount of expiring timers that really affects sleep state (it does affect latency), but the periodicity of these timer expirations—six timers all expiring at the same hand is a better option than six timers expiring at six different hands. Therefore, to fully optimize idle-time duration, the kernel needs to employ a coalescing mechanism to combine separate timer hands into an individual hand with multiple expirations.
Timer coalescing works on the assumption that most drivers and user-mode applications do not particularly care about the exact firing period of their timers (except in the case of multimedia applications, for example). This “don’t care” region actually grows as the original timer period grows—an application waking up every 30 seconds probably doesn’t mind waking up every 31 or 29 seconds instead, while a driver polling every second could probably poll every second plus or minus 50 ms without too many problems. The important guarantee most periodic timers depend on is that their firing period remains constant within a certain range—for example, when a timer has been changed to fire every second plus 50 ms, it continues to fire within that range forever, not sometimes at every two seconds and other times at half a second. Even so, not all timers are ready to be coalesced into coarser granularities, so Windows enables this mechanism only for timers that have marked themselves as coalescable, either through the KeSetCoalescableTimer kernel API or through its user-mode counterpart, SetWaitableTimerEx.
With these APIs, driver and application developers are free to provide the kernel with the maximum tolerance (or tolerably delay) that their timer will endure, which is defined as the maximum amount of time past the requested period at which the timer will still function correctly. (In the previous example, the 1-second timer had a tolerance of 50 milliseconds.) The recommended minimum tolerance is 32 ms, which corresponds to about twice the 15.6-ms clock tick—any smaller value wouldn’t really result in any coalescing, because the expiring timer could not be moved even from one clock tick to the next. Regardless of the tolerance that is specified, Windows aligns the timer to one of four preferred coalescing intervals: 1 second, 250 ms, 100 ms, or 50 ms.
When a tolerable delay is set for a periodic timer, Windows uses a process called shifting, which causes the timer to drift between periods until it gets aligned to the most optimal multiple of the period interval within the preferred coalescing interval associated with the specified tolerance (which is then encoded in the dispatcher header). For absolute timers, the list of preferred coalescing intervals is scanned, and a preferred expiration time is generated based on the closest acceptable coalescing interval to the maximum tolerance the caller specified. This behavior means that absolute timers are always pushed out as far as possible past their real expiration point, which spreads out timers as far as possible and creates longer sleep times on the processors.
Now with timer coalescing, refer back to Figure 3-11 and assume all the timers specified tolerances and are thus coalescable. In one scenario, Windows could decide to coalesce the timers as shown in Figure 3-12. Notice that now, processor 1 receives a total of only three clock interrupts, significantly increasing the periods of idle sleep, thus achieving a lower C-state. Furthermore, there is less work to do for some of the clock interrupts on processor 0, possibly removing the latency of requiring a drop to DISPATCH_LEVEL at each clock interrupt.
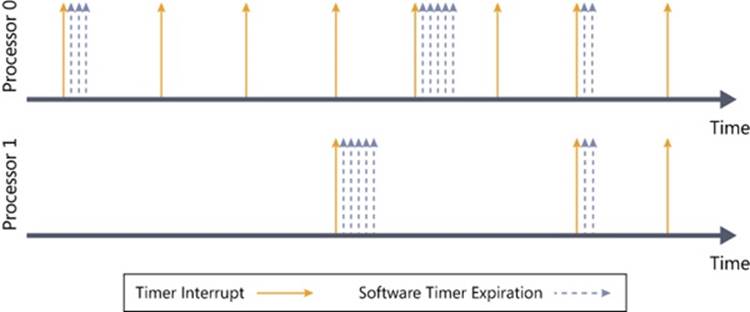
Figure 3-12. Timer coalescing
Exception Dispatching
In contrast to interrupts, which can occur at any time, exceptions are conditions that result directly from the execution of the program that is running. Windows uses a facility known as structured exception handling, which allows applications to gain control when exceptions occur. The application can then fix the condition and return to the place the exception occurred, unwind the stack (thus terminating execution of the subroutine that raised the exception), or declare back to the system that the exception isn’t recognized and the system should continue searching for an exception handler that might process the exception. This section assumes you’re familiar with the basic concepts behind Windows structured exception handling—if you’re not, you should read the overview in the Windows API reference documentation in the Windows SDK or Chapters 23 through 25 in Jeffrey Richter and Christophe Nasarre’s book Windows via C/C++ (Microsoft Press, 2007) before proceeding. Keep in mind that although exception handling is made accessible through language extensions (for example, the __tryconstruct in Microsoft Visual C++), it is a system mechanism and hence isn’t language specific.
On the x86 and x64 processors, all exceptions have predefined interrupt numbers that directly correspond to the entry in the IDT that points to the trap handler for a particular exception. Table 3-6 shows x86-defined exceptions and their assigned interrupt numbers. Because the first entries of the IDT are used for exceptions, hardware interrupts are assigned entries later in the table, as mentioned earlier.
All exceptions, except those simple enough to be resolved by the trap handler, are serviced by a kernel module called the exception dispatcher. The exception dispatcher’s job is to find an exception handler that can dispose of the exception. Examples of architecture-independent exceptions that the kernel defines include memory-access violations, integer divide-by-zero, integer overflow, floating-point exceptions, and debugger breakpoints. For a complete list of architecture-independent exceptions, consult the Windows SDK reference documentation.
Table 3-6. x86 Exceptions and Their Interrupt Numbers
Interrupt Number
Exception
0
Divide Error
1
Debug (Single Step)
2
Non-Maskable Interrupt (NMI)
3
Breakpoint
4
Overflow
5
Bounds Check
6
Invalid Opcode
7
NPX Not Available
8
Double Fault
9
NPX Segment Overrun
10
Invalid Task State Segment (TSS)
11
Segment Not Present
12
Stack Fault
13
General Protection
14
Page Fault
15
Intel Reserved
16
Floating Point
17
Alignment Check
18
Machine Check
19
SIMD Floating Point
The kernel traps and handles some of these exceptions transparently to user programs. For example, encountering a breakpoint while executing a program being debugged generates an exception, which the kernel handles by calling the debugger. The kernel handles certain other exceptions by returning an unsuccessful status code to the caller.
A few exceptions are allowed to filter back, untouched, to user mode. For example, certain types of memory-access violations or an arithmetic overflow generate an exception that the operating system doesn’t handle. 32-bit applications can establish frame-based exception handlers to deal with these exceptions. The term frame-based refers to an exception handler’s association with a particular procedure activation. When a procedure is invoked, a stack frame representing that activation of the procedure is pushed onto the stack. A stack frame can have one or more exception handlers associated with it, each of which protects a particular block of code in the source program. When an exception occurs, the kernel searches for an exception handler associated with the current stack frame. If none exists, the kernel searches for an exception handler associated with the previous stack frame, and so on, until it finds a frame-based exception handler. If no exception handler is found, the kernel calls its own default exception handlers.
For 64-bit applications, structured exception handling does not use frame-based handlers. Instead, a table of handlers for each function is built into the image during compilation. The kernel looks for handlers associated with each function and generally follows the same algorithm we described for 32-bit code.
Structured exception handling is heavily used within the kernel itself so that it can safely verify whether pointers from user mode can be safely accessed for read or write access. Drivers can make use of this same technique when dealing with pointers sent during I/O control codes (IOCTLs).
Another mechanism of exception handling is called vectored exception handling. This method can be used only by user-mode applications. You can find more information about it in the Windows SDK or the MSDN Library.
When an exception occurs, whether it is explicitly raised by software or implicitly raised by hardware, a chain of events begins in the kernel. The CPU hardware transfers control to the kernel trap handler, which creates a trap frame (as it does when an interrupt occurs). The trap frame allows the system to resume where it left off if the exception is resolved. The trap handler also creates an exception record that contains the reason for the exception and other pertinent information.
If the exception occurred in kernel mode, the exception dispatcher simply calls a routine to locate a frame-based exception handler that will handle the exception. Because unhandled kernel-mode exceptions are considered fatal operating system errors, you can assume that the dispatcher always finds an exception handler. Some traps, however, do not lead into an exception handler because the kernel always assumes such errors to be fatal—these are errors that could have been caused only by severe bugs in the internal kernel code or by major inconsistencies in driver code (that could have occurred only through deliberate, low-level system modifications that drivers should not be responsible for). Such fatal errors will result in a bug check with the UNEXPECTED_KERNEL_MODE_TRAP code.
If the exception occurred in user mode, the exception dispatcher does something more elaborate. As you’ll see in Chapter 5, the Windows subsystem has a debugger port (this is actually a debugger object, which will be discussed later) and an exception port to receive notification of user-mode exceptions in Windows processes. (In this case, by “port” we mean an LPC port object, which will be discussed later in this chapter.) The kernel uses these ports in its default exception handling, as illustrated in Figure 3-13.
Debugger breakpoints are common sources of exceptions. Therefore, the first action the exception dispatcher takes is to see whether the process that incurred the exception has an associated debugger process. If it does, the exception dispatcher sends a debugger object message to thedebug object associated with the process (which internally the system refers to as a “port” for compatibility with programs that might rely on behavior in Windows 2000, which used an LPC port instead of a debug object).
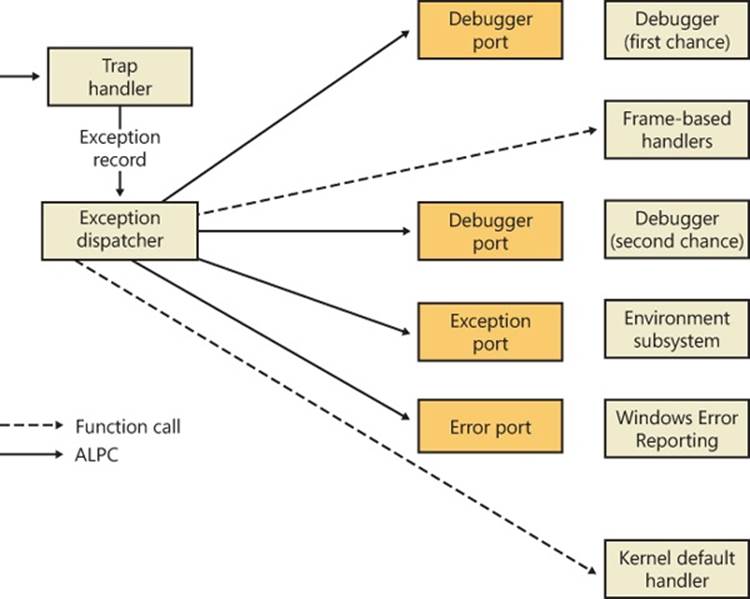
Figure 3-13. Dispatching an exception
If the process has no debugger process attached or if the debugger doesn’t handle the exception, the exception dispatcher switches into user mode, copies the trap frame to the user stack formatted as a CONTEXT data structure (documented in the Windows SDK), and calls a routine to find a structured or vectored exception handler. If none is found or if none handles the exception, the exception dispatcher switches back into kernel mode and calls the debugger again to allow the user to do more debugging. (This is called the second-chance notification.)
If the debugger isn’t running and no user-mode exception handlers are found, the kernel sends a message to the exception port associated with the thread’s process. This exception port, if one exists, was registered by the environment subsystem that controls this thread. The exception port gives the environment subsystem, which presumably is listening at the port, the opportunity to translate the exception into an environment-specific signal or exception. For example, when Subsystem for UNIX Applications gets a message from the kernel that one of its threads generated an exception, Subsystem for UNIX Applications sends a UNIX-style signal to the thread that caused the exception. However, if the kernel progresses this far in processing the exception and the subsystem doesn’t handle the exception, the kernel sends a message to a systemwide error port that Csrss (Client/Server Run-Time Subsystem) uses for Windows Error Reporting (WER)—which will be discussed shortly—and executes a default exception handler that simply terminates the process whose thread caused the exception.
Unhandled Exceptions
All Windows threads have an exception handler that processes unhandled exceptions. This exception handler is declared in the internal Windows start-of-thread function. The start-of-thread function runs when a user creates a process or any additional threads. It calls the environment-supplied thread start routine specified in the initial thread context structure, which in turn calls the user-supplied thread start routine specified in the CreateThread call.
EXPERIMENT: VIEWING THE REAL USER START ADDRESS FOR WINDOWS THREADS
The fact that each Windows thread begins execution in a system-supplied function (and not the user-supplied function) explains why the start address for thread 0 is the same for every Windows process in the system (and why the start addresses for secondary threads are also the same). To see the user-supplied function address, use Process Explorer or the kernel debugger.
Because most threads in Windows processes start at one of the system-supplied wrapper functions, Process Explorer, when displaying the start address of threads in a process, skips the initial call frame that represents the wrapper function and instead shows the second frame on the stack. For example, notice the thread start address of a process running Notepad.exe:
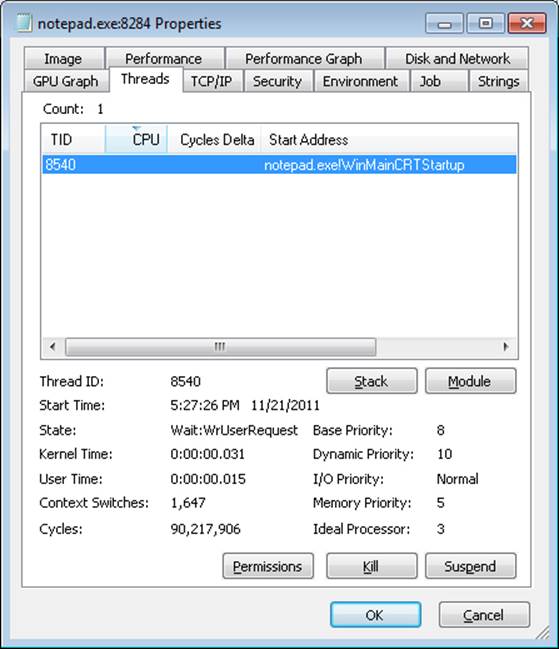
Process Explorer does display the complete call hierarchy when it displays the call stack. Notice the following results when the Stack button is clicked:
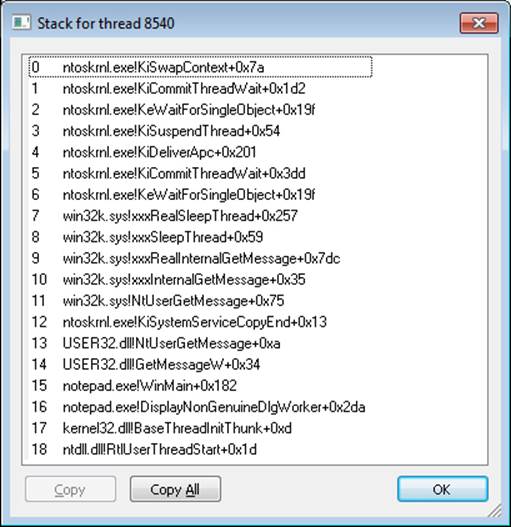
Line 18 in the preceding screen shot is the first frame on the stack—the start of the internal thread wrapper. The second frame (line 17) is the environment subsystem’s thread wrapper—in this case, kernel32, because you are dealing with a Windows subsystem application. The third frame (line 16) is the main entry point into Notepad.exe.
The generic code for the internal thread start functions is shown here:
VOID RtlUserThreadStart(VOID)
{
LPVOID lpStartAddr = (R/E)AX; // Located in the initial thread context structure
LPVOID lpvThreadParam = (R/E)BX; // Located in the initial thread context structure
LPVOID lpWin32StartAddr;
lpWin32StartAddr = Kernel32ThreadInitThunkFunction ? Kernel32ThreadInitThunkFunction :
lpStartAddr;
__try
{
DWORD dwThreadExitCode = lpWin32StartAddr(lpvThreadParam);
RtlExitUserThread(dwThreadExitCode);
}
__except(RtlpGetExceptionFilter(GetExceptionInformation()))
{
NtTerminateProcess(NtCurrentProcess(), GetExceptionCode());
}
}
VOID Win32StartOfProcess(
LPTHREAD_START_ROUTINE lpStartAddr,
LPVOID lpvThreadParam)
{
lpStartAddr(lpvThreadParam);
}
Notice that the Windows unhandled exception filter is called if the thread has an exception that it doesn’t handle. The purpose of this function is to provide the system-defined behavior for what to do when an exception is not handled, which is to launch the WerFault.exe process. However, in a default configuration the Windows Error Reporting service, described next, will handle the exception and this unhandled exception filter never executes.
WerFault.exe checks the contents of the HKLM\SOFTWARE\Microsoft\Windows NT\CurrentVersion\AeDebug registry key and makes sure that the process isn’t on the exclusion list. There are two important values in the key: Auto and Debugger. Auto tells the unhandled exception filter whether to automatically run the debugger or ask the user what to do. Installing development tools, such as Microsoft Visual Studio, changes this value to 0 if it is already set. (If the value was not set, 0 is the default option.) The Debugger value is a string that points to the path of the debugger executable to run in the case of an unhandled exception, and WerFault passes the process ID of the crashing process and an event name to signal when the debugger has started as command-line arguments when it starts the debugger.
Windows Error Reporting
Windows Error Reporting (WER) is a sophisticated mechanism that automates the submission of both user-mode process crashes as well as kernel-mode system crashes. (For a description of how this applies to system crashes, see Chapter 14 in Part 2.)
Windows Error Reporting can be configured by going to Control Panel, choosing Action Center, Change Action Center settings, and then Problem Reporting Settings.
When an unhandled exception is caught by the unhandled exception filter (described in the previous section), it builds context information (such as the current value of the registers and stack) and opens an ALPC port connection to the WER service. This service begins to analyze the crashed program’s state and performs the appropriate actions to notify the user. As described previously, in most cases this means launching the WerFault.exe program, which executes with the current user’s credentials and, unless the system is configured not to, displays a message box informing the user of the crash. On systems where a debugger is installed, an additional option to debug the process is shown, as you can see in Figure 3-14. When you click the Debug button, the debugger (registered in the Debugger string value described earlier in the AeDebugkey) will be launched so that it can attach to the crashing process.
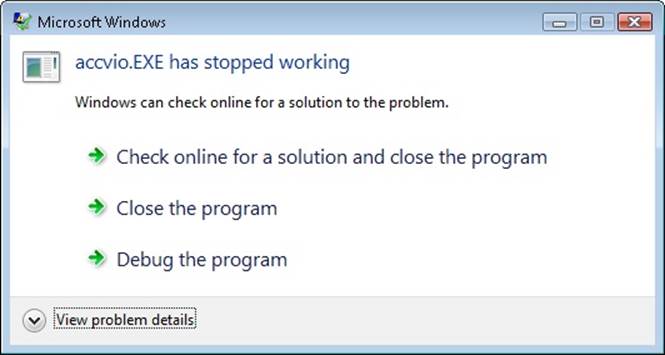
Figure 3-14. Windows Error Reporting dialog box
On default configured systems, an error report (a minidump and an XML file with various details, such as the DLL version numbers loaded in the process) is sent to Microsoft’s online crash analysis server. Eventually, as the service is notified of a solution for a problem, it will display a tooltip to the user informing her of steps that should be taken to solve the problem. An entry will also be displayed in the Action Center. Furthermore, the Reliability Monitor will also show all instances of application and system crashes.
NOTE
WER will actively (visually) inform the user of a crashed application only if the application has at least one visible/interactive window; otherwise, the crash will be logged, but the user will have to manually visit the Action Center to view it. This behavior attempts to avoid user confusion by not displaying a WER dialog box about an invisible crashed process the user might not be aware of, such as a background service.
In environments where systems are not connected to the Internet or where the administrator wants to control which error reports are submitted to Microsoft, the destination for the error report can be configured to be an internal file server. Microsoft System Center Desktop Error Monitoring understands the directory structure created by Windows Error Reporting and provides the administrator with the option to take selective error reports and submit them to Microsoft.
If all the operations we’ve described had to occur within the crashing thread’s context—that is, as part of the unhandled exception filter that was initially set up—these complex steps would sometimes become impossible for a badly damaged thread to perform, and the unhandled exception filter itself would crash. This “silent process death” would be impossible to log, making it hard to debug and also resulting in invisible crashes in cases where no user was present on the machine. To avoid such issues, Windows’ WER mechanism performs this work externally from the crashed thread if the unhandled exception filter itself crashes, which allows any kind of process or thread crash to be logged and for the user to be notified.
WER contains many customizable settings that can be configured by the user through the Group Policy editor or by manually making changes to the registry. Table 3-7 lists the WER registry configuration options, their use, and possible values. These values are located under the HKLM\SOFTWARE\Microsoft\Windows\Windows Error Reporting subkey for computer configuration and in the equivalent path under HKEY_CURRENT_USER for per-user configuration.
Table 3-7. WER Registry Settings
Setting
Meaning
Values
ConfigureArchive
Contents of archived data
1 for parameters, 2 for all data
Consent\DefaultConsent
What kind of data should require consent
1 for any data, 2 for parameters only, 3 for parameters and safe data, 4 for all data.
Consent\DefaultOverrideBehavior
Whether the DefaultConsent overrides WER plug-in consent values
1 to enable override
Consent\PluginName
Consent value for a specific WER plug-in
Same as DefaultConsent
CorporateWERDirectory
Directory for a corporate WER store
String containing the path
CorporateWERPortNumber
Port to use for a corporate WER store
Port number
CorporateWERServer
Name to use for a corporate WER store
String containing the name
CorporateWERUseAuthentication
Use Windows Integrated Authentication for corporate WER store
1 to enable built-in authentication
CorporateWERUseSSL
Use Secure Sockets Layer (SSL) for corporate WER store
1 to enable SSL
DebugApplications
List of applications that require the user to choose between Debug and Continue
1 to require the user to choose
DisableArchive
Whether the archive is enabled
1 to disable archive
Disabled
Whether WER is disabled
1 to disable WER
DisableQueue
Determines whether reports are to be queued
1 to disable queue
DontShowUI
Disables or enables the WER UI
1 to disable UI
DontSendAdditionalData
Prevents additional crash data from being sent
1 not to send
ExcludedApplications\AppName
List of applications excluded from WER
String containing the application list
ForceQueue
Whether reports should be sent to the user queue
1 to send reports to the queue
LocalDumps\DumpFolder
Path at which to store the dump files
String containing the path
LocalDumps\DumpCount
Maximum number of dump files in the path
Count
LocalDumps\DumpType
Type of dump to generate during a crash
0 for a custom dump, 1 for a minidump, 2 for a full dump
LocalDumps\CustomDumpFlags
For custom dumps, specifies custom options
Values defined in MINIDUMP_TYPE (see Chapter 13, “Startup and Shutdown,” in Part 2 for more information)
LoggingDisabled
Enables or disables logging
1 to disable logging
MaxArchiveCount
Maximum size of the archive (in files)
Value between 1–5000
MaxQueueCount
Maximum size of the queue
Value between 1–500
QueuePesterInterval
Days between requests to have the user check for solutions
Number of days
NOTE
The values listed under LocalDumps can also be configured per application by adding the application name in the subkey path between LocalDumps and the relevant value. However, they cannot be configured per user; they exist only in the HKLM path.
As discussed, the WER service uses an ALPC port for communicating with crashed processes. This mechanism uses a systemwide error port that the WER service registers through NtSetInformationProcess (which uses DbgkRegisterErrorPort). As a result, all Windows processes now have an error port that is actually an ALPC port object registered by the WER service. The kernel, which is first notified of an exception, uses this port to send a message to the WER service, which then analyzes the crashing process. This means that even in severe cases of thread state damage, WER will still be able to receive notifications and launch WerFault.exe to display a user interface instead of having to do this work within the crashing thread itself. Additionally, WER will be able to generate a crash dump for the process, and a message will be written to the Event Log. This solves all the problems of silent process death: users are notified, debugging can occur, and service administrators can see the crash event.
System Service Dispatching
As Figure 3-1 illustrated, the kernel’s trap handlers dispatch interrupts, exceptions, and system service calls. In the preceding sections, you saw how interrupt and exception handling work; in this section, you’ll learn about system services. A system service dispatch is triggered as a result of executing an instruction assigned to system service dispatching. The instruction that Windows uses for system service dispatching depends on the processor on which it’s executing.
System Service Dispatching
On x86 processors prior to the Pentium II, Windows uses the int 0x2e instruction (46 decimal), which results in a trap. Windows fills in entry 46 in the IDT to point to the system service dispatcher. (Refer to Table 3-3.) The trap causes the executing thread to transition into kernel mode and enter the system service dispatcher. A numeric argument passed in the EAX processor register indicates the system service number being requested. The EDX register points to the list of parameters the caller passes to the system service. To return to user mode, the system service dispatcher uses the iret (interrupt return instruction).
On x86 Pentium II processors and higher, Windows uses the sysenter instruction, which Intel defined specifically for fast system service dispatches. To support the instruction, Windows stores at boot time the address of the kernel’s system service dispatcher routine in a machine-specific register (MSR) associated with the instruction. The execution of the instruction causes the change to kernel mode and execution of the system service dispatcher. The system service number is passed in the EAX processor register, and the EDX register points to the list of caller arguments. To return to user mode, the system service dispatcher usually executes the sysexit instruction. (In some cases, like when the single-step flag is enabled on the processor, the system service dispatcher uses the iret instead because sysexit does not allow returning to user-mode with a different EFLAGS register, which is needed if sysenter was executed while the trap flag was set as a result of a user-mode debugger tracing or stepping over a system call.)
NOTE
Because certain older applications might have been hardcoded to use the int 0x2e instruction to manually perform a system call (an unsupported operation), 32-bit Windows keeps this mechanism usable even on systems that support the sysenter instruction by still having the handler registered.
On the x64 architecture, Windows uses the syscall instruction, passing the system call number in the EAX register, the first four parameters in registers, and any parameters beyond those four on the stack.
On the IA64 architecture, Windows uses the epc (Enter Privileged Mode) instruction. The first eight system call arguments are passed in registers, and the rest are passed on the stack.
EXPERIMENT: LOCATING THE SYSTEM SERVICE DISPATCHER
As mentioned, 32-bit system calls occur through an interrupt, which means that the handler needs to be registered in the IDT or through a special sysenter instruction that uses an MSR to store the handler address at boot time. On certain 32-bit AMD systems, Windows uses the syscall instruction instead, which is similar to the 64-bit syscall instruction. Here’s how you can locate the appropriate routine for either method:
1. To see the handler on 32-bit systems for the interrupt 2E version of the system call dispatcher, type !idt 2e in the kernel debugger.
2. lkd> !idt 2e
3.
4. Dumping IDT:
5.
2e: 8208c8ee nt!KiSystemService
6. To see the handler for the sysenter version, use the rdmsr debugger command to read from the MSR register 0x176, which stores the handler:
7. lkd> rdmsr 176
8. msr[176] = 00000000'8208c9c0
9. lkd> ln 00000000'8208c9c0
(8208c9c0) nt!KiFastCallEntry
If you have a 64-bit machine, you can look at the 64-bit service call dispatcher by repeating this step, but using the 0xC0000082 MSR instead, which is used by the syscall version for 64-bit code. You will see it corresponds to nt!KiSystemCall64:
lkd> rdmsr c0000082
msr[c0000082] = fffff800'01a71ec0
lkd> ln fffff800'01a71ec0
(fffff800'01a71ec0) nt!KiSystemCall64
10. You can disassemble the KiSystemService or KiSystemCall64 routine with the u command. On a 32-bit system, you’ll eventually notice the following instructions:
11.nt!KiSystemService+0x7b:
12.8208c969 897d04 mov dword ptr [ebp+4],edi
13.8208c96c fb sti
8208c96d e9dd000000 jmp nt!KiFastCallEntry+0x8f (8208ca4f)
Because the actual system call dispatching operations are common regardless of the mechanism used to reach the handler, the older interrupt-based handler simply calls into the middle of the newer sysenter-based handler to perform the same generic tasks. The only parts of the handlers that are different are related to the generation of the trap frame and the setup of certain registers.
At boot time, 32-bit Windows detects the type of processor on which it’s executing and sets up the appropriate system call code to use by storing a pointer to the correct code in the SharedUserData structure. The system service code for NtReadFile in user mode looks like this:
0:000> u ntdll!NtReadFile
ntdll!ZwReadFile:
77020074 b802010000 mov eax,102h
77020079 ba0003fe7f mov edx,offset SharedUserData!SystemCallStub (7ffe0300)
7702007e ff12 call dword ptr [edx]
77020080 c22400 ret 24h
77020083 90 nop
The system service number is 0x102 (258 in decimal), and the call instruction executes the system service dispatch code set up by the kernel, whose pointer is at address 0x7ffe0300. (This corresponds to the SystemCallStub member of the KUSER_SHARED_DATA structure, which starts at 0x7FFE0000.) Because the following output was taken from an Intel Core 2 Duo, it contains a pointer to sysenter:
0:000> dd SharedUserData!SystemCallStub l 1
7ffe0300 77020f30
0:000> u 77020f30
ntdll!KiFastSystemCall:
77020f30 8bd4 mov edx,esp
77020f32 0f34 sysenter
Because 64-bit systems have only one mechanism for performing system calls, the system service entry points in Ntdll.dll use the syscall instruction directly, as shown here:
ntdll!NtReadFile:
00000000'77f9fc60 4c8bd1 mov r10,rcx
00000000'77f9fc63 b810200000 mov eax,0x102
00000000'77f9fc68 0f05 syscall
00000000'77f9fc6a c3 ret
Kernel-Mode System Service Dispatching
As Figure 3-15 illustrates, the kernel uses the system call number to locate the system service information in the system service dispatch table. On 32-bit systems, this table is similar to the interrupt dispatch table described earlier in the chapter except that each entry contains a pointer to a system service rather than to an interrupt-handling routine. On 64-bit systems, the table is implemented slightly differently—instead of containing pointers to the system service, it contains offsets relative to the table itself. This addressing mechanism is more suited to the x64 application binary interface (ABI) and instruction-encoding format.
NOTE
System service numbers can change between service packs—Microsoft occasionally adds or removes system services, and the system service numbers are generated automatically as part of a kernel compile.
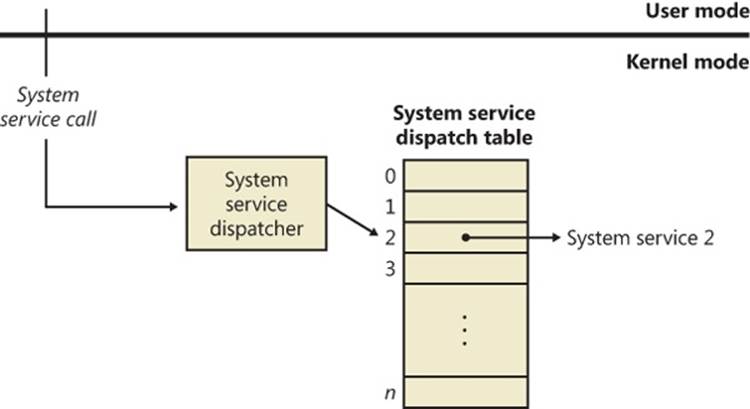
Figure 3-15. System service exceptions
The system service dispatcher, KiSystemService, copies the caller’s arguments from the thread’s user-mode stack to its kernel-mode stack (so that the user can’t change the arguments as the kernel is accessing them) and then executes the system service. The kernel knows how many stack bytes require copying by using a second table, called the argument table, which is a byte array (instead of a pointer array like the dispatch table), each entry describing the number of bytes to copy. On 64-bit systems, Windows actually encodes this information within the service table itself through a process called system call table compaction. If the arguments passed to a system service point to buffers in user space, these buffers must be probed for accessibility before kernel-mode code can copy data to or from them. This probing is performed only if theprevious mode of the thread is set to user mode. The previous mode is a value (kernel or user) that the kernel saves in the thread whenever it executes a trap handler and identifies the privilege level of the incoming exception, trap, or system call. As an optimization, if a system call comes from a driver or the kernel itself, the probing and capturing of parameters is skipped, and all parameters are assumed to be pointing to valid kernel-mode buffers (also, access to kernel-mode data is allowed).
Because kernel-mode code can also make system calls, let’s look at the way these are done. Because the code for each system call is in kernel mode and the caller is already in kernel mode, you can see that there shouldn’t be a need for an interrupt or sysenter operation: the CPU is already at the right privilege level, and drivers, as well as the kernel, should only be able to directly call the function required. In the executive’s case, this is actually what happens: the kernel has access to all its own routines and can simply call them just like standard routines. Externally, however, drivers can access these system calls only if they have been exported just like other standard kernel-mode APIs. In fact, quite a few of the system calls are exported. Drivers, however, are not supposed to access system calls this way. Instead, drivers must use theZw versions of these calls—that is, instead of NtCreateFile, they must use ZwCreateFile. These Zw versions must also be manually exported by the kernel, and only a handful are, but they are fully documented and supported.
The Zw versions are officially available only for drivers because of the previous mode concept discussed earlier. Because this value is updated only each time the kernel builds a trap frame, its value won’t actually change across a simple API call—no trap frame is being generated. By calling a function such as NtCreateFile directly, the kernel preserves the previous mode value that indicates that it is user mode, detects that the address passed is a kernel-mode address, and fails the call, correctly asserting that user-mode applications should not pass kernel-mode pointers. However, this is not actually what happens, so how can the kernel be aware of the correct previous mode? The answer lies in the Zw calls.
These exported APIs are not actually simple aliases or wrappers around the Nt versions. Instead, they are “trampolines” to the appropriate Nt system call, which use the same system call-dispatching mechanism. Instead of generating an interrupt or a sysenter, which would be slow and/or unsupported, they build a fake interrupt stack (the stack that the CPU would generate after an interrupt) and call the KiSystemService routine directly, essentially emulating the CPU interrupt. The handler executes the same operations as if this call came from user mode, except it detects the actual privilege level this call came from and set the previous mode to kernel. Now NtCreateFile sees that the call came from the kernel and does not fail anymore. Here’s what the kernel-mode trampolines look like on both 32-bit and 64-bit systems. The system call number is highlighted in bold.
lkd> u nt!ZwReadFile
nt!ZwReadFile:
8207f118 b802010000 mov eax,102h
8207f11d 8d542404 lea edx,[esp+4]
8207f121 9c pushfd
8207f122 6a08 push 8
8207f124 e8c5d70000 call nt!KiSystemService (8208c8ee)
8207f129 c22400 ret 24h
lkd> uf nt!ZwReadFile
nt!ZwReadFile:
fffff800'01a7a520 488bc4 mov rax,rsp
fffff800'01a7a523 fa cli
fffff800'01a7a524 4883ec10 sub rsp,10h
fffff800'01a7a528 50 push rax
fffff800'01a7a529 9c pushfq
fffff800'01a7a52a 6a10 push 10h
fffff800'01a7a52c 488d05bd310000 lea rax,[nt!KiServiceLinkage (fffff800'01a7d6f0)]
fffff800'01a7a533 50 push rax
fffff800'01a7a534 b803000000 mov eax,3
fffff800'01a7a539 e902690000 jmp nt!KiServiceInternal (fffff800'01a80e40)
As you’ll see in Chapter 5, Windows has two system service tables, and third-party drivers cannot extend the tables or insert new ones to add their own service calls. On 32-bit and IA64 versions of Windows, the system service dispatcher locates the tables via a pointer in the thread kernel structure, and on x64 versions it finds them via their global addresses. The system service dispatcher determines which table contains the requested service by interpreting a 2-bit field in the 32-bit system service number as a table index. The low 12 bits of the system service number serve as the index into the table specified by the table index. The fields are shown in Figure 3-16.
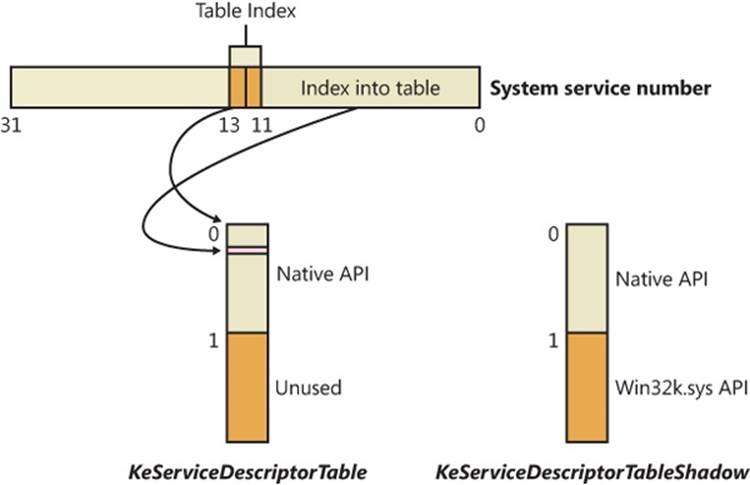
Figure 3-16. System service number to system service translation
Service Descriptor Tables
A primary default array table, KeServiceDescriptorTable, defines the core executive system services implemented in Ntosrknl.exe. The other table array, KeServiceDescriptorTableShadow, includes the Windows USER and GDI services implemented in the kernel-mode part of the Windows subsystem, Win32k.sys. On 32-bit and IA64 versions of Windows, the first time a Windows thread calls a Windows USER or GDI service, the address of the thread’s system service table is changed to point to a table that includes the Windows USER and GDI services. TheKeAddSystemServiceTable function allows Win32k.sys to add a system service table.
The system service dispatch instructions for Windows executive services exist in the system library Ntdll.dll. Subsystem DLLs call functions in Ntdll to implement their documented functions. The exception is Windows USER and GDI functions, for which the system service dispatch instructions are implemented in User32.dll and Gdi32.dll—Ntdll.dll is not involved. These two cases are shown in Figure 3-17.
As shown in Figure 3-17, the Windows WriteFile function in Kernel32.dll imports and calls the WriteFile function in API-MS-Win-Core-File-L1-1-0.dll, one of the MinWin redirection DLLs (see the next section for more information on API redirection), which in turn calls theWriteFile function in KernelBase.dll, where the actual implementation lies. After some subsystem-specific parameter checks, it then calls the NtWriteFile function in Ntdll.dll, which in turn executes the appropriate instruction to cause a system service trap, passing the system service number representing NtWriteFile. The system service dispatcher (function KiSystemService in Ntoskrnl.exe) then calls the real NtWriteFile to process the I/O request. For Windows USER and GDI functions, the system service dispatch calls functions in the loadable kernel-mode part of the Windows subsystem, Win32k.sys.
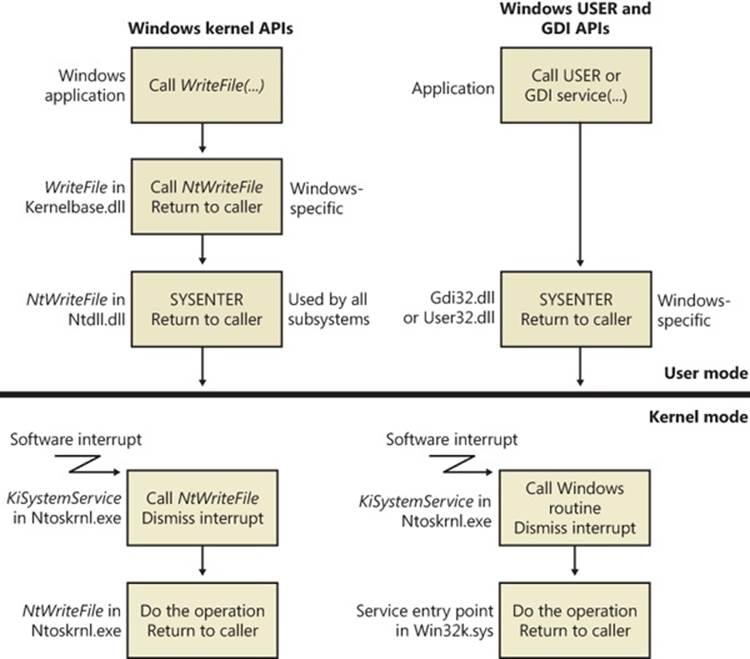
Figure 3-17. System service dispatching
EXPERIMENT: MAPPING SYSTEM CALL NUMBERS TO FUNCTIONS AND ARGUMENTS
You can duplicate the same lookup performed by the kernel when dealing with a system call ID to figure out which function is responsible for handling it and how many arguments it takes
1. The KeServiceDescriptorTable and KeServiceDescriptorTableShadow tables both point to the same array of pointers (or offsets, on 64-bit) for kernel system calls, called KiServiceTable, and the same array of stack bytes, called KiArgumentTable. On a 32-bit system, you can use the kernel debugger command dds to dump the data along with symbolic information. The debugger attempts to match each pointer with a symbol. Here’s a partial output:
2. lkd> dds KiServiceTable
3. 820807d0 821be2e5 nt!NtAcceptConnectPort
4. 820807d4 820659a6 nt!NtAccessCheck
5. 820807d8 8224a953 nt!NtAccessCheckAndAuditAlarm
6. 820807dc 820659dd nt!NtAccessCheckByType
7. 820807e0 8224a992 nt!NtAccessCheckByTypeAndAuditAlarm
8. 820807e4 82065a18 nt!NtAccessCheckByTypeResultList
9. 820807e8 8224a9db nt!NtAccessCheckByTypeResultListAndAuditAlarm
10.820807ec 8224aa24 nt!NtAccessCheckByTypeResultListAndAuditAlarmByHandle
820807f0 822892af nt!NtAddAtom
11. As described earlier, 64-bit Windows organizes the system call table differently and uses relative pointers (an offset) to system calls instead of the absolute addresses used by 32-bit Windows. The base of the pointer is the KiServiceTable itself, so you’ll have to dump the data in its raw format with the dq command. Here’s an example of output from a 64-bit system:
12.lkd> dq nt!KiServiceTable
fffff800'01a73b00 02f6f000'04106900 031a0105'fff72d00
13. Instead of dumping the entire table, you can also look up a specific number. On 32-bit Windows, because each system call number is an index into the table and because each element is 4 bytes, you can use the following calculation: Handler = KiServiceTable + Number * 4. Let’s use the number 0x102, obtained during our description of the NtReadFile stub code in Ntdll.dll.
14.lkd> ln poi(KiServiceTable + 102 * 4)
(82193023) nt!NtReadFile
On 64-bit Windows, each offset can be mapped to each function with the ln command, by shifting right by 4 bits (used as described earlier) and adding the remaining value to the base of KiServiceTable itself, as shown here:
lkd> ln @@c++(((int*)@@(nt!KiServiceTable))[3] >> 4) + nt!KiServiceTable
(fffff800'01d9cb10) nt!NtReadFile | (fffff800'01d9d24c) nt!NtOpenFile
Exact matches:
nt!NtReadFile = <no type information>
15. Because drivers, including kernel-mode rootkits, are able to patch this table on 32-bit versions of Windows, which is something the operating system does not support, you can use dds to dump the entire table and look for any values outside the range of valid kernel addresses (dds will also make this clear by not being able to look up a symbol for the function). On 64-bit Windows, Kernel Patch Protection monitors the system service tables and crashes the system when it detects modifications.
EXPERIMENT: VIEWING SYSTEM SERVICE ACTIVITY
You can monitor system service activity by watching the System Calls/Sec performance counter in the System object. Run the Performance Monitor, click on Performance Monitor under Monitoring Tools, and click the Add button to add a counter to the chart. Select the System object, select the System Calls/Sec counter, and then click the Add button to add the counter to the chart.
Object Manager
As mentioned in Chapter 2, Windows implements an object model to provide consistent and secure access to the various internal services implemented in the executive. This section describes the Windows object manager, the executive component responsible for creating, deleting, protecting, and tracking objects. The object manager centralizes resource control operations that otherwise would be scattered throughout the operating system. It was designed to meet the goals listed on the next page.
EXPERIMENT: EXPLORING THE OBJECT MANAGER
Throughout this section, you’ll find experiments that show you how to peer into the object manager database. These experiments use the following tools, which you should become familiar with if you aren’t already:
§ WinObj (available from Sysinternals) displays the internal object manager’s namespace and information about objects (such as the reference count, the number of open handles, security descriptors, and so forth).
§ Process Explorer and Handle from Sysinternals, as well as Resource Monitor (introduced in Chapter 1) display the open handles for a process.
§ The Openfiles /query command displays the open file handles for a process, but it requires a global flag to be set in order to operate.
§ The kernel debugger !handle command displays the open handles for a process.
WinObj provides a way to traverse the namespace that the object manager maintains. (As we’ll explain later, not all objects have names.) Run WinObj, and examine the layout, shown next.
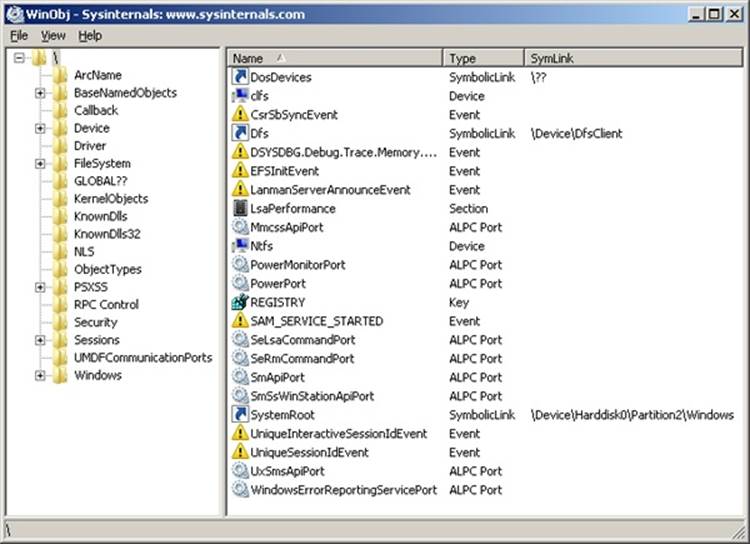
As noted previously, the Windows Openfiles /query command requires that a Windows global flag called maintain objects list be enabled. (See the Windows Global Flags section later in this chapter for more details about global flags.) If you type Openfiles /Local, it will tell you whether the flag is enabled. You can enable it with the Openfiles /Local ON command. In either case, you must reboot the system for the setting to take effect. Process Explorer, Handle, and Resource Monitor do not require object tracking to be turned on because they query all system handles and create a per-process object list.
The object manager was designed to meet the following goals:
§ Provide a common, uniform mechanism for using system resources
§ Isolate object protection to one location in the operating system to ensure uniform and consistent object access policy
§ Provide a mechanism to charge processes for their use of objects so that limits can be placed on the usage of system resources
§ Establish an object-naming scheme that can readily incorporate existing objects, such as the devices, files, and directories of a file system, or other independent collections of objects
§ Support the requirements of various operating system environments, such as the ability of a process to inherit resources from a parent process (needed by Windows and Subsystem for UNIX Applications) and the ability to create case-sensitive file names (needed by Subsystem for UNIX Applications)
§ Establish uniform rules for object retention (that is, for keeping an object available until all processes have finished using it)
§ Provide the ability to isolate objects for a specific session to allow for both local and global objects in the namespace
Internally, Windows has three kinds of objects: executive objects, kernel objects, and GDI/User objects. Executive objects are objects implemented by various components of the executive (such as the process manager, memory manager, I/O subsystem, and so on). Kernel objects are a more primitive set of objects implemented by the Windows kernel. These objects are not visible to user-mode code but are created and used only within the executive. Kernel objects provide fundamental capabilities, such as synchronization, on which executive objects are built. Thus, many executive objects contain (encapsulate) one or more kernel objects, as shown in Figure 3-18.
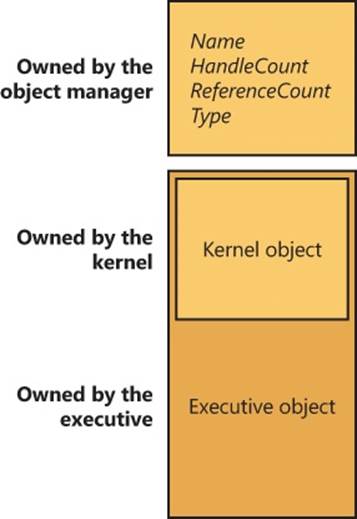
Figure 3-18. Executive objects that contain kernel objects
NOTE
GDI/User objects, on the other hand, belong to the Windows subsystem (Win32k.sys) and do not interact with the kernel. For this reason, they are outside the scope of this book, but you can get more information on them from the Windows SDK.
Details about the structure of kernel objects and how they are used to implement synchronization are given later in this chapter. The remainder of this section focuses on how the object manager works and on the structure of executive objects, handles, and handle tables and just briefly describes how objects are involved in implementing Windows security access checking; Chapter 6 thoroughly covers that topic.
Executive Objects
Each Windows environment subsystem projects to its applications a different image of the operating system. The executive objects and object services are primitives that the environment subsystems use to construct their own versions of objects and other resources.
Executive objects are typically created either by an environment subsystem on behalf of a user application or by various components of the operating system as part of their normal operation. For example, to create a file, a Windows application calls the Windows CreateFileWfunction, implemented in the Windows subsystem DLL Kernelbase.dll. After some validation and initialization, CreateFileW in turn calls the native Windows service NtCreateFile to create an executive file object.
The set of objects an environment subsystem supplies to its applications might be larger or smaller than the set the executive provides. The Windows subsystem uses executive objects to export its own set of objects, many of which correspond directly to executive objects. For example, the Windows mutexes and semaphores are directly based on executive objects (which, in turn, are based on corresponding kernel objects). In addition, the Windows subsystem supplies named pipes and mailslots, resources that are based on executive file objects. Some subsystems, such as Subsystem for UNIX Applications, don’t support objects as objects at all. Subsystem for UNIX Applications uses executive objects and services as the basis for presenting UNIX-style processes, pipes, and other resources to its applications.
Table 3-8 lists the primary objects the executive provides and briefly describes what they represent. You can find further details on executive objects in the chapters that describe the related executive components (or in the case of executive objects directly exported to Windows, in the Windows API reference documentation). You can see the full list of object types by running Winobj with elevated rights and navigating to the ObjectTypes directory.
NOTE
The executive implements a total of 4242 object types. Many of these objects are for use only by the executive component that defines them and are not directly accessible by Windows APIs. Examples of these objects include Driver, Device, and EventPair.
Table 3-8. Executive Objects Exposed to the Windows API
|
Object Type |
Represents |
|
Process |
The virtual address space and control information necessary for the execution of a set of thread objects. |
|
Thread |
An executable entity within a process. |
|
Job |
A collection of processes manageable as a single entity through the job. |
|
Section |
A region of shared memory (known as a file-mapping object in Windows). |
|
File |
An instance of an opened file or an I/O device. |
|
Token |
The security profile (security ID, user rights, and so on) of a process or a thread. |
|
Event |
An object with a persistent state (signaled or not signaled) that can be used for synchronization or notification. |
|
Semaphore |
A counter that provides a resource gate by allowing some maximum number of threads to access the resources protected by the semaphore. |
|
Mutex |
A synchronization mechanism used to serialize access to a resource. |
|
Timer |
A mechanism to notify a thread when a fixed period of time elapses. |
|
IoCompletion |
A method for threads to enqueue and dequeue notifications of the completion of I/O operations (known as an I/O completion port in the Windows API). |
|
Key |
A mechanism to refer to data in the registry. Although keys appear in the object manager namespace, they are managed by the configuration manager, in a way similar to that in which file objects are managed by file system drivers. Zero or more key values are associated with a key object; key values contain data about the key. |
|
Directory |
A virtual directory in the object manager’s namespace responsible for containing other objects or object directories. |
|
TpWorkerFactory |
A collection of threads assigned to perform a specific set of tasks. The kernel can manage the number of work items that will be performed on the queue, how many threads should be responsible for the work, and dynamic creation and termination of worker threads, respecting certain limits the caller can set. Windows exposes the worker factory object through thread pools. |
|
TmRm (Resource Manager), TmTx (Transaction), TmTm (Transaction Manager), TmEn (Enlistment) |
Objects used by the Kernel Transaction Manager (KTM) for various transactions and/or enlistments as part of a resource manager or transaction manager. Objects can be created through the CreateTransactionManager, CreateResourceManager, CreateTransaction, andCreateEnlistment APIs. |
|
WindowStation |
An object that contains a clipboard, a set of global atoms, and a group of Desktop objects. |
|
Desktop |
An object contained within a window station. A desktop has a logical display surface and contains windows, menus, and hooks. |
|
PowerRequest |
An object associated with a thread that executes, among other things, a call to SetThreadExecutionState to request a given power change, such as blocking sleeps (due to a movie being played, for example). |
|
EtwConsumer |
Represents a connected ETW real-time consumer that has registered with the StartTrace API (and can call ProcessTrace to receive the events on the object queue). |
|
EtwRegistration |
Represents the registration object associated with a user-mode (or kernel-mode) ETW provider that registered with the EventRegister API. |
NOTE
Because Windows NT was originally supposed to support the OS/2 operating system, the mutex had to be compatible with the existing design of OS/2 mutual-exclusion objects, a design that required that a thread be able to abandon the object, leaving it inaccessible. Because this behavior was considered unusual for such an object, another kernel object—the mutant—was created. Eventually, OS/2 support was dropped, and the object became used by the Windows 32 subsystem under the name mutex (but it is still called mutant internally).
Object Structure
As shown in Figure 3-19, each object has an object header and an object body. The object manager controls the object headers, and the owning executive components control the object bodies of the object types they create. Each object header also contains an index to a special object, called the type object, that contains information common to each instance of the object. Additionally, up to five optional subheaders exist: the name information header, the quota information header, the process information header, the handle information header, and the creator information header.
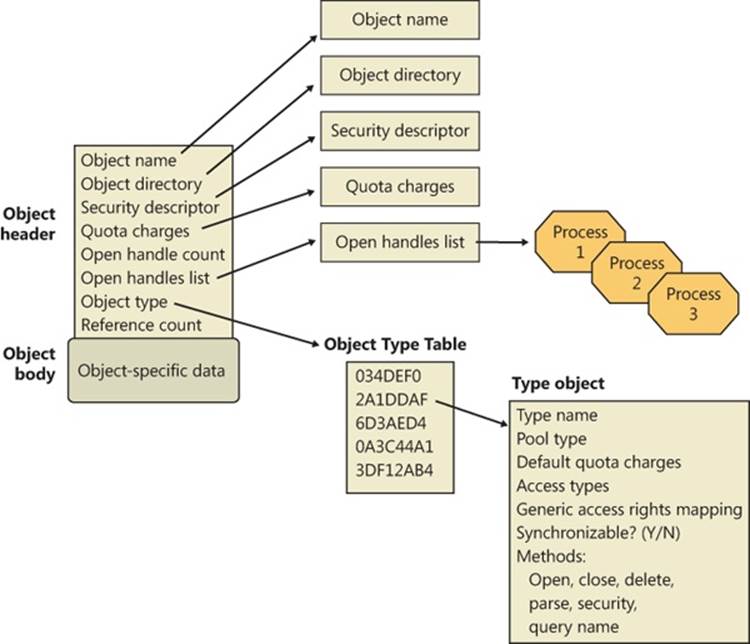
Figure 3-19. Structure of an object
Object Headers and Bodies
The object manager uses the data stored in an object’s header to manage objects without regard to their type. Table 3-9 briefly describes the object header fields, and Table 3-10 describes the fields found in the optional object subheaders.
Table 3-9. Object Header Fields
|
Field |
Purpose |
|
Handle count |
Maintains a count of the number of currently opened handles to the object. |
|
Pointer count |
Maintains a count of the number of references to the object (including one reference for each handle). Kernel-mode components can reference an object by pointer without using a handle. |
|
Security descriptor |
Determines who can use the object and what they can do with it. Note that unnamed objects, by definition, cannot have security. |
|
Object type index |
Contains the index to a type object that contains attributes common to objects of this type. The table that stores all the type objects is ObTypeIndexTable. |
|
Subheader mask |
Bitmask describing which of the optional subheader structures described in Table 3-10 are present, except for the creator information subheader, which, if present, always precedes the object. The bitmask is converted to a negative offset by using the ObpInfoMaskToOffset table, with each subheader being associated with a 1-byte index that places it relative to the other subheaders present. |
|
Flags |
Characteristics and object attributes for the object. See Table 3-12 for a list of all the object flags. |
|
Lock |
Per-object lock used when modifying fields belonging to this object header or any of its subheaders. |
In addition to the object header, which contains information that applies to any kind of object, the subheaders contain optional information regarding specific aspects of the object. Note that these structures are located at a variable offset from the start of the object header, the value of which depends on the number of subheaders associated with the main object header (except, as mentioned earlier, for creator information). For each subheader that is present, the InfoMask field is updated to reflect its existence. When the object manager checks for a given subheader, it checks if the corresponding bit is set in the InfoMask and then uses the remaining bits to select the correct offset into the ObpInfoMaskToOffset table, where it finds the offset of the subheader from the start of the object header.
These offsets exist for all possible combinations of subheader presence, but because the subheaders, if present, are always allocated in a fixed, constant order, a given header will have only as many possible locations as the maximum number of subheaders that precede it. For example, because the name information subheader is always allocated first, it has only one possible offset. On the other hand, the handle information subheader (which is allocated third) has three possible locations, because it might or might not have been allocated after the quota subheader, itself having possibly been allocated after the name information. Table 3-10 describes all the optional object subheaders and their location. In the case of creator information, a value in the object header flags determines whether the subheader is present. (See Table 3-12 for information about these flags.)
Table 3-10. Optional Object Subheaders
|
Name |
Purpose |
Bit |
Location |
|
Creator information |
Links the object into a list for all the objects of the same type, and records the process that created the object, along with a back trace. |
0 (0x1) |
Object header - ObpInfoMaskToOffset[0]) |
|
Name information |
Contains the object name, responsible for making an object visible to other processes for sharing, and a pointer to the object directory, which provides the hierarchical structure in which the object names are stored. |
1 (0x2) |
Object header - ObpInfoMaskToOffset - ObpInfoMaskToOffset[InfoMask & 0x3] |
|
Handle information |
Contains a database of entries (or just a single entry) for a process that has an open handle to the object (along with a per-process handle count). |
2 (0x4) |
Object header - ObpInfoMaskToOffset[InfoMask & 0x7] |
|
Quota information |
Lists the resource charges levied against a process when it opens a handle to the object. |
3 (0x8) |
Object header - ObpInfoMaskToOffset[InfoMask & 0xF] |
|
Process information |
Contains a pointer to the owning process if this is an exclusive object. More information on exclusive objects follows later in the chapter. |
4 (0x10) |
Object header - ObpInfoMaskToOffset[InfoMask & 0x1F] |
Each of these subheaders is optional and is present only under certain conditions, either during system boot up or at object creation time. Table 3-11 describes each of these conditions.
Table 3-11. Conditions Required for Presence of Object Subheaders
|
Name |
Condition |
|
Name information |
The object must have been created with a name. |
|
Quota information |
The object must not have been created by the initial (or idle) system process. |
|
Process information |
The object must have been created with the exclusive object flag. (See Table 3-12 for information about object flags.) |
|
Handle information |
The object type must have enabled the maintain handle count flag. File objects, ALPC objects, WindowStation objects, and Desktop objects have this flag set in their object type structure. |
|
Creator information |
The object type must have enabled the maintain type list flag. Driver objects have this flag set if the Driver Verifier is enabled. However, enabling the maintain object type list global flag (discussed earlier) will enable this for all objects, and Type objects always have the flag set. |
Finally, a number of attributes and/or flags determine the behavior of the object during creation time or during certain operations. These flags are received by the object manager whenever any new object is being created, in a structure called the object attributes. This structure defines the object name, the root object directory where it should be inserted, the security descriptor for the object, and the object attribute flags. Table 3-12 lists the various flags that can be associated with an object.
NOTE
When an object is being created through an API in the Windows subsystem (such as CreateEvent or CreateFile), the caller does not specify any object attributes—the subsystem DLL performs the work behind the scenes. For this reason, all named objects created through Win32 go in the BaseNamedObjects directory, either the global or per-session instance, because this is the root object directory that Kernelbase.dll specifies as part of the object attributes structure. More information on BaseNamedObjects and how it relates to the per-session namespace will follow later in this chapter.
Table 3-12. Object Flags
|
Attributes Flag |
Header Flag |
Purpose |
|
OBJ_INHERIT |
Saved in the handle table entry |
Determines whether the handle to the object will be inherited by child processes, and whether a process can use DuplicateHandle to make a copy. |
|
OBJ_PERMANENT |
OB_FLAG_PERMANENT_OBJECT |
Defines object retention behavior related to reference counts, described later. |
|
OBJ_EXCLUSIVE |
OB_FLAG_EXCLUSIVE_OBJECT |
Specifies that the object can be used only by the process that created it. |
|
OBJ_CASE_INSENSITIVE |
Stored in the handle table entry |
Specifies that lookups for this object in the namespace should be case insensitive. It can be overridden by the case insensitive flag in the object type. |
|
OBJ_OPENIF |
Not stored, used at run time |
Specifies that a create operation for this object name should result in an open, if the object exists, instead of a failure. |
|
OBJ_OPENLINK |
Not stored, used at run time |
Specifies that the object manager should open a handle to the symbolic link, not the target. |
|
OBJ_KERNEL_HANDLE |
OB_FLAG_KERNEL_OBJECT |
Specifies that the handle to this object should be a kernel handle (more on this later). |
|
OBJ_FORCE_ACCESS_CHECK |
Not stored, used at run time |
Specifies that even if the object is being opened from kernel mode, full access checks should be performed. |
|
OBJ_KERNEL_EXCLUSIVE |
OB_FLAG_KERNEL_ONLY_ACCESS |
Disables any user-mode process from opening a handle to the object; used to protect the /Device/PhysicalMemory section object. |
|
N/A |
OF_FLAG_DEFAULT_SECURITY_QUOTA |
Specifies that the object’s security descriptor is using the default 2-KB quota. |
|
N/A |
OB_FLAG_SINGLE_HANDLE_ENTRY |
Specifies that the handle information subheader contains only a single entry and not a database. |
|
N/A |
OB_FLAG_NEW_OBJECT |
Specifies that the object has been created but not yet inserted into the object namespace. |
|
N/A |
OB_FLAG_DELETED_INLINE |
Specifies that the object is being deleted through the deferred deletion worker thread. |
In addition to an object header, each object has an object body whose format and contents are unique to its object type; all objects of the same type share the same object body format. By creating an object type and supplying services for it, an executive component can control the manipulation of data in all object bodies of that type. Because the object header has a static and well-known size, the object manager can easily look up the object header for an object simply by subtracting the size of the header from the pointer of the object. As explained earlier, to access the subheaders, the object manager subtracts yet another well-known value from the pointer of the object header.
Because of the standardized object header and subheader structures, the object manager is able to provide a small set of generic services that can operate on the attributes stored in any object header and can be used on objects of any type (although some generic services don’t make sense for certain objects). These generic services, some of which the Windows subsystem makes available to Windows applications, are listed in Table 3-13.
Although these generic object services are supported for all object types, each object has its own create, open, and query services. For example, the I/O system implements a create file service for its file objects, and the process manager implements a create process service for its process objects.
Although a single create object service could have been implemented, such a routine would have been quite complicated, because the set of parameters required to initialize a file object, for example, differs markedly from that required to initialize a process object. Also, the object manager would have incurred additional processing overhead each time a thread called an object service to determine the type of object the handle referred to and to call the appropriate version of the service.
Table 3-13. Generic Object Services
|
Service |
Purpose |
|
Close |
Closes a handle to an object |
|
Duplicate |
Shares an object by duplicating a handle and giving it to another process |
|
Make permanent/temporary |
Changes the retention of an object (described later) |
|
Query object |
Gets information about an object’s standard attributes |
|
Query security |
Gets an object’s security descriptor |
|
Set security |
Changes the protection on an object |
|
Wait for a single object |
Synchronizes a thread’s execution with one object |
|
Signal an object and wait for another |
Signals an object (such as an event), and synchronizes a thread’s execution with another |
|
Wait for multiple objects |
Synchronizes a thread’s execution with multiple objects |
Type Objects
Object headers contain data that is common to all objects but that can take on different values for each instance of an object. For example, each object has a unique name and can have a unique security descriptor. However, objects also contain some data that remains constant for all objects of a particular type. For example, you can select from a set of access rights specific to a type of object when you open a handle to objects of that type. The executive supplies terminate and suspend access (among others) for thread objects and read, write, append, and delete access (among others) for file objects. Another example of an object-type-specific attribute is synchronization, which is described shortly.
To conserve memory, the object manager stores these static, object-type-specific attributes once when creating a new object type. It uses an object of its own, a type object, to record this data. As Figure 3-20 illustrates, if the object-tracking debug flag (described in the Windows Global Flags section later in this chapter) is set, a type object also links together all objects of the same type (in this case, the process type), allowing the object manager to find and enumerate them, if necessary. This functionality takes advantage of the creator information subheader discussed previously.
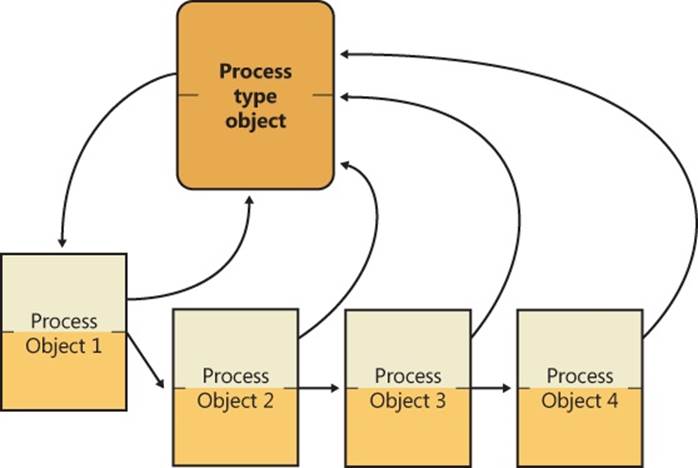
Figure 3-20. Process objects and the process type object
EXPERIMENT: VIEWING OBJECT HEADERS AND TYPE OBJECTS
You can look at the process object type data structure in the kernel debugger by first identifying a process object with the !process command:
lkd> !process 0 0
**** NT ACTIVE PROCESS DUMP ****
PROCESS fffffa800279cae0
SessionId: none Cid: 0004 Peb: 00000000 ParentCid: 0000
DirBase: 00187000 ObjectTable: fffff8a000001920 HandleCount: 541.
Image: System
Then execute the !object command with the process object address as the argument:
lkd> !object fffffa800279cae0
Object: fffffa800279cae0 Type: (fffffa8002755b60) Process
ObjectHeader: fffffa800279cab0 (new version)
HandleCount: 3 PointerCount: 172 3172
Notice that on 32-bit Windows, the object header starts 0x18 (24 decimal) bytes prior to the start of the object body, and on 64-bit Windows, it starts 0x30 (48 decimal) bytes prior—the size of the object header itself. You can view the object header with this command:
lkd> dt nt!_OBJECT_HEADER fffffa800279cab0
+0x000 PointerCount : 172
+0x008 HandleCount : 33
+0x008 NextToFree : 0x000000000x00000000'00000003
+0x010 Lock : _EX_PUSH_LOCK
+0x018 TypeIndex : 0x7 ''
+0x019 TraceFlags : 0 ''
+0x01a InfoMask : 0 ''
+0x01b Flags : 0x2 ''
+0x020 ObjectCreateInfo : 0xfffff800'01c53a80 _OBJECT_CREATE_INFORMATION
+0x020 QuotaBlockCharged : 0xfffff800'01c53a80
+0x028 SecurityDescriptor : 0xfffff8a0'00004b29
+0x030 Body : _QUAD
Now look at the object type data structure by obtaining its address from the ObTypeIndexTable table for the entry associated with the TypeIndex field of the object header data structure:
lkd> ?? ((nt!_OBJECT_TYPE**)@@(nt!ObTypeIndexTable))[((nt!_OBJECT_HEADER*)0xfffffa800279cab0)->TypeIndex]
struct _OBJECT_TYPE * 0xfffffa80'02755b60
+0x000 TypeList : _LIST_ENTRY [ 0xfffffa80'02755b60 - 0xfffffa80'02755b60 ]
+0x010 Name : _UNICODE_STRING "Process"
+0x020 DefaultObject : (null)
+0x028 Index : 0x70x7 ''
+0x02c TotalNumberOfObjects : 0x380x38
+0x030 TotalNumberOfHandles : 0x1320x132
+0x034 HighWaterNumberOfObjects : 0x3d
+0x038 HighWaterNumberOfHandles : 0x13c
+0x040 TypeInfo : _OBJECT_TYPE_INITIALIZER
+0x0b0 TypeLock : _EX_PUSH_LOCK
+0x0b8 Key : 0x636f7250
+0x0c0 CallbackList : _LIST_ENTRY [ 0xfffffa80'02755c20 - 0xfffffa80'02755c20 ]
The output shows that the object type structure includes the name of the object type, tracks the total number of active objects of that type, and tracks the peak number of handles and objects of that type. The CallbackList also keeps track of any object manager filtering callbacks that are associated with this object type. The TypeInfo field stores the pointer to the data structure that stores attributes common to all objects of the object type as well as pointers to the object type’s methods:
lkd> ?? ((nt!_OBJECT_TYPE*)0xfffffa8002755b60)->TypeInfo*)0xfffffa8002755b60)->TypeInfo
+0x000 Length : 0x70
+0x002 ObjectTypeFlags : 0x4a 'J'
+0x002 CaseInsensitive : 0y0
+0x002 UnnamedObjectsOnly : 0y1
+0x002 UseDefaultObject : 0y0
+0x002 SecurityRequired : 0y1
+0x002 MaintainHandleCount : 0y0
+0x002 MaintainTypeList : 0y0
+0x002 SupportsObjectCallbacks : 0y1
+0x004 ObjectTypeCode : 0
+0x008 InvalidAttributes : 0xb0
+0x00c GenericMapping : _GENERIC_MAPPING
+0x01c ValidAccessMask : 0x1fffff
+0x020 RetainAccess : 0x101000
+0x024 PoolType : 0 ( NonPagedPool )
+0x028 DefaultPagedPoolCharge : 0x1000
+0x02c DefaultNonPagedPoolCharge : 0x528
+0x030 DumpProcedure : (null)
+0x038 OpenProcedure : 0xfffff800'01d98d58 long nt!PspProcessOpen+0
+0x040 CloseProcedure : 0xfffff800'01d833c4 void nt!PspProcessClose+0
+0x048 DeleteProcedure : 0xfffff800'01d83090 void nt!PspProcessDelete+0
+0x050 ParseProcedure : (null)
+0x058 SecurityProcedure : 0xfffff800'01d8bb50 long nt!SeDefaultObjectMethod+0
+0x060 QueryNameProcedure : (null)
+0x068 OkayToCloseProcedure : (null)
Type objects can’t be manipulated from user mode because the object manager supplies no services for them. However, some of the attributes they define are visible through certain native services and through Windows API routines. The information stored in the type initializers is described in Table 3-14.
Table 3-14. Type Initializer Fields
|
Attribute |
Purpose |
|
Type name |
The name for objects of this type (“process,” “event,” “port,” and so on). |
|
Pool type |
Indicates whether objects of this type should be allocated from paged or nonpaged memory. |
|
Default quota charges |
Default paged and nonpaged pool values to charge to process quotas. |
|
Valid access mask |
The types of access a thread can request when opening a handle to an object of this type (“read,” “write,” “terminate,” “suspend,” and so on). |
|
Generic access rights mapping |
A mapping between the four generic access rights (read, write, execute, and all) to the type-specific access rights. |
|
Flags |
Indicate whether objects must never have names (such as process objects), whether their names are case-sensitive, whether they require a security descriptor, whether they support object-filtering callbacks, and whether a handle database (handle information subheader) and/or a type-list linkage (creator information subheader) should be maintained. The use default object flag also defines the behavior for the default object field shown later in this table. |
|
Object type code |
Used to describe the type of object this is (versus comparing with a well-known name value). File objects set this to 1, synchronization objects set this to 2, and thread objects set this to 4. This field is also used by ALPC to store handle attribute information associated with a message. |
|
Invalid attributes |
Specifies object attribute flags (shown earlier in Table 3-12) that are invalid for this object type. |
|
Default object |
Specifies the internal object manager event that should be used during waits for this object, if the object type creator requested one. Note that certain objects, such as File objects and ALPC port objects already contain their own embedded dispatcher object; in this case, this field is an offset into the object body. For example, the event inside the FILE_OBJECT structure is embedded in a field called Event. |
|
Methods |
One or more routines that the object manager calls automatically at certain points in an object’s lifetime. |
Synchronization, one of the attributes visible to Windows applications, refers to a thread’s ability to synchronize its execution by waiting for an object to change from one state to another. A thread can synchronize with executive job, process, thread, file, event, semaphore, mutex, and timer objects. Other executive objects don’t support synchronization. An object’s ability to support synchronization is based on three possibilities:
§ The executive object is a wrapper for a dispatcher object and contains a dispatcher header, a kernel structure that is covered in the section Low-IRQL Synchronization later in this chapter.
§ The creator of the object type requested a default object, and the object manager provided one.
§ The executive object has an embedded dispatcher object, such as an event somewhere inside the object body, and the object’s owner supplied its offset to the object manager when registering the object type (described in Table 3-14).
Object Methods
The last attribute in Table 3-14, methods, comprises a set of internal routines that are similar to C++ constructors and destructors—that is, routines that are automatically called when an object is created or destroyed. The object manager extends this idea by calling an object method in other situations as well, such as when someone opens or closes a handle to an object or when someone attempts to change the protection on an object. Some object types specify methods whereas others don’t, depending on how the object type is to be used.
When an executive component creates a new object type, it can register one or more methods with the object manager. Thereafter, the object manager calls the methods at well-defined points in the lifetime of objects of that type, usually when an object is created, deleted, or modified in some way. The methods that the object manager supports are listed in Table 3-15.
The reason for these object methods is to address the fact that, as you’ve seen, certain object operations are generic (close, duplicate, security, and so on). Fully generalizing these generic routines would have required the designers of the object manager to anticipate all object types. However, the routines to create an object type are exported by the kernel, enabling external kernel components to create their own object types. Although this functionality is not documented for driver developers, it is internally used by Win32k.sys to define WindowStation and Desktop objects. Through object-method extensibility, Win32k.sys defines its routines for handling operations such as create and query.
One exception to this rule is the security routine, which does, unless otherwise instructed, default to SeDefaultObjectMethod. This routine does not need to know the internal structure of the object because it deals only with the security descriptor for the object, and you’ve seen that the pointer to the security descriptor is stored in the generic object header, not inside the object body. However, if an object does require its own additional security checks, it can define a custom security routine. The other reason for having a generic security method is to avoid complexity, because most objects rely on the security reference monitor to manage their security.
Table 3-15. Object Methods
|
Method |
When Method Is Called |
|
Open |
When an object handle is opened |
|
Close |
When an object handle is closed |
|
Delete |
Before the object manager deletes an object |
|
Query name |
When a thread requests the name of an object, such as a file, that exists in a secondary object namespace |
|
Parse |
When the object manager is searching for an object name that exists in a secondary object namespace |
|
Dump |
Not used |
|
Okay to close |
When the object manager is instructed to close a handle |
|
Security |
When a process reads or changes the protection of an object, such as a file, that exists in a secondary object namespace |
The object manager calls the open method whenever it creates a handle to an object, which it does when an object is created or opened. The WindowStation and Desktop objects provide an open method; for example, the WindowStation object type requires an open method so that Win32k.sys can share a piece of memory with the process that serves as a desktop-related memory pool.
An example of the use of a close method occurs in the I/O system. The I/O manager registers a close method for the file object type, and the object manager calls the close method each time it closes a file object handle. This close method checks whether the process that is closing the file handle owns any outstanding locks on the file and, if so, removes them. Checking for file locks isn’t something the object manager itself can or should do.
The object manager calls a delete method, if one is registered, before it deletes a temporary object from memory. The memory manager, for example, registers a delete method for the section object type that frees the physical pages being used by the section. It also verifies that any internal data structures the memory manager has allocated for a section are deleted before the section object is deleted. Once again, the object manager can’t do this work because it knows nothing about the internal workings of the memory manager. Delete methods for other types of objects perform similar functions.
The parse method (and similarly, the query name method) allows the object manager to relinquish control of finding an object to a secondary object manager if it finds an object that exists outside the object manager namespace. When the object manager looks up an object name, it suspends its search when it encounters an object in the path that has an associated parse method. The object manager calls the parse method, passing to it the remainder of the object name it is looking for. There are two namespaces in Windows in addition to the object manager’s: the registry namespace, which the configuration manager implements, and the file system namespace, which the I/O manager implements with the aid of file system drivers. (See Chapter 4, for more information on the configuration manager and Chapter 8 in Part 2 for more details about the I/O manager and file system drivers.)
For example, when a process opens a handle to the object named \Device\HarddiskVolume1\docs\resume.doc, the object manager traverses its name tree until it reaches the device object named HarddiskVolume1. It sees that a parse method is associated with this object, and it calls the method, passing to it the rest of the object name it was searching for—in this case, the string docs\resume.doc. The parse method for device objects is an I/O routine because the I/O manager defines the device object type and registers a parse method for it. The I/O manager’s parse routine takes the name string and passes it to the appropriate file system, which finds the file on the disk and opens it.
The security method, which the I/O system also uses, is similar to the parse method. It is called whenever a thread tries to query or change the security information protecting a file. This information is different for files than for other objects because security information is stored in the file itself rather than in memory. The I/O system, therefore, must be called to find the security information and read or change it.
Finally, the okay-to-close method is used as an additional layer of protection around the malicious—or incorrect—closing of handles being used for system purposes. For example, each process has a handle to the Desktop object or objects on which its thread or threads have windows visible. Under the standard security model, it is possible for those threads to close their handles to their desktops because the process has full control of its own objects. In this scenario, the threads end up without a desktop associated with them—a violation of the windowing model. Win32k.sys registers an okay-to-close routine for the Desktop and WindowStation objects to prevent this behavior.
Object Handles and the Process Handle Table
When a process creates or opens an object by name, it receives a handle that represents its access to the object. Referring to an object by its handle is faster than using its name because the object manager can skip the name lookup and find the object directly. Processes can also acquire handles to objects by inheriting handles at process creation time (if the creator specifies the inherit handle flag on the CreateProcess call and the handle was marked as inheritable, either at the time it was created or afterward by using the Windows SetHandleInformation function) or by receiving a duplicated handle from another process. (See the Windows DuplicateHandle function.)
All user-mode processes must own a handle to an object before their threads can use the object. Using handles to manipulate system resources isn’t a new idea. C and Pascal (an older programming language similar to Delphi) run-time libraries, for example, return handles to opened files. Handles serve as indirect pointers to system resources; this indirection keeps application programs from fiddling directly with system data structures.
Object handles provide additional benefits. First, except for what they refer to, there is no difference between a file handle, an event handle, and a process handle. This similarity provides a consistent interface to reference objects, regardless of their type. Second, the object manager has the exclusive right to create handles and to locate an object that a handle refers to. This means that the object manager can scrutinize every user-mode action that affects an object to see whether the security profile of the caller allows the operation requested on the object in question.
NOTE
Executive components and device drivers can access objects directly because they are running in kernel mode and therefore have access to the object structures in system memory. However, they must declare their usage of the object by incrementing the reference count so that the object won’t be de-allocated while it’s still being used. (See the section Object Retention later in this chapter for more details.) To successfully make use of this object, however, device drivers need to know the internal structure definition of the object, and this is not provided for most objects. Instead, device drivers are encouraged to use the appropriate kernel APIs to modify or read information from the object. For example, although device drivers can get a pointer to the Process object (EPROCESS), the structure is opaque, and Ps* APIs must be used. For other objects, the type itself is opaque (such as most executive objects that wrap a dispatcher object—for example, events or mutexes). For these objects, drivers must use the same system calls that user-mode applications end up calling (such as ZwCreateEvent) and use handles instead of object pointers.
EXPERIMENT: VIEWING OPEN HANDLES
Run Process Explorer, and make sure the lower pane is enabled and configured to show open handles. (Click on View, Lower Pane View, and then Handles). Then open a command prompt and view the handle table for the new Cmd.exe process. You should see an open file handle to the current directory. For example, assuming the current directory is C:\Users\Administrator, Process Explorer shows the following:
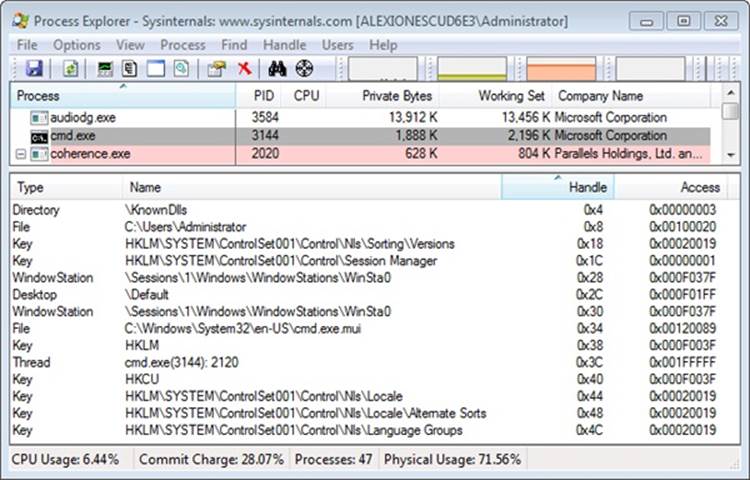
Now pause Process Explorer by pressing the space bar or clicking on View, Update Speed and choosing Pause. Then change the current directory with the cd command and press F5 to refresh the display. You will see in Process Explorer that the handle to the previous current directory is closed and a new handle is opened to the new current directory. The previous handle is highlighted in red and the new handle is highlighted in green.
Process Explorer’s differences-highlighting feature makes it easy to see changes in the handle table. For example, if a process is leaking handles, viewing the handle table with Process Explorer can quickly show what handle or handles are being opened but not closed. (Typically, you see a long list of handles to the same object.) This information can help the programmer find the handle leak.
Resource Monitor also shows open handles to named handles for the processes you select by checking the boxes next to their names. Here are the command prompt’s open handles:
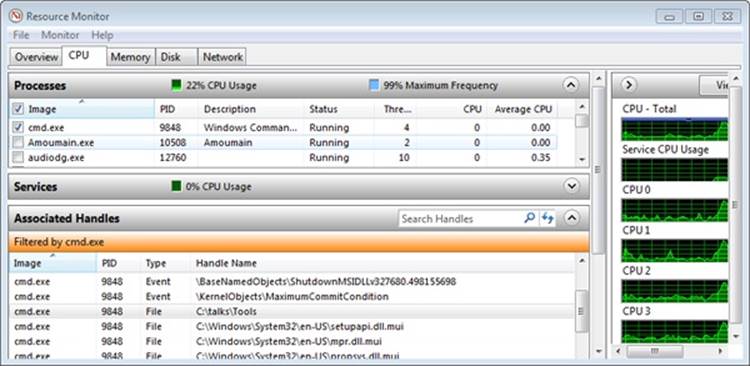
You can also display the open handle table by using the command-line Handle tool from Sysinternals. For example, note the following partial output of Handle when examining the file object handles located in the handle table for a Cmd.exe process before and after changing the directory. By default, Handle filters out nonfile handles unless the –a switch is used, which displays all the handles in the process, similar to Process Explorer.
C:\>handle -p cmd.exe
Handle v3.46
Copyright (C) 1997-2011 Mark Russinovich
Sysinternals - www.sysinternals.com
------------------------------------------------------------------------------
cmd.exe pid: 5124 Alex-Laptop\Alex Ionescu
3C: File (R-D) C:\Windows\System32\en-US\KernelBase.dll.mui
44: File (RW-) C:\
C:\>cd windows
C:\Windows>handle -p cmd.exe
Handle v3.46
Copyright (C) 1997-2011 Mark Russinovich
Sysinternals - www.sysinternals.com
------------------------------------------------------------------------------
cmd.exe pid: 5124 Alex-Laptop\Alex Ionescu
3C: File (R-D) C:\Windows\System32\en-US\KernelBase.dll.mui
40: File (RW-) C:\Windows
An object handle is an index into a process-specific handle table, pointed to by the executive process (EPROCESS) block (described in Chapter 5). The first handle index is 4, the second 8, and so on. A process’ handle table contains pointers to all the objects that the process has opened a handle to. Handle tables are implemented as a three-level scheme, similar to the way that the x86 memory management unit implements virtual-to-physical address translation, giving a maximum of more than 16,000,000 handles per process. (See Chapter 10 in Part 2 for details about memory management in x86 systems.)
NOTE
With a three-table scheme, the top-level table can contain a page full of pointers to mid-level tables, allowing for well over half a billion handles. However, to maintain compatibility with Windows 2000’s handle scheme and inherent limitation of 16,777,216 handles, the top-level table only contains up to a maximum of 32 pointers to the mid-level tables, capping newer versions of Windows at the same limit.
Only the lowest-level handle table is allocated on process creation—the other levels are created as needed. The subhandle table consists of as many entries as will fit in a page minus one entry that is used for handle auditing. For example, for x86 systems a page is 4096 bytes, divided by the size of a handle table entry (8 bytes), which is 512, minus 1, which is a total of 511 entries in the lowest-level handle table. The mid-level handle table contains a full page of pointers to subhandle tables, so the number of subhandle tables depends on the size of the page and the size of a pointer for the platform. Figure 3-21 describes the handle table layout on Windows.
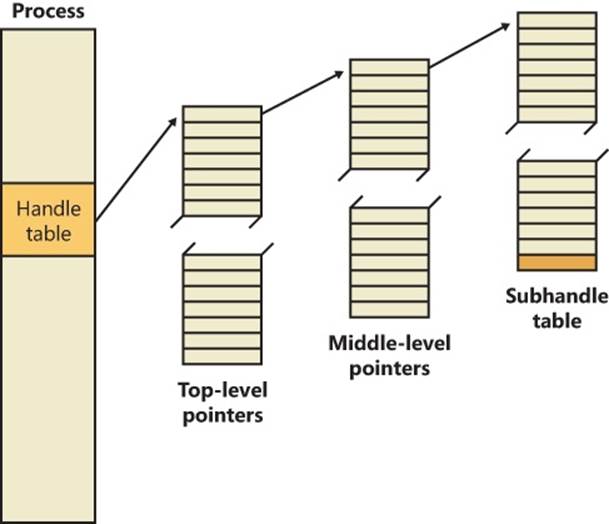
Figure 3-21. Windows process handle table architecture
EXPERIMENT: CREATING THE MAXIMUM NUMBER OF HANDLES
The test program Testlimit from Sysinternals has an option to open handles to an object until it cannot open any more handles. You can use this to see how many handles can be created in a single process on your system. Because handle tables are allocated from paged pool, you might run out of paged pool before you hit the maximum number of handles that can be created in a single process. To see how many handles you can create on your system, follow these steps:
1. Download the Testlimit executable file corresponding to the 32/64 bit Windows you need from http://live.sysinternals.com/WindowsInternals.
2. Run Process Explorer, click View and then System Information, and then click on the Memory tab. Notice the current and maximum size of paged pool. (To display the maximum pool size values, Process Explorer must be configured properly to access the symbols for the kernel image, Ntoskrnl.exe.) Leave this system information display running so that you can see pool utilization when you run the Testlimit program.
3. Open a command prompt.
4. Run the Testlimit program with the –h switch (do this by typing testlimit –h). When Testlimit fails to open a new handle, it displays the total number of handles it was able to create. If the number is less than approximately 16 million, you are probably running out of paged pool before hitting the theoretical per-process handle limit.
5. Close the Command Prompt window; doing this kills the Testlimit process, thus closing all the open handles.
As shown in Figure 3-22, on x86 systems, each handle entry consists of a structure with two 32-bit members: a pointer to the object (with flags), and the granted access mask. On 64-bit systems, a handle table entry is 12 bytes long: a 64-bit pointer to the object header and a 32-bit access mask. (Access masks are described in Chapter 6.)
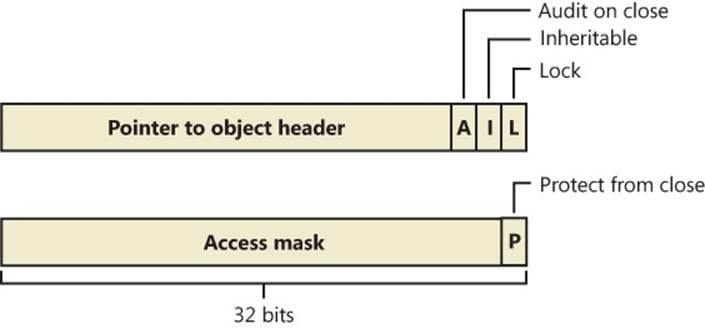
Figure 3-22. Structure of a handle table entry
The first flag is a lock bit, indicating whether the entry is currently in use. The second flag is the inheritance designation—that is, it indicates whether processes created by this process will get a copy of this handle in their handle tables. As already noted, handle inheritance can be specified on handle creation or later with the SetHandleInformation function. The third flag indicates whether closing the object should generate an audit message. (This flag isn’t exposed to Windows—the object manager uses it internally.) Finally, the protect-from-close bit, stored in an unused portion of the access mask, indicates whether the caller is allowed to close this handle. (This flag can be set with the NtSetInformationObject system call.)
System components and device drivers often need to open handles to objects that user-mode applications shouldn’t have access to. This is done by creating handles in the kernel handle table (referenced internally with the name ObpKernelHandleTable). The handles in this table are accessible only from kernel mode and in any process context. This means that a kernel-mode function can reference the handle in any process context with no performance impact. The object manager recognizes references to handles from the kernel handle table when the high bit of the handle is set—that is, when references to kernel-handle-table handles have values greater than 0x80000000. The kernel handle table also serves as the handle table for the System process, and all handles created by the System process (such as code running in system threads) are automatically marked as kernel handles because they live in the kernel handle table by definition.
EXPERIMENT: VIEWING THE HANDLE TABLE WITH THE KERNEL DEBUGGER
The !handle command in the kernel debugger takes three arguments:
!handle <handle index> <flags> <processid>
The handle index identifies the handle entry in the handle table. (Zero means “display all handles.”) The first handle is index 4, the second 8, and so on. For example, typing !handle 4 will show the first handle for the current process.
The flags you can specify are a bitmask, where bit 0 means “display only the information in the handle entry,” bit 1 means “display free handles (not just used handles),” and bit 2 means “display information about the object that the handle refers to.” The following command displays full details about the handle table for process ID 0x62C:
lkd> !handle 0 7 62c
processor number 0, process 000000000000062c
Searching for Process with Cid == 62c
PROCESS fffffa80052a7060
SessionId: 1 Cid: 062c Peb: 7fffffdb000 ParentCid: 0558
DirBase: 7e401000 ObjectTable: fffff8a00381fc80 HandleCount: 111.
Image: windbg.exe
Handle table at fffff8a0038fa000 with 113 Entries in use
0000: free handle, Entry address fffff8a0038fa000, Next Entry 00000000fffffffe
0004: Object: fffff8a005022b70 GrantedAccess: 00000003 Entry: fffff8a0038fa010
Object: fffff8a005022b70 Type: (fffffa8002778f30) Directory
ObjectHeader: fffff8a005022b40fffff8a005022b40 (new version)
HandleCount: 25 PointerCount: 63
Directory Object: fffff8a000004980 Name: KnownDlls
0008: Object: fffffa8005226070 GrantedAccess: 00100020 Entry: fffff8a0038fa020
Object: fffffa8005226070 Type: (fffffa80027b3080) File
ObjectHeader: fffffa8005226040fffffa8005226040 (new version)
HandleCount: 1 PointerCount: 1
Directory Object: 00000000 Name: \Program Files\Debugging Tools for Windows (x64)
{HarddiskVolume2}
EXPERIMENT: SEARCHING FOR OPEN FILES WITH THE KERNEL DEBUGGER
Although you can use Process Explorer, Handle, and the OpenFiles.exe utility to search for open file handles, these tools are not available when looking at a crash dump or analyzing a system remotely. You can instead use the !devhandles command to search for handles opened to files on a specific volume. (See Chapter 8 in Part 2 for more information on devices, files, and volumes.)
1. First you need to pick the drive letter you are interested in and obtain the pointer to its Device object. You can use the !object command as shown here:
2. 1: kd> !object \Global??\C:
3. Object: fffff8a00016ea40 Type: (fffffa8000c38bb0) SymbolicLink
4. ObjectHeader: fffff8a00016ea10 (new version)
5. HandleCount: 0 PointerCount: 1
6. Directory Object: fffff8a000008060 Name: C:
7. Target String is '\Device\HarddiskVolume1'
Drive Letter Index is 3 (C:)
8. Next use the !object command to get the Device object of the target volume name:
9. 1: kd> !object \Device\HarddiskVolume1
Object: fffffa8001bd3cd0 Type: (fffffa8000ca0750) Device
10. Now you can use the pointer of the Device object with the !devhandles command. Each object shown points to a file:
11.!devhandles fffffa8001bd3cd0
12.Checking handle table for process 0xfffffa8000c819e0
13.Kernel handle table at fffff8a000001830 with 434 entries in use
14.
15.PROCESS fffffa8000c819e0
16. SessionId: none Cid: 0004 Peb: 00000000 ParentCid: 0000
17. DirBase: 00187000 ObjectTable: fffff8a000001830 HandleCount: 434.
18. Image: System
19.
20.0048: Object: fffffa8001d4f2a0 GrantedAccess: 0013008b Entry: fffff8a000003120
21.Object: fffffa8001d4f2a0 Type: (fffffa8000ca0360) File
22. ObjectHeader: fffffa8001d4f270 (new version)
23. HandleCount: 1 PointerCount: 19
24. Directory Object: 00000000 Name: \Windows\System32\LogFiles\WMI\
RtBackup\EtwRTEventLog-Application.etl {HarddiskVolume1}
Reserve Objects
Because objects represent anything from events to files to interprocess messages, the ability for applications and kernel code to create objects is essential to the normal and desired runtime behavior of any piece of Windows code. If an object allocation fails, this usually causes anywhere from loss of functionality (the process cannot open a file) to data loss or crashes (the process cannot allocate a synchronization object). Worse, in certain situations, the reporting of errors that led to object creation failure might themselves require new objects to be allocated. Windows implements two special reserve objects to deal with such situations: the User APC reserve object and the I/O Completion packet reserve object. Note that the reserve-object mechanism itself is fully extensible, and future versions of Windows might add other reserve object types—from a broad view, the reserve object is a mechanism enabling any kernel-mode data structure to be wrapped as an object (with an associated handle, name, and security) for later use.
As was discussed in the APC section earlier in this chapter, APCs are used for operations such as suspension, termination, and I/O completion, as well as communication between user-mode applications that want to provide asynchronous callbacks. When a user-mode application requests a User APC to be targeted to another thread, it uses the QueueUserApc API in Kernelbase.dll, which calls the NtQueueUserApcThread system call. In the kernel, this system call attempts to allocate a piece of paged pool in which to store the KAPC control object structure associated with an APC. In low-memory situations, this operation fails, preventing the delivery of the APC, which, depending on what the APC was used for, could cause loss of data or functionality.
To prevent this, the user-mode application, can, on startup, use the NtAllocateReserveObject system call to request the kernel to pre-allocate the KAPC structure. Then the application uses a different system call, NtQueueUserApcThreadEx, that contains an extra parameter that is used to store the handle to the reserve object. Instead of allocating a new structure, the kernel attempts to acquire the reserve object (by setting its InUse bit to true) and use it until the KAPC object is not needed anymore, at which point the reserve object is released back to the system. Currently, to prevent mismanagement of system resources by third-party developers, the reserve object API is available only internally through system calls for operating system components. For example, the RPC library uses reserved APC objects to guarantee asynchronous callbacks will still be able to return in low-memory situations.
A similar scenario can occur when applications need failure-free delivery of an I/O completion port message, or packet. Typically, packets are sent with the PostQueuedCompletionStatus API in Kernelbase.dll, which calls the NtSetIoCompletion API. Similarly to the user APC, the kernel must allocate an I/O manager structure to contain the completion-packet information, and if this allocation fails, the packet cannot be created. With reserve objects, the application can use the NtAllocateReserveObject API on startup to have the kernel pre-allocate the I/O completion packet, and the NtSetIoCompletionEx system call can be used to supply a handle to this reserve object, guaranteeing a success path. Just like User APC reserve objects, this functionality is reserved for system components and is used both by the RPC library and the Windows Peer-To-Peer BranchCache service (see Chapter 7, for more information on networking) to guarantee completion of asynchronous I/O operations.
Object Security
When you open a file, you must specify whether you intend to read or to write. If you try to write to a file that is opened for read access, you get an error. Likewise, in the executive, when a process creates an object or opens a handle to an existing object, the process must specify a set of desired access rights—that is, what it wants to do with the object. It can request either a set of standard access rights (such as read, write, and execute) that apply to all object types or specific access rights that vary depending on the object type. For example, the process can request delete access or append access to a file object. Similarly, it might require the ability to suspend or terminate a thread object.
When a process opens a handle to an object, the object manager calls the security reference monitor, the kernel-mode portion of the security system, sending it the process’ set of desired access rights. The security reference monitor checks whether the object’s security descriptor permits the type of access the process is requesting. If it does, the reference monitor returns a set of granted access rights that the process is allowed, and the object manager stores them in the object handle it creates. How the security system determines who gets access to which objects is explored in Chapter 6.
Thereafter, whenever the process’ threads use the handle through a service call, the object manager can quickly check whether the set of granted access rights stored in the handle corresponds to the usage implied by the object service the threads have called. For example, if the caller asked for read access to a section object but then calls a service to write to it, the service fails.
EXPERIMENT: LOOKING AT OBJECT SECURITY
You can look at the various permissions on an object by using either Process Explorer, WinObj, or AccessCheck, which are all tools from Sysinternals. Let’s look at different ways you can display the access control list (ACL) for an object:
§ You can use WinObj to navigate to any object on the system, including object directories, right-click on the object, and select Properties. For example, select the BaseNamedObjects directory, select Properties, and click on the Security tab. You should see a dialog box similar to the one shown next.
By examining the settings in the dialog box, you can see that the Everyone group doesn’t have delete access to the directory, for example, but the SYSTEM account does (because this is where session 0 services with SYSTEM privileges will store their objects).
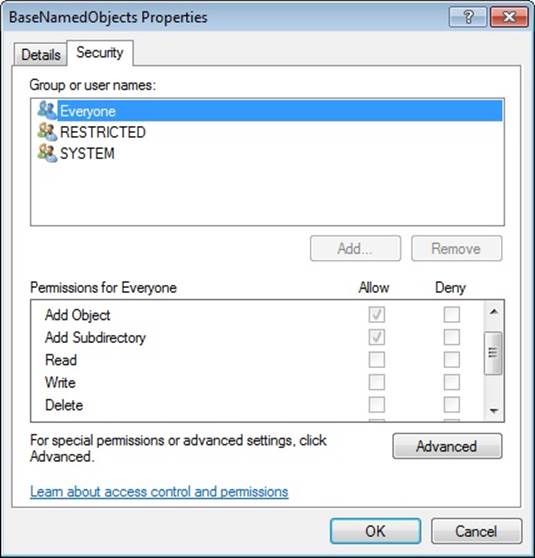
§ Instead of using WinObj, you can view the handle table of a process using Process Explorer, as shown in the experiment EXPERIMENT: Viewing Open Handles earlier in the chapter. Look at the handle table for the Explorer.exe process. You should notice a Directory object handle to the \Sessions\n\BaseNamedObjects directory. (We’ll describe the per-session namespace shortly.) You can double-click on the object handle and then click on the Security tab and see a similar dialog box (with more users and rights granted). Process Explorer cannot decode the specific object directory access rights, so all you’ll see are generic rights.
§ Finally, you can use AccessCheck to query the security information of any object by using the –o switch as shown in the following output. Note that using AccessCheck will also show you the integrity level of the object. (See Chapter 6 for more information on integrity levels and the security reference monitor.)
§ C:\Windows>accesschk -o \Sessions\1\BaseNamedObjects
§
§ Accesschk v5.02 - Reports effective permissions for securable objects
§ Copyright (C) 2006-2011 Mark Russinovich
§ Sysinternals - www.sysinternals.com
§
§ \sessions\2\BaseNamedObjects
§ Type: Directory
§ RW NT AUTHORITY\SYSTEM
§ RW NTDEV\markruss
§ RW NTDEV\S-1-5-5-0-5491067-markruss
§ RW BUILTIN\Administrators
§ R Everyone
NT AUTHORITY\RESTRICTED
Windows also supports Ex (Extended) versions of the APIs—CreateEventEx, CreateMutexEx, CreateSemaphoreEx—that add another argument for specifying the access mask. This makes it possible for applications to properly use discretionary access control lists (DACLs) to secure their objects without breaking their ability to use the create object APIs to open a handle to them. You might be wondering why a client application would not simply use OpenEvent, which does support a desired access argument. Using the open object APIs leads to an inherent race condition when dealing with a failure in the open call—that is, when the client application has attempted to open the event before it has been created. In most applications of this kind, the open API is followed by a create API in the failure case. Unfortunately, there is no guaranteed way to make this create operation atomic—in other words, to occur only once. Indeed, it would be possible for multiple threads and/or processes to have executed the create API concurrently and all attempt to create the event at the same time. This race condition and the extra complexity required to try and handle it makes using the open object APIs an inappropriate solution to the problem, which is why the Ex APIs should be used instead.
Object Retention
There are two types of objects: temporary and permanent. Most objects are temporary—that is, they remain while they are in use and are freed when they are no longer needed. Permanent objects remain until they are explicitly freed. Because most objects are temporary, the rest of this section describes how the object manager implements object retention—that is, retaining temporary objects only as long as they are in use and then deleting them. Because all user-mode processes that access an object must first open a handle to it, the object manager can easily track how many of these processes, and even which ones, are using an object. Tracking these handles represents one part of implementing retention. The object manager implements object retention in two phases. The first phase is called name retention, and it is controlled by the number of open handles to an object that exist. Every time a process opens a handle to an object, the object manager increments the open handle counter in the object’s header. As processes finish using the object and close their handles to it, the object manager decrements the open handle counter. When the counter drops to 0, the object manager deletes the object’s name from its global namespace. This deletion prevents processes from opening a handle to the object.
The second phase of object retention is to stop retaining the objects themselves (that is, to delete them) when they are no longer in use. Because operating system code usually accesses objects by using pointers instead of handles, the object manager must also record how many object pointers it has dispensed to operating system processes. It increments a reference count for an object each time it gives out a pointer to the object; when kernel-mode components finish using the pointer, they call the object manager to decrement the object’s reference count. The system also increments the reference count when it increments the handle count, and likewise decrements the reference count when the handle count decrements, because a handle is also a reference to the object that must be tracked.
Figure 3-23 illustrates two event objects that are in use. Process A has the first event open. Process B has both events open. In addition, the first event is being referenced by some kernel-mode structure; thus, the reference count is 3. So even if Processes A and B closed their handles to the first event object, it would continue to exist because its reference count is 1. However, when Process B closes its handle to the second event object, the object would be deallocated.
So even after an object’s open handle counter reaches 0, the object’s reference count might remain positive, indicating that the operating system is still using the object. Ultimately, when the reference count drops to 0, the object manager deletes the object from memory. This deletion has to respect certain rules and also requires cooperation from the caller in certain cases. For example, because objects can be present both in paged or nonpaged pool memory (depending on the settings located in their object type), if a dereference occurs at an IRQL level of dispatch or higher and this dereference causes the pointer count to drop to 0, the system would crash if it attempted to immediately free the memory of a paged-pool object. (Recall that such access is illegal because the page fault will never be serviced.) In this scenario, the object manager performs a deferred delete operation, queuing the operation on a worker thread running at passive level (IRQL 0). We’ll describe more about system worker threads later in this chapter.
Another scenario that requires deferred deletion is when dealing with Kernel Transaction Manager (KTM) objects. In some scenarios, certain drivers might hold a lock related to this object, and attempting to delete the object will result in the system attempting to acquire this lock. However, the driver might never get the chance to release its lock, causing a deadlock. When dealing with KTM objects, driver developers must use ObDereferenceObjectDeferDelete to force deferred deletion regardless of IRQL level. Finally, the I/O manager also uses this mechanism as an optimization so that certain I/Os can complete more quickly, instead of waiting for the object manager to delete the object.
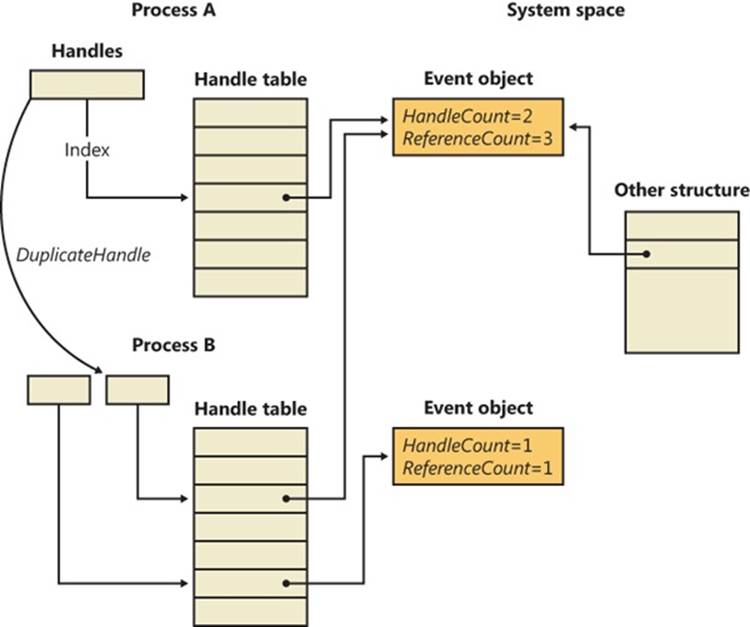
Figure 3-23. Handles and reference counts
Because of the way object retention works, an application can ensure that an object and its name remain in memory simply by keeping a handle open to the object. Programmers who write applications that contain two or more cooperating processes need not be concerned that one process might delete an object before the other process has finished using it. In addition, closing an application’s object handles won’t cause an object to be deleted if the operating system is still using it. For example, one process might create a second process to execute a program in the background; it then immediately closes its handle to the process. Because the operating system needs the second process to run the program, it maintains a reference to its process object. Only when the background program finishes executing does the object manager decrement the second process’ reference count and then delete it.
Because object leaks can be dangerous to the system by leaking kernel pool memory and eventually causing systemwide memory starvation—and can also break applications in subtle ways—Windows includes a number of debugging mechanisms that can be enabled to monitor, analyze, and debug issues with handles and objects. Additionally, Debugging Tools for Windows come with two extensions that tap into these mechanisms and provide easy graphical analysis. Table 3-16 describes them.
Table 3-16. Debugging Mechanisms for Object Handles
|
Mechanism |
Enabled By |
Kernel Debugger Extension |
|
Handle Tracing Database |
Kernel Stack Trace systemwide and/or per-process with the User Stack Trace option checked with Gflags.exe. |
!htrace <handle value> <process ID> |
|
Object Reference Tracing |
Per-process-name(s), or per-object-type-pool-tag(s), with Gflags.exe, under Object Reference Tracing. |
!obtrace <object pointer> |
|
Object Reference Tagging |
Drivers must call appropriate API. |
N/A |
Enabling the handle-tracing database is useful when attempting to understand the use of each handle within an application or the system context. The !htrace debugger extension can display the stack trace captured at the time a specified handle was opened. After you discover a handle leak, the stack trace can pinpoint the code that is creating the handle, and it can be analyzed for a missing call to a function such as CloseHandle.
The object-reference-tracing !obtrace extension monitors even more by showing the stack trace for each new handle created as well as each time a handle is referenced by the kernel (and also each time it is opened, duplicated, or inherited) and dereferenced. By analyzing these patterns, misuse of an object at the system level can be more easily debugged. Additionally, these reference traces provide a way to understand the behavior of the system when dealing with certain objects. Tracing processes, for example, display references from all the drivers on the system that have registered callback notifications (such as Process Monitor) and help detect rogue or buggy third-party drivers that might be referencing handles in kernel mode but never dereferencing them.
NOTE
When enabling object-reference tracing for a specific object type, you can obtain the name of its pool tag by looking at the key member of the OBJECT_TYPE structure when using the dt command. Each object type on the system has a global variable that references this structure—for example, PsProcessType. Alternatively, you can use the !object command, which displays the pointer to this structure.
Unlike the previous two mechanisms, object-reference tagging is not a debugging feature that must be enabled with global flags or the debugger, but rather a set of APIs that should be used by device-driver developers to reference and dereference objects, includingObReferenceObjectWithTag and ObDereferenceObjectWithTag. Similar to pool tagging (see Chapter 10 in Part 2 for more information on pool tagging), these APIs allow developers to supply a four-character tag identifying each reference/dereference pair. When using the !obtraceextension just described, the tag for each reference or dereference operation is also shown, which avoids solely using the call stack as a mechanism to identify where leaks or under-references might occur, especially if a given call is performed thousands of times by the driver.
Resource Accounting
Resource accounting, like object retention, is closely related to the use of object handles. A positive open handle count indicates that some process is using that resource. It also indicates that some process is being charged for the memory the object occupies. When an object’s handle count and reference count drop to 0, the process that was using the object should no longer be charged for it.
Many operating systems use a quota system to limit processes’ access to system resources. However, the types of quotas imposed on processes are sometimes diverse and complicated, and the code to track the quotas is spread throughout the operating system. For example, in some operating systems, an I/O component might record and limit the number of files a process can open, whereas a memory component might impose a limit on the amount of memory a process’ threads can allocate. A process component might limit users to some maximum number of new processes they can create or a maximum number of threads within a process. Each of these limits is tracked and enforced in different parts of the operating system.
In contrast, the Windows object manager provides a central facility for resource accounting. Each object header contains an attribute called quota charges that records how much the object manager subtracts from a process’ allotted paged and/or nonpaged pool quota when a thread in the process opens a handle to the object.
Each process on Windows points to a quota structure that records the limits and current values for nonpaged-pool, paged-pool, and page-file usage. These quotas default to 0 (no limit) but can be specified by modifying registry values. (You need to add/edit NonPagedPoolQuota,PagedPoolQuota, and PagingFileQuota under HKLM\SYSTEM\CurrentControlSet\Control\Session Manager\Memory Management.) Note that all the processes in an interactive session share the same quota block (and there’s no documented way to create processes with their own quota blocks).
Object Names
An important consideration in creating a multitude of objects is the need to devise a successful system for keeping track of them. The object manager requires the following information to help you do so:
§ A way to distinguish one object from another
§ A method for finding and retrieving a particular object
The first requirement is served by allowing names to be assigned to objects. This is an extension of what most operating systems provide—the ability to name selected resources, files, pipes, or a block of shared memory, for example. The executive, in contrast, allows any resource represented by an object to have a name. The second requirement, finding and retrieving an object, is also satisfied by object names. If the object manager stores objects by name, it can find an object by looking up its name.
Object names also satisfy a third requirement, which is to allow processes to share objects. The executive’s object namespace is a global one, visible to all processes in the system. One process can create an object and place its name in the global namespace, and a second process can open a handle to the object by specifying the object’s name. If an object isn’t meant to be shared in this way, its creator doesn’t need to give it a name.
To increase efficiency, the object manager doesn’t look up an object’s name each time someone uses the object. Instead, it looks up a name under only two circumstances. The first is when a process creates a named object: the object manager looks up the name to verify that it doesn’t already exist before storing the new name in the global namespace. The second is when a process opens a handle to a named object: the object manager looks up the name, finds the object, and then returns an object handle to the caller; thereafter, the caller uses the handle to refer to the object. When looking up a name, the object manager allows the caller to select either a case-sensitive or case-insensitive search, a feature that supports Subsystem for UNIX Applications and other environments that use case-sensitive file names.
Object Directories
The object directory object is the object manager’s means for supporting this hierarchical naming structure. This object is analogous to a file system directory and contains the names of other objects, possibly even other object directories. The object directory object maintains enough information to translate these object names into pointers to the objects themselves. The object manager uses the pointers to construct the object handles that it returns to user-mode callers. Both kernel-mode code (including executive components and device drivers) and user-mode code (such as subsystems) can create object directories in which to store objects. For example, the I/O manager creates an object directory named \Device, which contains the names of objects representing I/O devices.
Where the names of objects are stored depends on the object type. Table 3-17 lists the standard object directories found on all Windows systems and what types of objects have their names stored there. Of the directories listed, only \BaseNamedObjects and \Global?? are visible tostandard Windows applications. (See the Session Namespace section later in this chapter for more information.)
Table 3-17. Standard Object Directories
|
Directory |
Types of Object Names Stored |
|
\ArcName |
Symbolic links mapping ARC-style paths to NT-style paths. |
|
\BaseNamedObjects |
Global mutexes, events, semaphores, waitable timers, jobs, ALPC ports, symbolic links, and section objects. |
|
\Callback |
Callback objects. |
|
\Device |
Device objects. |
|
\Driver |
Driver objects. |
|
\FileSystem |
File-system driver objects and file-system-recognizer device objects. The Filter Manager also creates its own device objects under the Filters subkey. |
|
\GLOBAL?? |
MS-DOS device names. (The \Sessions\0\DosDevices\<LUID>\Global directories are symbolic links to this directory.) |
|
\KernelObjects |
Contains event objects that signal low resource conditions, memory errors, the completion of certain operating system tasks, as well as objects representing Sessions. |
|
\KnownDlls |
Section names and path for known DLLs (DLLs mapped by the system at startup time). |
|
\KnownDlls32 |
On a 64-bit Windows installation, \KnownDlls contains the native 64-bit binaries, so this directory is used instead to store Wow64 32-bit versions of those DLLs. |
|
\Nls |
Section names for mapped national language support tables. |
|
\ObjectTypes |
Names of types of objects. |
|
\PSXSS |
If Subsystem for UNIX Applications is enabled (through installation of the SUA component), this contains ALPC ports used by Subsystem for UNIX Applications. |
|
\RPC Control |
ALPC ports used by remote procedure calls (RPCs), and events used by Conhost.exe as part of the console isolation mechanism. |
|
\Security |
ALPC ports and events used by names of objects specific to the security subsystem. |
|
\Sessions |
Per-session namespace directory. (See the next subsection.) |
|
\UMDFCommunicationPorts |
ALPC ports used by the User-Mode Driver Framework (UMDF). |
|
\Windows |
Windows subsystem ALPC ports, shared section, and window stations. |
Because the base kernel objects such as mutexes, events, semaphores, waitable timers, and sections have their names stored in a single object directory, no two of these objects can have the same name, even if they are of a different type. This restriction emphasizes the need to choose names carefully so that they don’t collide with other names. For example, you could prefix names with a GUID and/or combine the name with the user’s security identifier (SID).
Object names are global to a single computer (or to all processors on a multiprocessor computer), but they’re not visible across a network. However, the object manager’s parse method makes it possible to access named objects that exist on other computers. For example, the I/O manager, which supplies file-object services, extends the functions of the object manager to remote files. When asked to open a remote file object, the object manager calls a parse method, which allows the I/O manager to intercept the request and deliver it to a network redirector, a driver that accesses files across the network. Server code on the remote Windows system calls the object manager and the I/O manager on that system to find the file object and return the information back across the network.
One security consideration to keep in mind when dealing with named objects is the possibility of object name squatting. Although object names in different sessions are protected from each other, there’s no standard protection inside the current session namespace that can be set with the standard Windows API. This makes it possible for an unprivileged application running in the same session as a privileged application to access its objects, as described earlier in the object security subsection. Unfortunately, even if the object creator used a proper DACL to secure the object, this doesn’t help against the squatting attack, in which the unprivileged application creates the object before the privileged application, thus denying access to the legitimate application.
Windows exposes the concept of a private namespace to alleviate this issue. It allows user-mode applications to create object directories through the CreatePrivateNamespace API and associate these directories with boundary descriptors, which are special data structures protecting the directories. These descriptors contain SIDs describing which security principals are allowed access to the object directory. In this manner, a privileged application can be sure that unprivileged applications will not be able to conduct a denial-of-service attack against its objects. (This doesn’t stop a privileged application from doing the same, however, but this point is moot.) Additionally, a boundary descriptor can also contain an integrity level, protecting objects possibly belonging to the same user account as the application, based on the integrity level of the process. (See Chapter 6 for more information on integrity levels.)
EXPERIMENT: LOOKING AT THE BASE NAMED OBJECTS
You can see the list of base objects that have names with the WinObj tool from Sysinternals. Run Winobj.exe., and click on \BaseNamedObjects, as shown here:
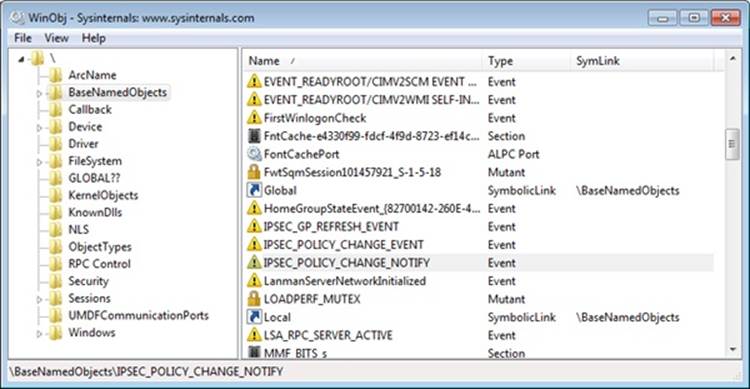
The named objects are shown on the right. The icons indicate the object type:
§ Mutexes are indicated with a lock sign.
§ Sections (Windows file-mapping objects) are shown as memory chips.
§ Events are shown as exclamation points.
§ Semaphores are indicated with an icon that resembles a traffic signal.
§ Symbolic links have icons that are curved arrows.
§ Folders indicate object directories.
§ Gears indicate other objects, such as ALPC ports.
EXPERIMENT: TAMPERING WITH SINGLE INSTANCING
Applications such as Windows Media Player and those in Microsoft Office are common examples of single-instancing enforcement through named objects. Notice that when launching the Wmplayer.exe executable, Windows Media Player appears only once—every other launch simply results in the window coming back into focus. You can tamper with the handle list by using Process Explorer to turn the computer into a media mixer! Here’s how:
1. Launch Windows Media Player and Process Explorer to view the handle table (by clicking View, Lower Pane View, and then Handles). You should see a handle whose name column contains CheckForOtherInstanceMutex.
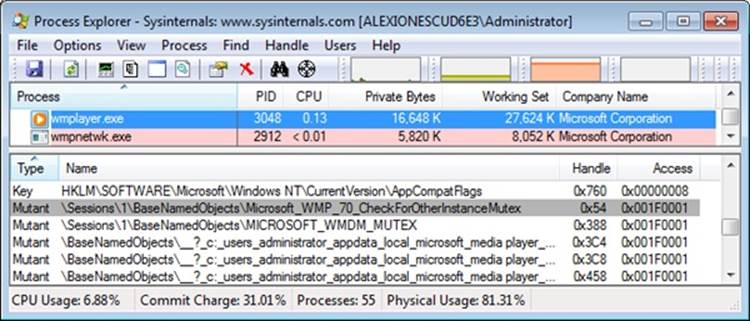
2. Right-click on the handle, and select Close Handle. Confirm the action when asked.
3. Now run Windows Media Player again. Notice that this time a second process is created.
4. Go ahead and play a different song in each instance. You can also use the Sound Mixer in the system tray (click on the Volume icon) to select which of the two processes will have greater volume, effectively creating a mixing environment.
Instead of closing a handle to a named object, an application could have run on its own before Windows Media Player and created an object with the same name. In this scenario, Windows Media Player would never run, fooled into believing it was already running on the system.
Symbolic Links
In certain file systems (on NTFS and some UNIX systems, for example), a symbolic link lets a user create a file name or a directory name that, when used, is translated by the operating system into a different file or directory name. Using a symbolic link is a simple method for allowing users to indirectly share a file or the contents of a directory, creating a cross-link between different directories in the ordinarily hierarchical directory structure.
The object manager implements an object called a symbolic link object, which performs a similar function for object names in its object namespace. A symbolic link can occur anywhere within an object name string. When a caller refers to a symbolic link object’s name, the object manager traverses its object namespace until it reaches the symbolic link object. It looks inside the symbolic link and finds a string that it substitutes for the symbolic link name. It then restarts its name lookup.
One place in which the executive uses symbolic link objects is in translating MS-DOS-style device names into Windows internal device names. In Windows, a user refers to hard disk drives using the names C:, D:, and so on and serial ports as COM1, COM2, and so on. The Windows subsystem makes these symbolic link objects protected, global data by placing them in the object manager namespace under the \Global?? directory.
Session Namespace
Services have access to the global namespace, a namespace that serves as the first instance of the namespace. Additional sessions are given a session-private view of the namespace known as a local namespace. The parts of the namespace that are localized for each session include \DosDevices, \Windows, and \BaseNamedObjects. Making separate copies of the same parts of the namespace is known as instancing the namespace. Instancing \DosDevices makes it possible for each user to have different network drive letters and Windows objects such as serial ports. On Windows, the global \DosDevices directory is named \Global?? and is the directory to which \DosDevices points, and local \DosDevices directories are identified by the logon session ID.
The \Windows directory is where Win32k.sys inserts the interactive window station created by Winlogon, \WinSta0. A Terminal Services environment can support multiple interactive users, but each user needs an individual version of WinSta0 to preserve the illusion that he is accessing the predefined interactive window station in Windows. Finally, applications and the system create shared objects in \BaseNamedObjects, including events, mutexes, and memory sections. If two users are running an application that creates a named object, each user session must have a private version of the object so that the two instances of the application don’t interfere with one another by accessing the same object.
The object manager implements a local namespace by creating the private versions of the three directories mentioned under a directory associated with the user’s session under \Sessions\n (where n is the session identifier). When a Windows application in remote session two creates a named event, for example, the object manager transparently redirects the object’s name from \BaseNamedObjects to \Sessions\2\BaseNamedObjects.
All object-manager functions related to namespace management are aware of the instanced directories and participate in providing the illusion that all sessions use the same namespace. Windows subsystem DLLs prefix names passed by Windows applications that reference objects in \DosDevices with \?? (for example, C:\Windows becomes \??\C:\Windows). When the object manager sees the special \?? prefix, the steps it takes depends on the version of Windows, but it always relies on a field named DeviceMap in the executive process object (EPROCESS, which is described further in Chapter 5) that points to a data structure shared by other processes in the same session.
The DosDevicesDirectory field of the DeviceMap structure points at the object manager directory that represents the process’ local \DosDevices. When the object manager sees a reference to \??, it locates the process’ local \DosDevices by using the DosDevicesDirectory field of theDeviceMap. If the object manager doesn’t find the object in that directory, it checks the DeviceMap field of the directory object. If it’s valid, it looks for the object in the directory pointed to by the GlobalDosDevicesDirectory field of the DeviceMap structure, which is always \Global??.
Under certain circumstances, applications that are session–aware need to access objects in the global session even if the application is running in another session. The application might want to do this to synchronize with instances of itself running in other remote sessions or with the console session (that is, session 0). For these cases, the object manager provides the special override “\Global” that an application can prefix to any object name to access the global namespace. For example, an application in session two opening an object named \Global\ApplicationInitialized is directed to \BaseNamedObjects\ApplicationInitialized instead of \Sessions\2\BaseNamedObjects\ApplicationInitialized.
An application that wants to access an object in the global \DosDevices directory does not need to use the \Global prefix as long as the object doesn’t exist in its local \DosDevices directory. This is because the object manager automatically looks in the global directory for the object if it doesn’t find it in the local directory. However, an application can force checking the global directory by using \GLOBALROOT.
Session directories are isolated from each other, and administrative privileges are required to create a global object (except for section objects). A special privilege named create global object is verified before allowing such operations.
EXPERIMENT: VIEWING NAMESPACE INSTANCING
You can see the separation between the session 0 namespace and other session namespaces as soon as you log in. The reason you can is that the first console user is logged in to session 1 (while services run in session 0). Run Winobj.exe, and click on the \Sessions directory. You’ll see a subdirectory with a numeric name for each active session. If you open one of these directories, you’ll see subdirectories named \DosDevices, \Windows, and \BaseNamedObjects, which are the local namespace subdirectories of the session. The following screen shot shows a local namespace:
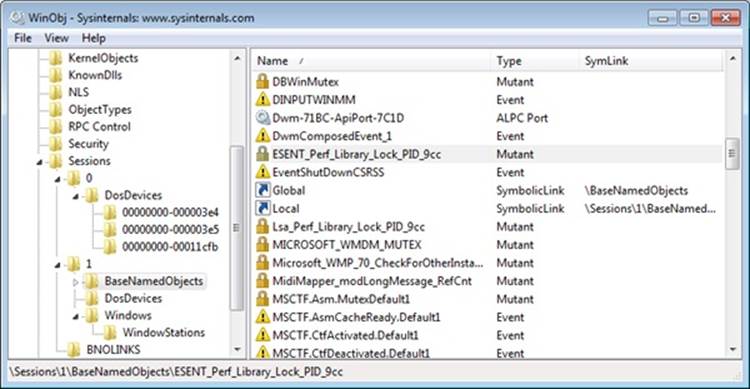
Next run Process Explorer and select a process in your session (such as Explorer.exe), and then view the handle table (by clicking View, Lower Pane View, and then Handles). You should see a handle to \Windows\WindowStations\WinSta0 underneath\Sessions\n, where n is the session ID.
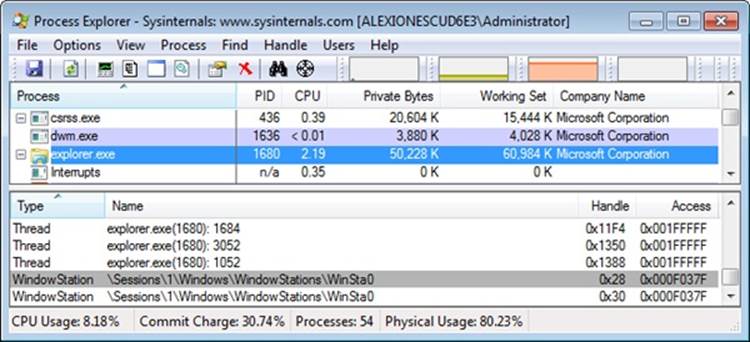
Object Filtering
Windows includes a filtering model in the object manager, similar to the file system minifilter model described in Chapter 8 in Part 2. One of the primary benefits of this filtering model is the ability to use the altitude concept that these existing filtering technologies use, which means that multiple drivers can filter object-manager events at appropriate locations in the filtering stack. Additionally, drivers are permitted to intercept calls such as NtOpenThread and NtOpenProcess and even to modify the access masks being requested from the process manager. This allows protection against certain operations on an open handle—however, an open operation cannot be entirely blocked because doing so would too closely resemble a malicious operation (processes that could never be managed).
Furthermore, drivers are able to take advantage of both pre and post callbacks, allowing them to prepare for a certain operation before it occurs, as well as to react or finalize information after the operation has occurred. These callbacks can be specified for each operation (currently, only open, create, and duplicate are supported) and be specific for each object type (currently, only process and thread objects are supported). For each callback, drivers can specify their own internal context value, which can be returned across all calls to the driver or across a pre/post pair. These callbacks can be registered with the ObRegisterCallbacks API and unregistered with the ObUnregisterCallbacks API—it is the responsibility of the driver to ensure deregistration happens.
Use of the APIs is restricted to images that have certain characteristics:
§ The image must be signed, even on 32-bit computers, according to the same rules set forth in the Kernel Mode Code Signing (KMCS) policy. (Code integrity will be discussed later in this chapter.) The image must be compiled with the /integritycheck linker flag, which sets the IMAGE_DLLCHARACTERISTICS_FORCE_INTEGRITY value in the PE header. This instructs the memory manager to check the signature of the image regardless of any other defaults that might not normally result in a check.
§ The image must be signed with a catalog containing cryptographic per-page hashes of the executable code. This allows the system to detect changes to the image after it has been loaded in memory.
Before executing a callback, the object manager calls the MmVerifyCallbackFunction on the target function pointer, which in turn locates the loader data table entry associated with the module owning this address, and verifies whether or not the LDRP_IMAGE_INTEGRITY_FORCED flag is set. (See the Loaded Module Database section in this chapter for more information.)
Synchronization
The concept of mutual exclusion is a crucial one in operating systems development. It refers to the guarantee that one, and only one, thread can access a particular resource at a time. Mutual exclusion is necessary when a resource doesn’t lend itself to shared access or when sharing would result in an unpredictable outcome. For example, if two threads copy a file to a printer port at the same time, their output could be interspersed. Similarly, if one thread reads a memory location while another one writes to it, the first thread will receive unpredictable data. In general, writable resources can’t be shared without restrictions, whereas resources that aren’t subject to modification can be shared. Figure 3-24 illustrates what happens when two threads running on different processors both write data to a circular queue.
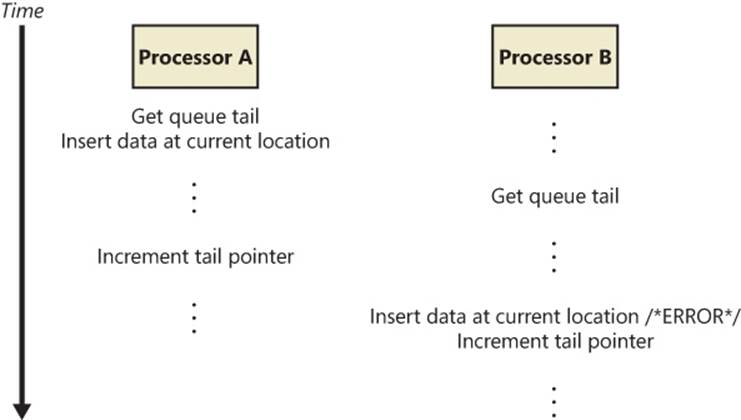
Figure 3-24. Incorrect sharing of memory
Because the second thread obtained the value of the queue tail pointer before the first thread finished updating it, the second thread inserted its data into the same location that the first thread used, overwriting data and leaving one queue location empty. Even though Figure 3-24illustrates what could happen on a multiprocessor system, the same error could occur on a single-processor system if the operating system performed a context switch to the second thread before the first thread updated the queue tail pointer.
Sections of code that access a nonshareable resource are called critical sections. To ensure correct code, only one thread at a time can execute in a critical section. While one thread is writing to a file, updating a database, or modifying a shared variable, no other thread can be allowed to access the same resource. The pseudocode shown in Figure 3-24 is a critical section that incorrectly accesses a shared data structure without mutual exclusion.
The issue of mutual exclusion, although important for all operating systems, is especially important (and intricate) for a tightly coupled, symmetric multiprocessing (SMP) operating system such as Windows, in which the same system code runs simultaneously on more than one processor, sharing certain data structures stored in global memory. In Windows, it is the kernel’s job to provide mechanisms that system code can use to prevent two threads from modifying the same structure at the same time. The kernel provides mutual-exclusion primitives that it and the rest of the executive use to synchronize their access to global data structures.
Because the scheduler synchronizes access to its data structures at DPC/dispatch level IRQL, the kernel and executive cannot rely on synchronization mechanisms that would result in a page fault or reschedule operation to synchronize access to data structures when the IRQL is DPC/dispatch level or higher (levels known as an elevated or high IRQL). In the following sections, you’ll find out how the kernel and executive use mutual exclusion to protect their global data structures when the IRQL is high and what mutual-exclusion and synchronization mechanisms the kernel and executive use when the IRQL is low (below DPC/dispatch level).
High-IRQL Synchronization
At various stages during its execution, the kernel must guarantee that one, and only one, processor at a time is executing within a critical section. Kernel critical sections are the code segments that modify a global data structure such as the kernel’s dispatcher database or its DPC queue. The operating system can’t function correctly unless the kernel can guarantee that threads access these data structures in a mutually exclusive manner.
The biggest area of concern is interrupts. For example, the kernel might be updating a global data structure when an interrupt occurs whose interrupt-handling routine also modifies the structure. Simple single-processor operating systems sometimes prevent such a scenario by disabling all interrupts each time they access global data, but the Windows kernel has a more sophisticated solution. Before using a global resource, the kernel temporarily masks the interrupts whose interrupt handlers also use the resource. It does so by raising the processor’s IRQL to the highest level used by any potential interrupt source that accesses the global data. For example, an interrupt at DPC/dispatch level causes the dispatcher, which uses the dispatcher database, to run. Therefore, any other part of the kernel that uses the dispatcher database raises the IRQL to DPC/dispatch level, masking DPC/dispatch-level interrupts before using the dispatcher database.
This strategy is fine for a single-processor system, but it’s inadequate for a multiprocessor configuration. Raising the IRQL on one processor doesn’t prevent an interrupt from occurring on another processor. The kernel also needs to guarantee mutually exclusive access across several processors.
Interlocked Operations
The simplest form of synchronization mechanisms rely on hardware support for multiprocessor-safe manipulation of integer values and for performing comparisons. They include functions such as InterlockedIncrement, InterlockedDecrement, InterlockedExchange, andInterlockedCompareExchange. The InterlockedDecrement function, for example, uses the x86 lock instruction prefix (for example, lock xadd) to lock the multiprocessor bus during the subtraction operation so that another processor that’s also modifying the memory location being decremented won’t be able to modify it between the decrementing processor’s read of the original value and its write of the decremented value. This form of basic synchronization is used by the kernel and drivers. In today’s Microsoft compiler suite, these functions are called intrinsicbecause the code for them is generated in an inline assembler, directly during the compilation phase, instead of going through a function call. (It’s likely that pushing the parameters onto the stack, calling the function, copying the parameters into registers, and then popping the parameters off the stack and returning to the caller would be a more expensive operation than the actual work the function is supposed to do in the first place.)
Spinlocks
The mechanism the kernel uses to achieve multiprocessor mutual exclusion is called a spinlock. A spinlock is a locking primitive associated with a global data structure such as the DPC queue shown in Figure 3-25.
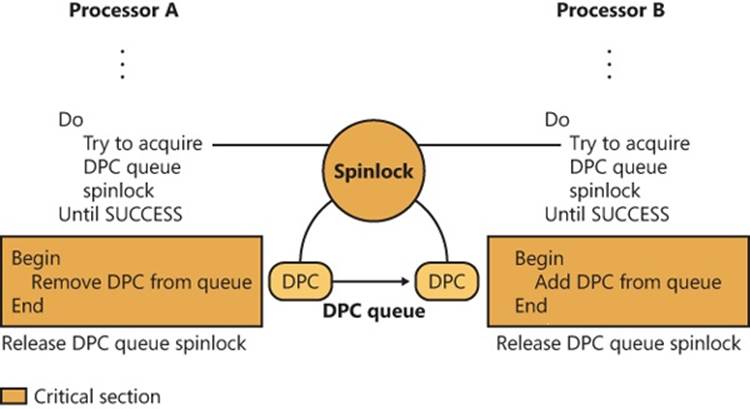
Figure 3-25. Using a spinlock
Before entering either critical section shown in Figure 3-25, the kernel must acquire the spinlock associated with the protected DPC queue. If the spinlock isn’t free, the kernel keeps trying to acquire the lock until it succeeds. The spinlock gets its name from the fact that the kernel (and thus, the processor) waits, “spinning,” until it gets the lock.
Spinlocks, like the data structures they protect, reside in nonpaged memory mapped into the system address space. The code to acquire and release a spinlock is written in assembly language for speed and to exploit whatever locking mechanism the underlying processor architecture provides. On many architectures, spinlocks are implemented with a hardware-supported test-and-set operation, which tests the value of a lock variable and acquires the lock in one atomic instruction. Testing and acquiring the lock in one instruction prevents a second thread from grabbing the lock between the time the first thread tests the variable and the time it acquires the lock. Additionally, the lock instruction mentioned earlier can also be used on the test-and-set operation, resulting in the combined lock bts assembly operation, which also locks the multiprocessor bus; otherwise, it would be possible for more than one processor to atomically perform the operation. (Without the lock, the operation is guaranteed to be atomic only on the current processor.)
All kernel-mode spinlocks in Windows have an associated IRQL that is always DPC/dispatch level or higher. Thus, when a thread is trying to acquire a spinlock, all other activity at the spinlock’s IRQL or lower ceases on that processor. Because thread dispatching happens at DPC/dispatch level, a thread that holds a spinlock is never preempted because the IRQL masks the dispatching mechanisms. This masking allows code executing in a critical section protected by a spinlock to continue executing so that it will release the lock quickly. The kernel uses spinlocks with great care, minimizing the number of instructions it executes while it holds a spinlock. Any processor that attempts to acquire the spinlock will essentially be busy, waiting indefinitely, consuming power (a busy wait results in 100% CPU usage) and performing no actual work.
On x86 and x64 processors, a special pause assembly instruction can be inserted in busy wait loops. This instruction offers a hint to the processor that the loop instructions it is processing are part of a spinlock (or a similar construct) acquisition loop. The instruction provides three benefits:
§ It significantly reduces power usage by delaying the core ever so slightly instead of continuously looping.
§ On HyperThreaded cores, it allows the CPU to realize that the “work” being done by the spinning logical core is not terribly important and awards more CPU time to the second logical core instead.
§ Because a busy wait loop results in a storm of read requests coming to the bus from the waiting thread (which might be generated out of order), the CPU attempts to correct for violations of memory order as soon as it detects a write (that is, when the owning thread releases the lock). Thus, as soon as the spinlock is released, the CPU reorders any pending memory read operations to ensure proper ordering. This reordering results in a large penalty in system performance and can be avoided with the pause instruction.
The kernel makes spinlocks available to other parts of the executive through a set of kernel functions, including KeAcquireSpinLock and KeReleaseSpinLock. Device drivers, for example, require spinlocks to guarantee that device registers and other global data structures are accessed by only one part of a device driver (and from only one processor) at a time. Spinlocks are not for use by user programs—user programs should use the objects described in the next section. Device drivers also need to protect access to their own data structures from interrupts associated with themselves. Because the spinlock APIs typically raise the IRQL only to DPC/dispatch level, this isn’t enough to protect against interrupts. For this reason, the kernel also exports the KeAcquireInterruptSpinLock and KeReleaseInterruptSpinLock APIs that take as a parameter the KINTERRUPT object discussed at the beginning of this chapter. The system looks inside the interrupt object for the associated DIRQL with the interrupt and raises the IRQL to the appropriate level to ensure correct access to structures shared with the ISR. Devices can use theKeSynchronizeExecution API to synchronize an entire function with an ISR, instead of just a critical section. In all cases, the code protected by an interrupt spinlock must execute extremely quickly—any delay causes higher-than-normal interrupt latency and will have significant negative performance effects.
Kernel spinlocks carry with them restrictions for code that uses them. Because spinlocks always have an IRQL of DPC/dispatch level or higher, as explained earlier, code holding a spinlock will crash the system if it attempts to make the scheduler perform a dispatch operation or if it causes a page fault.
Queued Spinlocks
To increase the scalability of spinlocks, a special type of spinlock, called a queued spinlock, is used in most circumstances instead of a standard spinlock. A queued spinlock works like this: When a processor wants to acquire a queued spinlock that is currently held, it places its identifier in a queue associated with the spinlock. When the processor that’s holding the spinlock releases it, it hands the lock over to the first processor identified in the queue. In the meantime, a processor waiting for a busy spinlock checks the status not of the spinlock itself but of a per-processor flag that the processor ahead of it in the queue sets to indicate that the waiting processor’s turn has arrived.
The fact that queued spinlocks result in spinning on per-processor flags rather than global spinlocks has two effects. The first is that the multiprocessor’s bus isn’t as heavily trafficked by interprocessor synchronization. The second is that instead of a random processor in a waiting group acquiring a spinlock, the queued spinlock enforces first-in, first-out (FIFO) ordering to the lock. FIFO ordering means more consistent performance across processors accessing the same locks.
Windows defines a number of global queued spinlocks by storing pointers to them in an array contained in each processor’s processor region control block (PRCB). A global spinlock can be acquired by calling KeAcquireQueuedSpinLock with the index into the PRCB array at which the pointer to the spinlock is stored. The number of global spinlocks has grown in each release of the operating system, and the table of index definitions for them is published in the WDK header file Wdm.h. Note, however, that acquiring one of these queued spinlocks from a device driver is an unsupported and heavily frowned-upon operation. These locks are reserved for the kernel’s own internal use.
EXPERIMENT: VIEWING GLOBAL QUEUED SPINLOCKS
You can view the state of the global queued spinlocks (the ones pointed to by the queued spinlock array in each processor’s PCR) by using the !qlocks kernel debugger command. In the following example, the page frame number (PFN) database queued spinlock is held by processor 1, and the other queued spinlocks are not acquired. (The PFN database is described in Chapter 10 in Part 2.)
lkd> !qlocks
Key: O = Owner, 1-n = Wait order, blank = not owned/waiting, C = Corrupt
Processor Number
Lock Name 0 1
KE - Unused Spare
MM - Expansion
MM - Unused Spare
MM - System Space
CC - Vacb
CC - Master
Instack Queued Spinlocks
Device drivers can use dynamically allocated queued spinlocks with the KeAcquireInStackQueuedSpinLock and KeReleaseInStackQueuedSpinLock functions. Several components—including the cache manager, executive pool manager, and NTFS—take advantage of these types of locks instead of using global queued spinlocks.
KeAcquireInStackQueuedSpinLock takes a pointer to a spinlock data structure and a spinlock queue handle. The spinlock handle is actually a data structure in which the kernel stores information about the lock’s status, including the lock’s ownership and the queue of processors that might be waiting for the lock to become available. For this reason, the handle shouldn’t be a global variable. It is usually a stack variable, guaranteeing locality to the caller thread and is responsible for the InStack part of the spinlock and API name.
Executive Interlocked Operations
The kernel supplies a number of simple synchronization functions constructed on spinlocks for more advanced operations, such as adding and removing entries from singly and doubly linked lists. Examples include ExInterlockedPopEntryList and ExInterlockedPushEntryList for singly linked lists, and ExInterlockedInsertHeadList and ExInterlockedRemoveHeadList for doubly linked lists. All these functions require a standard spinlock as a parameter and are used throughout the kernel and device drivers.
Instead of relying on the standard APIs to acquire and release the spinlock parameter, these functions place the code required inline and also use a different ordering scheme. Whereas the Ke spinlock APIs first test and set the bit to see whether the lock is released and then atomically do a locked test-and-set operation to actually make the acquisition, these routines disable interrupts on the processor and immediately attempt an atomic test-and-set. If the initial attempt fails, interrupts are enabled again, and the standard busy waiting algorithm continues until the test-and-set operation returns 0—in which case, the whole function is restarted again. Because of these subtle differences, a spinlock used for the executive interlocked functions must not be used with the standard kernel APIs discussed previously. Naturally, noninterlocked list operations must not be mixed with interlocked operations.
NOTE
Certain executive interlocked operations silently ignore the spinlock when possible. For example, the ExInterlockedIncrementLong or ExInterlockedCompareExchange APIs actually use the same lock prefix used by the standard interlocked functions and the intrinsic functions. These functions were useful on older systems (or non-x86 systems) where the lock operation was not suitable or available. For this reason, these calls are now deprecated in favor of the intrinsic functions.
Low-IRQL Synchronization
Executive software outside the kernel also needs to synchronize access to global data structures in a multiprocessor environment. For example, the memory manager has only one page frame database, which it accesses as a global data structure, and device drivers need to ensure that they can gain exclusive access to their devices. By calling kernel functions, the executive can create a spinlock, acquire it, and release it.
Spinlocks only partially fill the executive’s needs for synchronization mechanisms, however. Because waiting for a spinlock literally stalls a processor, spinlocks can be used only under the following strictly limited circumstances:
§ The protected resource must be accessed quickly and without complicated interactions with other code.
§ The critical section code can’t be paged out of memory, can’t make references to pageable data, can’t call external procedures (including system services), and can’t generate interrupts or exceptions.
These restrictions are confining and can’t be met under all circumstances. Furthermore, the executive needs to perform other types of synchronization in addition to mutual exclusion, and it must also provide synchronization mechanisms to user mode.
There are several additional synchronization mechanisms for use when spinlocks are not suitable:
§ Kernel dispatcher objects
§ Fast mutexes and guarded mutexes
§ Pushlocks
§ Executive resources
Additionally, user-mode code, which also executes at low IRQL, must be able to have its own locking primitives. Windows supports various user-mode-specific primitives:
§ Condition variables (CondVars)
§ Slim Reader-Writer Locks (SRW Locks)
§ Run-once initialization (InitOnce)
§ Critical sections
We’ll take a look at the user-mode primitives and their underlying kernel-mode support later; for now, we’ll focus on kernel-mode objects. Table 3-18 serves as a reference that compares and contrasts the capabilities of these mechanisms and their interaction with kernel-mode APC delivery.
Table 3-18. Kernel Synchronization Mechanisms
|
Exposed for Use by Device Drivers |
Disables Normal Kernel-Mode APCs |
Disables Special Kernel-Mode APCs |
Supports Recursive Acquisition |
Supports Shared and Exclusive Acquisition |
|
|
Kernel dispatcher mutexes |
Yes |
Yes |
No |
Yes |
No |
|
Kernel dispatcher semaphores or events |
Yes |
No |
No |
No |
No |
|
Fast mutexes |
Yes |
Yes |
Yes |
No |
No |
|
Guarded mutexes |
Yes |
Yes |
Yes |
No |
No |
|
Pushlocks |
No |
No |
No |
No |
Yes |
|
Executive resources |
Yes |
No |
No |
Yes |
Yes |
Kernel Dispatcher Objects
The kernel furnishes additional synchronization mechanisms to the executive in the form of kernel objects, known collectively as dispatcher objects. The Windows API-visible synchronization objects acquire their synchronization capabilities from these kernel dispatcher objects. Each Windows API-visible object that supports synchronization encapsulates at least one kernel dispatcher object. The executive’s synchronization semantics are visible to Windows programmers through the WaitForSingleObject and WaitForMultipleObjects functions, which the Windows subsystem implements by calling analogous system services that the object manager supplies. A thread in a Windows application can synchronize with a variety of objects, including a Windows process, thread, event, semaphore, mutex, waitable timer, I/O completion port, ALPC port, registry key, or file object. In fact, almost all objects exposed by the kernel can be waited on. Some of these are proper dispatcher objects, while others are larger objects that have a dispatcher object within them (such as ports, keys, or files). Table 3-19 shows the proper dispatcher objects, so any other object that the Windows API allows waiting on probably internally contains one of those primitives.
One other type of executive synchronization object worth noting is called an executive resource. Executive resources provide exclusive access (like a mutex) as well as shared read access (multiple readers sharing read-only access to a structure). However, they’re available only to kernel-mode code and thus are not accessible from the Windows API. The remaining subsections describe the implementation details of waiting for dispatcher objects.
Waiting for Dispatcher Objects
A thread can synchronize with a dispatcher object by waiting for the object’s handle. Doing so causes the kernel to put the thread in a wait state.
At any given moment, a synchronization object is in one of two states: signaled state or nonsignaled state. A thread can’t resume its execution until its wait is satisfied, a condition that occurs when the dispatcher object whose handle the thread is waiting for also undergoes a state change, from the nonsignaled state to the signaled state (when another thread sets an event object, for example). To synchronize with an object, a thread calls one of the wait system services that the object manager supplies, passing a handle to the object it wants to synchronize with. The thread can wait for one or several objects and can also specify that its wait should be canceled if it hasn’t ended within a certain amount of time. Whenever the kernel sets an object to the signaled state, one of the kernel’s signal routines checks to see whether any threads are waiting for the object and not also waiting for other objects to become signaled. If there are, the kernel releases one or more of the threads from their waiting state so that they can continue executing.
The following example of setting an event illustrates how synchronization interacts with thread dispatching:
§ A user-mode thread waits for an event object’s handle.
§ The kernel changes the thread’s scheduling state to waiting and then adds the thread to a list of threads waiting for the event.
§ Another thread sets the event.
§ The kernel marches down the list of threads waiting for the event. If a thread’s conditions for waiting are satisfied (see the following note), the kernel takes the thread out of the waiting state. If it is a variable-priority thread, the kernel might also boost its execution priority. (For details on thread scheduling, see Chapter 5.)
NOTE
Some threads might be waiting for more than one object, so they continue waiting, unless they specified a WaitAny wait, which will wake them up as soon as one object (instead of all) is signaled.
What Signals an Object?
The signaled state is defined differently for different objects. A thread object is in the nonsignaled state during its lifetime and is set to the signaled state by the kernel when the thread terminates. Similarly, the kernel sets a process object to the signaled state when the process’ last thread terminates. In contrast, the timer object, like an alarm, is set to “go off” at a certain time. When its time expires, the kernel sets the timer object to the signaled state.
When choosing a synchronization mechanism, a program must take into account the rules governing the behavior of different synchronization objects. Whether a thread’s wait ends when an object is set to the signaled state varies with the type of object the thread is waiting for, asTable 3-19 illustrates.
Table 3-19. Definitions of the Signaled State
|
Object Type |
Set to Signaled State When |
Effect on Waiting Threads |
|
Process |
Last thread terminates |
All are released. |
|
Thread |
Thread terminates |
All are released. |
|
Event (notification type) |
Thread sets the event |
All are released. |
|
Event (synchronization type) |
Thread sets the event |
One thread is released and might receive a boost; the event object is reset. |
|
Gate (locking type) |
Thread signals the gate |
First waiting thread is released and receives a boost. |
|
Gate (signaling type) |
Thread signals the type |
First waiting thread is released. |
|
Keyed event |
Thread sets event with a key |
Thread that’s waiting for the key and which is of the same process as the signaler is released. |
|
Semaphore |
Semaphore count drops by 1 |
One thread is released. |
|
Timer (notification type) |
Set time arrives, or time interval expires |
All are released. |
|
Timer (synchronization type) |
Set time arrives, or time interval expires |
One thread is released. |
|
Mutex |
Thread releases the mutex |
One thread is released and takes ownership of the mutex. |
|
Queue |
Item is placed on queue |
One thread is released. |
When an object is set to the signaled state, waiting threads are generally released from their wait states immediately. Some of the kernel dispatcher objects and the system events that induce their state changes are shown in Figure 3-26.
For example, a notification event object (called a manual reset event in the Windows API) is used to announce the occurrence of some event. When the event object is set to the signaled state, all threads waiting for the event are released. The exception is any thread that is waiting for more than one object at a time; such a thread might be required to continue waiting until additional objects reach the signaled state.
In contrast to an event object, a mutex object has ownership associated with it (unless it was acquired during a DPC). It is used to gain mutually exclusive access to a resource, and only one thread at a time can hold the mutex. When the mutex object becomes free, the kernel sets it to the signaled state and then selects one waiting thread to execute, while also inheriting any priority boost that had been applied. (See Chapter 5 for more information on priority boosting.) The thread selected by the kernel acquires the mutex object, and all other threads continue waiting.
A mutex object can also be abandoned: this occurs when the thread currently owning it becomes terminated. When a thread terminate, the kernel enumerates all mutexes owned by the thread and sets them to the abandoned state, which, in terms of signaling logic, is treated as a signaled state in that ownership of the mutex is transferred to a waiting thread.
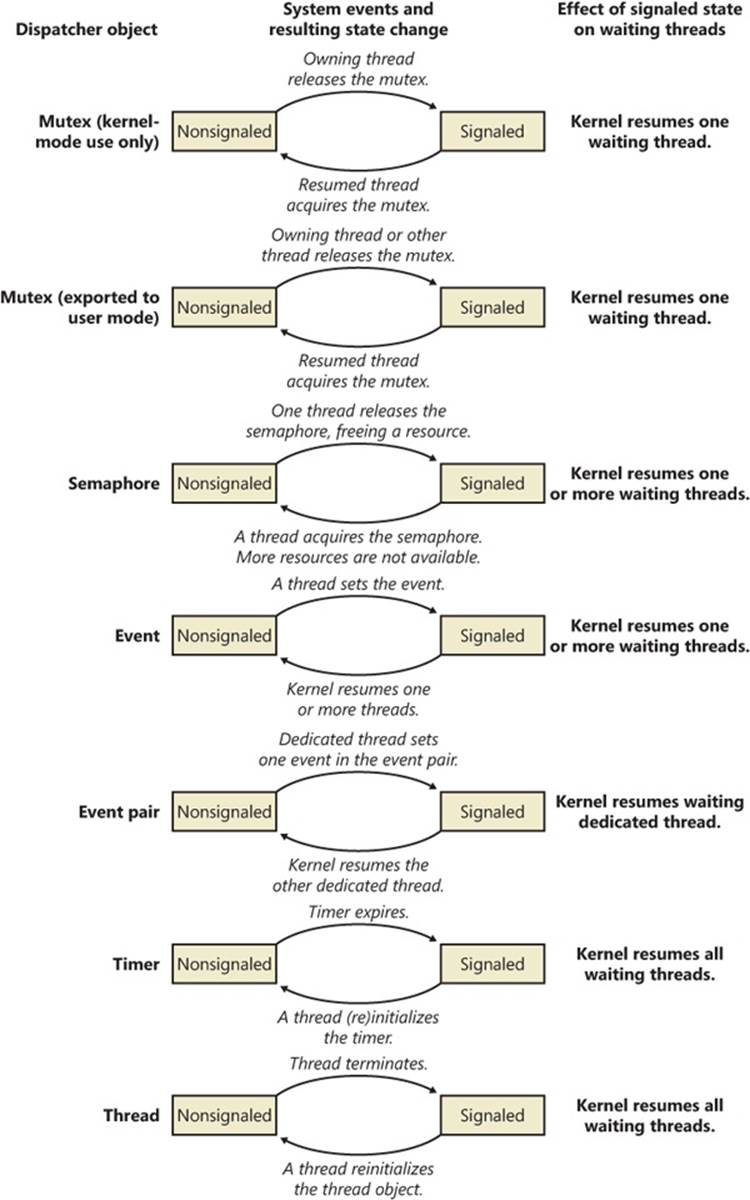
Figure 3-26. Selected kernel dispatcher objects
This brief discussion wasn’t meant to enumerate all the reasons and applications for using the various executive objects but rather to list their basic functionality and synchronization behavior. For information on how to put these objects to use in Windows programs, see the Windows reference documentation on synchronization objects or Jeffrey Richter and Christophe Nasarre’s book Windows via C/C++.
Data Structures
Three data structures are key to tracking who is waiting, how they are waiting, what they are waiting for, and which state the entire wait operation is at. These three structures are the dispatcher header, the wait block, and the wait status register. The former two structures are publicly defined in the WDK include file Wdm.h, while the latter is not documented.
The dispatcher header is a packed structure because it needs to hold lots of information in a fixed-size structure. (See the upcoming EXPERIMENT: Looking at Wait Queues section to see the definition of the dispatcher header data structure.) One of the main tricks is to define mutually exclusive flags at the same memory location (offset) in the structure. By using the Type field, the kernel knows which of these fields actually applies. For example, a mutex can be abandoned, but a timer can be absolute or relative. Similarly, a timer can be inserted into the timer list, but the Debug Active field makes sense only for processes. On the other hand, the dispatcher header does contain information generic for any dispatcher object: the object type, signaled state, and a list of the threads waiting for that object.
The wait block represents a thread waiting for an object. Each thread that is in a wait state has a list of the wait blocks that represent the objects the thread is waiting for. Each dispatcher object has a list of the wait blocks that represent which threads are waiting for the object. This list is kept so that when a dispatcher object is signaled, the kernel can quickly determine who is waiting for that object. Finally, because the balance-set-manager thread running on each CPU (see Chapter 5 for more information about the balance set manager) needs to analyze the time that each thread has been waiting for (in order to decide whether or not to page out the kernel stack), each PRCB has a list of waiting threads.
The wait block has a pointer to the object being waited for, a pointer to the thread waiting for the object, and a pointer to the next wait block (if the thread is waiting for more than one object). It also records the type of wait (any or all) as well as the position of that entry in the array of handles passed by the thread on the WaitForMultipleObjects call (position 0 if the thread was waiting for only one object). The wait type is very important during wait satisfaction, because it determines whether or not all the wait blocks belonging to the thread waiting on the signaled object should be processed: for a wait any, the dispatcher does not care what the state of the other objects is because at least one (the current one) of the objects is now signaled. On the other hand, for a wait all, the dispatcher can wake the thread only if all the other objects are also in a signaled state, which requires traversing the wait blocks and associated objects.
The wait block also contains a volatile wait block state, which defines the current state of this wait block in the transactional wait operation it is currently being engaged in. The different states, their meaning, and their effects in the wait logic code, are explained in Table 3-20.
Table 3-20. Wait Block States
|
State |
Meaning |
Effect |
|
WaitBlockActive (2) |
This wait block is actively linked to an object as part of a thread that is in a wait state. |
During wait satisfaction, this wait block will be unlinked from the wait block list. |
|
WaitBlockInactive (3) |
The thread wait associated with this wait block has been satisfied (or the timeout has already expired while setting it up). |
During wait satisfaction, this wait block will not be unlinked from the wait block list because the wait satisfaction must have aleady unlinked during its active state. |
|
WaitBlockBypassStart (0) |
A signal is being delivered to the thread while the wait has not yet been committed. |
During wait satisfaction (which would be immediate, before the thread enters the true wait state), the waiting thread must synchronize with the signaler because there is a risk that the wait object might be on the stack—marking the wait block as inactive would cause the waiter to unwind the stack while the signaler might still be accessing it. |
|
WaitBlockBypassComplete (1) |
The thread wait associated with this wait block has now been properly synchronized (the wait satisfaction has completed), and the bypass scenario is now completed. |
The wait block is now essentially treated the same as an inactive wait block (ignored). |
Because the overall state of the thread (or any of the objects it is being required to start waiting on) can change while wait operations are still being set up (because there is nothing blocking another thread executing on a different logical processor from attempting to signal one of the objects, or possibly alerting the thread, or even sending it an APC), the kernel dispatcher needs to keep track of two additional pieces of data for each waiting thread: the current fine-grained wait state of the thread, as well as any pending state changes that could modify the result of the attempted wait operation.
When a thread is instructed to wait for a given object (such as due to a WaitForSingleObject call), it first attempts to enter the in-progress wait state (WaitInProgress) by beginning the wait. This operation succeeds if there are no pending alerts to the thread at the moment (based on the alertability of the wait and the current processor mode of the wait, which determine whether or not the alert can preempt the wait). If there is an alert, the wait is not even entered at all, and the caller receives the appropriate status code; otherwise, the thread now enters theWaitInProgress state, at which point the main thread state is set to Waiting, and the wait reason and wait time are recorded, with any timeout specified also being registered.
Once the wait is in progress, the thread can initialize the wait blocks as needed (and mark them as WaitBlockActive in the process) and then proceed to lock all the objects that are part of this wait. Because each object has its own lock, it is important that the kernel be able to maintain a consistent locking ordering scheme when multiple processors might be analyzing a wait chain consisting of many objects (caused by a WaitForMultipleObjects call). The kernel uses a technique known as address ordering to achieve this: because each object has a distinct and static kernel-mode address, the objects can be ordered in monotonically increasing address order, guaranteeing that locks are always acquired and released in the same order by all callers. This means that the caller-supplied array of objects will be duplicated and sorted accordingly.
The next step is to check for immediate satisfaction of the wait, such as when a thread is being told to wait on a mutex that has already been released or an event that is already signaled. In such cases, the wait is immediately satisfied, which involves unlinking the associated wait blocks (however, in this case, no wait blocks have yet been inserted) and performing a wait exit (processing any pending scheduler operations marked in the wait status register). If this shortcut fails, the kernel next attempts to check whether the timeout specified for the wait (if any) has actually already expired. In this case, the wait is not “satisfied” but merely “timed out,” which results in slightly faster processing of the exit code, albeit with the same result.
If none of these shortcuts were effective, the wait block is inserted into the thread’s wait list, and the thread now attempts to commit its wait. (Meanwhile, the object lock or locks have been released, allowing other processors to modify the state of any of the objects that the thread is now supposed to attempt waiting on.) Assuming a noncontended scenario, where other processors are not interested in this thread or its wait objects, the wait switches into the committed state as long as there are no pending changes marked by the wait status register. The commit operation links the waiting thread in the PRCB list, activates an extra wait queue thread if needed, and inserts the timer associated with the wait timeout, if any. Because potentially quite a lot of cycles have elapsed by this point, it is again possible that the timeout has already elapsed. In this scenario, inserting the timer will cause immediate signaling of the thread, and thus a wait satisfaction on the timer, and the overall timeout of the wait. Otherwise, in the much more common scenario, the CPU now context switches away to the next thread that is ready for execution. (See Chapter 5 for more information on scheduling.)
In highly contended code paths on multiprocessor machines, it is possible and likely that the thread attempting to commit its wait has experienced a change while its wait was still in progress. One possible scenario is that one of the objects it was waiting on has just been signaled. As touched upon earlier, this causes the associated wait block to enter the WaitBlockBypassStart state, and the thread’s wait status register now shows the WaitAborted wait state. Another possible scenario is for an alert or APC to have been issued to the waiting thread, which does not set the WaitAborted state but enables one of the corresponding bits in the wait status register. Because APCs can break waits (depending on the type of APC, wait mode, and alertability), the APC is delivered and the wait is aborted. Other operations that will modify the wait status register without generating a full abort cycle include modifications to the thread’s priority or affinity, which will be processed when exiting the wait due to failure to commit, as with the previous cases mentioned.
Figure 3-27 shows the relationship of dispatcher objects to wait blocks to threads to PRCB. In this example, CPU 0 has two waiting (committed) threads: thread 1 is waiting for object B, and thread 2 is waiting for objects A and B. If object A is signaled, the kernel sees that because thread 2 is also waiting for another object, thread 2 can’t be readied for execution. On the other hand, if object B is signaled, the kernel can ready thread 1 for execution right away because it isn’t waiting for any other objects. (Alternatively, if thread 1 was also waiting for other objects but its wait type was a WaitAny, the kernel could still wake it up.)
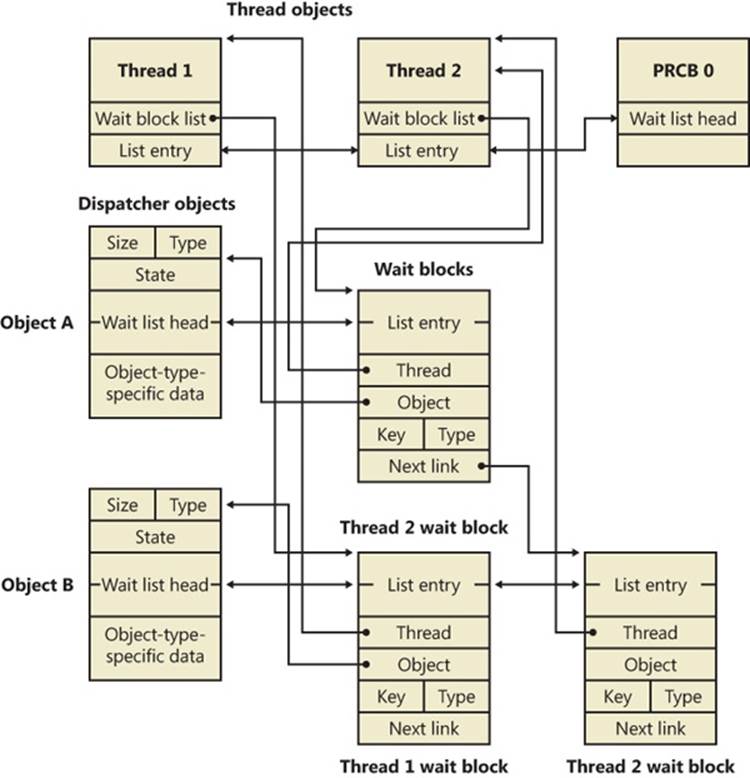
Figure 3-27. Wait data structures
EXPERIMENT: LOOKING AT WAIT QUEUES
You can see the list of objects a thread is waiting for with the kernel debugger’s !thread command. For example, the following excerpt from the output of a !process command shows that the thread is waiting for an event object:
kd> !process
§
THREAD fffffa8005292060 Cid 062c062c.0660 Teb: 000007fffffde000 Win32Thread:
fffff900c01c68f0 WAIT: (WrUserRequest) UserMode Non-Alertable
fffffa80047b8240 SynchronizationEvent
You can use the dt command to interpret the dispatcher header of the object like this:
lkd> dt nt!_DISPATCHER_HEADER fffffa80047b8240
+0x000 Type : 0x1 ''
+0x001 TimerControlFlags : 0 ''
+0x001 Absolute : 0y0
+0x001Coalescable : 0y0
+0x001 KeepShifting : 0y0
+0x001 EncodedTolerableDelay : 0y00000 (0)
+0x001 Abandoned : 0 ''
+0x001 Signalling : 0 ''
+0x002 ThreadControlFlags : 0x6 ''
+0x002 CpuThrottled : 0y0
+0x002 CycleProfiling : 0y1
+0x002 CounterProfiling : 0y1
+0x002 Reserved : 0y00000 (0)
+0x002 Hand : 0x6 ''
+0x002 Size : 0x6
+0x003 TimerMiscFlags : 0 ''
+0x003 Index : 0y000000 (0)
+0x003 Inserted : 0y0
+0x003 Expired : 0y0
+0x003 DebugActive : 0 ''
+0x003 ActiveDR7 : 0y0
+0x003 Instrumented : 0y0
+0x003 Reserved2 : 0y0000
+0x003 UmsScheduled : 0y0
+0x003 UmsPrimary : 0y0
+0x003 DpcActive : 0 ''
+0x000 Lock : 393217
+0x004 SignalState : 0
+0x008 WaitListHead : _LIST_ENTRY [ 0xfffffa80'047b8248 - 0xfffffa80'047b8248 ]
You should ignore any values that do not correspond to the given object type, because they might be either incorrectly decoded by the debugger (because the wrong type or field is being used) or simply contain stale or invalid data from a previous allocation value. There is no defined correlation you can see between which fields apply to which object, other than by looking at the Windows kernel source code or the WDK header files’ comments. For convenience, Table 3-21 lists the dispatcher header flags and the objects to which they apply.
TABLE 3-21. USAGE AND MEANING OF THE DISPATCHER HEADER FLAGS
|
Flag |
Applies To |
Meaning |
|
Absolute |
Timers |
The expiration time is absolute, not relative. |
|
Coalescable |
Periodic Timers |
Indicates whether coalescing should be used for this timer. |
|
KeepShifting |
Coalescable Timers |
Indicates whether or not the kernel dispatcher should continue attempting to shift the timer’s expiration time. When alignment is reached with the machine’s periodic interval, this eventually becomes FALSE. |
|
EncodedTolerableDelay |
Coalescable Timers |
The maximum amount of tolerance (shifted as a power of two) that the timer can support when running outside of its expected periodicity. |
|
Abandoned |
Mutexes |
The thread holding the mutex was terminated. |
|
Signaling |
Gates |
A priority boost should be applied to the woken thread when the gate is signaled. |
|
CpuThrottled |
Threads |
CPU throttling has been enabled for this thread, such as when running under DFSS mode (Distributed Fair-Share Scheduler). |
|
CycleProfiling |
Threads |
CPU cycle profiling has been enabled for this thread. |
|
CounterProfiling |
Threads |
Hardware CPU performance counter monitoring/profiling has been enabled for this thread. |
|
Size |
All objects |
Size of the object divided by 4, to fit in a single byte. |
|
Hand |
Timers |
Index into the timer handle table. |
|
Index |
Timers |
Index into the timer expiration table. |
|
Inserted |
Timers |
Set if the timer was inserted into the timer handle table. |
|
Expired |
Timers |
Set if the timer has already expired. |
|
DebugActive |
Processes |
Specifies whether the process is being debugged. |
|
ActiveDR7 |
Thread |
Hardware breakpoints are being used, so DR7 is active and should be sanitized during context operations. |
|
Instrumented |
Thread |
Specifies whether the thread has a user-mode instrumentation callback (supported only on Windows for x64 processors). |
|
UmsScheduled |
Thread |
This thread is a UMS Worker (scheduled) thread. |
|
UmsPrimary |
Thread |
This thread is a UMS Scheduler (primary) thread. |
|
DpcActive |
Mutexes |
The mutex was acquired during a DPC. |
|
Lock |
All objects |
Used for locking an object during wait operations which need to modify its state or linkage; actually corresponds to bit 7 (0x80) of the Type field. |
Apart from these flags, the Type field contains the identifier for the object. This identifier corresponds to a number in the KOBJECTS enumeration, which you can dump with the debugger:
lkd> dt nt!_KOBJECTS
EventNotificationObject = 0
EventSynchronizationObject = 1
MutantObject = 2
ProcessObject = 3
QueueObject = 4
SemaphoreObject = 5
ThreadObject = 6
GateObject = 7
TimerNotificationObject = 8
TimerSynchronizationObject = 9
Spare2Object = 10
Spare3Object = 11
Spare4Object = 12
Spare5Object = 13
Spare6Object = 14
Spare7Object = 15
Spare8Object = 16
Spare9Object = 17
ApcObject = 18
DpcObject = 19
DeviceQueueObject = 20
EventPairObject = 21
InterruptObject = 22
ProfileObject = 23
ThreadedDpcObject = 24
MaximumKernelObject = 25
When the wait list head pointers are identical, there are either zero threads or one thread waiting on this object. Dumping a wait block for an object that is part of a multiple wait from a thread, or that multiple threads are waiting on, can yield the following:
dt nt!_KWAIT_BLOCK 0xfffffa80'053cf628
+0x000 WaitListEntry : _LIST_ENTRY [ 0xfffffa80'02efe568 - 0xfffffa80'02803468 ]
+0x010 Thread : 0xfffffa80'053cf520 _KTHREAD
+0x018 Object : 0xfffffa80'02803460
+0x020 NextWaitBlock : 0xfffffa80'053cf628 _KWAIT_BLOCK
+0x028 WaitKey : 0
+0x02a WaitType : 0x1 ''
+0x02b BlockState : 0x2 ''
+0x02c SpareLong : 8
If the wait list has more than one entry, you can execute the same command on the second pointer value in the WaitListEntry field of each wait block (by executing !thread on the thread pointer in the wait block) to traverse the list and see what other threads are waiting for the object. This would indicate more than one thread waiting on this object. On the other hand, when dealing with an object that’s part of a collection of objects being waited on by a single thread, you have to parse the NextWaitBlock field instead.
Keyed Events
A synchronization object called a keyed event bears special mention because of the role it plays in user-mode-exclusive synchronization primitives. Keyed events were originally implemented to help processes deal with low-memory situations when using critical sections, which are user-mode synchronization objects that we’ll see more about shortly. A keyed event, which is not documented, allows a thread to specify a “key” for which it waits, where the thread wakes when another thread of the same process signals the event with the same key.
If there is contention, EnterCriticalSection dynamically allocates an event object, and the thread wanting to acquire the critical section waits for the thread that owns the critical section to signal it in LeaveCriticalSection. Unfortunately, this introduces a new problem. Without keyed events, the system could be critically out of memory and critical-section acquisition could fail because the system was unable to allocate the event object required. The low-memory condition itself might have been caused by the application trying to acquire the critical section, so the system would deadlock in this situation. Low memory isn’t the only scenario that could cause this to fail: a less likely scenario is handle exhaustion. If the process reaches its 16-million-handle limit, the new handle for the event object could fail.
The failure caused by low-memory conditions typically are an exception from the code responsible for acquiring the critical section. Unfortunately, the result is also a damaged critical section, which makes the situation hard to debug and makes the object useless for a reacquisition attempt. Attempting a LeaveCriticalSection results in another event-object allocation attempt, further generating exceptions and corrupting the structure.
Allocating a global standard event object would not fix the issue because standard event primitives can be used only for a single object. Each critical section in the process still requires its own event object, so the same problem would resurface. The implementation of keyed events allows multiple critical sections (waiters) to use the same global (per-process) keyed event handle. This allows the critical section functions to operate properly even when memory is temporarily low.
When a thread signals a keyed event or performs a wait on it, it uses a unique identifier called a key, which identifies the instance of the keyed event (an association of the keyed event to a single critical section). When the owner thread releases the keyed event by signaling it, only a single thread waiting on the key is woken up (the same behavior as synchronization events, in contrast to notification events). Additionally, only the waiters in the current process are awakened, so the key is even isolated across processes, meaning that there is actually only a single keyed event object for the entire system. When a critical section uses the keyed event, EnterCriticalSection sets the key as the address of the critical section and performs a wait.
When EnterCriticalSection calls NtWaitForKeyedEvent to perform a wait on the keyed event, it can now give a NULL handle as parameter for the keyed event, telling the kernel that it was unable to create a keyed event. The kernel recognizes this behavior and uses a global keyed event named ExpCritSecOutOfMemoryEvent. The primary benefit is that processes don’t need to waste a handle for a named keyed event anymore because the kernel keeps track of the object and its references.
However, keyed events are more than just fallback objects for low-memory conditions. When multiple waiters are waiting on the same key and need to be woken up, the key is actually signaled multiple times, which requires the object to keep a list of all the waiters so that it can perform a “wake” operation on each of them. (Recall that the result of signaling a keyed event is the same as that of signaling a synchronization event.) However, a thread can signal a keyed event without any threads on the waiter list. In this scenario, the signaling thread instead waits on the event itself. Without this fallback, a signaling thread could signal the keyed event during the time that the user-mode code saw the keyed event as unsignaled and attempt a wait. The wait might have come after the signaling thread signaled the keyed event, resulting in a missed pulse, so the waiting thread would deadlock. By forcing the signaling thread to wait in this scenario, it actually signals the keyed event only when someone is looking (waiting).
NOTE
When the keyed-event wait code itself needs to perform a wait, it uses a built-in semaphore located in the kernel-mode thread object (ETHREAD) called KeyedWaitSemaphore. (This semaphore actually shares its location with the ALPC wait semaphore.) See Chapter 5 for more information on thread objects.
Keyed events, however, do not replace standard event objects in the critical section implementation. The initial reason, during the Windows XP timeframe, was that keyed events do not offer scalable performance in heavy-usage scenarios. Recall that all the algorithms described were meant to be used only in critical, low-memory scenarios, when performance and scalability aren’t all that important. To replace the standard event object would place strain on keyed events that they weren’t implemented to handle. The primary performance bottleneck was that keyed events maintained the list of waiters described in a doubly linked list. This kind of list has poor traversal speed, meaning the time required to loop through the list. In this case, this time depended on the number of waiter threads. Because the object is global, dozens of threads could be on the list, requiring long traversal times every single time a key was set or waited on.
NOTE
The head of the list is kept in the keyed event object, while the threads are actually linked through the KeyedWaitChain field (which is actually shared with the thread’s exit time, stored as a LARGE_INTEGER, the same size as a doubly linked list) in the kernel-mode thread object (ETHREAD). See Chapter 5 for more information on this object.
Windows improves keyed-event performance by using a hash table instead of a linked list to hold the waiter threads. This optimization allows Windows to include three new lightweight user-mode synchronization primitives (to be discussed shortly) that all depend on the keyed event. Critical sections, however, still continue to use event objects, primarily for application compatibility and debugging, because the event object and internals are well known and documented, while keyed events are opaque and not exposed to the Win32 API.
Fast Mutexes and Guarded Mutexes
Fast mutexes, which are also known as executive mutexes, usually offer better performance than mutex objects because, although they are built on dispatcher event objects, they perform a wait through the dispatcher only if the fast mutex is contended—unlike a standard mutex, which always attempts the acquisition through the dispatcher. This gives the fast mutex especially good performance in a multiprocessor environment. Fast mutexes are used widely in device drivers.
However, fast mutexes are suitable only when normal kernel-mode APC (described earlier in this chapter) delivery can be disabled. The executive defines two functions for acquiring them: ExAcquireFastMutex and ExAcquireFastMutexUnsafe. The former function blocks all APC delivery by raising the IRQL of the processor to APC level. The latter expects to be called with normal kernel-mode APC delivery disabled, which can be done by raising the IRQL to APC level. ExTryToAcquireFastMutex performs similarly to the first, but it does not actually wait if the fast mutex is already held, returning FALSE instead. Another limitation of fast mutexes is that they can’t be acquired recursively, like mutex objects can.
Guarded mutexes are essentially the same as fast mutexes (although they use a different synchronization object, the KGATE, internally). They are acquired with the KeAcquireGuardedMutex and KeAcquireGuardedMutexUnsafe functions, but instead of disabling APCs by raising the IRQL to APC level, they disable all kernel-mode APC delivery by calling KeEnterGuardedRegion. Similarly to fast mutexes, a KeTryToAcquireGuardedMutex method also exists. Recall that a guarded region, unlike a critical region, disables both special and normal kernel-mode APCs, which allows the guarded mutex to avoid raising the IRQL.
Three differences make guarded mutexes faster than fast mutexes:
§ By avoiding raising the IRQL, the kernel can avoid talking to the local APIC of every processor on the bus, which is a significant operation on large SMP systems. On uniprocessor systems, this isn’t a problem because of lazy IRQL evaluation, but lowering the IRQL might still require accessing the PIC.
§ The gate primitive is an optimized version of the event. By not having both synchronization and notification versions and by being the exclusive object that a thread can wait on, the code for acquiring and releasing a gate is heavily optimized. Gates even have their own dispatcher lock instead of acquiring the entire dispatcher database.
§ In the noncontended case, the acquisition and release of a guarded mutex works on a single bit, with an atomic bit test-and-reset operation instead of the more complex integer operations fast mutexes perform.
NOTE
The code for a fast mutex is also optimized to account for almost all these optimizations—it uses the same atomic lock operation, and the event object is actually a gate object (although by dumping the type in the kernel debugger, you would still see an event object structure; this is actually a compatibility lie). However, fast mutexes still raise the IRQL instead of using guarded regions.
Because the flag responsible for special kernel APC delivery disabling (and the guarded-region functionality) was not added until Windows Server 2003, many drivers do not take advantage of guarded mutexes. Doing so would raise compatibility issues with earlier versions of Windows, which require a recompiled driver making use only of fast mutexes. Internally, however, the Windows kernel has replaced almost all uses of fast mutexes with guarded mutexes because the two have identical semantics and can be easily interchanged.
Another problem related to the guarded mutex was the kernel function KeAreApcsDisabled. Prior to Windows Server 2003, this function indicated whether normal APCs were disabled by checking whether the code was running inside a critical section. In Windows Server 2003, this function was changed to indicate whether the code was in a critical, or guarded, region, changing the functionality to also return TRUE if special kernel APCs are also disabled.
Because there are certain operations that drivers should not perform when special kernel APCs are disabled, it makes sense to call KeGetCurrentIrql to check whether the IRQL is APC level or not, which is the only way special kernel APCs could have been disabled. However, because the memory manager makes use of guarded mutexes instead, this check fails because guarded mutexes do not raise IRQL. Drivers should instead call KeAreAllApcsDisabled for this purpose. This function checks whether special kernel APCs are disabled and/or whether the IRQL is APC level—the sure-fire way to detect both guarded mutexes and fast mutexes.
Executive Resources
Executive resources are a synchronization mechanism that supports shared and exclusive access; like fast mutexes, they require that normal kernel-mode APC delivery be disabled before they are acquired. They are also built on dispatcher objects that are used only when there is contention. Executive resources are used throughout the system, especially in file-system drivers, because such drivers tend to have long-lasting wait periods in which I/O should still be allowed to some extent (such as reads).
Threads waiting to acquire an executive resource for shared access wait for a semaphore associated with the resource, and threads waiting to acquire an executive resource for exclusive access wait for an event. A semaphore with unlimited count is used for shared waiters because they can all be woken and granted access to the resource when an exclusive holder releases the resource simply by signaling the semaphore. When a thread waits for exclusive access of a resource that is currently owned, it waits on a synchronization event object because only one of the waiters will wake when the event is signaled. In the earlier section on synchronization events, it was mentioned that some event unwait operations can actually cause a priority boost: this scenario occurs when executive resources are used, which is one reason why they also track ownership like mutexes do. (See Chapter 5 for more information on the executive resource priority boost.)
Because of the flexibility that shared and exclusive access offer, there are a number of functions for acquiring resources: ExAcquireResourceSharedLite, ExAcquireResourceExclusiveLite, ExAcquireSharedStarveExclusive, ExAcquireShareWaitForExclusive. These functions are documented in the WDK.
EXPERIMENT: LISTING ACQUIRED EXECUTIVE RESOURCES
The kernel debugger !locks command searches paged pool for executive resource objects and dumps their state. By default, the command lists only executive resources that are currently owned, but the –d option lists all executive resources. Here is partial output of the command:
lkd> !locks
**** DUMP OF ALL RESOURCE OBJECTS ****
KD: Scanning for held locks.
Resource @ 0x89929320 Exclusively owned
Contention Count = 3911396
Threads: 8952d030-01<*>
KD: Scanning for held locks.......................................
Resource @ 0x89da1a68 Shared 1 owning threads
Threads: 8a4cb533-01<*> *** Actual Thread 8a4cb530
Note that the contention count, which is extracted from the resource structure, records the number of times threads have tried to acquire the resource and had to wait because it was already owned.
You can examine the details of a specific resource object, including the thread that owns the resource and any threads that are waiting for the resource, by specifying the –v switch and the address of the resource:
lkd> !locks -v 0x89929320
Resource @ 0x89929320 Exclusively owned
Contention Count = 3913573
Threads: 8952d030-01<*>
THREAD 8952d030 Cid 0acc.050c Teb: 7ffdf000 Win32Thread: fe82c4c0 RUNNING on processor 0
Not impersonating
DeviceMap 9aa0bdb8
Owning Process 89e1ead8 Image: windbg.exe
Wait Start TickCount 24620588 Ticks: 12 (0:00:00:00.187)
Context Switch Count 772193
UserTime 00:00:02.293
KernelTime 00:00:09.828
Win32 Start Address windbg (0x006e63b8)
Stack Init a7eba000 Current a7eb9c10 Base a7eba000 Limit a7eb7000 Call 0
Priority 10 BasePriority 8 PriorityDecrement 0 IoPriority 2 PagePriority 5
Unable to get context for thread running on processor 1, HRESULT 0x80004001
1 total locks, 1 locks currently held
Pushlocks
Pushlocks are another optimized synchronization mechanism built on gate objects; like guarded mutexes, they wait for a gate object only when there’s contention on the lock. They offer advantages over the guarded mutex in that they can be acquired in shared or exclusive mode. However, their main advantage is their size: a resource object is 56 bytes, but a pushlock is pointer-size. Unfortunately, they are not documented in the WDK and are therefore reserved for use by the operating system (although the APIs are exported, so internal drivers do use them).
There are two types of pushlocks: normal and cache-aware. Normal pushlocks require only the size of a pointer in storage (4 bytes on 32-bit systems, and 8 bytes on 64-bit systems). When a thread acquires a normal pushlock, the pushlock code marks the pushlock as owned if it is not currently owned. If the pushlock is owned exclusively or the thread wants to acquire the thread exclusively and the pushlock is owned on a shared basis, the thread allocates a wait block on the thread’s stack, initializes a gate object in the wait block, and adds the wait block to the wait list associated with the pushlock. When a thread releases a pushlock, the thread wakes a waiter, if any are present, by signaling the event in the waiter’s wait block.
Because a pushlock is only pointer-sized, it actually contains a variety of bits to describe its state. The meaning of those bits changes as the pushlock changes from being contended to noncontended. In its initial state, the pushlock contains the following structure:
§ One lock bit, set to 1 if the lock is acquired
§ One waiting bit, set to 1 if the lock is contended and someone is waiting on it
§ One waking bit, set to 1 if the lock is being granted to a thread and the waiter’s list needs to be optimized
§ One multiple shared bit, set to 1 if the pushlock is shared and currently acquired by more than one thread
§ 28 (on 32-bit Windows) or 60 (on 64-bit Windows) share count bits, containing the number of threads that have acquired the pushlock
As discussed previously, when a thread acquires a pushlock exclusively while the pushlock is already acquired by either multiple readers or a writer, the kernel allocates a pushlock wait block. The structure of the pushlock value itself changes. The share count bits now become the pointer to the wait block. Because this wait block is allocated on the stack and the header files contain a special alignment directive to force it to be 16-byte aligned, the bottom 4 bits of any pushlock wait-block structure will be all zeros. Therefore, those bits are ignored for the purposes of pointer dereferencing; instead, the 4 bits shown earlier are combined with the pointer value. Because this alignment removes the share count bits, the share count is now stored in the wait block instead.
A cache-aware pushlock adds layers to the normal (basic) pushlock by allocating a pushlock for each processor in the system and associating it with the cache-aware pushlock. When a thread wants to acquire a cache-aware pushlock for shared access, it simply acquires the pushlock allocated for its current processor in shared mode; to acquire a cache-aware pushlock exclusively, the thread acquires the pushlock for each processor in exclusive mode.
Other than a much smaller memory footprint, one of the large advantages that pushlocks have over executive resources is that in the noncontended case they do not require lengthy accounting and integer operations to perform acquisition or release. By being as small as a pointer, the kernel can use atomic CPU instructions to perform these tasks. (lock cmpxchg is used, which atomically compares and exchanges the old lock with a new lock.) If the atomic compare and exchange fails, the lock contains values the caller did not expect (callers usually expect the lock to be unused or acquired as shared), and a call is then made to the more complex contended version. To improve performance even further, the kernel exposes the pushlock functionality as inline functions, meaning that no function calls are ever generated during noncontended acquisition—the assembly code is directly inserted in each function. This increases code size slightly, but it avoids the slowness of a function call. Finally, pushlocks use several algorithmic tricks to avoid lock convoys (a situation that can occur when multiple threads of the same priority are all waiting on a lock and little actual work gets done), and they are also self-optimizing: the list of threads waiting on a pushlock will be periodically rearranged to provide fairer behavior when the pushlock is released.
Areas in which pushlocks are used include the object manager, where they protect global object-manager data structures and object security descriptors, and the memory manager, where their cache-aware counterpart is used to protect Address Windowing Extension (AWE) data structures.
DEADLOCK DETECTION WITH DRIVER VERIFIER
A deadlock is a synchronization issue resulting from two threads or processors holding resources that the other wants and neither yielding what it has. This situation might result in system or process hangs. Driver Verifier, described in Chapter 8 in Part 2 and Chapter 9 in Part 2, has an option to check for deadlocks involving spinlocks, fast mutexes, and mutexes. For information on when to enable Driver Verifier to help resolve system hangs, see Chapter 14 in Part 2.
Critical Sections
Critical sections are one of the main synchronization primitives that Windows provides to user-mode applications on top of the kernel-based synchronization primitives. Critical sections and the other user-mode primitives you’ll see later have one major advantage over their kernel counterparts, which is saving a round-trip to kernel mode in cases in which the lock is noncontended (which is typically 99 percent of the time or more). Contended cases still require calling the kernel, however, because it is the only piece of the system that is able to perform the complex waking and dispatching logic required to make these objects work.
Critical sections are able to remain in user mode by using a local bit to provide the main exclusive locking logic, much like a spinlock. If the bit is 0, the critical section can be acquired, and the owner sets the bit to 1. This operation doesn’t require calling the kernel but uses the interlocked CPU operations discussed earlier. Releasing the critical section behaves similarly, with bit state changing from 1 to 0 with an interlocked operation. On the other hand, as you can probably guess, when the bit is already 1 and another caller attempts to acquire the critical section, the kernel must be called to put the thread in a wait state.Finally, because critical sections are not kernel objects, they have certain limitations. The primary one is that you cannot obtain a kernel handle to a critical section; as such, no security, naming, or other object manager functionality can be applied to a critical section. Two processes cannot use the same critical section to coordinate their operations, nor can duplication or inheritance be used.
User-Mode Resources
User-mode resources also provide more fine-grained locking mechanisms than kernel primitives. A resource can be acquired for shared mode or for exclusive mode, allowing it to function as a multiple-reader (shared), single-writer (exclusive) lock for data structures such as databases. When a resource is acquired in shared mode and other threads attempt to acquire the same resource, no trip to the kernel is required because none of the threads will be waiting. Only when a thread attempts to acquire the resource for exclusive access, or the resource is already locked by an exclusive owner, will this be required.
To make use of the same dispatching and synchronization mechanism you saw in the kernel, resources actually make use of existing kernel primitives. A resource data structure (RTL_RESOURCE) contains handles to a kernel mutex as well as a kernel semaphore object. When the resource is acquired exclusively by more than one thread, the resource uses the mutex because it permits only one owner. When the resource is acquired in shared mode by more than one thread, the resource uses a semaphore because it allows multiple owner counts. This level of detail is typically hidden from the programmer, and these internal objects should never be used directly.
Resources were originally implemented to support the SAM (or Security Account Manager, which is discussed in Chapter 6) and not exposed through the Windows API for standard applications. Slim Reader-Writer Locks (SRW Locks), described next, were implemented in Windows Vista to expose a similar locking primitive through a documented API, although some system components still use the resource mechanism.
Condition Variables
Condition variables provide a Windows native implementation for synchronizing a set of threads that are waiting on a specific result to a conditional test. Although this operation was possible with other user-mode synchronization methods, there was no atomic mechanism to check the result of the conditional test and to begin waiting on a change in the result. This required that additional synchronization be used around such pieces of code.
A user-mode thread initializes a condition variable by calling InitializeConditionVariable to set up the initial state. When it wants to initiate a wait on the variable, it can call SleepConditionVariableCS, which uses a critical section (that the thread must have initialized) to wait for changes to the variable. The setting thread must use WakeConditionVariable (or WakeAllConditionVariable) after it has modified the variable. (There is no automatic detection mechanism.) This call releases the critical section of either one or all waiting threads, depending on which function was used.
Before condition variables, it was common to use either a notification event or a synchronization event (recall that these are referred to as auto-reset or manual-reset in the Windows API) to signal the change to a variable, such as the state of a worker queue. Waiting for a change required a critical section to be acquired and then released, followed by a wait on an event. After the wait, the critical section had to be re-acquired. During this series of acquisitions and releases, the thread might have switched contexts, causing problems if one of the threads calledPulseEvent (a similar problem to the one that keyed events solve by forcing a wait for the signaling thread if there is no waiter). With condition variables, acquisition of the critical section can be maintained by the application while SleepConditionVariableCS is called and can be released only after the actual work is done. This makes writing work-queue code (and similar implementations) much simpler and predictable.
Internally, condition variables can be thought of as a port of the existing pushlock algorithms present in kernel mode, with the additional complexity of acquiring and releasing critical sections in the SleepConditionVariableCS API. Condition variables are pointer-size (just like pushlocks), avoid using the dispatcher (which requires a ring transition to kernel mode in this scenario, making the advantage even more noticeable), automatically optimize the wait list during wait operations, and protect against lock convoys. Additionally, condition variables make full use of keyed events instead of the regular event object that developers would have used on their own, which makes even contended cases more optimized.
Slim Reader-Writer Locks
Although condition variables are a synchronization mechanism, they are not fully primitive locking objects. As you’ve seen, they still depend on the critical section lock, whose acquisition and release uses standard dispatcher event objects, so trips through kernel mode can still happen and callers still require the initialization of the large critical section object. If condition variables share a lot of similarities with pushlocks, Slim Reader-Writer Locks (SRW Locks) are nearly identical. They are also pointer-size, use atomic operations for acquisition and release, rearrange their waiter lists, protect against lock convoys, and can be acquired both in shared and exclusive mode. Some differences from pushlocks, however, include the fact that SRW Locks cannot be “upgraded” or converted from shared to exclusive or vice versa. Additionally, they cannot be recursively acquired. Finally, SRW Locks are exclusive to user-mode code, while pushlocks are exclusive to kernel-mode code, and the two cannot be shared or exposed from one layer to the other.
Not only can SRW Locks entirely replace critical sections in application code, but they also offer multiple-reader, single-writer functionality. SRW Locks must first be initialized with InitializeSRWLock, after which they can be acquired or released in either exclusive or shared mode with the appropriate APIs: AcquireSRWLockExclusive, ReleaseSRWLockExclusive, AcquireSRWLockShared, and ReleaseSRWLockShared.
NOTE
Unlike most other Windows APIs, the SRW locking functions do not return with a value—instead they generate exceptions if the lock could not be acquired. This makes it obvious that an acquisition has failed so that code that assumes success will terminate instead of potentially proceeding to corrupt user data.
The Windows SRW Locks do not prefer readers or writers, meaning that the performance for either case should be the same. This makes them great replacements for critical sections, which are writer-only or exclusive synchronization mechanisms, and they provide an optimized alternative to resources. If SRW Locks were optimized for readers, they would be poor exclusive-only locks, but this isn’t the case. As a result, the design of the condition variable mechanism introduced earlier also allows for the use of SRW Locks instead of critical sections, through the SleepConditionVariableSRW API. Finally, SRW Locks also use keyed events instead of standard event objects, so the combination of condition variables and SRW Locks results in scalable, pointer-size synchronization mechanisms with very few trips to kernel mode—except in contended cases, which are optimized to take less time and memory to wake and set because of the use of keyed events.
Run Once Initialization
The ability to guarantee the atomic execution of a piece of code responsible for performing some sort of initialization task—such as allocating memory, initializing certain variables, or even creating objects on demand—is a typical problem in multithreaded programming. In a piece of code that can be called simultaneously by multiple threads (a good example is the DllMain routine, which initializes a DLL), there are several ways of attempting to ensure the correct, atomic, and unique execution of initialization tasks.
In this scenario, Windows implements init once, or one-time initialization (also called run once initialization internally). This mechanism allows for both synchronous (meaning that the other threads must wait for initialization to complete) execution of a certain piece of code, as well as asynchronous (meaning that the other threads can attempt to do their own initialization and race) execution. We’ll look at the logic behind asynchronous execution after explaining the synchronous mechanism.
In the synchronous case, the developer writes the piece of code that would normally execute after double-checking the global variable in a dedicated function. Any information that this routine needs can be passed through the parameter variable that the init-once routine accepts. Any output information is returned through the context variable. (The status of the initialization itself is returned as a Boolean.) All the developer has to do to ensure proper execution is call InitOnceExecuteOnce with the parameter, context, and run-once function pointer after initializing an INIT_ONCE object with InitOnceInitialize API. The system will take care of the rest.
For applications that want to use the asynchronous model instead, the threads call InitOnceBeginInitialize and receive a BOOLEAN pending status and the context described earlier. If the pending status is FALSE, initialization has already taken place, and the thread uses the context value for the result. (It’s also possible for the function itself to return FALSE, meaning that initialization failed.) However, if the pending status comes back as TRUE, the thread should race to be the first to create the object. The code that follows performs whatever initialization tasks are required, such as creating objects or allocating memory. When this work is done, the thread calls InitOnceComplete with the result of the work as the context and receives a BOOLEAN status. If the status is TRUE, the thread won the race, and the object that it created or allocated is the one that will be the global object. The thread can now save this object or return it to a caller, depending on the usage.
In the more complex scenario when the status is FALSE, this means that the thread lost the race. The thread must undo all the work it did, such as deleting objects or freeing memory, and then call InitOnceBeginInitialize again. However, instead of requesting to start a race as it did initially, it uses the INIT_ONCE_CHECK_ONLY flag, knowing that it has lost, and requests the winner’s context instead (for example, the objects or memory that were created or allocated by the winner). This returns another status, which can be TRUE, meaning that the context is valid and should be used or returned to the caller, or FALSE, meaning that initialization failed and nobody has actually been able to perform the work (such as in the case of a low-memory condition, perhaps).
In both cases, the mechanism for run-once initialization is similar to the mechanism for condition variables and SRW Locks. The init once structure is pointer-size, and inline assembly versions of the SRW acquisition/release code are used for the noncontended case, while keyed events are used when contention has occurred (which happens when the mechanism is used in synchronous mode) and the other threads must wait for initialization. In the asynchronous case, the locks are used in shared mode, so multiple threads can perform initialization at the same time.
System Worker Threads
During system initialization, Windows creates several threads in the System process, called system worker threads, which exist solely to perform work on behalf of other threads. In many cases, threads executing at DPC/dispatch level need to execute functions that can be performed only at a lower IRQL. For example, a DPC routine, which executes in an arbitrary thread context (because DPC execution can usurp any thread in the system) at DPC/dispatch level IRQL, might need to access paged pool or wait for a dispatcher object used to synchronize execution with an application thread. Because a DPC routine can’t lower the IRQL, it must pass such processing to a thread that executes at an IRQL below DPC/dispatch level.
Some device drivers and executive components create their own threads dedicated to processing work at passive level; however, most use system worker threads instead, which avoids the unnecessary scheduling and memory overhead associated with having additional threads in the system. An executive component requests a system worker thread’s services by calling the executive functions ExQueueWorkItem or IoQueueWorkItem. Device drivers should use only the latter (because this associates the work item with a Device object, allowing for greater accountability and the handling of scenarios in which a driver unloads while its work item is active). These functions place a work item on a queue dispatcher object where the threads look for work. (Queue dispatcher objects are described in more detail in the section “I/O Completion Ports” in Chapter 8 in Part 2.)
The IoQueueWorkItemEx, IoSizeofWorkItem, IoInitializeWorkItem, and IoUninitializeWorkItem APIs act similarly, but they create an association with a driver’s Driver object or one of its Device objects.
Work items include a pointer to a routine and a parameter that the thread passes to the routine when it processes the work item. The device driver or executive component that requires passive-level execution implements the routine. For example, a DPC routine that must wait for a dispatcher object can initialize a work item that points to the routine in the driver that waits for the dispatcher object, and perhaps points to a pointer to the object. At some stage, a system worker thread will remove the work item from its queue and execute the driver’s routine. When the driver’s routine finishes, the system worker thread checks to see whether there are more work items to process. If there aren’t any more, the system worker thread blocks until a work item is placed on the queue. The DPC routine might or might not have finished executing when the system worker thread processes its work item.
There are three types of system worker threads:
§ Delayed worker threads execute at priority 12, process work items that aren’t considered time-critical, and can have their stack paged out to a paging file while they wait for work items. The object manager uses a delayed work item to perform deferred object deletion, which deletes kernel objects after they have been scheduled for freeing.
§ Critical worker threads execute at priority 13, process time-critical work items, and on Windows Server systems have their stacks present in physical memory at all times.
§ A single hypercritical worker thread executes at priority 15 and also keeps its stack in memory. The process manager uses the hypercritical work item to execute the thread “reaper” function that frees terminated threads.
The number of delayed and critical worker threads created by the executive’s ExpWorkerInitialization function, which is called early in the boot process, depends on the amount of memory present on the system and whether the system is a server. Table 3-22 shows the initial number of threads created on default configurations. You can specify that ExpInitializeWorker create up to 16 additional delayed and 16 additional critical worker threads with the AdditionalDelayedWorkerThreads and AdditionalCriticalWorkerThreads values under the registry key HKLM\SYSTEM\CurrentControlSet\Control\Session Manager\Executive.
Table 3-22. Initial Number of System Worker Threads
|
Work Queue Type |
Default Number of Threads |
|
Delayed |
7 |
|
Critical |
5 |
|
Hypercritical |
1 |
The executive tries to match the number of critical worker threads with changing workloads as the system executes. Once every second, the executive function ExpWorkerThreadBalanceManager determines whether it should create a new critical worker thread. The critical worker threads that are created by ExpWorkerThreadBalanceManager are called dynamic worker threads, and all the following conditions must be satisfied before such a thread is created:
§ Work items exist in the critical work queue.
§ The number of inactive critical worker threads (ones that are either blocked waiting for work items or that have blocked on dispatcher objects while executing a work routine) must be less than the number of processors on the system.
§ There are fewer than 16 dynamic worker threads.
Dynamic worker threads exit after 10 minutes of inactivity. Thus, when the workload dictates, the executive can create up to 16 dynamic worker threads.
EXPERIMENT: LISTING SYSTEM WORKER THREADS
You can use the !exqueue kernel debugger command to see a listing of system worker threads classified by their type:
lkd> !exqueue
Dumping ExWorkerQueue: 820FDE40
**** Critical WorkQueue( current = 0 maximum = 2 )
THREAD 861160b8 Cid 0004.001c Teb: 00000000 Win32Thread: 00000000 WAIT
THREAD 8613b020 Cid 0004.0020 Teb: 00000000 Win32Thread: 00000000 WAIT
THREAD 8613bd78 Cid 0004.0024 Teb: 00000000 Win32Thread: 00000000 WAIT
THREAD 8613bad0 Cid 0004.0028 Teb: 00000000 Win32Thread: 00000000 WAIT
THREAD 8613b828 Cid 0004.002c Teb: 00000000 Win32Thread: 00000000 WAIT
**** Delayed WorkQueue( current = 0 maximum = 2 )
THREAD 8613b580 Cid 0004.0030 Teb: 00000000 Win32Thread: 00000000 WAIT
THREAD 8613b2d8 Cid 0004.0034 Teb: 00000000 Win32Thread: 00000000 WAIT
THREAD 8613c020 Cid 0004.0038 Teb: 00000000 Win32Thread: 00000000 WAIT
THREAD 8613cd78 Cid 0004.003c Teb: 00000000 Win32Thread: 00000000 WAIT
THREAD 8613cad0 Cid 0004.0040 Teb: 00000000 Win32Thread: 00000000 WAIT
THREAD 8613c828 Cid 0004.0044 Teb: 00000000 Win32Thread: 00000000 WAIT
THREAD 8613c580 Cid 0004.0048 Teb: 00000000 Win32Thread: 00000000 WAIT
**** HyperCritical WorkQueue( current = 0 maximum = 2 )
THREAD 8613c2d8 Cid 0004.004c Teb: 00000000 Win32Thread: 00000000 WAIT
Windows Global Flags
Windows has a set of flags stored in a systemwide global variable named NtGlobalFlag that enable various internal debugging, tracing, and validation support in the operating system. The system variable NtGlobalFlag is initialized from the registry key HKLM\SYSTEM\CurrentControlSet\Control\Session Manager in the value GlobalFlag at system boot time. By default, this registry value is 0, so it’s likely that on your systems, you’re not using any global flags. In addition, each image has a set of global flags that also turn on internal tracing and validation code (although the bit layout of these flags is entirely different from the systemwide global flags).
Fortunately, the debugging tools contains a utility named Gflags.exe you can use to view and change the system global flags (either in the registry or in the running system) as well as image global flags. Gflags has both a command-line and a GUI interface. To see the command-line flags, type gflags /?. If you run the utility without any switches, the dialog box shown in Figure 3-28 is displayed.
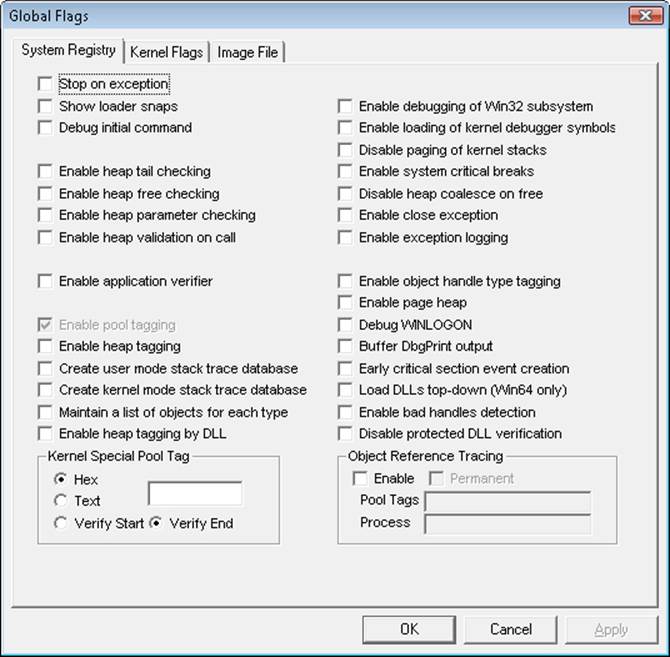
Figure 3-28. Setting system debugging options with Gflags
You can configure a variable’s settings in the registry on the System Registry page or the current value of a variable in system memory on the Kernel Flags page.
The Image File page requires you to fill in the file name of an executable image. Use this option to change a set of global flags that apply to an individual image (rather than to the whole system). In Figure 3-29, notice that the flags are different from the operating system ones shown in Figure 3-28.
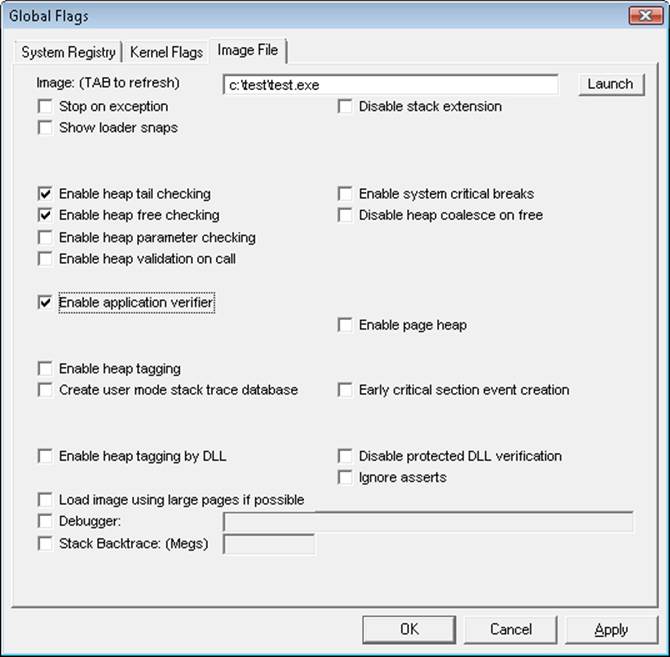
Figure 3-29. Setting image global flags with Gflags
EXPERIMENT: VIEWING AND SETTING NTGLOBALFLAG
You can use the !gflag kernel debugger command to view and set the state of the NtGlobalFlag kernel variable. The !gflag command lists all the flags that are enabled. You can use !gflag -? to get the entire list of supported global flags.
Advanced Local Procedure Call
All modern operating systems require a mechanism for securely transferring data between one or more processes in user mode, as well as between a service in the kernel and clients in user mode. Typically, UNIX mechanisms such as mailslots, files, named pipes, and sockets are used for portability, while other developers use window messages for graphical applications. Windows implements an internal IPC mechanism called Advanced Local Procedure Call, or ALPC, which is a high-speed, scalable, and secured facility for message passing arbitrary-size messages. Although it is internal, and thus not available for third-party developers, ALPC is widely used in various parts of Windows:
§ Windows applications that use remote procedure call (RPC), a documented API, indirectly use ALPC when they specify local-RPC over the ncalrpc transport, a form of RPC used to communicate between processes on the same system. Kernel-mode RPC, used by the network stack, also uses ALPC.
§ Whenever a Windows process and/or thread starts, as well as during any Windows subsystem operation (such as all console I/O), ALPC is used to communicate with the subsystem process (CSRSS). All subsystems communicate with the session manager (SMSS) over ALPC.
§ Winlogon uses ALPC to communicate with the local security authentication process, LSASS.
§ The security reference monitor (an executive component explained in Chapter 6) uses ALPC to communicate with the LSASS process.
§ The user-mode power manager and power monitor communicate with the kernel-mode power manager over ALPC, such as whenever the LCD brightness is changed.
§ Windows Error Reporting uses ALPC to receive context information from crashing processes.
§ The User-Mode Driver Framework (UMDF) enables user-mode drivers to communicate using ALPC.
NOTE
ALPC is the replacement for an older IPC mechanism initially shipped with the very first kernel design of Windows NT, called LPC, which is why certain variables, fields, and functions might still refer to “LPC” today. Keep in mind that LPC is now emulated on top of ALPC for compatibility and has been removed from the kernel (legacy system calls still exist, which get wrapped into ALPC calls).
Connection Model
Typically, ALPCs are used between a server process and one or more client processes of that server. An ALPC connection can be established between two or more user-mode processes or between a kernel-mode component and one or more user-mode processes. ALPC exports a single executive object called the port object to maintain the state needed for communication. Although this is just one object, there are actually several kinds of ALPC ports that it can represent:
§ Server connection port. A named port that is a server connection request point. Clients can connect to the server by connecting to this port.
§ Server communication port. An unnamed port a server uses to communicate with a particular client. The server has one such port per active client.
§ Client communication port. An unnamed port a particular client thread uses to communicate with a particular server.
§ Unconnected communication port. An unnamed port a client can use to communicate locally with itself.
ALPC follows a connection and communication model that’s somewhat reminiscent of BSD socket programming. A server first creates a server connection port (NtAlpcCreatePort), while a client attempts to connect to it (NtAlpcConnectPort). If the server was in a listening state, it receives a connection request message and can choose to accept it (NtAlpcAcceptPort). In doing so, both the client and server communication ports are created, and each respective endpoint process receives a handle to its communication port. Messages are then sent across this handle (NtAlpcSendWaitReceiveMessage), typically in a dedicated thread, so that the server can continue listening for connection requests on the original connection port (unless this server expects only one client).
The server also has the ability to deny the connection, either for security reasons or simply due to protocol or versioning issues. Because clients can send a custom payload with a connection request, this is usually used by various services to ensure that the correct client, or only one client, is talking to the server. If any anomalies are found, the server can reject the connection, and, optionally, return a payload containing information on why the client was rejected (allowing the client to take corrective action, if possible, or for debugging purposes).
Once a connection is made, a connection information structure (actually, a blob, as will be described shortly) stores the linkage between all the different ports, as shown in Figure 3-30.

Figure 3-30. Use of ALPC ports
Message Model
Using ALPC, a client and thread using blocking messages each take turns performing a loop around the NtAlpcSendWaitReplyPort system call, in which one side sends a request and waits for a reply while the other side does the opposite. However, because ALPC supports asynchronous messages, it’s possible for either side not to block and choose instead to perform some other runtime task and check for messages later (some of these methods will be described shortly). ALPC supports the following three methods of exchanging payloads sent with a message:
§ A message can be sent to another process through the standard double-buffering mechanism, in which the kernel maintains a copy of the message (copying it from the source process), switches to the target process, and copies the data from the kernel’s buffer. For compatibility, if legacy LPC is being used, only messages up to 256 bytes can be sent this way, while ALPC has the ability to allocate an extension buffer for messages up to ~64KB.
§ A message can be stored in an ALPC section object from which the client and server processes map views. (See Chapter 10 in Part 2 for more information on section mappings.)
§ A message can be stored in a message zone, which is an Memory Descriptor List (MDL) that backs the physical pages containing the data and that is mapped into the kernel’s address space.
An important side effect of the ability to send asynchronuos messages is that a message can be canceled—for example, when a request takes too long or the user has indicated that she wants to cancel the operation it implements. ALPC supports this with the NtAlpcCancelMessagesystem call.
An ALPC message can be on one of four different queues implemented by the ALPC port object:
§ Main queue. A message has been sent, and the client is processing it.
§ Pending queue. A message has been sent and the caller is waiting for a reply, but the reply has not yet been sent.
§ Large message queue. A message has been sent, but the caller’s buffer was too small to receive it. The caller gets another chance to allocate a larger buffer and request the message payload again.
§ Canceled queue. A message that was sent to the port, but has since been canceled.
Note that a fifth queue, called the wait queue, does not link messages together; instead, it links all the threads waiting on a message.
EXPERIMENT: VIEWING SUBSYSTEM ALPC PORT OBJECTS
You can see named ALPC port objects with the WinObj tool from Sysinternals. Run Winobj.exe, and select the root directory. A gear icon identifies the port objects, as shown here:
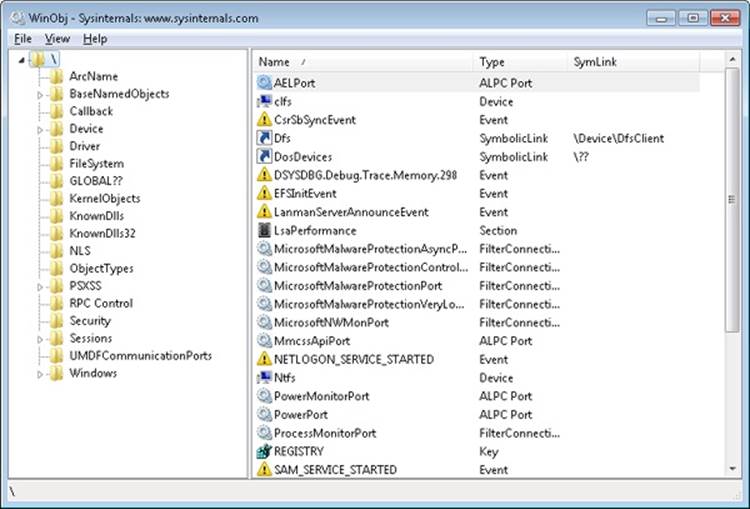
You should see the ALPC ports used by the power manager, the security manager, and other internal Windows services. If you want to see the ALPC port objects used by RPC, you can select the \RPC Control directory. One of the primary users of ALPC, outside of Local RPC, is the Windows subsystem, which uses ALPC to communicate with the Windows subsystem DLLs that are present in all Windows processes. (Subsystem for UNIX Applications uses a similar mechanism.) Because CSRSS loads once for each session, you will find its ALPC port objects under the appropriate \Sessions\X\Windows directory, such as shown here:
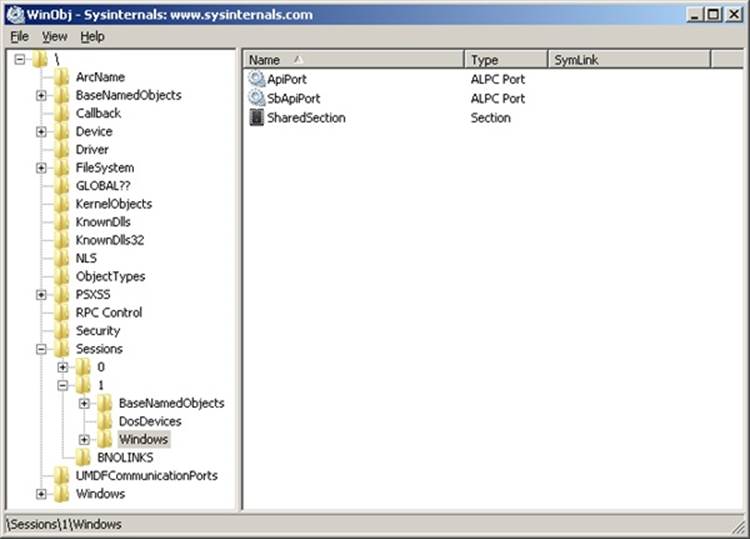
Asynchronous Operation
The synchronous model of ALPC is tied to the original LPC architecture in the early NT design, and is similar to other blocking IPC mechanisms, such as Mach ports. Although it is simple to design, a blocking IPC algorithm includes many possibilities for deadlock, and working around those scenarios creates complex code that requires support for a more flexible asynchronous (nonblocking) model. As such, ALPC was primarily designed to support asynchronous operation as well, which is a requirement for scalable RPC and other uses, such as support for pending I/O in user-mode drivers. A basic feature of ALPC, which wasn’t originally present in LPC, is that blocking calls can have a timeout parameter. This allows legacy applications to avoid certain deadlock scenarios.
However, ALPC is optimized for asynchronous messages and provides three different models for asynchronous notifications. The first doesn’t actually notify the client or server, but simply copies the data payload. Under this model, it’s up to the implementor to choose a reliable synchronization method. For example, the client and the server can share a notification event object, or the client can poll for data arrival. The data structure used by this model is the ALPC completion list (not to be confused with the Windows I/O completion port). The ALPC completion list is an efficient, nonblocking data structure that enables atomic passing of data between clients, and its internals are described further in the Performance section.
The next notification model is a waiting model that uses the Windows completion-port mechanism (on top of the ALPC completion list). This enables a thread to retrieve multiple payloads at once, control the maximum number of concurrent requests, and take advantage of native completion-port functionality. The user-mode thread pool (described later in this chapter) implementation provides internal APIs that processes use to manage ALPC messages within the same infrastructure as worker threads, which are implemented using this model. The RPC system in Windows, when using Local RPC (over ncalrpc), also makes use of this functionality to provide efficient message delivery by taking advantage of this kernel support.
Finally, because drivers can also use asynchronous ALPC, but do not typically support completion ports at such a high-level, ALPC also provides a mechanism for a more basic, kernel-based notification using executive callback objects. A driver can register its own callback and context with NtSetInformationAlpcPort, after which it will get called whenever a message is received. The user-mode, power-manager interfaces in the kernel employ this mechanism for asynchronous LCD backlight operation on laptops, for example.
Views, Regions, and Sections
Instead of sending message buffers between their two respective processes, a server and client can choose a more efficient data-passing mechanism that is at the core of Windows’ memory manager: the section object. (More information is available in Chapter 10 in Part 2.) This allows a piece of memory to be allocated as shared, and for both client and server to have a consistent, and equal, view of this memory. In this scenario, as much data as can fit can be transferred, and data is merely copied into one address range and immediately available in the other. Unfortunately, shared-memory communication, such as LPC traditionally provided, has its share of drawbacks, especially when considering security ramifications. For one, because both client and server must have access to the shared memory, an unprivileged client can use this to corrupt the server’s shared memory, and even build executable payloads for potential exploits. Additionally, because the client knows the location of the server’s data, it can use this information to bypass ASLR protections. (See Chapter 8 in Part 2 for more information.)
ALPC provides its own security on top of what’s provided by section objects. With ALPC, a specific ALPC section object must be created with the appropriate NtAlpcCreatePortSection API, which will create the correct references to the port, as well as allow for automatic section garbage collection. (A manual API also exists for deletion.) As the owner of the ALPC section object begins using the section, the allocated chunks are created as ALPC regions, which represent a range of used addresses within the section and add an extra reference to the message. Finally, within a range of shared memory, the clients obtain views to this memory, which represents the local mapping within their address space.
Regions also support a couple of security options. First of all, regions can be mapped either using a secure mode or an unsecure mode. In the secure mode, only two views (mappings) are allowed to the region. This is typically used when a server wants to share data privately with a single client process. Additionally, only one region for a given range of shared memory can be opened from within the context of a given port. Finally, regions can also be marked with write-access protection, which enables only one process context (the server) to have write access to the view (by using MmSecureVirtualMemoryAgainstWrites). Other clients, meanwhile, will have read-only access only. These settings mitigate many privilege-escalation attacks that could happen due to attacks on shared memory, and they make ALPC more resilient than typical IPC mechanisms.
Attributes
ALPC provides more than simple message passing: it also enables specific contextual information to be added to each message and have the kernel track the validity, lifetime, and implementation of that information. Users of ALPC have the ability to assign their own custom context information as well. Whether it’s system-managed or user-managed, ALPC calls this data attributes. There are three of these that the kernel manages:
§ The security attribute, which holds key information to allow impersonation of clients, as well as advanced ALPC security functionality (which is described later)
§ The data view attribute, responsible for managing the different views associated with the regions of an ALPC section
§ The handle attribute, which contains information about which handles to associate with the message (which is described in more detail later in the Security section).
Normally, these attributes are initially passed in by the server or client when the message is sent and converted into the kernel’s own internal ALPC representation. If the ALPC user requests this data back, it is exposed back securely. By implementing this kind of model and combining it with its own internal handle table, described next, ALPC can keep critical data opaque between clients and servers, while still maintaining the true pointers in kernel mode.
Finally, a fourth attribute is supported, called the context attribute. This attribute supports the traditional, LPC-style, user-specific context pointer that could be associated with a given message, and it is still supported for scenarios where custom data needs to be associated with a client/server pair.
To define attributes correctly, a variety of APIs are available for internal ALPC consumers, such as AlpcInitializeMessageAttribute and AlpcGetMessageAttribute.
Blobs, Handles, and Resources
Although the ALPC library exposes only one Object Manager object type (the port), it internally must manage a number of data structures that allow it to perform the tasks required by its mechanisms. For example, ALPC needs to allocate and track the messages associated with each port, as well as the message attributes, which it must track for the duration of their lifetime. Instead of using the Object Manager’s routines for data management, ALPC implements its own lightweight objects called blobs. Just like objects, blobs can automatically be allocated and garbage collected, reference tracked, and locked through synchronization. Additionally, blobs can have custom allocation and deallocation callbacks, which let their owners control extra information that might need to be tracked for each blob. Finally, ALPC also uses the executive’s handle table implementation (used for objects and PIDs/TIDs) to have an ALPC-specific handle table, which allows ALPC to generate private handles for blobs, instead of using pointers.
In the ALPC model, messages are blobs, for example, and their constructor generates a message ID, which is itself a handle into ALPC’s handle table. Other ALPC blobs include the following:
§ The connection blob, which stores the client and server communication ports, as well as the server connection port and ALPC handle table.
§ The security blob, which stores the security data necessary to allow impersonation of a client. It stores the security attribute.
§ The section, region, and view blobs, which describe ALPC’s shared-memory model. The view blob is ultimately responsible for storing the data view attribute.
§ The reserve blob, which implements support for ALPC Reserve Objects. (See the Reserve Objects section in this chapter.)
§ The handle data blob, which contains the information that enables ALPC’s handle attribute support.
Because blobs are allocated from pageable memory, they must carefully be tracked to ensure their deletion at the appropriate time. For certain kinds of blobs, this is easy: for example, when an ALPC message is freed, the blob used to contain it is also deleted. However, certain blobs can represent numerous attributes attached to a single ALPC message, and the kernel must manage their lifetime appropriately. For example, because a message can have multiple views associated with it (when many clients have access to the same shared memory), the views must be tracked with the messages that reference them. ALPC implements this functionality by using a concept of resources. Each message is associated with a resource list, and whenever a blob associated with a message (that isn’t a simple pointer) is allocated, it is also added as a resource of the message. In turn, the ALPC library provides functionality for looking up, flushing, and deleting associated resources. Security blobs, reserve blobs, and view blobs are all stored as resources.
Security
ALPC implements several security mechanisms, full security boundaries, and mitigations to prevent attacks in case of generic IPC parsing bugs. At a base level, ALPC port objects are managed by the same object manager interfaces that manage object security, preventing nonprivileged applications from obtaining handles to server ports with ACL. On top of that, ALPC provides a SID-based trust model, inherited from the original LPC design. This model enables clients to validate the server they are connecting to by relying on more than just the port name. With a secured port, the client process submits to the kernel the SID of the server process it expects on the side of the endpoint. At connection time, the kernel validates that the client is indeed connecting to the expected server, mitigating namespace squatting attacks where an untrusted server creates a port to spoof a server.
ALPC also allows both clients and servers to atomically and uniquely identify the thread and process responsible for each message. It also supports the full Windows impersonation model through the NtAlpcImpersonateClientThread API. Other APIs give an ALPC server the ability to query the SIDs associated with all connected clients and to query the LUID (locally unique identifier) of the client’s security token (which is further described in Chapter 6).
Performance
ALPC uses several strategies to enhance performance, primarily through its support of completion lists, which were briefly described earlier. At the kernel level, a completion list is essentially a user MDL that’s been probed and locked and then mapped to an address. (For more information on Memory Descriptor Lists, see Chapter 10 in Part 2.) Because it’s associated with an MDL (which tracks physical pages), when a client sends a message to a server, the payload copy can happen directly at the physical level, instead of requiring the kernel to double-buffer the message, as is common in other IPC mechanisms.
The completion list itself is implemented as a 64-bit queue of completed entries, and both user-mode and kernel-mode consumers can use an interlocked compare-exchange operation to insert and remove entries from the queue. Furthermore, to simplify allocations, once an MDL has been initialized, a bitmap is used to identify available areas of memory that can be used to hold new messages that are still being queued. The bitmap algorithm also uses native lock instructions on the processor to provide atomic allocation and de-allocation of areas of physical memory that can be used by completion lists.
Another ALPC performance optimization is the use of message zones. A message zone is simply a pre-allocated kernel buffer (also backed by an MDL) in which a message can be stored until a server or client retrieves it. A message zone associates a system address with the message, allowing it to be made visible in any process address space. More importantly, in the case of asynchronous operation, it does not require the complex setup of delayed payloads because no matter when the consumer finally retrieves the message data, the message zone will still be valid. Both completion lists and message zones can be set up with NtAlpcSetInformationPort.
A final optimization worth mentioning is that instead of copying data as soon as it is sent, the kernel sets up the payload for a delayed copy, capturing only the needed information, but without any copying. The message data is copied only when the receiver requests the message. Obviously, if a message zone or shared memory is being used, there’s no advantage to this method, but in asynchronous, kernel-buffer message passing, this can be used to optimize cancellations and high-traffic scenarios.
Debugging and Tracing
On checked builds of the kernel, ALPC messages can be logged. All ALPC attributes, blobs, message zones, and dispatch transactions can be individually logged, and undocumented !alpc commands in WinDbg can dump the logs. On retail systems, IT administrators and troubleshooters can enable the ALPC Event Tracing for Windows (ETW) logger to monitor ALPC messages. ETW events do not include payload data, but they do contain connection, disconnection, and send/receive and wait/unblock information. Finally, even on retail systems, certain !alpc commands obtain information on ALPC ports and messages.
EXPERIMENT: DUMPING A CONNECTION PORT
In this experiment, you’ll use the CSRSS API port for Windows processes running in Session 1, which is the typical interactive session for the console user. Whenever a Windows application launches, it connects to CSRSS’s API port in the appropriate session.
1. Start by obtaining a pointer to the connection port with the !object command:
2. 0: kd> !object \Sessions\1\Windows\ApiPort
3. Object: fffffa8004dc2090 Type: (fffffa80027a2ed0) ALPC Port
4. ObjectHeader: fffffa8004dc2060 (new version)
5. HandleCount: 1 PointerCount: 50
Directory Object: fffff8a001a5fb30 Name: ApiPort
6. Now dump information on the port object itself with !alpc /p. This will confirm, for example, that CSRSS is the owner:
7. 0: kd> !alpc /p fffffa8004dc2090
8. Port @ fffffa8004dc2090
9. Type : ALPC_CONNECTION_PORT
10. CommunicationInfo : fffff8a001a22560
11. ConnectionPort : fffffa8004dc2090
12. ClientCommunicationPort : 0000000000000000
13. ServerCommunicationPort : 0000000000000000
14. OwnerProcess : fffffa800502db30 (csrss.exe)
15. SequenceNo : 0x000003C9 (969)
16. CompletionPort : 0000000000000000
17. CompletionList : 0000000000000000
18. MessageZone : 0000000000000000
19. ConnectionPending : No
20. ConnectionRefused : No
21. Disconnected : No
22. Closed : No
23. FlushOnClose : Yes
24.
25. ReturnExtendedInfo : No
26. Waitable : No
27. Security : Static
28. Wow64CompletionList : No
29.
30. Main queue is empty.
31. Large message queue is empty.
32. Pending queue is empty.
Canceled queue is empty.
33. You can see what clients are connected to the port, which will include all Windows processes running in the session, with the undocumented !alpc /lpc command. You will also see the server and client communication ports associated with each connection and any pending messages on any of the queues:
34.0: kd> !alpc /lpc fffffa8004dc2090
35.
36.Port @fffffa8004dc2090 has 14 connections
37.
38.SRV:fffffa8004809c50 (m:0, p:0, l:0) <-> CLI:fffffa8004809e60 (m:0, p:0, l:0),
39. Process=fffffa8004ffcb30 ('winlogon.exe')
40.SRV:fffffa80054dfb30 (m:0, p:0, l:0) <-> CLI:fffffa80054dfe60 (m:0, p:0, l:0),
41. Process=fffffa80054de060 ('dwm.exe')
42.SRV:fffffa8005394dd0 (m:0, p:0, l:0) <-> CLI:fffffa80054e1440 (m:0, p:0, l:0),
43. Process=fffffa80054e2290 ('winvnc.exe')
44.SRV:fffffa80053965d0 (m:0, p:0, l:0) <-> CLI:fffffa8005396900 (m:0, p:0, l:0),
45. Process=fffffa80054ed060 ('explorer.exe')
46.SRV:fffffa80045a8070 (m:0, p:0, l:0) <-> CLI:fffffa80045af070 (m:0, p:0, l:0),
47. Process=fffffa80045b1340 ('logonhlp.exe')
48.SRV:fffffa8005197940 (m:0, p:0, l:0) <-> CLI:fffffa800519a900 (m:0, p:0, l:0),
49. Process=fffffa80045da060 ('TSVNCache.exe')
50.SRV:fffffa800470b070 (m:0, p:0, l:0) <-> CLI:fffffa800470f330 (m:0, p:0, l:0),
51. Process=fffffa8004713060 ('vmware-tray.ex')
52.SRV:fffffa80045d7670 (m:0, p:0, l:0) <-> CLI:fffffa80054b16f0 (m:0, p:0, l:0),
53. Process=fffffa80056b8b30 ('WINWORD.EXE')
54.SRV:fffffa80050e0e60 (m:0, p:0, l:0) <-> CLI:fffffa80056fee60 (m:0, p:0, l:0),
55. Process=fffffa800478f060 ('Winobj.exe')
56.SRV:fffffa800482e670 (m:0, p:0, l:0) <-> CLI:fffffa80047b7680 (m:0, p:0, l:0),
57. Process=fffffa80056aab30 ('cmd.exe')
58.SRV:fffffa8005166e60 (m:0, p:0, l:0) <-> CLI:fffffa80051481e0 (m:0, p:0, l:0),
59. Process=fffffa8002823b30 ('conhost.exe')
60.SRV:fffffa80054a2070 (m:0, p:0, l:0) <-> CLI:fffffa80056e6210 (m:0, p:0, l:0),
61. Process=fffffa80055669e0 ('livekd.exe')
62.SRV:fffffa80056aa390 (m:0, p:0, l:0) <-> CLI:fffffa80055a6c00 (m:0, p:0, l:0),
63. Process=fffffa80051b28b0 ('livekd64.exe')
64.SRV:fffffa8005551d90 (m:0, p:0, l:0) <-> CLI:fffffa80055bfc60 (m:0, p:0, l:0),
Process=fffffa8002a69b30 ('kd.exe')
65. Note that if you have other sessions, you can repeat this experiment on those sessions also (as well as with session 0, the system session). You will eventually get a list of all the Windows processes on your machine. If you are using Subsystem for UNIX Applications, you can also use this technique on the \PSXSS\ApiPort object.
Kernel Event Tracing
Various components of the Windows kernel and several core device drivers are instrumented to record trace data of their operations for use in system troubleshooting. They rely on a common infrastructure in the kernel that provides trace data to the user-mode Event Tracing for Windows (ETW) facility. An application that uses ETW falls into one or more of three categories:
§ Controller. A controller starts and stops logging sessions and manages buffer pools. Example controllers include Reliability and Performance Monitor (see the EXPERIMENT: Tracing TCP/IP Activity with the Kernel Logger section, later in this section) and XPerf from the Windows Performance Toolkit (see the EXPERIMENT: Monitoring Interrupt and DPC Activity section, earlier in this chapter).
§ Provider. A provider defines GUIDs (globally unique identifiers) for the event classes it can produce traces for and registers them with ETW. The provider accepts commands from a controller for starting and stopping traces of the event classes for which it’s responsible.
§ Consumer. A consumer selects one or more trace sessions for which it wants to read trace data. Consumers can receive the events in buffers in real time or in log files.
Windows includes dozens of user-mode providers, for everything from Active Directory to the Service Control Manager to Explorer. ETW also defines a logging session with the name NT Kernel Logger (also known as the kernel logger) for use by the kernel and core drivers. The providers for the NT Kernel Logger are implemented by ETW code in Ntoskrnl.exe and the core drivers.
When a controller in user mode enables the kernel logger, the ETW library (which is implemented in \Windows\System32\Ntdll.dll) calls the NtTraceControl system function, telling the ETW code in the kernel which event classes the controller wants to start tracing. If file logging is configured (as opposed to in-memory logging to a buffer), the kernel creates a system thread in the system process that creates a log file. When the kernel receives trace events from the enabled trace sources, it records them to a buffer. If it was started, the file logging thread wakes up once per second to dump the contents of the buffers to the log file.
Trace records generated by the kernel logger have a standard ETW trace event header, which records time stamp, process, and thread IDs, as well as information on what class of event the record corresponds to. Event classes can provide additional data specific to their events. For example, disk event class trace records indicate the operation type (read or write), disk number at which the operation is directed, and sector offset and length of the operation.
Some of the trace classes that can be enabled for the kernel logger and the component that generates each class include the following:
§ Disk I/O. Disk class driver
§ File I/O. File system drivers
§ File I/O Completion. File system drivers
§ Hardware Configuration. Plug and Play manager (See Chapter 9 in Part 2 for information on the Plug and Play manager.)
§ Image Load/Unload. The system image loader in the kernel
§ Page Faults. Memory manager (See Chapter 10 in Part 2 for more information on page faults.)
§ Hard Page Faults. Memory manager
§ Process Create/Delete. Process manager (See Chapter 5 for more information on the process manager.)
§ Thread Create/Delete. Process manager
§ Registry Activity. Configuration manager (See The Registry section in Chapter 4 for more information on the configuration manager.)
§ Network TCP/IP. TCP/IP driver
§ Process Counters. Process manager
§ Context Switches. Kernel dispatcher
§ Deferred Procedure Calls. Kernel dispatcher
§ Interrupts. Kernel dispatcher
§ System Calls. Kernel dispatcher
§ Sample Based Profiling. Kernel dispatcher and HAL
§ Driver Delays. I/O manager
§ Split I/O. I/O manager
§ Power Events. Power manager
§ ALPC. Advanced local procedure call
§ Scheduler and Synchronization. Kernel dispatcher (See Chapter 5 for more information about thread scheduling)
You can find more information on ETW and the kernel logger, including sample code for controllers and consumers, in the Windows SDK.
EXPERIMENT: TRACING TCP/IP ACTIVITY WITH THE KERNEL LOGGER
To enable the kernel logger and have it generate a log file of TCP/IP activity, follow these steps:
1. Run the Performance Monitor, and click on Data Collector Sets, User Defined.
2. Right-click on User Defined, choose New, and select Data Collector Set.
3. When prompted, enter a name for the data collector set (for example, experiment), and choose Create Manually (Advanced) before clicking Next.
4. In the dialog box that opens, select Create Data Logs, check Event Trace Data, and then click Next. In the Providers area, click Add, and locate Windows Kernel Trace. In the Properties list, select Keywords(Any), and then click Edit.
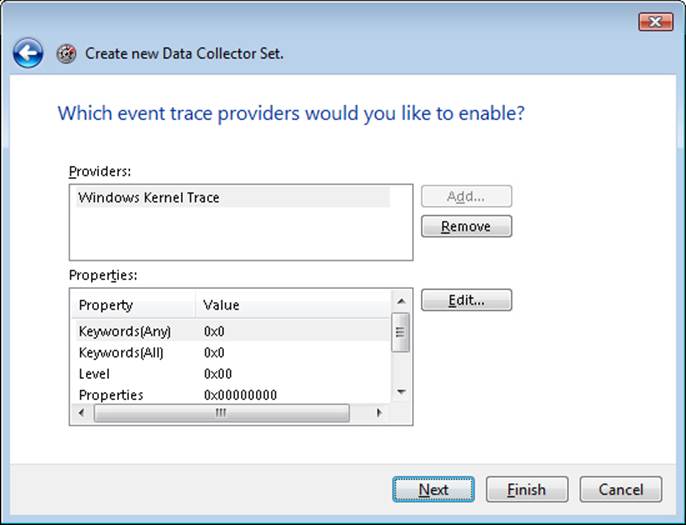
5. From this list, select only Net for Network TCP/IP, and then click OK.
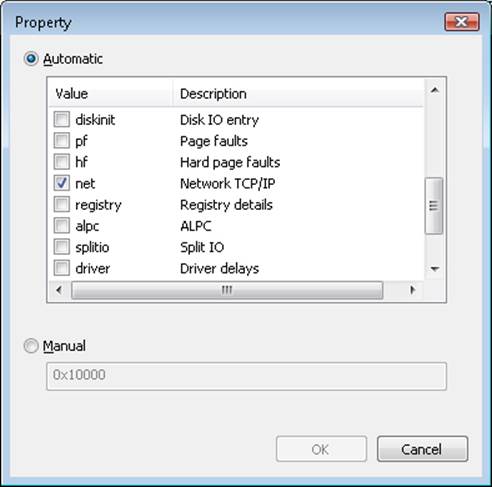
6. Click Next to select a location where the files are saved. By default, this location is C:\Perflogs\<User>\experiment\, if this is how you named the data collector set. Click Next, and in the Run As edit box, enter the Administrator account name and set the password to match it. Click Finish. You should now see a window similar to the one shown here:
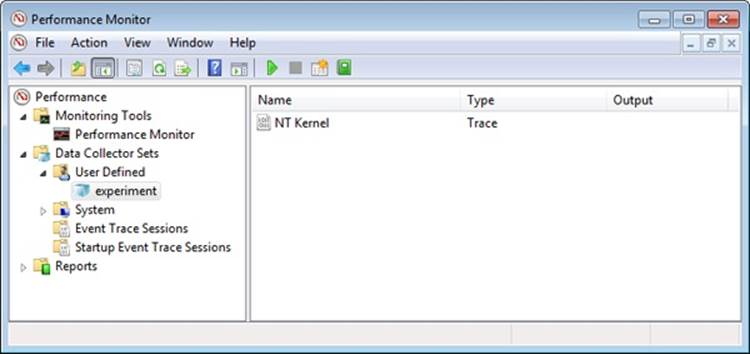
7. Right-click on “experiment” (or whatever name you gave your data collector set), and then click Start. Now generate some network activity by opening a browser and visiting a web site.
8. Right-click on the data collector set node again, and then click Stop.
9. Open a command prompt, and change to the C:\Perflogs\experiment\00001 directory (or the directory into which you specified that the trace log file be stored).
10. Run tracerpt, and pass it the name of the trace log file:
tracerpt DataCollector01.etl –o dumpfile.csv –of CSV
11. Open dumpfile.csv in Microsoft Excel or in a text editor. You should see TCP and/or UDP trace records like the following:
|
TcpIp |
SendIPV4 |
0xFFFFFFFF |
1.28663E+17 |
0 |
0 |
1992 |
1388 |
157.54.86.28 |
172.31.234.35 |
80 |
49414 |
646659 |
646661 |
|
UdpIp |
RecvIPV4 |
0xFFFFFFFF |
1.28663E+17 |
0 |
0 |
4 |
50 |
172.31.239.255 |
172.31.233.110 |
137 |
137 |
0 |
0x0 |
|
UdpIp |
RecvIPV4 |
0xFFFFFFFF |
1.28663E+17 |
0 |
0 |
4 |
50 |
172.31.239.255 |
172.31.234.162 |
137 |
137 |
0 |
0x0 |
|
TcpIp |
RecvIPV4 |
0xFFFFFFFF |
1.28663E+17 |
0 |
0 |
1992 |
1425 |
157.54.86.28 |
172.31.234.35 |
80 |
49414 |
0 |
0x0 |
|
TcpIp |
RecvIPV4 |
0xFFFFFFFF |
1.28663E+17 |
0 |
0 |
1992 |
1380 |
157.54.86.28 |
172.31.234.35 |
80 |
49414 |
0 |
0x0 |
|
TcpIp |
RecvIPV4 |
0xFFFFFFFF |
1.28663E+17 |
0 |
0 |
1992 |
45 |
157.54.86.28 |
172.31.234.35 |
80 |
49414 |
0 |
0x0 |
|
TcpIp |
RecvIPV4 |
0xFFFFFFFF |
1.28663E+17 |
0 |
0 |
1992 |
1415 |
157.54.86.28 |
172.31.234.35 |
80 |
49414 |
0 |
0x0 |
|
TcpIp |
RecvIPV4 |
0xFFFFFFFF |
1.28663E+17 |
0 |
0 |
1992 |
740 |
157.54.86.28 |
172.31.234.35 |
80 |
49414 |
0 |
0x0 |
Wow64
Wow64 (Win32 emulation on 64-bit Windows) refers to the software that permits the execution of 32-bit x86 applications on 64-bit Windows. It is implemented as a set of user-mode DLLs, with some support from the kernel for creating 32-bit versions of what would normally only be 64-bit data structures, such as the process environment block (PEB) and thread environment block (TEB). Changing Wow64 contexts through Get/SetThreadContext is also implemented by the kernel. Here are the user-mode DLLs responsible for Wow64:
§ Wow64.dll. Manages process and thread creation, and hooks exception-dispatching and base system calls exported by Ntoskrnl.exe. It also implements file-system redirection and registry redirection.
§ Wow64Cpu.dll. Manages the 32-bit CPU context of each running thread inside Wow64, and provides processor architecture-specific support for switching CPU mode from 32-bit to 64-bit and vice versa.
§ Wow64Win.dll. Intercepts the GUI system calls exported by Win32k.sys.
§ IA32Exec.bin and Wowia32x.dll on IA64 systems. Contain the IA-32 software emulator and its interface library. Because Itanium processors cannot natively execute x86 32-bit instructions in an efficient manner (performance is worse than 30 percent), software emulation (through binary translation) is required through the use of these two additional components.
The relationship of these DLLs is shown in Figure 3-31.
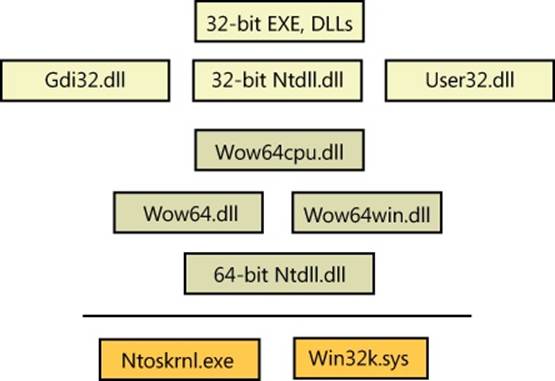
Figure 3-31. Wow64 architecture
Wow64 Process Address Space Layout
Wow64 processes can run with 2 GB or 4 GB of virtual space. If the image header has the large-address-aware flag set, the memory manager reserves the user-mode address space above the 4-GB boundary through the end of the user-mode boundary. If the image is not marked as large address space aware, the memory manager reserves the user-mode address space above 2 GB. (For more information on large-address-space support, see the section “x86 User Address Space Layouts” in Chapter 10 in Part 2.)
System Calls
Wow64 hooks all the code paths where 32-bit code would transition to the native 64-bit system or when the native system needs to call into 32-bit user-mode code. During process creation, the process manager maps into the process address space the native 64-bit Ntdll.dll, as well as the 32-bit Ntdll.dll for Wow64 processes. When the loader initialization is called, it calls the Wow64 initialization code inside Wow64.dll. Wow64 then sets up the startup context required by the 32-bit Ntdll, switches the CPU mode to 32-bits, and starts executing the 32-bit loader. From this point onward, execution continues as if the process is running on a native 32-bit system.
Special 32-bit versions of Ntdll.dll, User32.dll, and Gdi32.dll are located in the \Windows\Syswow64 folder (as well as certain other DLLs that perform interprocess communication, such as Rpcrt4.dll). These call into Wow64 rather than issuing the native 32-bit system call instruction. Wow64 transitions to native 64-bit mode, captures the parameters associated with the system call (converting 32-bit pointers to 64-bit pointers), and issues the corresponding native 64-bit system call. When the native system call returns, Wow64 converts any output parameters if necessary from 64-bit to 32-bit formats before returning to 32-bit mode.
Exception Dispatching
Wow64 hooks exception dispatching through Ntdll’s KiUserExceptionDispatcher. Whenever the 64-bit kernel is about to dispatch an exception to a Wow64 process, Wow64 captures the native exception and context record in user mode and then prepares a 32-bit exception and context record and dispatches it the same way the native 32-bit kernel would.
User APC Dispatching
Wow64 also hooks user-mode APC delivery through Ntdll’s KiUserApcDispatcher. Whenever the 64-bit kernel is about to dispatch a user-mode APC to a Wow64 process, it maps the 32-bit APC address to a higher range of 64-bit address space. The 64-bit Ntdll then captures the native APC and context record in user mode and maps it back to a 32-bit address. It then prepares a 32-bit user-mode APC and context record and dispatches it the same way the native 32-bit kernel would.
Console Support
Because console support is implemented in user mode by Csrss.exe, of which only a single native binary exists, 32-bit applications would be unable to perform console I/O while on 64-bit Windows. Similarly to how a special rpcrt4.dll exits to thunk 32-bit to 64-bit RPCs, the 32-bit Kernel.dll for Wow64 contains special code to call into Wow, for thunking parameters during interaction with Csrss and Conhost.exe.
User Callbacks
Wow64 intercepts all callbacks from the kernel into user mode. Wow64 treats such calls as system calls; however, the data conversion is done in the reverse order: input parameters are converted from 64 bits to 32 bits, and output parameters are converted when the callback returns from 32 bits to 64 bits.
File System Redirection
To maintain application compatibility and to reduce the effort of porting applications from Win32 to 64-bit Windows, system directory names were kept the same. Therefore, the \Windows\System32 folder contains native 64-bit images. Wow64, as it hooks all the system calls, translates all the path-related APIs and replaces the path name of the \Windows\System32 folder with \Windows\Syswow64. Wow64 also redirects \Windows\LastGood to \Windows\LastGood\syswow64 and \Windows \Regedit.exe to \Windows\syswow64\Regedit.exe. Through the use of system environment variables, the %PROGRAMFILES% variable is also set to \Program Files (x86) for 32-bit applications, while it is set to \Program Files folder for 64-bit applications. CommonProgramFiles and CommonProgramFiles (x86) also exist, which always point to the 32-bit location, while ProgramW6432 and CommonProgramW6432 point to the 64-bit locations unconditionally.
NOTE
Because certain 32-bit applications might indeed be aware and able to deal with 64-bit images, a virtual directory, \Windows\Sysnative, allows any I/Os originating from a 32-bit application to this directory to be exempted from file redirection. This directory doesn’t actually exist—it is a virtual path that allows access to the real System32 directory, even from an application running under Wow64.
There are a few subdirectories of \Windows\System32 that, for compatibility reasons, are exempted from being redirected such that access attempts to them made by 32-bit applications actually access the real one. These directories include the following:
§ %windir%\system32\drivers\etc
§ %windir%\system32\spool
§ %windir%\system32\catroot and %windir%\system32\catroot2
§ %windir%\system32\logfiles
§ %windir%\system32\driverstore
Finally, Wow64 provides a mechanism to control the file system redirection built into Wow64 on a per-thread basis through the Wow64DisableWow64FsRedirection and Wow64RevertWow64FsRedirection functions. This mechanism can have issues with delay-loaded DLLs, opening files through the common file dialog and even internationalization—because once redirection is disabled, the system no longer users it during internal loading either, and certain 64-bit-only files would then fail to be found. Using the c:\windows\sysnative path or some of the other consistent paths introduced earlier is usually a safer methodology for developers to use.
Registry Redirection
Applications and components store their configuration data in the registry. Components usually write their configuration data in the registry when they are registered during installation. If the same component is installed and registered both as a 32-bit binary and a 64-bit binary, the last component registered will override the registration of the previous component because they both write to the same location in the registry.
To help solve this problem transparently without introducing any code changes to 32-bit components, the registry is split into two portions: Native and Wow64. By default, 32-bit components access the 32-bit view and 64-bit components access the 64-bit view. This provides a safe execution environment for 32-bit and 64-bit components and separates the 32-bit application state from the 64-bit one if it exists.
To implement this, Wow64 intercepts all the system calls that open registry keys and retranslates the key path to point it to the Wow64 view of the registry. Wow64 splits the registry at these points:
§ HKLM\SOFTWARE
§ HKEY_CLASSES_ROOT
However, note that many of the subkeys are actually shared between 32-bit and 64-bit apps—that is, not the entire hive is split.
Under each of these keys, Wow64 creates a key called Wow6432Node. Under this key is stored 32-bit configuration information. All other portions of the registry are shared between 32-bit and 64-bit applications (for example, HKLM\SYSTEM).
As an extra help, if a 32-bit application writes a REG_SZ or REG_EXPAND_SZ value that starts with the data “%ProgramFiles%” or “%commonprogramfiles%” to the registry, Wow64 modifies the actual values to “%ProgramFiles(x86)%” and “%commonprogramfiles(x86)%” to match the file system redirection and layout explained earlier. The 32-bit application must write exactly these strings using this case—any other data will be ignored and written normally. Finally, any key containing “system32” is replaced with “syswow64” in all cases, regardless of flags and case sensitivity, unless KEY_WOW64_64KEY is used and the key is on the list of “reflected keys”, which is available on MSDN.
For applications that need to explicitly specify a registry key for a certain view, the following flags on the RegOpenKeyEx, RegCreateKeyEx, RegOpenKeyTransacted, RegCreateKeyTransacted, and RegDeleteKeyEx functions permit this:
§ KEY_WOW64_64KEY—Explicitly opens a 64-bit key from either a 32-bit or 64-bit application, and disables the REG_SZ or REG_EXPAND_SZ interception explained earlier
§ KEY_WOW64_32KEY—Explicitly opens a 32-bit key from either a 32-bit or 64-bit application
I/O Control Requests
Besides normal read and write operations, applications can communicate with some device drivers through device I/O control functions using the Windows DeviceIoControl API. The application might specify an input and/or output buffer along with the call. If the buffer contains pointer-dependent data and the process sending the control request is a Wow64 process, the view of the input and/or output structure is different between the 32-bit application and the 64-bit driver, because pointers are 4 bytes for 32-bit applications and 8 bytes for 64-bit applications. In this case, the kernel driver is expected to convert the associated pointer-dependent structures. Drivers can call the IoIs32bitProcess function to detect whether or not an I/O request originated from a Wow64 process. Look for “Supporting 32-Bit I/O in Your 64-Bit Driver” on MSDN for more details.
16-Bit Installer Applications
Wow64 doesn’t support running 16-bit applications. However, because many application installers are 16-bit programs, Wow64 has special case code to make references to certain well-known 16-bit installers work. These installers include the following:
§ Microsoft ACME Setup version: 1.2, 2.6, 3.0, and 3.1
§ InstallShield version 5.x (where x is any minor version number)
Whenever a 16-bit process is about to be created using the CreateProcess() API, Ntvdm64.dll is loaded and control is transferred to it to inspect whether the 16-bit executable is one of the supported installers. If it is, another CreateProcess is issued to launch a 32-bit version of the installer with the same command-line arguments.
Printing
32-bit printer drivers cannot be used on 64-bit Windows. Print drivers must be ported to native 64-bit versions. However, because printer drivers run in the user-mode address space of the requesting process and only native 64-bit printer drivers are supported on 64-bit Windows, a special mechanism is needed to support printing from 32-bit processes. This is done by redirecting all printing functions to Splwow64.exe, the Wow64 RPC print server. Because Splwow64 is a 64-bit process, it can load 64-bit printer drivers.
Restrictions
Wow64 does not support the execution of 16-bit applications (this is supported on 32-bit versions of Windows) or the loading of 32-bit kernel-mode device drivers (they must be ported to native 64-bits). Wow64 processes can load only 32-bit DLLs and can’t load native 64-bit DLLs. Likewise, native 64-bit processes can’t load 32-bit DLLs. The one exception is the ability to load resource or data-only DLLs cross-architecture, which is allowed because those DLLs contain only data, not code.
In addition to the above, due to page size differences, Wow64 on IA64 systems does not support the ReadFileScatter, WriteFileGather, GetWriteWatch, AVX registers, XSAVE, and AWE functions. Also, hardware acceleration through DirectX is not available. (Software emulation is provided for Wow64 processes.)
User-Mode Debugging
Support for user-mode debugging is split into three different modules. The first one is located in the executive itself and has the prefix Dbgk, which stands for Debugging Framework. It provides the necessary internal functions for registering and listening for debug events, managing the debug object, and packaging the information for consumption by its user-mode counterpart. The user-mode component that talks directly to Dbgk is located in the native system library, Ntdll.dll, under a set of APIs that begin with the prefix DbgUi. These APIs are responsible for wrapping the underlying debug object implementation (which is opaque), and they allow all subsystem applications to use debugging by wrapping their own APIs around the DbgUi implementation. Finally, the third component in user-mode debugging belongs to the subsystem DLLs. It is the exposed, documented API (located in KernelBase.dll for the Windows subsystem) that each subsystem supports for performing debugging of other applications.
Kernel Support
The kernel supports user-mode debugging through an object mentioned earlier, the debug object. It provides a series of system calls, most of which map directly to the Windows debugging API, typically accessed through the DbgUi layer first. The debug object itself is a simple construct, composed of a series of flags that determine state, an event to notify any waiters that debugger events are present, a doubly linked list of debug events waiting to be processed, and a fast mutex used for locking the object. This is all the information that the kernel requires for successfully receiving and sending debugger events, and each debugged process has a debug port member in its structure pointing to this debug object.
Once a process has an associated debug port, the events described in Table 3-23 can cause a debug event to be inserted into the list of events.
Table 3-23. Kernel-Mode Debugging Events
|
Event Identifier |
Meaning |
Triggered By |
|
DbgKmExceptionApi |
An exception has occurred. |
KiDispatchException during an exception that occurred in user mode |
|
DbgKmCreateThreadApi |
A new thread has been created. |
Startup of a user-mode thread |
|
DbgKmCreateProcessApi |
A new process has been created. |
Startup of a user-mode thread that is the first thread in the process |
|
DbgKmExitThreadApi |
A thread has exited. |
Death of a user-mode thread |
|
DbgKmExitProcessApi |
A process has exited. |
Death of a user-mode thread that was the last thread in the process |
|
DbgKmLoadDllApi |
A DLL was loaded. |
NtMapViewOfSection when the section is an image file (could be an EXE as well) |
|
DbgKmUnloadDllApi |
A DLL was unloaded. |
NtUnmapViewOfSection when the section is an image file (could be an EXE as well) |
|
DbgKmErrorReportApi |
An exception needs to be forwarded to Windows Error Reporting (WER). |
KiDispatchException during an exception that occurred in user mode, after the debugger was unable to handle it |
Apart from the causes mentioned in the table, there are a couple of special triggering cases outside the regular scenarios that occur at the time a debugger object first becomes associated with a process. The first create process and create thread messages will be manually sent when the debugger is attached, first for the process itself and its main thread and followed by create thread messages for all the other threads in the process. Finally, load dll events for the executable being debugged (Ntdll.dll) and then all the current DLLs loaded in the debugged process will be sent.
Once a debugger object has been associated with a process, all the threads in the process are suspended. At this point, it is the debugger’s responsibility to start requesting that debug events be sent through. Debuggers request that debug events be sent back to user mode by performing a wait on the debug object. This call loops the list of debug events. As each request is removed from the list, its contents are converted from the internal dbgk structure to the native structure that the next layer up understands. As you’ll see, this structure is different from the Win32 structure as well, and another layer of conversion has to occur. Even after all pending debug messages have been processed by the debugger, the kernel does not automatically resume the process. It is the debugger’s responsibility to call the ContinueDebugEvent function to resume execution.
Apart from some more complex handling of certain multithreading issues, the basic model for the framework is a simple matter of producers—code in the kernel that generates the debug events in the previous table—and consumers—the debugger waiting on these events and acknowledging their receipt.
Native Support
Although the basic protocol for user-mode debugging is quite simple, it’s not directly usable by Windows applications—instead, it’s wrapped by the DbgUi functions in Ntdll.dll. This abstraction is required to allow native applications, as well as different subsystems, to use these routines (because code inside Ntdll.dll has no dependencies). The functions that this component provides are mostly analogous to the Windows API functions and related system calls. Internally, the code also provides the functionality required to create a debug object associated with the thread. The handle to a debug object that is created is never exposed. It is saved instead in the thread environment block (TEB) of the debugger thread that performs the attachment. (For more information on the TEB, see Chapter 5.) This value is saved in DbgSsReserved[1].
When a debugger attaches to a process, it expects the process to be broken into—that is, an int 3 (breakpoint) operation should have happened, generated by a thread injected into the process. If this didn’t happen, the debugger would never actually be able to take control of the process and would merely see debug events flying by. Ntdll.dll is responsible for creating and injecting that thread into the target process.
Finally, Ntdll.dll also provides APIs to convert the native structure for debug events into the structure that the Windows API understands.
EXPERIMENT: VIEWING DEBUGGER OBJECTS
Although you’ve been using WinDbg to do kernel-mode debugging, you can also use it to debug user-mode programs. Go ahead and try starting Notepad.exe with the debugger attached using these steps:
1. Run WinDbg, and then click File, Open Executable.
2. Navigate to the \Windows\System32\ directory, and choose Notepad.exe.
3. You’re not going to do any debugging, so simply ignore whatever might come up. You can type g in the command window to instruct WinDbg to continue executing Notepad.
Now run Process Explorer, and be sure the lower pane is enabled and configured to show open handles. (Click on View, Lower Pane View, and then Handles.) You also want to look at unnamed handles, so click on View, Show Unnamed Handles And Mappings.
Next, click on the Windbg.exe process and look at its handle table. You should see an open, unnamed handle to a debug object. (You can organize the table by Type to find this entry more readily.) You should see something like the following:
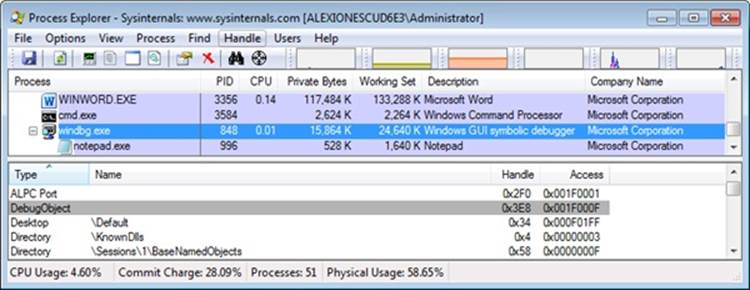
You can try right-clicking on the handle and closing it. Notepad should disappear, and the following message should appear in WinDbg:
ERROR: WaitForEvent failed, NTSTATUS 0xC0000354
This usually indicates that the debuggee has been
killed out from underneath the debugger.
You can use .tlist to see if the debuggee still exists.
WaitForEvent failed
In fact, if you look at the description for the NTSTATUS code given, you will find the text: “An attempt to do an operation on a debug port failed because the port is in the process of being deleted,” which is exactly what you’ve done by closing the handle.
As you can see, the native DbgUi interface doesn’t do much work to support the framework except for this abstraction. The most complicated task it does is the conversion between native and Win32 debugger structures. This involves several additional changes to the structures.
Windows Subsystem Support
The final component responsible for allowing debuggers such as Microsoft Visual Studio or WinDbg to debug user-mode applications is in Kernel32.dll. It provides the documented Windows APIs. Apart from this trivial conversion of one function name to another, there is one important management job that this side of the debugging infrastructure is responsible for: managing the duplicated file and thread handles.
Recall that each time a load DLL event is sent, a handle to the image file is duplicated by the kernel and handed off in the event structure, as is the case with the handle to the process executable during the create process event. During each wait call, Kernel32.dll checks whether this is an event that results in new duplicated process and/or thread handles from the kernel (the two create events). If so, it allocates a structure in which it stores the process ID, thread ID, and the thread and/or process handle associated with the event. This structure is linked into the firstDbgSsReserved array index in the TEB, where we mentioned the debug object handle is stored. Likewise, Kernel32.dll also checks for exit events. When it detects such an event, it “marks” the handles in the data structure.
Once the debugger is finished using the handles and performs the continue call, Kernel32.dll parses these structures, looks for any handles whose threads have exited, and closes the handles for the debugger. Otherwise, those threads and processes would actually never exit, because there would always be open handles to them as long as the debugger was running.
Image Loader
When a process is started on the system, the kernel creates a process object to represent it (see Chapter 5 for more information on processes) and performs various kernel-related initialization tasks. However, these tasks do not result in the execution of the application, merely in the preparation of its context and environment. In fact, unlike drivers, which are kernel-mode code, applications execute in user mode. So most of the actual initialization work is done outside the kernel. This work is performed by the image loader, also internally referred to as Ldr.
The image loader lives in the user-mode system DLL Ntdll.dll and not in the kernel library. Therefore, it behaves just like standard code that is part of a DLL, and it is subject to the same restrictions in terms of memory access and security rights. What makes this code special is the guaranty that it will always be present in the running process (Ntdll.dll is always loaded) and that it is the first piece of code to run in user mode as part of a new application. (When the system builds the initial context, the program counter, or instruction pointer, is set to an initialization function inside Ntdll.dll. See Chapter 5 for more information.)
Because the loader runs before the actual application code, it is usually invisible to users and developers. Additionally, although the loader’s initialization tasks are hidden, a program typically does interact with its interfaces during the run time of a program—for example, whenever loading or unloading a DLL or querying the base address of one. Some of the main tasks the loader is responsible for include these:
§ Initializing the user-mode state for the application, such as creating the initial heap and setting up the thread-local storage (TLS) and fiber-local storage (FLS) slots
§ Parsing the import table (IAT) of the application to look for all DLLs that it requires (and then recursively parsing the IAT of each DLL), followed by parsing the export table of the DLLs to make sure the function is actually present (Special forwarder entries can also redirect an export to yet another DLL.)
§ Loading and unloading DLLs at run time, as well as on demand, and maintaining a list of all loaded modules (the module database)
§ Allowing for run-time patching (called hotpatching) support, explained later in the chapter
§ Handling manifest files
§ Reading the application compatibility database for any shims, and loading the shim engine DLL if required
§ Enabling support for API sets and API redirection, a core part of the MinWin refactoring effort
§ Enabling dynamic runtime compatibility mitigations through the SwitchBranch mechanism
As you can see, most of these tasks are critical to enabling an application to actually run its code; without them, everything from calling external functions to using the heap would immediately fail. After the process has been created, the loader calls a special native API to continue execution based on a context frame located on the stack. This context frame, built by the kernel, contains the actual entry point of the application. Therefore, because the loader doesn’t use a standard call or jump into the running application, you’ll never see the loader initialization functions as part of the call tree in a stack trace for a thread.
EXPERIMENT: WATCHING THE IMAGE LOADER
In this experiment, you’ll use global flags to enable a debugging feature called loader snaps. This allows you to see debug output from the image loader while debugging application startup.
1. From the directory where you’ve installed WinDbg, launch the Gflags.exe application, and then click on the Image File tab.
2. In the Image field, type Notepad.exe, and then press the Tab key. This should enable the check boxes. Select the Show Loader Snaps option, and then click OK to dismiss the dialog box.
3. Now follow the steps in the EXPERIMENT: Viewing Debugger Objects section to start debugging the Notepad.exe application.
4. You should now see a couple of screens of debug information similar to that shown here:
5. 0924:0248 @ 116983652 - LdrpInitializeProcess - INFO: Initializing process 0x924
6. 0924:0248 @ 116983652 - LdrpInitializeProcess - INFO: Beginning execution of
7. notepad.exe (C:\Windows\notepad.exe)
8. 0924:0248 @ 116983652 - LdrpLoadDll - INFO: Loading DLL "kernel32.dll" from path
9. "C:\Windows;C:\Windows\system32;C:\Windows\system;C:\Windows;
10.0924:0248 @ 116983652 - LdrpMapDll - INFO: Mapped DLL "kernel32.dll" at address
11. 76BD000
12.0924:0248 @ 116983652 - LdrGetProcedureAddressEx - INFO: Locating procedure
13. "BaseThreadInitThunk" by name
14.0924:0248 @ 116983652 - LdrpRunInitializeRoutines - INFO: Calling init routine
15. 76C14592 for DLL "C:\Windows\system32\kernel32.dll"
16.0924:0248 @ 116983652 - LdrGetProcedureAddressEx - INFO: Locating procedure
"BaseQueryModuleData" by name
17. Eventually, the debugger breaks somewhere inside the loader code, at a special place where the image loader checks whether a debugger is attached and fires a breakpoint. If you press the G key to continue execution, you will see more messages from the loader, and Notepad will appear.
18. Try interacting with Notepad and see how certain operations invoke the loader. A good experiment is to open the Save/Open dialog. That demonstrates that the loader not only runs at startup, but continuously responds to thread requests that can cause delayed loads of other modules (which can then be unloaded after use).
Early Process Initialization
Because the loader is present in Ntdll.dll, which is a native DLL that’s not associated with any particular subsystem, all processes are subject to the same loader behavior (with some minor differences). In Chapter 5, we’ll look in detail at the steps that lead to the creation of a process in kernel mode, as well as some of the work performed by the Windows function CreateProcess. Here, however, we’ll cover the work that takes place in user mode, independent of any subsystem, as soon as the first user-mode instruction starts execution. When a process starts, the loader performs the following steps:
1. Build the image path name for the application, and query the Image File Execution Options key for the application, as well as the DEP and SEH validation linker settings.
2. Look inside the executable’s header to see whether it is a .NET application (specified by the presence of a .NET-specific image directory).
3. Initialize the National Language Support (NLS for internationalization) tables for the process.
4. Initialize the Wow64 engine if the image is 32-bit and is running on 64-bit Windows.
5. Load any configuration options specified in the executable’s header. These options, which a developer can define when compiling the application, control the behavior of the executable.
6. Set the affinity mask if one was specified in the executable header.
7. Initialize FLS and TLS.
8. Initialize the heap manager for the process, and create the first process heap.
9. Allocate an SxS (Side-by-Side Assembly)/Fusion activation context for the process. This allows the system to use the appropriate DLL version file, instead of defaulting to the DLL that shipped with the operating system. (See Chapter 5 for more information.)
10.Open the \KnownDlls object directory, and build the known DLL path. For a Wow64 process, \KnownDlls32 is used instead.
11.Determine the process’ current directory and default load path (used when loading images and opening files).
12.Build the first loader data table entries for the application executable and Ntdll.dll, and insert them into the module database.
At this point, the image loader is ready to start parsing the import table of the executable belonging to the application and start loading any DLLs that were dynamically linked during the compilation of the application. Because each imported DLL can also have its own import table, this operation will continue recursively until all DLLs have been satisfied and all functions to be imported have been found. As each DLL is loaded, the loader will keep state information for it and build the module database.
DLL Name Resolution and Redirection
Name resolution is the process by which the system converts the name of a PE-format binary to a physical file in situations where the caller has not specified or cannot specify a unique file identity. Because the locations of various directories (the application directory, the system directory, and so on) cannot be hardcoded at link time, this includes the resolution of all binary dependencies as well as LoadLibrary operations in which the caller does not specify a full path.
When resolving binary dependencies, the basic Windows application model locates files in a search path—a list of locations that is searched sequentially for a file with a matching base name—although various system components override the search path mechanism in order to extend the default application model. The notion of a search path is a holdover from the era of the command line, when an application’s current directory was a meaningful notion; this is somewhat anachronistic for modern GUI applications.
However, the placement of the current directory in this ordering allowed load operations on system binaries to be overridden by placing malicious binaries with the same base name in the application’s current directory. To prevent security risks associated with this behavior, a feature known as safe DLL search mode was added to the path search computation and, starting with Windows XP SP2, is enabled by default for all processes. Under safe search mode, the current directory is moved behind the three system directories, resulting in the following path ordering:
1. The directory from which the application was launched
2. The native Windows system directory (for example, C:\Windows\System32)
3. The 16-bit Windows system directory (for example, C:\Windows\System)
4. The Windows directory (for example, C:\Windows)
5. The current directory at application launch time
6. Any directories specified by the %PATH% environment variable
The DLL search path is recomputed for each subsequent DLL load operation. The algorithm used to compute the search path is the same as the one used to compute the default search path, but the application can change specific path elements by editing the %PATH% variable using the SetEnvironmentVariable API, changing the current directory using the SetCurrentDirectory API, or using the SetDllDirectory API to specify a DLL directory for the process. When a DLL directory is specified, the directory replaces the current directory in the search path and the loader ignores the safe DLL search mode setting for the process.
Callers can also modify the DLL search path for specific load operations by supplying the LOAD_WITH_ALTERED_SEARCH_PATH flag to the LoadLibraryEx API. When this flag is supplied and the DLL name supplied to the API specifies a full path string, the path containing the DLL file is used in place of the application directory when computing the search path for the operation.
DLL Name Redirection
Before attempting to resolve a DLL name string to a file, the loader attempts to apply DLL name redirection rules. These redirection rules are used to extend or override portions of the DLL namespace—which normally corresponds to the Win32 file system namespace—to extend the Windows application model. In order of application, they are
§ MinWin API Set Redirection. The API set mechanism is designed to allow the Windows team to change the binary that exports a given system API in a manner that is transparent to applications.
§ .LOCAL Redirection. The .LOCAL redirection mechanism allows applications to redirect all loads of a specific DLL base name, regardless of whether a full path is specified, to a local copy of the DLL in the application directory—either by creating a copy of the DLL with the same base name followed by .local (for example, MyLibrary.dll.local) or by creating a file folder with the name .local under the application directory and placing a copy of the local DLL in the folder (for example, C:\Program Files\My App\.LOCAL\MyLibrary.dll). DLLs redirected by the .LOCAL mechanism are handled identically to those redirected by SxS. (See the next bullet point.) The loader honors .LOCAL redirection of DLLs only when the executable does not have an associated manifest, either embedded or external.
§ Fusion (SxS) Redirection. Fusion (also referred to as side-by-side, or SxS) is an extension to the Windows application model that allows components to express more detailed binary dependency information (usually versioning information) by embedding binary resources known as manifests. The Fusion mechanism was first used so that applications could load the correct version of the Windows common controls package (comctl32.dll) after that binary was split into different versions that could be installed alongside one another; other binaries have since been versioned in the same fashion. As of Visual Studio 2005, applications built with the Microsoft linker will use Fusion to locate the appropriate version of the C runtime libraries.
The Fusion runtime tool reads embedded dependency information from a binary’s resource section using the Windows resource loader, and it packages the dependency information into lookup structures known as activation contexts. The system creates default activation contexts at the system and process level at boot and process startup time, respectively; in addition, each thread has an associated activation context stack, with the activation context structure at the top of the stack considered active. The per-thread activation context stack is managed both explicitly, via the ActivateActCtx and DeactivateActCtx APIs, and implicitly by the system at certain points, such as when the DLL main routine of a binary with embedded dependency information is called. When a Fusion DLL name redirection lookup occurs, the system searches for redirection information in the activation context at the head of the thread’s activation context stack, followed by the process and system activation contexts; if redirection information is present, the file identity specified by the activation context is used for the load operation.
§ Known DLL Redirection. Known DLLs is a mechanism that maps specific DLL base names to files in the system directory, preventing the DLL from being replaced with an alternate version in a different location.
One edge case in the DLL path search algorithm is the DLL versioning check performed on 64-bit and WOW64 applications. If a DLL with a matching base name is located but is subsequently determined to have been compiled for the wrong machine architecture—for example, a 64-bit image in a 32-bit application—the loader ignores the error and resumes the path search operation, starting with the path element after the one used to locate the incorrect file. This behavior is designed to allow applications to specify both 64-bit and 32-bit entries in the global %PATH% environment variable.
EXPERIMENT: OBSERVING DLL LOAD SEARCH ORDER
You can use Sysinternals Process Monitor to watch how the loader searches for DLLs. When the loader attempts to resolve a DLL dependency, you will see it perform CreateFile calls to probe each location in the search sequence until either it finds the specified DLL or the load fails.
Here’s the capture of the loader’s search when an executable named Myapp.exe has a static dependency on a library named Mylibrary.dll. The executable is stored in C:\Myapp, but the current working directory was C:\ when the executable was launched. For the sake of demonstration, the executable does not include a manifest (by default, Visual Studio has one) so that the loader will check inside the C:\Myapp\Myapp.exe.local subdirectory that was created for the experiment. To reduce noise, the Process Monitor filter includes the myapp.exe process and any paths that contain the string “mylibrary.dll”.
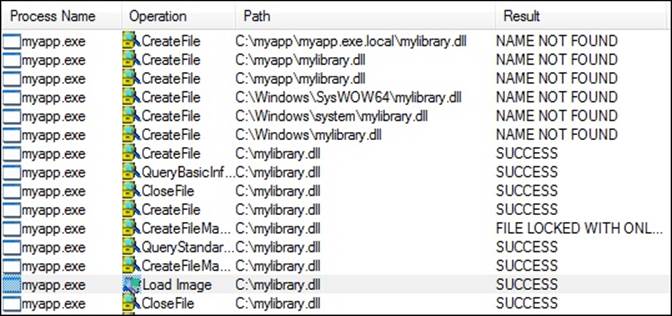
Note how the search order matches that described. First, the loader checks the .LOCAL subdirectory, then the directory where the executable resides, then C:\Windows\System32 directory (because this is a 32-bit executable, that redirects to C:\Windows\SysWOW64), then the 16-bit Windows directory, then C:\Windows, and finally, the current directory at the time the executable was launched. The Load Image event confirms that the loader successfully resolved the import.
Loaded Module Database
The loader maintains a list of all modules (DLLs as well as the primary executable) that have been loaded by a process. This information is stored in a per-process structure called the process environment block, or PEB (see Chapter 5 for a full description of the PEB)—namely, in a substructure identified by Ldr and called PEB_LDR_DATA. In the structure, the loader maintains three doubly-linked lists, all containing the same information but ordered differently (either by load order, memory location, or initialization order). These lists contain structures calledloader data table entries (LDR_DATA_TABLE_ENTRY) that store information about each module. Table 3-24 lists the various pieces of information the loader maintains in an entry.
Table 3-24. Fields in a Loader Data Table Entry
|
Field |
Meaning |
|
BaseDllName |
Name of the module itself, without the full path |
|
ContextInformation |
Used by SwitchBranch (described later) to store the current Windows context GUID associated with this module |
|
DllBase |
Holds the base address at which the module was loaded |
|
EntryPoint |
Contains the initial routine of the module (such as DllMain) |
|
EntryPointActivationContext |
Contains the SxS/Fusion activation context when calling initializers |
|
Flags |
Loader state flags for this module (See Table 3-25 for a description of the flags.) |
|
ForwarderLinks |
Linked list of modules that were loaded as a result of export table forwarders from the module |
|
FullDllName |
Fully qualified path name of the module |
|
HashLinks |
Linked list used during process startup and shutdown for quicker lookups |
|
List Entry Links |
Links this entry into each of the three ordered lists part of the loader database |
|
LoadCount |
Reference count for the module (that is, how many times it has been loaded) |
|
LoadTime |
Stores the system time value when this module was being loaded |
|
OriginalBase |
Stores the original base address (set by the linker) of this module, enabling faster processing of relocated import entries |
|
PatchInformation |
Information that’s relevant during a hotpatch operation on this module |
|
ServiceTagLinks |
Linked list of services (see Chapter 4 for more information) referencing this module |
|
SizeOfImage |
Size of the module in memory |
|
StaticLinks |
Linked list of modules loaded as a result of static references from this one |
|
TimeDateStamp |
Time stamp written by the linker when the module was linked, which the loader obtains from the module’s image PE header |
|
TlsIndex |
Thread local storage slot associated with this module |
One way to look at a process’ loader database is to use WinDbg and its formatted output of the PEB. The next experiment shows you how to do this and how to look at the LDR_DATA_TABLE_ENTRY structures on your own.
EXPERIMENT: DUMPING THE LOADED MODULES DATABASE
Before starting the experiment, perform the same steps as in the previous two experiments to launch Notepad.exe with WinDbg as the debugger. When you get to the first prompt (where you’ve been instructed to type g until now), follow these instructions:
1. You can look at the PEB of the current process with the !peb command. For now, you’re interested only in the Ldr data that will be displayed. (See Chapter 5 for details about other information stored in the PEB.)
2. 0: kd> !peb
3. PEB at 000007fffffda000
4. InheritedAddressSpace: No
5. ReadImageFileExecOptions: No
6. BeingDebugged: No
7. ImageBaseAddress: 00000000ff590000
8. Ldr 0000000076e72640
9. Ldr.Initialized: Yes
10. Ldr.InInitializationOrderModuleList: 0000000000212880 . 0000000004731c20
11. Ldr.InLoadOrderModuleList: 0000000000212770 . 0000000004731c00
12. Ldr.InMemoryOrderModuleList: 0000000000212780 . 0000000004731c10
13. Base TimeStamp Module
14. ff590000 4ce7a144 Nov 20 11:21:56 2010 C:\Windows\Explorer.EXE
15. 76d40000 4ce7c8f9 Nov 20 14:11:21 2010 C:\Windows\SYSTEM32\ntdll.dll
16. 76870000 4ce7c78b Nov 20 14:05:15 2010 C:\Windows\system32\kernel32.dll
17. 7fefd2d0000 4ce7c78c Nov 20 14:05:16 2010 C:\Windows\system32\KERNELBASE.dll
7fefee20000 4a5bde6b Jul 14 02:24:59 2009 C:\Windows\system32\ADVAPI32.dll
18. The address shown on the Ldr line is a pointer to the PEB_LDR_DATA structure described earlier. Notice that WinDbg shows you the address of the three lists and dumps the initialization order list for you, displaying the full path, time stamp, and base address of each module.
19. You can also analyze each module entry on its own by going through the module list and then dumping the data at each address, formatted as a LDR_DATA_TABLE_ENTRY structure. Instead of doing this for each entry, however, WinDbg can do most of the work by using the !list extension and the following syntax:
20.!list –t ntdll!_LIST_ENTRY.Flink –x "dt ntdll!_LDR_DATA_TABLE_ENTRY @$extret\"
0000000076e72640
Note that the last number is variable: it depends on whatever is shown on your machine under Ldr.InLoadOrderModuleList.
21. You should then see the entries for each module:
22.0:001> !list –t ntdll!_LIST_ENTRY.Flink –x "dt ntdll!_LDR_DATA_TABLE_ENTRY
23.@$extret\" 001c1cf8
24. +0x000 InLoadOrderLinks : _LIST_ENTRY [ 0x1c1d68 - 0x76fd4ccc ]
25. +0x008 InMemoryOrderLinks : _LIST_ENTRY [ 0x1c1d70 - 0x76fd4cd4 ]
26. +0x010 InInitializationOrderLinks : _LIST_ENTRY [ 0x0 - 0x0 ]
27. +0x018 DllBase : 0x00d80000
28. +0x01c EntryPoint : 0x00d831ed
29. +0x020 SizeOfImage : 0x28000
30. +0x024 FullDllName : _UNICODE_STRING "C:\Windows\notepad.exe"
31. +0x02c BaseDllName : _UNICODE_STRING "notepad.exe"
+0x034 Flags : 0x4010
Although this section covers the user-mode loader in Ntdll.dll, note that the kernel also employs its own loader for drivers and dependent DLLs, with a similar loader entry structure. Likewise, the kernel-mode loader has its own database of such entries, which is directly accessible through the PsActiveModuleList global data variable. To dump the kernel’s loaded module database, you can use a similar !list command as shown in the preceding experiment by replacing the pointer at the end of the command with “nt!PsActiveModuleList”.
Looking at the list in this raw format gives you some extra insight into the loader’s internals, such as the flags field, which contains state information that !peb on its own would not show you. See Table 3-25 for their meaning. Because both the kernel and user-mode loaders use this structure, some flags apply only to kernel-mode drivers, while others apply only to user-mode applications (such as .NET state).
TABLE 3-25. LOADER DATA TABLE ENTRY FLAGS
|
Flag |
Meaning |
|
LDRP_STATIC_LINK (0x2) |
This module is referenced by an import table and is required. |
|
LDRP_IMAGE_DLL (0x4) |
The module is an image DLL (and not a data DLL or executable). |
|
LDRP_IMAGE_INTEGRITY_FORCED (0x20) |
The module was linked with /FORCEINTEGRITY (contains IMAGE_DLLCHARACTERISTICS_FORCE_INTEGRITY_in its PE header). |
|
LDRP_LOAD_IN_PROGRESS (0x1000) |
This module is currently being loaded. |
|
LDRP_UNLOAD_IN_PROGRESS (0x2000) |
This module is currently being unloaded. |
|
LDRP_ENTRY_PROCESSED (0x4000) |
The loader has finished processing this module. |
|
LDRP_ENTRY_INSERTED (0x8000) |
The loader has finished inserting this entry into the loaded module database. |
|
LDRP_FAILED_BUILTIN_LOAD (0x20000) |
Indicates this boot driver failed to load. |
|
LDRP_DONT_CALL_FOR_THREADS (0x40000) |
Do not send DLL_THREAD_ATTACH/DETACH notifications to this DLL. |
|
LDRP_PROCESS_ATTACH_CALLED (0x80000) |
This DLL has been sent the DLL_PROCESS_ATTACH notification. |
|
LDRP_DEBUG_SYMBOLS_LOADED (0x100000) |
The debug symbols for this module have been loaded by the kernel or user debugger. |
|
LDRP_IMAGE_NOT_AT_BASE (0x200000) |
This image was relocated from its original base address. |
|
LDRP_COR_IMAGE (0x400000) |
This module is a .NET application. |
|
LDRP_COR_OWNS_UNMAP (0x800000) |
This module should be unmapped by the .NET runtime. |
|
LDRP_SYSTEM_MAPPED (0x1000000) |
This module is mapped into kernel address space with System PTEs (versus being in the initial boot loader’s memory). |
|
LDRP_IMAGE_VERIFYING (0x2000000) |
This module is currently being verified by Driver Verifier. |
|
LDRP_DRIVER_DEPENDENT_DLL (0x4000000) |
This module is a DLL that is in a driver’s import table. |
|
LDRP_ENTRY_NATIVE (0x8000000) |
This module was compiled for Windows 2000 or later. It’s used by Driver Verifier as an indication that a driver might be suspect. |
|
LDRP_REDIRECTED (0x10000000) |
The manifest file specified a redirected file for this DLL. |
|
LDRP_NON_PAGED_DEBUG_INFO (0x20000000) |
The debug information for this module is in nonpaged memory. |
|
LDRP_MM_LOADED (0x40000000) |
This module was loaded by the kernel loader through MmLoadSystemImage. |
|
LDRP_COMPAT_DATABASE_PROCESSED (0x80000000) |
The shim engine has processed this DLL. |
Import Parsing
Now that we’ve explained the way the loader keeps track of all the modules loaded for a process, you can continue analyzing the startup initialization tasks performed by the loader. During this step, the loader will do the following:
1. Load each DLL referenced in the import table of the process’ executable image.
2. Check whether the DLL has already been loaded by checking the module database. If it doesn’t find it in the list, the loader opens the DLL and maps it into memory.
3. During the mapping operation, the loader first looks at the various paths where it should attempt to find this DLL, as well as whether this DLL is a “known DLL,” meaning that the system has already loaded it at startup and provided a global memory mapped file for accessing it. Certain deviations from the standard lookup algorithm can also occur, either through the use of a .local file (which forces the loader to use DLLs in the local path) or through a manifest file, which can specify a redirected DLL to use to guarantee a specific version.
4. After the DLL has been found on disk and mapped, the loader checks whether the kernel has loaded it somewhere else—this is called relocation. If the loader detects relocation, it parses the relocation information in the DLL and performs the operations required. If no relocation information is present, DLL loading fails.
5. The loader then creates a loader data table entry for this DLL and inserts it into the database.
6. After a DLL has been mapped, the process is repeated for this DLL to parse its import table and all its dependencies.
7. After each DLL is loaded, the loader parses the IAT to look for specific functions that are being imported. Usually this is done by name, but it can also be done by ordinal (an index number). For each name, the loader parses the export table of the imported DLL and tries to locate a match. If no match is found, the operation is aborted.
8. The import table of an image can also be bound. This means that at link time, the developers already assigned static addresses pointing to imported functions in external DLLs. This removes the need to do the lookup for each name, but it assumes that the DLLs the application will use will always be located at the same address. Because Windows uses address space randomization (see Chapter 10 in Part 2 for more information on Address Space Load Randomization, or ASLR), this is usually not the case for system applications and libraries.
9. The export table of an imported DLL can use a forwarder entry, meaning that the actual function is implemented in another DLL. This must essentially be treated like an import or dependency, so after parsing the export table, each DLL referenced by a forwarder is also loaded and the loader goes back to step 1.
After all imported DLLs (and their own dependencies, or imports) have been loaded, all the required imported functions have been looked up and found, and all forwarders also have been loaded and processed, the step is complete: all dependencies that were defined at compile time by the application and its various DLLs have now been fulfilled. During execution, delayed dependencies (called delay load), as well as run-time operations (such as calling LoadLibrary) can call into the loader and essentially repeat the same tasks. Note, however, that a failure in these steps will result in an error launching the application if they are done during process startup. For example, attempting to run an application that requires a function that isn’t present in the current version of the operating system can result in a message similar to the one inFigure 3-32.
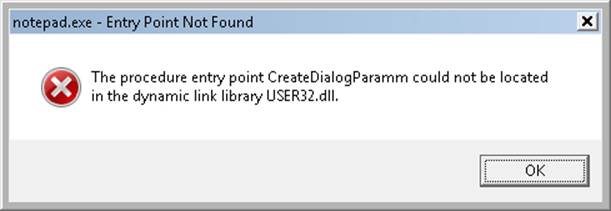
Figure 3-32. Dialog box shown when a required (imported) function is not present in a DLL
Post-Import Process Initialization
After the required dependencies have been loaded, several initialization tasks must be performed to fully finalize launching the application. In this phase, the loader will do the following:
1. Check if the application is a .NET application, and redirect execution to the .NET runtime entry point instead, assuming the image has been validated by the framework.
2. Check if the application itself requires relocation, and process the relocation entries for the application. If the application cannot be relocated, or does not have relocation information, the loading will fail.
3. Check if the application makes use of TLS, and look in the application executable for the TLS entries it needs to allocate and configure.
4. If this is a Windows application, the Windows subsystem thread-initialization thunk code is located after loading kernel32.dll, and the Authz/AppLocker enforcement is enabled. (See Chapter 6 for more information on Software Restriction Policies.) If Kernel32.dll is not found, the system is presumably assumed to be running in MinWin and only Kernelbase.dll is loaded.
5. Any static imports are now loaded.
6. At this point, the initial debugger breakpoint will be hit when using a debugger such as WinDbg. This is where you had to type g to continue execution in the earlier experiments.
7. Make sure that the application will be able to run properly if the system is a multiprocessor system.
8. Set up the default data execution prevention (DEP) options, including for exception-chain validation, also called “software” DEP. (See Chapter 10 in Part 2 for more information on DEP.)
9. Check whether this application requires any application compatibility work, and load the shim engine if required.
10.Detect if this application is protected by SecuROM, SafeDisc, and other kinds of wrapper or protection utilities that could have issues with DEP (and reconfigure DEP settings in those cases).
11.Run the initializers for all the loaded modules.
12.Run the post-initialization Shim Engine callback if the module is being shimmed for application compatibility.
13.Run the associated subsystem DLL post-process initialization routine registered in the PEB. For Windows applications, this does Terminal Services–specific checks, for example.
Running the initializers is the last main step in the loader’s work. This is the step that calls the DllMain routine for each DLL (allowing each DLL to perform its own initialization work, which might even include loading new DLLs at run time) as well as processes the TLS initializers of each DLL. This is one of the last steps in which loading an application can fail. If all the loaded DLLs do not return a successful return code after finishing their DllMain routines, the loader aborts starting the application. As a very last step, the loader calls the TLS initializer of the actual application.
SwitchBack
As each new version of Windows fixes bugs such as race conditions and incorrect parameter validation checks in existing API functions, an application-compatibility risk is created for each change, no matter how minor. Windows makes use of a technology called SwitchBack, implemented in the loader, which enables software developers to embed a GUID specific to the Windows version they are targeting in their executable’s associated manifest. For example, if a developer wants to take advantage of improvements added in Windows 7 to a given API, she would include the Windows 7 GUID in her manifest, while if a developer has a legacy application that depends on Windows Vista–specific behavior, she would put the Windows Vista GUID in the manifest instead. SwitchBack parses this information and correlates it with embedded information in SwitchBack-compatible DLLs (in the .sb_data image section) to decide which version of an affected API should be called by the module. Because SwitchBack works at the loaded-module level, it enables a process to have both legacy and current DLLs concurrently calling the same API, yet observing different results.
Windows currently defines two GUIDs that represent either Windows Vista or Windows 7 compatibility settings:
§ {e2011457-1546-43c5-a5fe-008deee3d3f0} for Windows Vista
§ {35138b9a-5d96-4fbd-8e2d-a2440225f93a} for Windows 7
These GUIDs must be present in the application’s manifest file under the SupportedOS ID present in a compatibility attribute entry. (If the application manifest does not contain a GUID, Windows Vista is chosen as the default compatibility mode.) Running under the Windows 7 context affects the following components:
§ RPC components use the Windows thread pool instead of a private implementation.
§ DirectDraw Lock cannot be acquired on the primary buffer.
§ Blitting on the desktop is not allowed without a clipping window.
§ A race condition in GetOverlappedResult is fixed.
Whenever a Windows API is affected by changes that might break compatibility, the function’s entry code calls the SbSwitchProcedure to invoke the SwitchBack logic. It passes along a pointer to the SwitchBack Module Table, which contains information about the SwitchBack mechanisms employed in the module. The table also contains a pointer to an array of entries for each SwitchBack point. This table contains a description of each branch-point that identifies it with a symbolic name and a comprehensive description, along with an associated mitigation tag. Typically, there will be two branch-points in a module, one for Windows Vista behavior, and one for Windows 7 behavior. For each branch-point, the required SwitchBack context is given—it is this context that determines which of the two (or more) branches is taken at runtime. Finally, each of these descriptors contains a function pointer to the actual code that each branch should execute. If the application is running with the Windows 7 GUID, this will be part of its SwitchBack context, and the SbSelectProcedure API, upon parsing the module table, will perform a match operation. It finds the module entry descriptor for the context and proceeds to call the function pointer included in the descriptor.
SwitchBack uses ETW to trace the selection of given SwitchBack contexts and branch-points and feeds the data into the Windows AIT (Application Impact Telemetry) logger. This data can be periodically collected by Microsoft to determine the extent to which each compatibility entry is being used, identify the applications using it (a full stack trace is provided in the log), and notify third-party vendors.
As mentioned, the compatibility level of the application is stored in its manifest. At load time, the loader parses the manifest file, creates a context data structure, and caches it in the pContextData member of the process environment block. (For more information on the PEB, seeChapter 5.) This context data contains the associated compatibility GUIDs that this process is executing under and determines which version of the branch-points in the called APIs that employ SwitchBack will be executed.
API Sets
While SwitchBack uses API redirection for specific application-compatibility scenarios, there is a much more pervasive redirection mechanism used in Windows for all applications, called API Sets. Its purpose is to enable fine-grained categorization of Windows APIs into sub-DLLs instead of having large multipurpose DLLs that span nearly thousands of APIs that might not be needed on all types of Windows systems today and in the future. This technology, developed mainly to support the refactoring of the bottom-most layers of the Windows architecture to separate it from higher layers, goes hand in hand with the breakdown of Kernel32.dll and Advapi32.dll (among others) into multiple, virtual DLL files.
For example, the following graphic shows that Kernel32.dll, which is a core Windows library, imports from many other DLLs, beginning with API-MS-WIN. Each of these DLLs contain a small subset of the APIs that Kernel32 normally provides, but together they make up the entire API surface exposed by Kernel32.dll. The CORE-STRING library, for instance, provides only the Windows base string functions.
In splitting functions across discrete files, two objectives are achieved: first, doing this allows future applications to link only with the API libraries that provide the functionality that they need, and second, if Microsoft were to create a version of Windows that did not support, for example, Localization (say a non-user-facing, English-only embedded system), it would be possible to simply remove the sub-DLL and modify the API Set schema. This would result in a smaller Kernel32 binary, and any applications that ran without requiring localization would still run.
With this technology, a “base” Windows system called “MinWin” is defined (and, at the source level, built), with a minimum set of services that includes the kernel, core drivers (including file systems, basic system processes such as CSRSS and the Service Control Manager, and a handful of Windows services). Windows Embedded, with its Platform Builder, provides what might seem to be a similar technology, as system builders are able to remove select “Windows components,” such as the shell, or the network stack. However, removing components from Windows leaves dangling dependencies—code paths that, if exercised, would fail because they depend on the removed components. MinWin’s dependencies, on the other hand, are entirely self-contained.
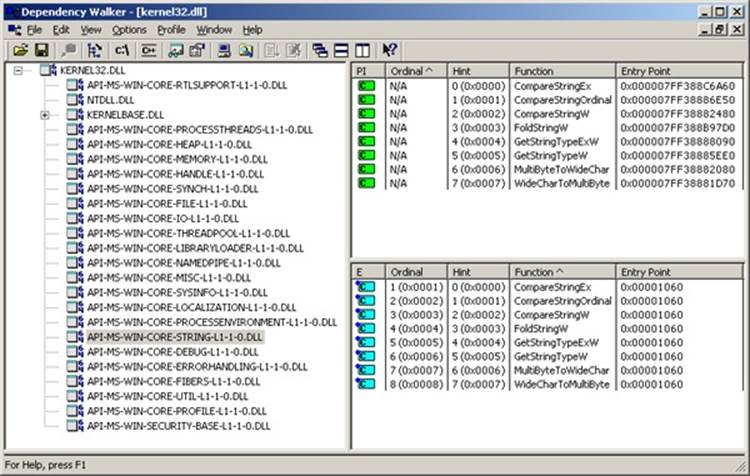
When the process manager initializes, it calls the PspInitializeApiSetMap function, which is responsible for creating a section object (using a standard section object) of the API Set redirection table, which is stored in %SystemRoot%\System32\ApiSetSchema.dll. The DLL contains no executable code, but it has a section called .apiset that contains API Set mapping data that maps virtual API Set DLLs to logical DLLs that implement the APIs. Whenever a new process starts, the process manager maps the section object into the process’ address space and sets theApiSetMap field in the process’ PEB to point to the base address where the section object was mapped.
In turn, the loader’s LdrpApplyFileNameRedirection function, which is normally responsible for the .local and SxS/Fusion manifest redirection that was mentioned earlier, also checks for API Set redirection data whenever a new import library that has a name starting with “API-” loads (either dynamically or statically). The API Set table is organized by library with each entry describing in which logical DLL the function can be found, and that DLL is what gets loaded. Although the schema data is a binary format, you can dump its strings with the Sysinternals Strings tool to see which DLLs are currently defined:
C:\Windows\System32>strings apisetschema.dll
...
MS-Win-Core-Console-L1-1-0
kernel32.dllMS-Win-Core-DateTime-L1-1-0
MS-Win-Core-Debug-L1-1-0
kernelbase.dllMS-Win-Core-DelayLoad-L1-1-0
MS-Win-Core-ErrorHandling-L1-1-0
MS-Win-Core-Fibers-L1-1-0
MS-Win-Core-File-L1-1-0
MS-Win-Core-Handle-L1-1-0
MS-Win-Core-Heap-L1-1-0
MS-Win-Core-Interlocked-L1-1-0
MS-Win-Core-IO-L1-1-0
MS-Win-Core-LibraryLoader-L1-1-0
MS-Win-Core-Localization-L1-1-0
MS-Win-Core-LocalRegistry-L1-1-0
MS-Win-Core-Memory-L1-1-0
MS-Win-Core-Misc-L1-1-0
MS-Win-Core-NamedPipe-L1-1-0
MS-Win-Core-ProcessEnvironment-L1-1-0
MS-Win-Core-ProcessThreads-L1-1-0
MS-Win-Core-Profile-L1-1-0
MS-Win-Core-RtlSupport-L1-1-0
ntdll.dll
MS-Win-Core-String-L1-1-0
Hypervisor (Hyper-V)
One of the key technologies in the software industry—used by system administrators, developers, and testers alike—is called virtualization, and it refers to the ability to run multiple operating systems simultaneously on the same physical machine. One operating system, in which the virtualization software is executing, is called the host, while the other operating systems are running as guests inside the virtualization software. The usage scenarios for this model cover everything from being able to test an application on different platforms to having fully virtual servers all actually running as part of the same machine and managed through one central point.
Until recently, all the virtualization was done by the software itself, sometimes assisted by hardware-level virtualization technology (called host-based virtualization). Thanks to hardware virtualization, the CPU can do most of the notifications required for trapping instructions and virtualizing access to memory. These notifications, as well as the various configuration steps required for allowing guest operating systems to run concurrently, must be handled by a piece of infrastructure compatible with the CPU’s virtualization support. Instead of relying on a piece of separate software running inside a host operating system to perform these tasks, a thin piece of low-level system software, which uses strictly hardware-assisted virtualization support, can be used—a hypervisor. Figure 3-33 shows a simple architectural overview of these two kinds of systems.
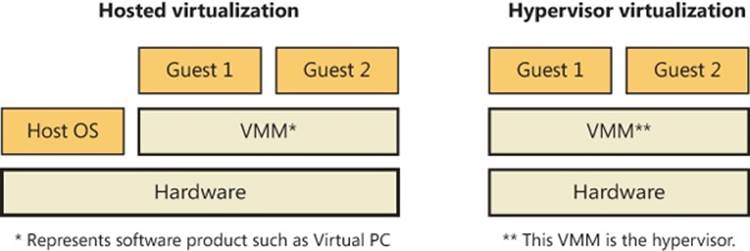
Figure 3-33. Two architectures for virtualization
With Hyper-V, Windows server computers can install support for hypervisor-based virtualization as a server role (as long as an edition with Hyper-V support is licensed). Because the hypervisor is part of the operating system, managing the guests inside it, as well as interacting with them, is fully integrated in the operating system through standard management mechanisms such as WMI and services. (See Chapter 4 for more information on these topics.)
Finally, apart from having a hypervisor that allows running other guests managed by a Windows Server host, both client and server editions of Windows also ship with enlightenments, which are special optimizations in the kernel and possibly device drivers that detect that the code is being run as a guest under a hypervisor and perform certain tasks differently, or more efficiently, considering this environment. We will look at some of these improvements later; for now, we’ll take a look at the basic architecture of the Windows virtualization stack, shown inFigure 3-34.
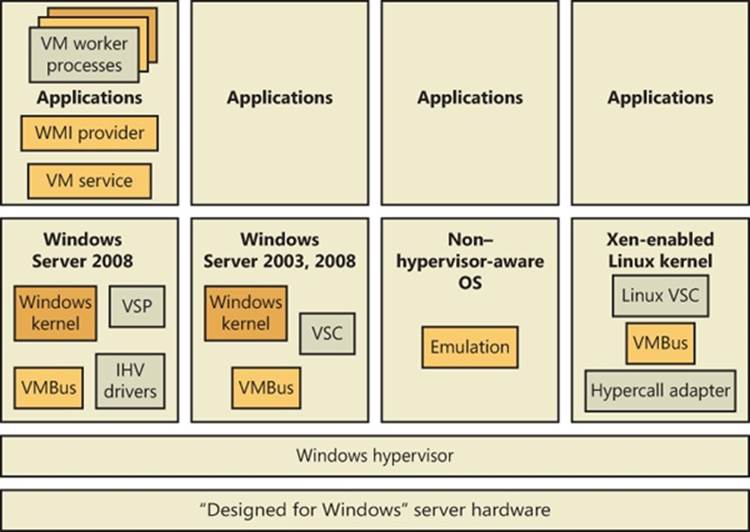
Figure 3-34. Windows Hyper-V architectural stack
Partitions
One of the key architectural components behind the Windows hypervisor is the concept of a partition. A partition essentially references an instance of an operating system installation, which can refer either to what’s traditionally called the host or to the guest. Under the Windows hypervisor model, these two terms are not used; instead, we talk of either a parent partition or a child partition, respectively. Consequently, at a minimum, a Hyper-V system will have a parent partition, which is recommended to contain a Windows Server Core installation, as well as the virtualization stack and its associated components. Although this installation type is recommended because it allows minimizing patches and reducing the security surface area, resulting in increased availability of the server, a full installation is also supported. Each operating system running within the virtualized environment represents a child partition, which might contain certain additional tools that optimize access to the hardware or allow management of the operating system.
Parent Partition
One of the main goals behind the design of the Windows hypervisor was to have it as small and modular as possible, much like a microkernel, instead of providing a full, monolithic module. This means that most of the virtualization work is actually done by a separate virtualization stack and that there are also no hypervisor drivers. In lieu of these, the hypervisor uses the existing Windows driver architecture and talks to actual Windows device drivers. This architecture results in several components that provide and manage this behavior, which are collectively called the hypervisor stack.
Logically, it is the parent partition that is responsible for providing the hypervisor, as well as the entire hypervisor stack. Because these are Microsoft components, only a Windows machine can be a root partition, naturally. A parent partition should have almost no resource usage for itself because its role is to run other operating systems. The main components that the parent partition provides are shown in Figure 3-35.
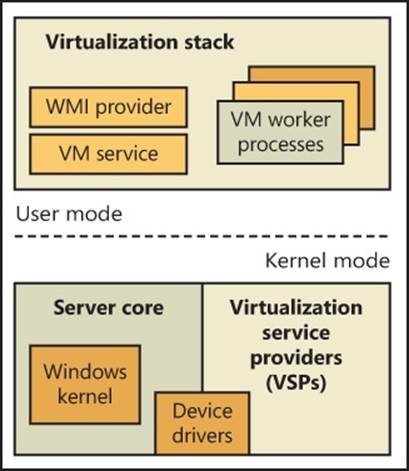
Figure 3-35. Components of a parent partition
Parent Partition Operating System
The Windows installation (typically the minimal footprint server installation, called Windows Server Core, to minimize resource usage) is responsible for providing the hypervisor and the device drivers for the hardware on the system (which the hypervisor will need to access), as well as for running the hypervisor stack. It is also the management point for all the child partitions.
Virtual Machine Manager Service and Worker Processes
The virtual machine management service (%SystemRoot%\System32\Vmms.exe) is responsible for providing the Windows Management Instrumentation (WMI) interface to the hypervisor, which allows managing the child partitions through a Microsoft Management Console (MMC) plug-in. It is also responsible for communicating requests to applications that need to communicate to the hypervisor or to child partitions. It controls settings such as which devices are visible to child partitions, how the memory and processor allocation for each partition is defined, and more.
The virtual machine worker processes (VMWPs), on the other hand, perform various virtualization work that a typical monolithic hypervisor would perform (similar to the work of a software-based virtualization solution). This means managing the state machine for a given child partition (to allow support for features such as snapshots and state transitions), responding to various notifications coming in from the hypervisor, performing the emulation of certain devices exposed to child partitions, and collaborating with the VM service and configuration component.
On a system with child partitions performing lots of I/O or privileged operations, you would expect most of the CPU usage to be visible in the parent partition: you can identify them by the name Vmwp.exe (one for each child partition). The worker process also includes components responsible for remote management of the virtualization stack, as well as an RDP component that allows using the remote desktop client to connect to any child partition and remotely view its user interface and interact with it.
Virtualization Service Providers
Virtualization service providers (VSPs) are responsible for the high-speed emulation of certain devices visible to child partitions (the exact difference between VSP-emulated devices and user-mode–process-emulated devices will be explained later), and unlike the VM service and processes, VSPs can also run in kernel mode as drivers. More detail on VSPs will follow in the section that describes device architecture in the virtualization stack.
VM Infrastructure Driver and Hypervisor API Library
Because the hypervisor cannot be directly accessed by user-mode applications, such as the VM service that is responsible for management, the virtualization stack must actually talk to a driver in kernel mode that is responsible for relaying the requests to the hypervisor. This is the job of the VM infrastructure driver (VID). The VID also provides support for certain low-memory memory devices, such as MMIO and ROM emulation.
A library located in kernel mode provides the actual interface to the hypervisor (called hypercalls). Messages can also come from child partitions (which will perform their own hypercalls), because there is only one hypervisor for the whole system and it can listen to messages coming from any partition. You can find this functionality in the Winhv.sys device driver.
Hypervisor
At the bottom of the architecture is the hypervisor itself, which registers itself with the processor at system boot-up time and provides its services for the stack to use (through the use of the hypercall interface). This early initialization is performed by the hvboot.sys driver, which is configured to start early on during a system boot. Because Intel and AMD processors have slightly differing implementations of hardware-assisted virtualization, there are actually two different hypervisors—the correct one is selected at boot-up time by querying the processor through CPUID instructions. On Intel systems, the Hvix64.exe binary is loaded, while on AMD systems, the Hvax64.exe image is used.
Child Partitions
The child partition, as discussed earlier, is an instance of any operating system running parallel to the parent partition. (Because you can save or pause the state of any child, it might not necessarily be running, but there will be a worker process for it.) Unlike the parent partition, which has full access to the APIC, I/O ports, and physical memory, child partitions are limited for security and management reasons to their own view of address space (the Guest Virtual Address Space, or GVA, which is managed by the hypervisor) and have no direct access to hardware. In terms of hypervisor access, it is also limited mainly to notifications and state changes. For example, a child partition doesn’t have control over other partitions (and can’t create new ones).
Child partitions have many fewer virtualization components than a parent partition because they are not responsible for running the virtualization stack—only for communicating with it. Also, these components can also be considered optional because they enhance performance of the environment but are not critical to its use. Figure 3-36 shows the components present in a typical Windows child partition.
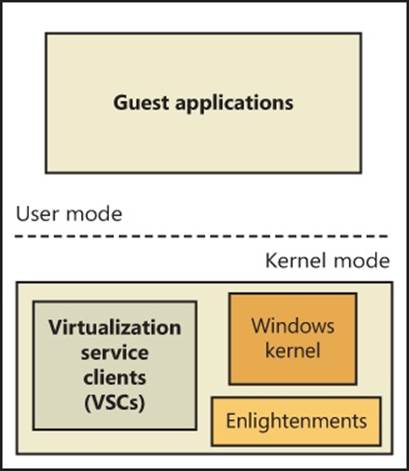
Figure 3-36. Components in a child partition
EXPERIMENT: EXAMINING CHILD PARTITIONS FROM THE PARENT WITH LIVEKD
With Sysinternals LiveKd, you can examine a Windows XP or higher virtual machine from the parent partition without having to boot the child operating system in debugging mode. First, specify the –hvl option to LiveKd, which has it list the IDs and names of active child partitions:
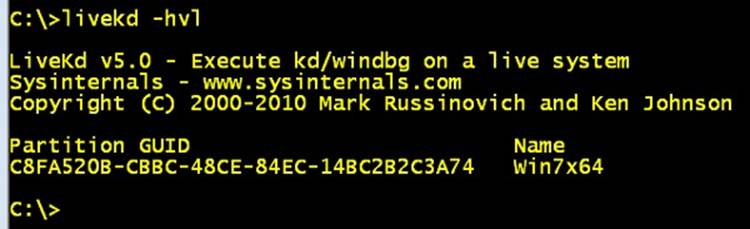
Then run LiveKd with the –hv switch and specify the ID or name of the child partition that you want to examine. Just as for debugging the local system with Livekd, the contents of the virtual machine’s memory can change as you execute LiveKd commands, resulting in LiveKd seeing inconsistencies caused by data reflecting different points in time. If you want LiveKd to see a consistent view, you can specify the –p option to have the child partition paused while LiveKd is running. All commands that work on a local system also work when you use LiveKd to explore a virtual machine. Here’s the partial output of the !vm kernel debugger command, which lists various memory-related statistics, when executed on a Hyper-V child partition:
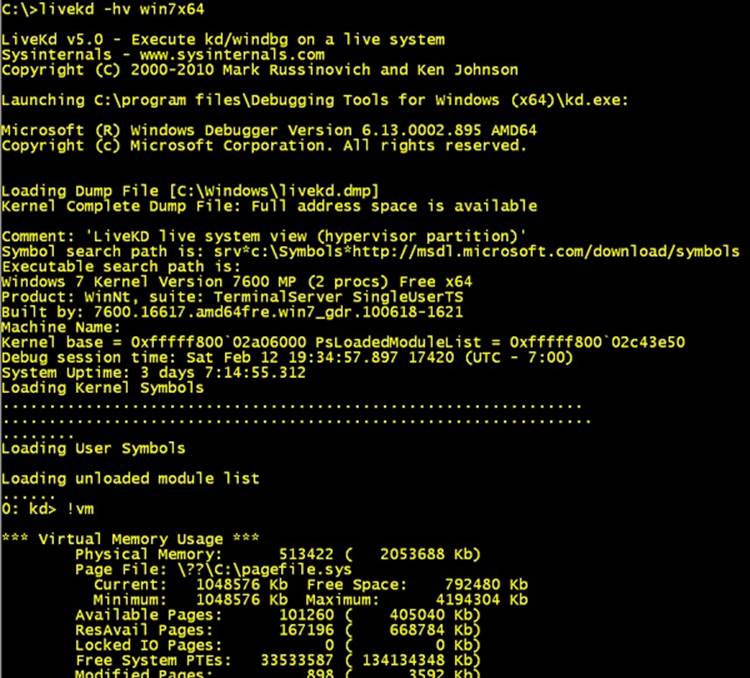
Virtualization Service Clients
Virtualization service clients (VSCs) are the child partition analogues of VSPs. Like VSPs, VSCs are used for device emulation, which is a topic of later discussion.
Enlightenments
Enlightenments are one of the key performance optimizations that Windows virtualization takes advantage of. They are direct modifications to the standard Windows kernel code that can detect that this operating system is running in a child partition and perform work differently. Usually, these optimizations are highly hardware-specific and result in a hypercall to notify the hypervisor. An example is notifying the hypervisor of a long busy-wait spin loop. The hypervisor can keep some state stale in this scenario instead of keeping track of the state at every single loop instruction. Entering and exiting an interrupt state can also be coordinated with the hypervisor, as well as access to the APIC, which can be enlightened to avoid trapping the real access and then virtualizing it.
Another example has to do with memory management, specifically TLB flushing and changing address space. (See Chapter 9 for more information on these concepts.) Usually, the operating system executes a CPU instruction to flush this information, which affects the entire processor. However, because a child partition could be sharing a CPU with many other child partitions, such an operation would also flush this information for those operating systems, resulting in noticeable performance degradation. If Windows is running under a hypervisor, it instead issues a hypercall to have the hypervisor flush only the specific information belonging to the child partition.
Hardware Emulation and Support
A virtualization solution must also provide optimized access to devices. Unfortunately, most devices aren’t made to accept multiple requests coming in from different operating systems. The hypervisor steps in by providing the same level of synchronization where possible and by emulating certain devices when real access to hardware cannot be permitted. In addition to devices, memory and processors must also be virtualized. Table 3-26 describes the three types of hardware that the hypervisor must manage.
Table 3-26. Virtualized Hardware
|
Component |
Managed By |
Usage |
|
Processor |
Hypervisor built-in scheduler and related microkernel components |
Manage usage of hardware’s processing power, share multiple processors across multiple child partitions, manage and switch processor states (such as registers). |
|
Memory |
Hypervisor built-in memory manager and related microkernel components |
Manage hardware’s RAM usage and availability. Protect memory from child partitions and parent partition. Provide a contiguous view of physical memory starting at address 0. |
|
Devices |
VM worker processes—hypervisor responsible only for interception and notification |
Provide hardware multiplexing so that multiple child partitions can access the same device on the physical machine. Optimize access to physical devices to be as fast as possible. |
Instead of exposing actual hardware to child partitions, the hypervisor exposes virtual devices (called VDevs). VDevs are packaged as COM components that run inside a VM worker process, and they are the central manageable object behind the device. (Usually, VDevs expose a WMI interface.) The Windows virtualization stack provides support for two kinds of virtual devices: emulated devices and synthetic devices (also called enlightened I/O). The former provide support for various devices that the operating systems on the child partition would expect to find, while the latter requires specific support from the guest operating system. On the other hand, synthetic devices provide a significant performance benefit by reducing CPU overhead.
Emulated Devices
Emulated devices work by presenting the child partition with a set of I/O ports, memory ranges, and interrupts that are being controlled and monitored by the hypervisor. When access to these resources is detected, the VM worker process eventually gets notified through the virtualization stack (shown earlier in Figure 3-34). The process then emulates whatever action is expected from the device and completes the request, going back through the hypervisor and then to the child partition. From this topological view alone, one can see that there is a definite loss in performance, without even considering that the software emulation of a hardware device is usually slow.
The need for emulated devices comes from the fact that the hypervisor needs to support nonhypervisor-aware operating systems, as well as the early installation steps of even Windows itself. During the boot process, the installer can’t simply load all the child partition’s required components (such as VSCs) to use synthetic devices, so a Windows installation will always use emulated devices (which is why installation will seem very slow, but once installed the operating system will run quite close to native speed). Emulated devices are also used for hardware that doesn’t require high-speed emulation and for which software emulation might even be faster. This includes items such as COM (serial) ports, parallel ports, or the motherboard itself.
NOTE
Hyper-V emulates an Intel i440BX motherboard, an S3 Trio video card, and an Intel 21140 NIC.
Synthetic Devices
Although emulated devices work adequately for 10-Mbit network connections, low-resolution VGA displays, and 16-bit sound cards, the operating systems and hardware that child partitions usually require in today’s usage scenarios require a lot more processing power, such as support for 1000-Mbit GbE connections; full-color, high-resolution 3D support; and high-speed access to storage devices. To support this kind of virtualized hardware access at an acceptable CPU usage level and virtualized throughput, the virtualization stack uses a variety of components to optimize device I/Os to their fullest (similar to kernel enlightenments). Three components are part of this support, and they all belong to what’s presented to the user as integration components or ICs:
§ Virtualization service providers (VSPs)
§ Virtualization service clients/consumers (VSCs)
§ VMBus
Figure 3-37 shows a diagram of how an enlightened, or synthetic storage I/O, is handled by the virtualization stack.
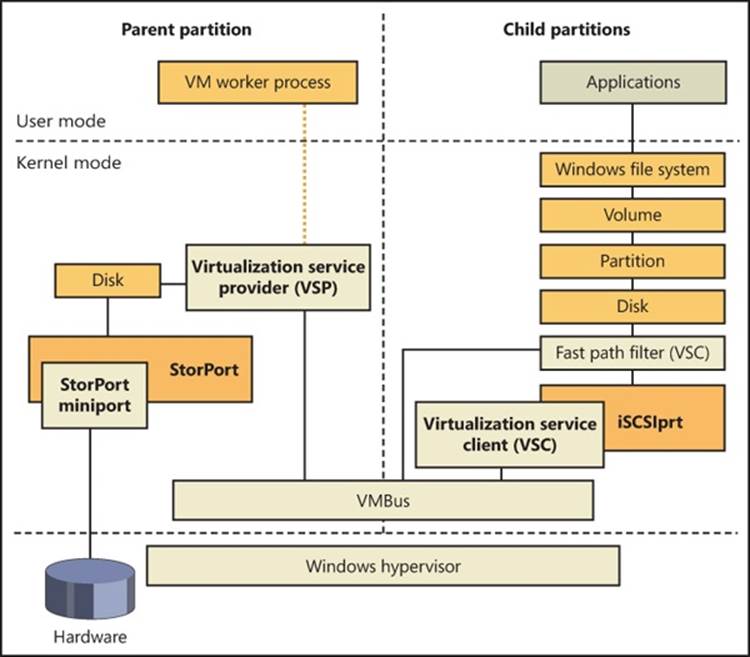
Figure 3-37. I/O handling paths in Hyper-V
As shown in Figure 3-37, VSPs run in the parent partition, where they are associated with a specific device that they are responsible for enlightening. (We’ll use that as a term instead of emulating when referring to synthetic devices.) VSCs reside in the child partition and are also associated with a specific device. Note, however, that the term provider can refer to multiple components spread across the device stack. For example, a VSP can be any of the following:
§ A user-mode service
§ A user-mode COM component
§ A kernel-mode driver
In all three cases, the VSP will be associated with the actual virtual device inside the VM worker process. VSCs, on the other hand, are almost always designed to be drivers sitting at the lowest level of the device stack (see Chapter 8 in Part 2 for more information on device stacks) and intercept I/Os to a device and redirect them through a more optimized path. The main optimization that is performed by this model is to avoid actual hardware access and use VMBus instead. Under this model, the hypervisor is unaware of the I/O, and the VSP redirects it directly to the parent partition’s kernel storage stack, avoiding a trip to user mode as well. Other VSPs can perform work directly on the device, by talking to the actual hardware and bypassing any driver that might have been loaded on the parent partition. Another option is to have a user-mode VSP, which can make sense when dealing with lower-bandwidth devices.
As described earlier, VMBus is the name of the bus transport used to optimize device access by implementing a communications protocol using hypervisor services. VMBus is a bus driver present on both the parent partition and the child partitions responsible for the Plug and Play enumeration of synthetic devices in a child. It also contains the optimized cross-partition messaging protocol that uses a transport method that is appropriate for the data size. One of these methods is to provide a shared ring buffer between each partition—essentially an area of memory on which a certain amount of data is loaded on one side and unloaded on the other side. No memory needs to be allocated or freed because the buffer is continuously reused and simply rotated. Eventually, it might become full with requests, which would mean that newer I/Os would overwrite older I/Os. In this uncommon scenario, VMBus simply delays newer requests until older ones complete. The other messaging transport is direct child memory mapping to the parent address space for large enough transfers.
Virtual Processors
Just as the hypervisor doesn’t allow direct access to hardware (or to memory, as you’ll see later), child partitions don’t really see the actual processors on the machine but have a virtualized view of CPUs as well. On the root machine, the administrator and the operating system deal with logical processors, which are the actual processors on which threads can run (for example, a dual quad-core machine has eight logical processors), and assign these processors to various child partitions. For example, one child partition could be scheduled on logical processors 1, 2, 3, and 4, while the second child partition is scheduled on processors 5, 6, 7, and 8. These operations are all made possible through the use of virtual processors, or VPs.
Because processors can be shared across multiple child partitions, the hypervisor includes its own scheduler that distributes the workload of the various partitions across each processor. Additionally, the hypervisor maintains the register state for each virtual processor and to an appropriate “processor switch” when the same logical processor is being used by another child partition. The parent partition has the ability to access all these contexts and modify them as required, an essential part of the virtualization stack that must respond to certain instructions and perform actions.
The hypervisor is also directly responsible for virtualizing processor APICs and providing a simpler, less-featured virtual APIC, including support for the timer that’s found on most APICs (however, at a slower rate). Because not all operating systems support APICs, the hypervisor also allows for the injection of interrupts through a hypercall, which permits the virtualization stack to emulate a standard i8059 PIC.
Finally, because Windows supports dynamic processor addition, an administrator can add new processors to a child partition at run time to increase the responsiveness of the guest operating systems if it’s under heavy load.
Memory Virtualization
The final piece of hardware that must be abstracted away from child partitions is memory, not only for the normal behavior of the guest operating systems, but also for security and stability. Improperly managing the child partitions’ access to memory could result in privacy disclosures and data corruption, as well as possible malicious attacks by “escaping” the child partition and attacking the parent (which would then allow attacks on the other child partitions). Apart from this aspect, there is also the matter of the guest operating system’s view of physical address space. Almost all operating systems expect memory to begin at address 0 and be somewhat contiguous, so simply assigning chunks of physical memory to each child partition wouldn’t work even if enough memory was available on the system.
To solve this problem, the hypervisor implements an address space called the guest physical address space (GPA space). The GPA starts at address 0, which satisfies the needs of operating systems inside child partitions. However, the GPA is not a simple mapping to a chunk of physical memory because of the second problem (the lack of contiguous memory). As such, GPAs can point to any location in the machine’s physical memory (which is called the system physical address space, or SPA space), and there must be a translation system to go from one address type to another. This translation system is maintained by the hypervisor and is nearly identical to the way virtual memory is mapped to physical memory on x86 and x64 processors. (See Chapter 10 in Part 2 for more information on the memory manager and address translation.)
As for actual virtual addresses in the child partition (which are called guest virtual address space—GVA space), these continue to be managed by the operating system without any change in behavior. What the operating system believes are real physical addresses in its own page tables are actually SPAs. Figure 3-38 shows an overview of the mapping between each level.
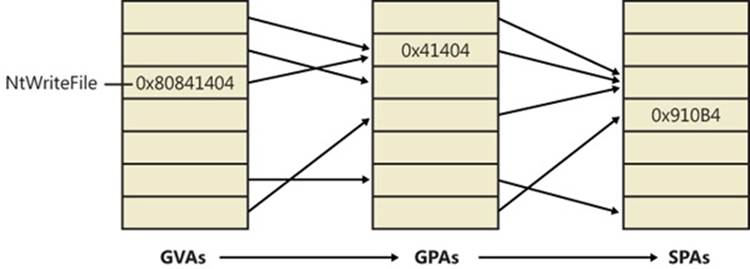
Figure 3-38. Guest virtual and physical address translation
This means that when a guest operating system boots up and creates the page tables to map virtual to physical memory, the hypervisor intercepts SPAs and keeps its own copy of the page tables. Conceptually, whenever a piece of code accesses a virtual address inside a guest operating system, the hypervisor does the initial page table translation to go from the guest virtual address to the GPA and then maps that GPA to the respective SPA. In reality, this operation is optimized through the use of shadow page tables (SPTs), which the hypervisor maintains to have direct GVA-to-SPA translations and simply loads when appropriate so that the guest accesses the SPA directly.
SECOND-LEVEL ADDRESS TRANSLATION AND TAGGED TLB
Because the translation from GVA to GPA to SPA is expensive (because it must be done in software), CPU manufacturers have worked to curtail this inefficiency by making the processor natively aware of the address translation requirements of a virtual machine—in other words, an advanced processor could understand that the memory access is occurring from a hosted virtual machine and perform the GVA-to-SPA lookup on its own, without requiring assistance from the hypervisor. This lookup technology is called Second-Level Address Translation (SLAT) because it covers both the target-to-host translation (second level) and the host VA–to–host PA translation (first level). For marketing purposes, however, Intel has called this support VT Extended/Nested Page Table (NPT) technology, while AMD calls it AMD-V Rapid Virtualization Indexing (RVI).
The latest version of the Hyper-V stack takes full advantage of this processor support, reducing the complexity of its code and minimizing the number of context switches required to handle page faults in hosted partitions. Additionally, SLAT enables Hyper-V to throw out its shadow page tables and relevant mappings, which allows an additional reduction of memory overhead as well. These changes increase the scalability of Hyper-V on such systems, notably leading to an increase in the maximum number of virtual machines that a single host (Hyper-V server) can serve, or run concurrently. According to tests performed by Microsoft, support for SLAT increases the maximum number of supported sessions between 1.6 and 2.5 times. Furthermore, the processor overhead drops from about 10 percent to 2 percent, and each virtual machine consumes one less megabyte of physical RAM on the host.
In addition, both Intel and AMD introduced a functionality that was typically found only on RISC processors such as ARM, MIPS, or PPC, which is the ability of the processor to differentiate between the processes associated with each cached virtual-to-physical translation entry in the translation look-aside buffer (TLB). On CISC processors such as the x86 and x64, the TLB was built as a systemwide resource—each time the operating system switched the currently executing process, the TLB had to be flushed to invalidate any cached entries that might’ve belonged to the previous executing process. If the processor, instead, could be told that the process has changed, the TLB would avoid a flush and the processor would simply not use the cached entries that did not correspond to this process. New entries would be created, eventually overriding other processes’ older entries. This type of smarter TLB is called a tagged TLB, because each cache entry is tagged with a per-process identifier.
Flushing the TLB is even worse when dealing with Hyper-V systems because a different process can actually correspond to a completely different VM. In other words, each time the hypervisor and operating system scheduled another VM for execution, the host’s TLB had to be flushed, flushing away all the cached translations the previous VM had performed, slowing down memory access, and causing significant latency. When running on a processor that implements a tagged TLB, the Hyper-V can simply notify the processor that a new process/VM is running and that the entries of other VM should not be used. AMD processors with RVI support tagged TLBs through an Address Space Identifier, or ASID, while recent Intel Nehalem-EX processors implement a tagged TLB by using a Virtual Processor Identifier (VPID).
DYNAMIC MEMORY
A feature called Dynamic Memory enables systems administrators to make a virtual machine’s physical memory allocation variable based on the memory demands of the active virtual machines, in much the same way that the Windows memory manager adjusts the physical memory assigned to each process based on their memory demands. The capability means that administrators do not have to precisely gauge the size of a virtual machine required for optimal performance and that the system’s physical memory is more effectively used by the virtual machines that need it.
Dynamic Memory’s architecture consists of several components, shown in Figure 3-39.
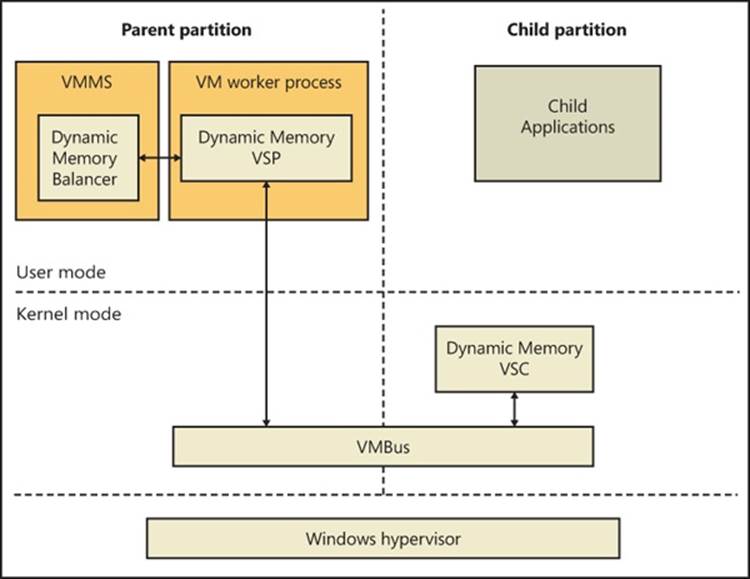
FIGURE 3-39. DYNAMIC MEMORY ARCHITECTURE
The principle components of the architecture are as follows:
§ The Dynamic Memory balancer, which is implemented in the virtual machine management service. The balancer is responsible for assigning physical memory to child partitions.
§ The Dynamic Memory VSP (DM VSP), which runs in the VMWPs of child partitions that have dynamic memory enabled.
§ The Dynamic Memory VSC (DM VSC, %SystemRoot%\System32\Drivers\Dmvsc.sys), installed as an enlightenment driver running in the child partitions.
To configure a VM for dynamic memory, an administrator chooses Dynamic in the VM’s memory settings as shown in Figure 3-40.
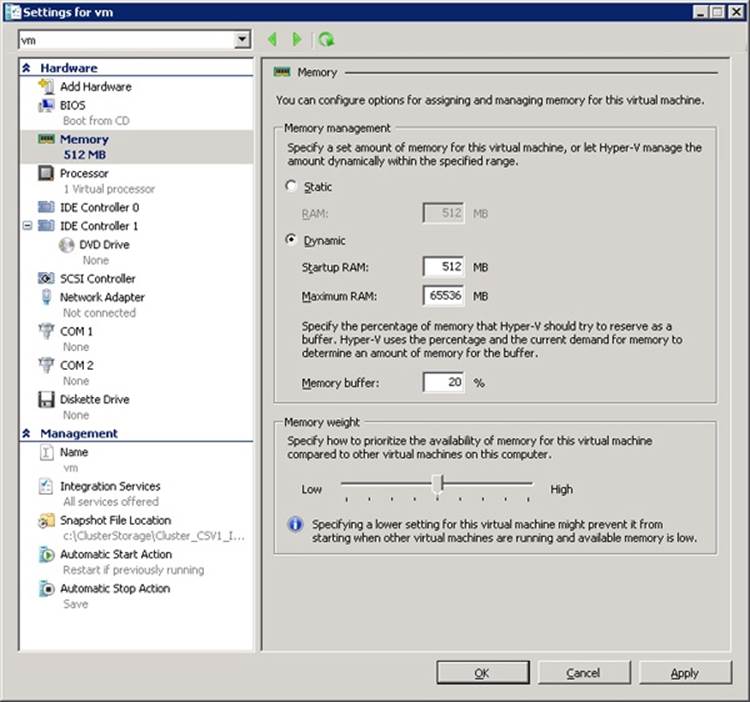
FIGURE 3-40. DYNAMIC MEMORY CONFIGURATION DIALOG
The associated settings include the amount of memory that will be assigned to the VM when it starts (Startup RAM), the maximum amount that it can be assigned (Maximum RAM), the percentage of the VM’s memory that should be available for immediate use by the operating system if its memory demand increases, and finally, the weight of the VM with respect to other VMs. In addition to serving as weighting for the distribution of physical memory among virtual machines that have dynamic memory enabled, the hypervisor also uses it as a guide for the startup order of virtual machines configured to start when the system boots. Finally, the available memory percentage is a reference to memory within the VM that the VM’s operating system has not assigned to a process, device drivers, or itself, and that can be assigned without incurring a page fault. Chapter 10 in Part 2 describes available memory in more detail.
When the DM VSC starts in a child partition that has dynamic memory enabled in its memory configuration, it first checks to see if the operating system supports dynamic memory capabilities. It performs this check by simply calling the memory manager’s hot-add memory function, specifying a block of child physical memory already assigned to the virtual machine. If the memory manager supports hot add, it returns an error indicating that the address range is already in use, and if it doesn’t, it reports that the function is not supported. If dynamic memory is supported, the DM VSC establishes a connection to the DM VSP via VMBus. Because the system’s memory usage fluctuates during the boot process, after all autostart Windows services have finished initializing, the VSC begins reporting memory statistics once per second that indicate the current system commit level in the virtual machine. (See Chapter 10 in Part 2 for more information on system commit.)
The DM VSP in the parent partition calculates a memory pressure value for its corresponding VM using the following calculation based on the VM’s memory report:
Memory Pressure = Committed Memory / Physical Memory
Physical Memory refers to the amount of memory currently assigned to the VM’s partition. It also keeps a running exponential average pressure that represents the previous 20 seconds of pressure reports, adjusting the average pressure only when the current pressure deviates from the average by at least a standard deviation.
A component called the balancer executes in the VMMS service. Once per second, it analyzes the memory pressures reported by the DM VSPs, considers VM policy configuration, and determines if and how much memory should be redistributed. If a global Hyper-V setting called NUMA spanning is enabled, the balancer uses two balancing engines: one engine is the global balancer, and it is responsible for assigning new VMs to NUMA nodes. It does so based on the memory usage and VM pressures of the nodes at the time of the assignment. Each NUMA node has its own local balancer that manages the distribution of the node’s memory across the VMs assigned to the node. If the NUMA spanning option is off, the global balancer has no role other than to invoke the only local balancer for the system.
The benefit of assigning VMs to NUMA nodes is that VMs will be guaranteed the fastest memory accesses possible. The tradeoff, however, is that it might not be possible to start or add memory to a VM in the case where the sum of unassigned memory is sufficient but no one node has enough available memory to accommodate the amount of memory requested.
A local balancer increases or decreases a global target memory pressure to use all available memory under its management or to use it until a minimum pressure level is reached that indicates all VMs have ample memory. The balancer then loops over the VMs, determining how much memory to add or remove from each VM to reach the target pressure. During the calculations, the balancer reserves a minimum amount of memory for the host. The host’s reservation is a base amount of approximately 400 MB plus 30 MB for each 1 GB of RAM on the system. Factors that can affect the amount of memory reserved include whether or not the system is using SLAT or software paging, and whether multimedia redirection is enabled. Every five minutes, the balancer also removes memory from VMs that have so much memory that their pressure is essentially zero.
Note that if the child partition’s operating system is running a 32-bit version of Windows, the dynamic memory engine will not assign the partition more than 4 GB of memory.
Once it has calculated the amounts of memory to add and remove from VMs, it asks each WP to perform the desired operation. If the operation is to remove memory, the WP signals the child DM VSC over VMBUS of the amount to remove and the DM VSC balloons its memory usage by allocating physical memory from the system using the MmAllocatePagesForMdlExfunction. It retrieves the allocated GPAs and sends that back to the WP, which passes them to the Hyper-V memory manager. The Hyper-V memory manager then converts the GPAs to SPAs and adds the memory to its free memory pool.
If it’s a memory add operation, the WP asks the Hyper-V memory manager first if the VM has any physical memory assigned to it but currently allocated by the VSC’s balloon. If it does, the WP retrieves the GPAs for an amount that should be unballooned and asks the VSC to free those pages, making them available again for use by the VM’s operating system. If the amount that can be released by unballooning falls short of the amount of physical memory the balancer wants to give the VM, it asks the Hyper-V memory manager to give the remaining amount from its free memory pool to the child partition via Windows support for hot-add memory and reports the GPAs it added to the WP, which in turn relays them to the child’s DM VSC.
EXPERIMENT: WATCHING DYNAMIC MEMORY
You can watch the behavior of Dynamic Memory by configuring Dynamic Memory for a VM running a 64-bit Dynamic Memory-compatible operating system, such as Windows 7 or Windows Server 2008 R2. Hyper-V exposes several Dynamic Memory–related performance counters under Hyper-V Dynamic Memory Balancer and Dynamic Memory VM. Counters include the amount of memory assigned to a guest, the guest operating system–visible memory (the amount of memory it thinks it has), its current and average memory pressure, and the amount of memory added and removed over time:
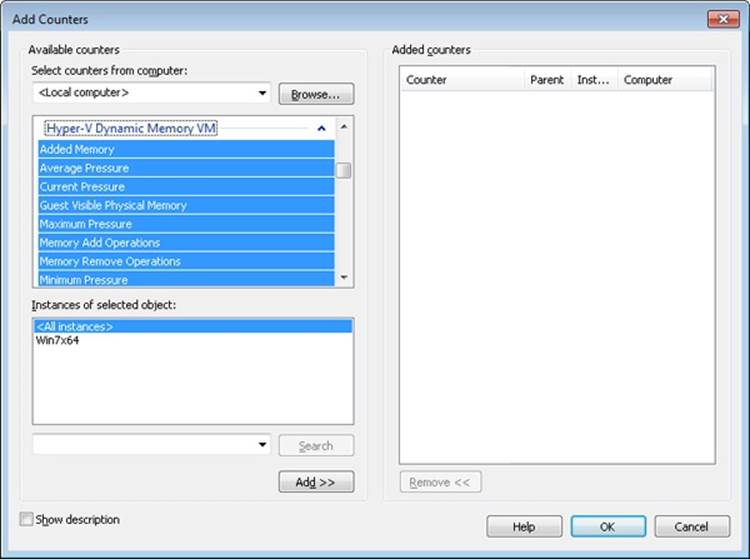
After freshly booting the virtual machine, add the Guest Visible Physical Memory and Physical Memory counters. Set the scale to three times the current Guest Visible Physical Memory value, which will be at least as large as the Physical Memory value. Then run the Sysinternals Testlimit tool in the virtual machine with the following commandline: testlimit -m 1000 -c 1
Assuming you have enough available physical memory on the system, this causes Testlimit to allocate about 1 GB of virtual memory, raising the memory pressure in the virtual machine. After a few seconds, you will see the guest visible and actual physical memory assigned to the virtual machine jump to the same value. Roughly 30 seconds later, you’ll see another jump when the balancer decides that the additional memory is not enough to completely relieve the memory pressure in the virtual machine and, because there’s more memory available on the host, gives the virtual machine some more.
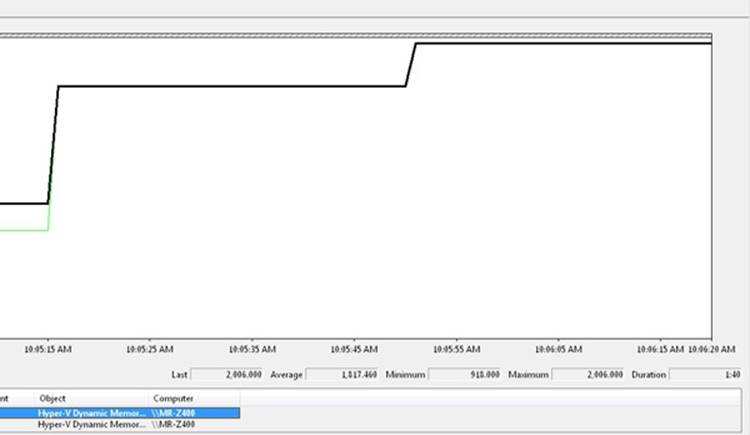
If you terminate Testlimit, the memory levels remain constant for several minutes if there’s no memory demands from the host or other virtual machines, but eventually the balancer will respond to the lack of memory pressure in the virtual machine by trimming memory. Note that the Guest Visible Physical Memory counter remains unchanged, but the Physical Memory counter drops back to a level near what it was before Testlimit executed:
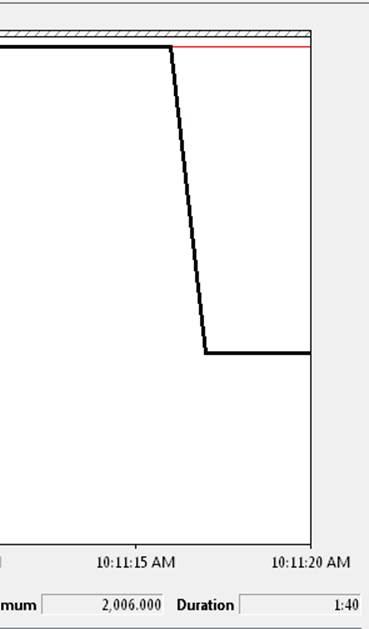
Intercepts
We’ve talked about the various ways in which access to hardware, processors, and memory is virtualized by the hypervisor and sometimes handed off to a VM worker process, but we haven’t yet talked about the mechanism that allows this to happen—intercepts. Intercepts are configurable hooks that a parent partition can install and configure in order to respond to. These can include the following items:
§ I/O intercepts, useful for device emulation
§ MSR intercepts, useful for APIC emulation and profiling
§ Access to GPAs, useful for device emulation, monitoring, and profiling (Additionally, the intercept can be fine-tuned to a specific access, such as read, write, or execute.)
§ Exception intercepts such as page faults, useful for maintaining machine state and memory emulation (for example, maintaining copy-on-write)
Once the hypervisor detects an event for which an intercept has been registered, it sends an intercept message through the virtualization stack and puts the VP in a suspended state. The virtualization stack (usually the worker process) must then handle the event and resume the VP (typically with a modified register state that reflects the work performed to handle the intercept).
Live Migration
To support scenarios such as planned hardware upgrades and resource load balancing across servers, Hyper-V includes support for migrating virtual machines between nodes of a Windows Failover Cluster with minimal downtime. The key to Live Migration’s efficiency is that the bulk of the transfer of the virtual machine’s memory from the source to the target occurs while the virtual machine continues to run on the source node; only when the memory transfer is complete does the virtual machine suspend and resume operating on the target node. This small window when final virtual machine state migrates is typically less than the default TCP timeout value, preserving open connections from clients using services of the virtual machine and making the migration transparent from their perspective. Figure 3-41 shows the Live Migration process.
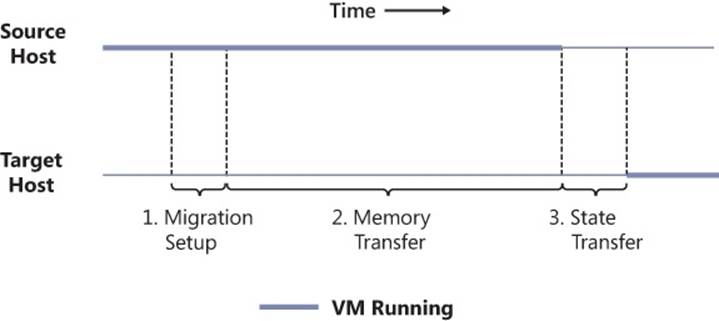
Figure 3-41. Live migration transfer steps
The Live Migration process proceeds in a number of steps, shown in Figure 3-41:
|
1. |
Migration Setup The VMMS of the hosting (source) node of the virtual machine opens a TCP connection with the destination host. It transfers the virtual machine’s configuration information, which includes virtual hardware specifications such as the number of processors and amount of RAM, to the destination. VMMS on the destination (target) node instantiates a paused virtual machine matching the configuration. The VMMS on the source notifies the virtual machine’s worker process that the live migration is ready to proceed and hands it the TCP connection. Likewise, the target VMMS hands its end of the connection to the target worker process. |
|
2. |
Memory Transfer The memory transfer phase consists of several subphases: 1. The source VMWP creates a bitmap with one bit representing each page of the virtual machine’s guest physical memory. It sets every bit to indicate that the page is dirty, which means that the page’s current contents have not yet been sent to the target. 2. The source VMWP registers a memory-change notification callback with the hypervisor that sets the corresponding bit in the bitmap for each page of the virtual machine that changes. 3. The source VMWP proceeds to walk through the dirty-page bitmap in 16-KB blocks, clearing the dirty bits in the dirty-page bitmap for the pages in the block, reading each dirty page’s contents via a hypervisor call, and sending the contents to the target. The target VMWP invokes the hypervisor to inject the memory contents into the target virtual machine’s guest physical memory. 4. When it’s finished iterating over the dirty-page bitmap, the source VMWP checks to see if any pages have been dirtied during the iteration. If not, it moves to the next phase of the migration, but if any pages have been dirtied, it repeats the iteration. If it’s iterated five times, the virtual machine is dirtying memory faster than the worker process can send modifications, so it proceeds to the next phase of the migration. |
|
5. |
State Transfer The source VMWP suspends the virtual machine and makes a final iteration through the dirty-page bitmap to send over any pages that were dirtied since the last pass. Because the virtual machine is suspended during the transfer, no more pages will be dirtied. Then the source worker process sends the virtual machine’s state, including the contents of the virtual processor registers. Finally, it notifies VMMS that the migration is complete, waits for acknowledgement, and then sends a message to the target transferring ownership of the virtual machine. As the last migration step, the target worker process moves the virtual machine to the running state. |
|
6. |
Another aspect of Live Migration is the transfer of ownership of the virtual machine’s files, including its VHDs. Traditional Windows Clustering is a shared-nothing model, where each LUN of the cluster’s storage system is owned by one node at a time. The LUN’s owning node has sole access to the LUN and any files stored on it. This model can lead to management complexity because each virtual machine must be stored on a separate LUN and therefore a separate volume, causing an explosion of volumes in a cluster hosting many virtual machines. It poses an even more significant challenge for Live Migration because LUN ownership transfer is an expensive operation, consisting of the source node flushing any modified file data to the LUN, the source node unmounting the volumes formatted on the LUN, ownership transfer from the source node to target node, and the target node mounting the volumes. Depending on the number of volumes on the LUN and the amount of dirty data that needs to be written back, the entire sequence can take tens of seconds, which would prevent Live Migration from meeting its goal of perceived nearly-instantaneous migrations. |
|
7. |
To address the limitations of the traditional clustering model and make Live Migration possible, Live Migration leverages a storage feature called Clustered Shared Volumes (CSV). With CSV, one node owns the namespace of the volumes on a LUN while others can have exclusive ownership of individual files. Exclusive ownership permits the node hosting the virtual machine to directly access the on-disk storage of the VHD file, bypassing the network file system accesses normally required to interact with a LUN owned by another node. Only when a node wants to create or delete files, change the size of files (for example, to extend the size of a dynamic or differencing VHD), or change other file metadata such as timestamps does it need to send a request via the SMB2 protocol to the owning node if it’s not the owner. |
|
8. |
The hybrid sharing model of CSV enables LUN ownership to remain unchanged during Live Migration and enables only ownership of individual migrating virtual machine’s file to change, avoiding the unmounts and mount operations. Also, only dirty data specific to the virtual machine files must be written before the migration, something that can typically happen concurrently with the memory migration. Figure 3-42 depicts the storage ownership changes during a Live Migration. CSV’s implementation is described in the “File System Filter Drivers” section of Chapter 12, “File Systems,” in Part 2. |
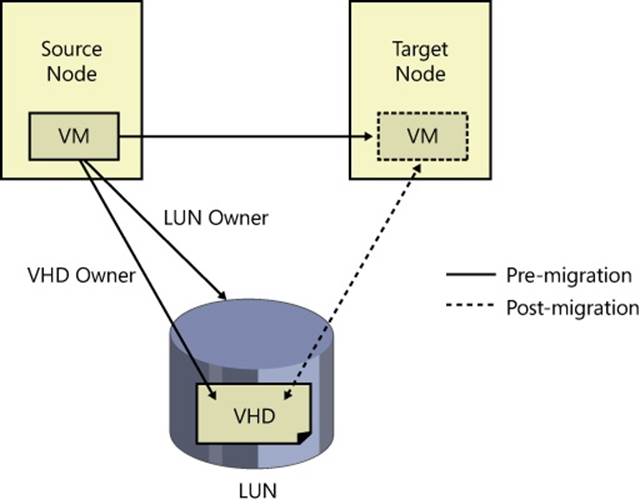
Figure 3-42. Clustered Shared Volumes in Live Migration
Kernel Transaction Manager
One of the more tedious aspects of software development is handling error conditions. This is especially true if, in the course of performing a high-level operation, an application has completed one or more subtasks that result in changes to the file system or registry. For example, an application’s software updating service might make several registry updates, replace one of the application’s executables, and then be denied access when it attempts to update a second executable. If the service doesn’t want to leave the application in the resulting inconsistent state, it must track all the changes it makes and be prepared to undo them. Testing the error-recovery code is difficult, and consequently often skipped, so errors in the recovery code can negate the effort.
Applications can, with very little effort, gain automatic error-recovery capabilities by using a kernel mechanism called the Kernel Transaction Manager (KTM), which provides the facilities required to perform such transactions and enables services such as the distributed transaction coordinator (DTC) in user mode to take advantage of them. Any developer who uses the appropriate APIs can take advantage of these services as well.
KTM does more than solve large-scale issues like the one presented. Even on single-user home computers, installing a service patch or performing a system restore are large operations that involve both files and registry keys. Unplug an older Windows computer during such an operation, and the chances for a successful boot are slim. Even though the NT File System (NTFS) has always had a log file permitting the file system to guarantee atomic operations (see Chapter 12 in Part 2 for more information on NTFS), this only means that whichever file was being written to during the process will get fully written or fully deleted—it does not guarantee the entire update or restore operation. Likewise, the registry has had numerous improvements over the years to deal with corruption (see Chapter 4 for more information on the registry), but the fixes apply only at the key/value level.
As the heart of transaction support, KTM allows transactional resource managers such as NTFS and the registry to coordinate their updates for a specific set of changes made by an application. NTFS uses an extension to support transactions, called TxF. The registry uses a similar extension, called TxR. These kernel-mode resource managers work with KTM to coordinate the transaction state, just as user-mode resource managers use DTC to coordinate transaction state across multiple user-mode resource managers. Third parties can also use KTM to implement their own resource managers.
TxF and TxR both define a new set of file system and registry APIs that are similar to existing ones, except that they include a transaction parameter. If an application wants to create a file within a transaction, it first uses KTM to create the transaction, and then it passes the resulting transaction handle to the new file creation API. Although we’ll look at the registry and NTFS implementations of KTM later, these are not its only possible uses. In fact, it provides four system objects that allow a variety of operations to be supported. These are listed in Table 3-27.
Table 3-27. KTM Objects
|
Object |
Meaning |
Usage |
|
Transaction |
Collection of data operations to be performed. Provides atomic, consistent, isolated, and durable operations. |
Can be associated with the registry and file I/O to make those operations part of the same larger operation. |
|
Enlistment |
Association between a resource manager and a transaction. |
Register with a transaction to receive notifications on it. The enlistment can specify which notifications should be generated. |
|
Resource Manager (RM) |
Container for the transactions and the data on which they operate. |
Provides an interface for clients to read and write the data, typically on a database. |
|
Transaction Manager (TM) |
Container of all transactions that are part of the associated resource managers. As an instance of a log, it knows about all transaction states but not their data. |
Provides an infrastructure through which clients and resource managers can communicate, and provides and coordinates recovery operations after a crash. Clients use the TM for transactions; RMs use the TM for enlistments. |
EXPERIMENT: LISTING TRANSACTION MANAGERS
Windows ships with a built-in tool called Ktmutil.exe that allows you to see ongoing transactions as well as registered transaction managers on the system (and force the outcome of ongoing transactions). In this experiment, you’ll use it to display the transaction managers typically seen on a Windows machine.
Start an elevated command prompt and type:
Ktmutil.exe tm list
Here’s an example of output on a typical Windows system:
C:\Windows\system32>ktmutil tm list
TmGuid TmLogPath
-------------------------------------- -----------------------------------------
{fef0dc5f-0392-11de-979f-002219dd8c25} \Device\HarddiskVolume2\$Extend\$RmMetadata\$TxfLog
\$TxfLog::KtmLog
{fef0dc63-0392-11de-979f-002219dd8c25} \Device\HarddiskVolume1\$Extend\$RmMetadata\$TxfLog
\$TxfLog::KtmLog
{5e68e4aa-129e-11e0-8635-806e6f6e6963} \Device\HarddiskVolume2\Windows\ServiceProfiles\
NetworkService\ntuser.dat{5e68e4a8-129e-11e0-8635-806e6f6e6963}.TM
{5e68e4ae-129e-11e0-8635-005056c00008} \Device\HarddiskVolume2\Windows\ServiceProfiles\
LocalService\ntuser.dat{5e68e4ac-129e-11e0-8635-005056c00008}.TM
{51ce23c9-0d6c-11e0-8afb-806e6f6e6963} \SystemRoot\System32\Config\TxR\{51ce23c7-0d6c-
11e0-8afb-806e6f6e6963}.TM
{51ce23ee-0d6c-11e0-8afb-005056c00008} \Device\HarddiskVolume2\Users\markruss\ntuser.
dat{51ce23ec-0d6c-11e0-8afb-005056c00008}.TM
{51ce23f2-0d6c-11e0-8afb-005056c00008} \Device\HarddiskVolume2\Users\markruss\AppData\
Local\Microsoft\Windows\UsrClass.dat{51ce23f0-0d6c-11e0-8afb-005056c00008}.TM
Hotpatch Support
Rebooting a machine to apply the latest patches can mean significant downtime for a server, which is why Windows supports a run-time method of patching, called a hot patch (or simply hotpatch), in contrast to a cold patch, which requires a reboot. Hotpatching doesn’t simply allow files to be overwritten during execution; instead, it includes a complex series of operations that can be requested (and combined). These operations are listed in Table 3-28.
Table 3-28. Hotpatch Operations
|
Operation |
Meaning |
Usage |
|
Rename Image |
Replacing a DLL that is on the disk and currently used by other applications, or replacing a driver that is on the disk and is currently loaded by the kernel |
When an entire library in user mode needs to be replaced, the kernel can detect which processes and services are referencing it, unload them, and then update the DLL and restart the programs and services (which is done through therestart manager). When a driver needs to be replaced, the kernel can unload the driver (the driver requires an unload routine), update it, and then reload it. |
|
Object Swap |
Atomically renaming an object in the object directory namespace |
When a file (typically a known DLL) needs to be renamed atomically but not affect any process that might be using it (so that the process can start using the new file immediately, using the old handle, without requiring an application restart). |
|
Patch Function Code |
Replacing the code of one or more functions inside an image file with another version |
If a DLL or driver can’t be replaced or renamed during run time, functions in the image can be directly patched. A hotpatch DLL that contains the newer code is jumped to whenever an older function is called. |
|
Refresh System DLL |
Reload the memory mapped section object for Ntdll.dll |
The system native library, Ntdll.dll, is loaded only once during boot-up and then simply duplicated into the address space of every new process. If it has been hotpatched, the system must refresh this section to load the newer version. |
Although hotpatches use internal kernel mechanisms, their actual implementation is no different from cold patches. The patch is delivered through Windows Update, typically as an executable file containing a program called Update.exe that performs the extraction of the patch and the update process. For hotpatches, however, an additional hotpatch file, containing the .hp extension, will be present. This file contains a special PE header called .HOT1. This header contains a data structure describing the various patch descriptors present inside the file. Each of these descriptors identifies the offset in the original file that needs to be patched, a validation mechanism (which can include a simple comparison of the old data, a checksum, or a hash), and the new data to be patched. The kernel parses the descriptors and applies the appropriate modifications. In the case of a protected process (see Chapter 5 for more information on processes) and other digitally signed images, the hotpatch must also be digitally signed in order to prevent fake patches from being applied to sensitive files or processes.
NOTE
Because the hotpatch file also includes the original data, the hotpatching mechanism can also be used to uninstall a patch at run time.
Compile-time hotpatching support works by adding 7 additional bytes to the beginning of each function—4 are considered part of the end of the previous function, and 2 are part of the function prolog—that is, the function’s beginning. Here’s an example of a function that was built with hotpatching information:
lkd> u nt!NtCreateFile - 5
nt!FsRtlTeardownPerFileContexts+0x169:
82227ea5 90 nop
82227ea6 90 nop
82227ea7 90 nop
82227ea8 90 nop
82227ea9 90 nop
nt!NtCreateFile:
82227eaa 8bff mov edi,edi
Notice that the five nop instructions don’t actually do anything, while the mov edi, edi at the beginning of the NtCreateFile function are also essentially meaningless—no actual state-changing operation takes place. Because 7 bytes are available, the NtCreateFile prologue can be transformed into a short jump to the buffer of five instructions available, which are then converted to a near jump instruction to the patched routine. Here’s NtCreateFile after having been hotpatched:
lkd> u nt!NtCreateFile - 5
nt!FsRtlTeardownPerFileContexts+0x169:
82227ea5 e93d020010 jmp nt_patch!NtCreateFile (922280e7)
nt!NtCreateFile:
82227eaa ebfc jmp nt!FsRtlTeardownPerFileContexts+0x169 (82227ea5)
This method allows only the addition of 2 bytes to each function by jumping into the previous function’s alignment padding that it would most likely have at its end anyway.
There are some limitations to the hotpatching functionality:
§ Patches that third-party applications such as security software might block or that might be incompatible with the operation of third-party applications
§ Patches that modify a file’s export table or import table
§ Patches that change data structures, fix infinite loops, or contain inline assembly code
Kernel Patch Protection
Some 32-bit device drivers modify the behavior of Windows in unsupported ways. For example, they patch the system call table to intercept system calls or patch the kernel image in memory to add functionality to specific internal functions. Shortly after the release of 64-bit Windows for x64 and before a rich third-party ecosystem had developed, Microsoft saw an opportunity to preserve the stability of 64-bit Windows. To prevent these kinds of changes, x64 Windows implements Kernel Patch Protection (KPP), also referred to as PatchGuard. KPP’s job on the system is similar to what its name implies—it attempts to deter common techniques for patching the system, or hooking it. Table 3-29 lists which components or structures are protected and for what purpose.
Table 3-29. Components Protected by KPP
|
Component |
Legitimate Usage |
Potential Malicious Usage |
|
Ntoskrnl.exe, Hal.dll, Ci.dll, Kdcom.dll, Pshed.dll, Clfs.sys, Ndis.sys, Tcpip.sys |
Kernel, HAL, and their dependencies. Lower layer of network stack. |
Patching code in the kernel and/or HAL to subvert normal operation and behavior. Patching Ndis.sys to silently add back doors on open ports. |
|
Global Descriptor Table (GDT) |
CPU hardware protection for the implementation of ring privilege levels (Ring 0 vs. Ring 3). |
Ability to set up a callgate, a CPU mechanism through which user (Ring 3) code could perform operations with kernel privileges (Ring 0). |
|
Interrupt Descriptor Table (IDT) |
Table read by the CPU to deliver interrupt vectors to the correct handling routine. |
Malicious drivers could intercept file I/Os directly at the interrupt level, or hook page faults to hide contents of memory. Rootkits could hook the INT2E handler to hook all system calls from a single point. |
|
System Service Descriptor Table (SSDT) |
Table containing the array of pointers for each system call handler. |
Rootkits could modify the output or input of calls from user mode and hide processes, files, or registry keys. |
|
Processor Machine State Registers (MSRs) |
LSTAR MSR is used to set the handler of the SYSENTER and/or SYSCALL instructions used for system calls. |
LSTAR could be overwritten by a malicious driver to provide a single hook for all system calls performed on the system. |
|
KdpStub, KiDebugRoutine, KdpTrap function pointers |
Used for run-time configuration of where exceptions should be delivered, based on whether a kernel debugger is remotely connected to the machine. |
Value of the pointers could be overwritten by a malicious rootkit to take control of the system at predetermined times and perform invisible background tasks. |
|
PsInvertedFunctionTable |
Cache of exception directories used on x64, allowing quick mapping between code where an exception happened and its handler. |
Could be used to take control of the system during the exception handling of unrelated system code, including KPP’s own exception code responsible for detecting modifications in the first place. |
|
Kernel stacks |
Store function arguments, the call stack (where a function should return), and variables. |
A driver could allocate memory on the side, set it as a kernel stack for a thread, and then manipulate its contents to redirect calls and parameters. |
|
Object types |
Definitions for the various objects (such as processes and files) that the system supports through the object manager. |
Could be used as part of a technique called DKOM (Direct Kernel Object Modification) to modify system behavior—for example, by hooking the object callbacks that each object type has registered. |
|
Other |
Code related to bug-checking the system during a KPP violation, executing the DPCs and timers associated with KPP, and more. |
By modifying certain parts of the system used by KPP, malicious drivers could attempt to silence, ignore, or otherwise cripple KPP. |
NOTE
Because certain 64-bit Intel processors implement a slightly different feature set of the x64 architecture, the kernel needs to perform run-time code patching to work around the lack of a prefetch instruction. KPP can deter kernel patching even on these processors, by exempting those specific patches from detection. Additionally, because of hypervisor (Hyper-V) enlightenments (more information on the hypervisor is provided earlier in this chapter), certain functions in the kernel are patched at boot time, such as the swap context routine. These patches are also allowed by very explicit checks to make sure they are known patches to the hypervisor-enlightened versions.
When KPP detects a change in any of the structures mentioned (as well as some other internal consistency checks), it crashes the system with code 0x109—CRITICAL_STRUCTURE_CORRUPTION.
For third-party developers who used techniques that KPP deters, the following supported techniques can be used:
§ File system minifilters (see Chapter 8 in Part 2 for more information on these) to hook all file operations, including loading image files and DLLs, that can be intercepted to purge malicious code on-the-fly or block reading of known bad executables.
§ Registry filter notifications (see Chapter 4 for more information on these notifications) to hook all registry operations. Security software can block modification of critical parts of the registry, as well as heuristically determine malicious software by registry access patterns or known bad registry keys.
§ Process notifications (see Chapter 5 for more information on these notifications). Security software can monitor the execution and termination of all processes and threads on the system, as well as DLLs being loaded or unloaded. With the enhanced notifications added for antivirus and other security vendors, they also have the ability to block process launch.
§ Object manager filtering (explained in the object manager section earlier). Security software can remove certain access rights being granted to processes and/or threads to defend their own utilities against certain operations.
There is no way to disable KPP once it’s enabled. Because device driver developers might need to make changes to a running system as part of debugging, KPP does not enable if the system boots in debugging mode with an active kernel-debugging connection.
Code Integrity
Code integrity is a Windows mechanism that authenticates the integrity and source of executable images (such as applications, DLLs, or drivers) by validating a digital certificate contained within the image’s resources. This mechanism works in conjunction with system policies, defining how signing should be enforced. One of these policies is the Kernel Mode Code Signing (KMCS) policy, which requires that kernel-mode code be signed with a valid Authenticode certificate rooted by one of several recognized code signing authorities, such as Verisign or Thawte.
To address backward-compatibility concerns, the KMCS policy is only fully enforced on 64-bit machines, because those drivers have to be recompiled recently in order to run on that Windows architecture. This, in turn, implies that a company or individual is still responsible for maintaining the driver and is able to sign it. On 32-bit machines, however, many older devices ship with outdated drivers, possibly from out-of-business companies, so signing those drivers would sometimes be unfeasible. Figure 3-43 shows the warning displayed on 64-bit Windows machines that attempt to load an unsigned driver.
NOTE
Windows also has a second driver-signing policy, which is part of the Plug and Play manager. This policy is applied solely to Plug and Play drivers, and unlike the kernel-mode code-signing policy, it can be configured to allow unsigned Plug and Play drivers (but not on 64-bit systems, where the KMCS policy takes precedence). See Chapter 8 in Part 2 for more information on the Plug and Play manager.
Figure 3-43. Warning when attempting to install an unsigned 64-bit driver
Even on 32-bit Windows, code integrity writes an event to the Code Integrity event log when it loads an unsigned driver.
NOTE
Protected Media Path applications can also query the kernel for its integrity state, which includes information on whether or not unsigned 32-bit drivers are loaded on the system. In such scenarios, they are allowed to disable protected, high-definition media playback as a method to ensure the security and reliability of the encrypted stream.
The code-integrity mechanism doesn’t stop at driver load time, however. Stronger measures also exist to authenticate per-page image contents for executable pages. This requires using a special flag while signing the driver binary and will generate a catalog with the cryptographic hash of every executable page on which the driver will reside. (Pages are a unit of protection on the CPU; for more information, see Chapter 10 in Part 2.) This method allows for detection of modification of an existing driver, which might happen either at run time by another driver or through a page file or hibernation file attack (in which the contents of memory are edited on the disk and then reloaded into memory). Generating such per-page hashes is also a requirement for the new filtering model, as well as Protected Media Path components.
Conclusion
In this chapter, we examined the key base system mechanisms on which the Windows executive is built. In the next chapter, we’ll look at three important mechanisms involved with the management infrastructure of Windows: the registry, services, and Windows Management Instrumentation (WMI).
All materials on the site are licensed Creative Commons Attribution-Sharealike 3.0 Unported CC BY-SA 3.0 & GNU Free Documentation License (GFDL)
If you are the copyright holder of any material contained on our site and intend to remove it, please contact our site administrator for approval.
© 2016-2026 All site design rights belong to S.Y.A.