Microsoft Office 2016 At Work For Dummies (2016)
Chapter 11
Creating Charts in Excel
In This Chapter
![]() Creating a chart
Creating a chart
![]() Moving and resizing a chart
Moving and resizing a chart
![]() Switching rows and columns
Switching rows and columns
![]() Modifying the data range for a chart
Modifying the data range for a chart
![]() Changing the axis scale
Changing the axis scale
![]() Applying a chart style
Applying a chart style
![]() Changing a chart’s colors
Changing a chart’s colors
![]() Adding, removing, and formatting chart elements
Adding, removing, and formatting chart elements
Is a picture really worth a thousand words? Just ask anyone who has been faced with a spreadsheet full of numbers to analyze. Creating charts that summarize data is a quick way to make sense of data — or to present data to someone else.
In this lesson, you learn how to create several types of charts and how to add and remove chart elements such as legends, data labels, and data tables. You learn how to move and resize charts, how to place a chart on its own separate tab in a workbook, and how to apply a variety of formatting to a chart.
Choose the correct chart type
Excel offers various chart types, each suited for a different type of data analysis. Here are some things to note about Excel’s chart types:
![]() Pie charts are good for situations in which the relationship among the values being charted is the most significant thing. For example, suppose Bill sold 15 cars, Dave sold 7, and Tom sold 8. If the important thing is that Bill sold 50 percent of all the cars, a pie chart is ideal. Pie charts are limited in that they can handle only one data series.
Pie charts are good for situations in which the relationship among the values being charted is the most significant thing. For example, suppose Bill sold 15 cars, Dave sold 7, and Tom sold 8. If the important thing is that Bill sold 50 percent of all the cars, a pie chart is ideal. Pie charts are limited in that they can handle only one data series.
![]() The key that tells what each color represents is called a legend.
The key that tells what each color represents is called a legend.
![]() A column chart is good for showing multiple data series on a two-axis grid. This particular sub-type is called a clustered column chart; each data point has its own bar, and the bars are clustered together into groups.
A column chart is good for showing multiple data series on a two-axis grid. This particular sub-type is called a clustered column chart; each data point has its own bar, and the bars are clustered together into groups.
![]() When a column chart is horizontal, it’s called a bar chart.
When a column chart is horizontal, it’s called a bar chart.
![]() The sub-type shown here is called a stacked chart; instead of having a separate bar for each month, it combines all three months in a single bar. This makes it easier to see their cumulative value.
The sub-type shown here is called a stacked chart; instead of having a separate bar for each month, it combines all three months in a single bar. This makes it easier to see their cumulative value.
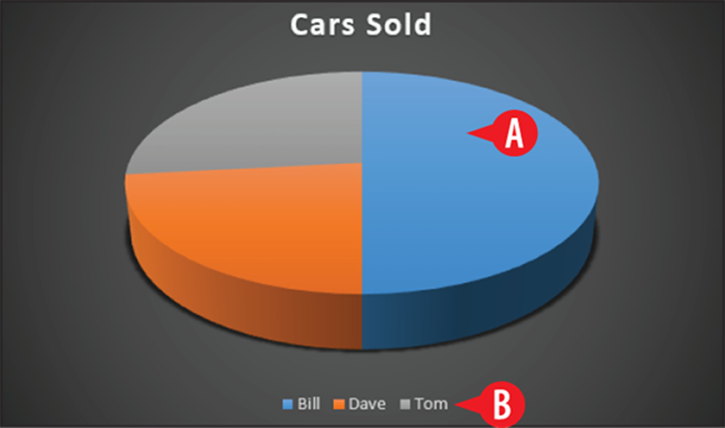
Figure 11-1: A pie chart shows the relationship of each data point to the whole.
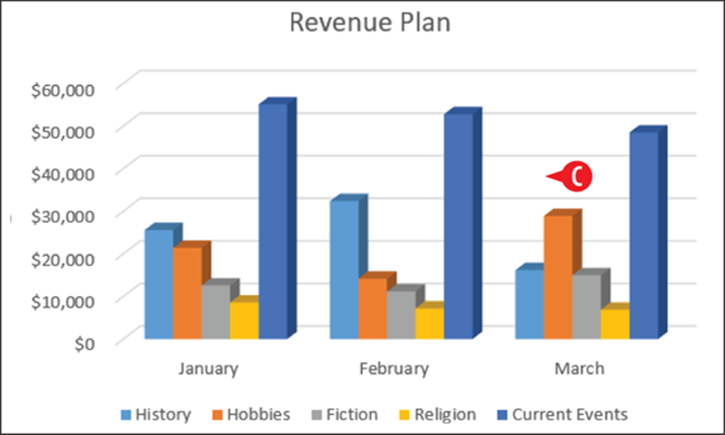
Figure 11-2: A column chart summarizes multiple data series.
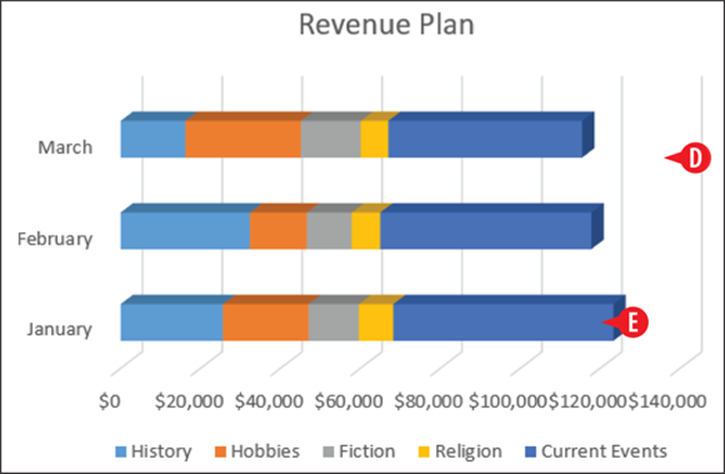
Figure 11-3: A bar chart is a horizontal version of a column chart.
A few of the other chart types available include:
· XY (Scatter): Plots each data point as a small dot on a two-dimensional (XY) grid, like in geometry class
· Stock: Plots the high, low, open, and close price of a stock on a particular day or range of dates
· Line: Plots each data point as a small dot, and then connects the dots of each series with a different color of line
· Area: Like a line chart, except the area beneath each line is filled in solid with color
· Surface: Like an area chart only three-dimensional
There are many other types, and you might want to explore them on your own. For the rest of this chapter, though, I stick with the basic column and pie charts for the examples.
Create a chart
Here’s how to create a chart:
![]() Select the data to include. Make sure you include any labels that go with that data too. The labels will become label text on the chart.
Select the data to include. Make sure you include any labels that go with that data too. The labels will become label text on the chart.
 To select noncontiguous cells, hold down Ctrl as you drag across them. For example, if the labels aren’t contiguous with the data you want to include, you might need to use Ctrl to select the labels.
If there are total rows or columns in your data, don’t include them in your selection in step 1 unless you are only charting the total row or column. (See ![]() in Figure 11-4.)
in Figure 11-4.)
![]() On the Insert tab, in the Charts group, click the button for the chart type you want. You can change the chart type later if you change your mind.
On the Insert tab, in the Charts group, click the button for the chart type you want. You can change the chart type later if you change your mind.
![]() On the menu that appears, click the desired sub-type.
On the menu that appears, click the desired sub-type.
A preview of the chart appears behind the menu as you move the mouse pointer over the various sub-types.
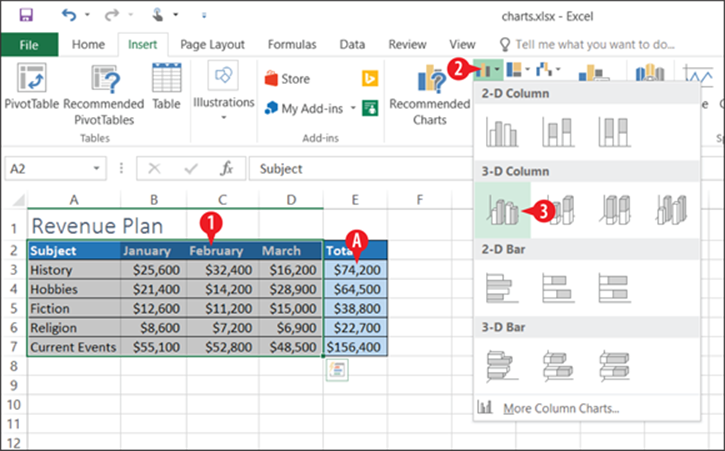
Figure 11-4: Click a chart type, and then choose a sub-type.
Move and resize a chart
After creating a chart, you can move it around on the worksheet or resize it by dragging it:
![]() Position the mouse pointer over any part of the chart except a selection handle, so that the pointer becomes a four-headed arrow, and drag it where you want it.
Position the mouse pointer over any part of the chart except a selection handle, so that the pointer becomes a four-headed arrow, and drag it where you want it.
![]() To resize a chart, drag one of the selection handles (white circles) on its border.
To resize a chart, drag one of the selection handles (white circles) on its border.
Resizing a chart may change its aspect ratio (its ratio of height to width), and the chart may stretch or compress as you drag.
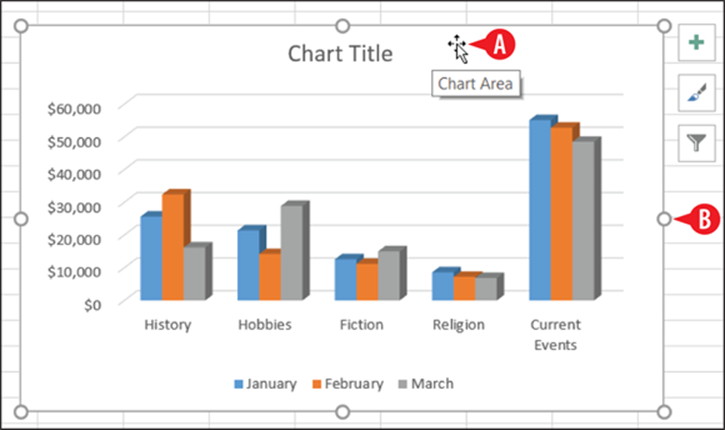
Figure 11-5: Drag a chart to move or resize it.
You can also place a chart on its own separate sheet in the workbook. Here’s how to do that:
![]() Select the chart.
Select the chart.
![]() On the Chart Tools Design tab, click Move Chart.
On the Chart Tools Design tab, click Move Chart.
![]() Click New Sheet.
Click New Sheet.
![]() (Optional) Change the sheet name if desired.
(Optional) Change the sheet name if desired.
![]() Click OK.
Click OK.
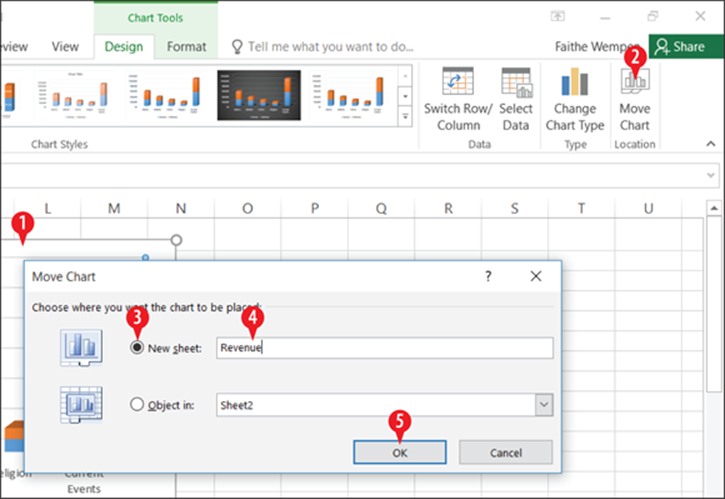
Figure 11-6: Move a chart to its own sheet.
To reverse that process, display the chart’s sheet and repeat steps 2-5, but in step 3 choose Object in and then choose the desired existing worksheet.
Switch rows and columns
When you create a chart that includes multiple data series, the chart might not plot that data in the way that you expect by default. For example, take a look back at the chart in Figure 11-5. What if you had intended for the different column colors to represent the different book categories, as in Figure 11-7?
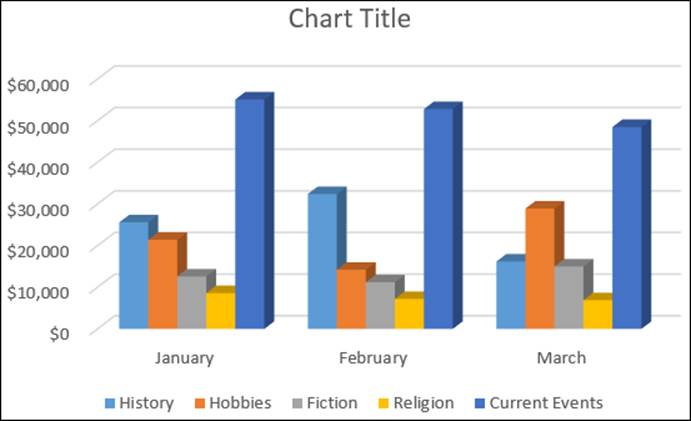
Figure 11-7: This chart uses the same data as Figure 11-5 but plots it by columns rather than by rows.
On the Chart Tools Design tab, click Switch Row/Column to switch back and forth between the two ways of plotting the data. (See ![]() in Figure 11-8.)
in Figure 11-8.)
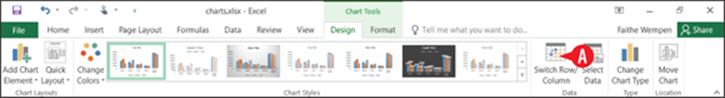
Figure 11-8: Click Switch/Row/Column to change the plot orientation.
Modify the data range for a chart
If you need the chart to plot different data than you originally chose, there are two ways to go. One is to delete the chart and start over. If you haven’t invested much time formatting and customizing the chart, this may be your quickest option.
The other method is to modify the data range for the chart, as follows:
![]() On the Chart Tools Design tab, click Select Data.
On the Chart Tools Design tab, click Select Data.
2. To select a different range for the chart:
![]() Click in the Chart data range box.
Click in the Chart data range box.
![]() On the worksheet, drag to redefine the range.
On the worksheet, drag to redefine the range.
![]() Clear the check box for any series or category that you want to temporarily exclude.
Clear the check box for any series or category that you want to temporarily exclude.
![]() Select any series that you want to remove permanently from the chart and then click Remove.
Select any series that you want to remove permanently from the chart and then click Remove.
![]() Click OK.
Click OK.
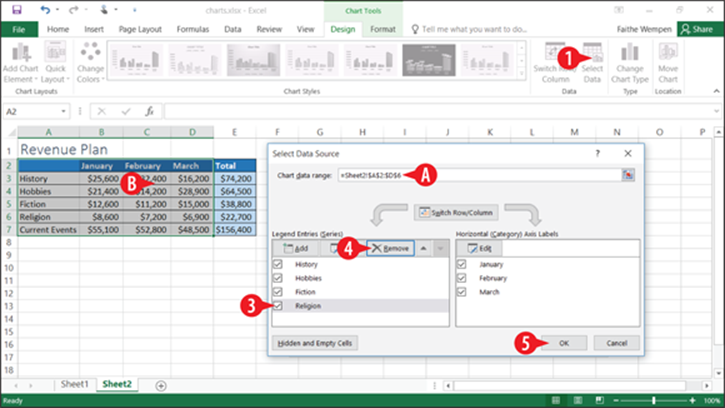
Figure 11-9: Modify the data range.
Change the axis scale of a chart
The axis scale is the numeric scale on the chart on which the values are plotted. In Figure 11-6, for example, the axis scale is $0 to $60,000.
Excel sets the axis scale automatically based on the values in the data range. However, you might sometimes want to adjust the axis scale strategically to give the audience a different impression of the data. For example, check out the following charts:
![]() In this chart, the axis scale is automatically set by Excel. The lower value is 16150 and the upper value is 16650. The differences among the bars are obvious.
In this chart, the axis scale is automatically set by Excel. The lower value is 16150 and the upper value is 16650. The differences among the bars are obvious.
![]() In this version, the axis scale has been manually changed to 0 as the lower value and 16650 as the upper value. In this version, the values appear to be nearly identical.
In this version, the axis scale has been manually changed to 0 as the lower value and 16650 as the upper value. In this version, the values appear to be nearly identical.
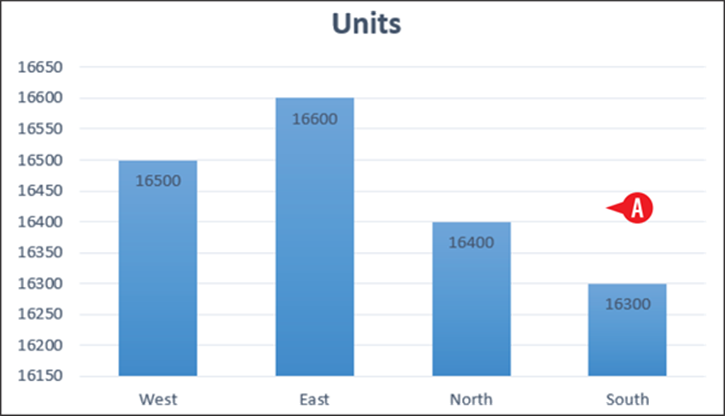
Figure 11-10: With the default axis scale, the differences are clear.
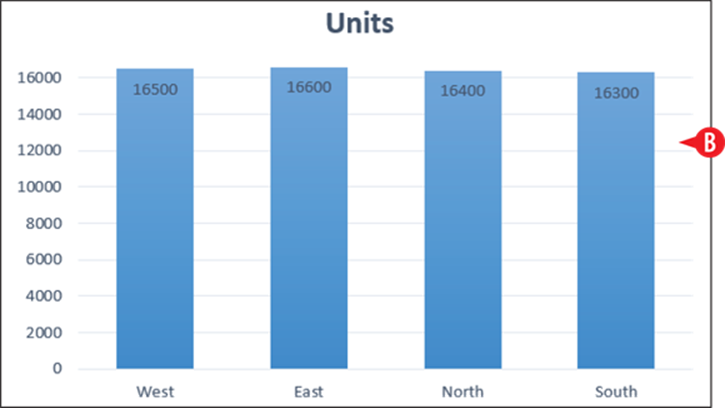
Figure 11-11: You could manually modify the axis scale to make the differences seem less significant.
Here’s how to set the axis scale:
![]() Click the vertical axis on the chart to select it.
Click the vertical axis on the chart to select it.
OR
![]() On the Chart Tools Format tab, open the Select Object drop-down list and choose Vertical (Value) Axis.
On the Chart Tools Format tab, open the Select Object drop-down list and choose Vertical (Value) Axis.
![]() On the Chart Tools Format tab, click Format Selection. The Format Axis task pane opens.
On the Chart Tools Format tab, click Format Selection. The Format Axis task pane opens.
![]() Click Axis Options text hyperlink if it is not already selected.
Click Axis Options text hyperlink if it is not already selected.
![]() Click the Axis Options icon.
Click the Axis Options icon.
![]() Click the Axis Options heading to expand its options if it is not already expanded.
Click the Axis Options heading to expand its options if it is not already expanded.
![]() In the Bounds area, change the Minimum and Maximum values as desired.
In the Bounds area, change the Minimum and Maximum values as desired.
If you decide to go back to the default value, click Reset. (See ![]() in Figure 11-12.)
in Figure 11-12.)
![]() Click Close to close the task pane.
Click Close to close the task pane.
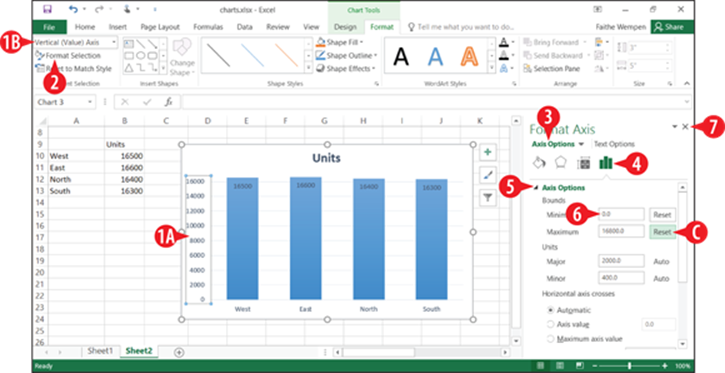
Figure 11-12: Change the axis scale in the Format Axis task pane.
Apply a chart style
Excel provides many chart styles, which are formatting presets for charts. Rather than manually formatting a chart, you may wish to save yourself some time by applying a chart style to improve a chart’s appearance. (If you do want to do manual formatting, though, it’s covered later in this chapter.) Some things to note about applying chart styles:
![]() To apply a chart style, choose one from the Chart Styles gallery on the Chart Tools Design tab.
To apply a chart style, choose one from the Chart Styles gallery on the Chart Tools Design tab.
![]() As with other galleries, you can click More to open up a list of additional choices.
As with other galleries, you can click More to open up a list of additional choices.
Some chart styles have more or fewer chart elements (that is, helper objects such as titles, legends, labels, and so on). In the next section you learn how to add and remove chart elements, so you aren’t tied to the particular combination of elements that a particular chart style uses.
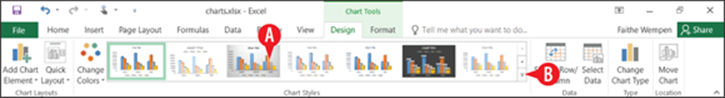
Figure 11-13: Apply a chart style.
Here’s another way to apply a chart style. With the chart selected, click the Chart Styles button (the paintbrush button) to the right of the chart’s frame. Then select a style from the palette that appears.
Change a chart’s colors
You can change the colors used in the chart, independently of the chart style. To do so, click Change Colors on the Chart Tools Design tab, and then choose a different set of colors. (See (A) in Figure 11-14.)
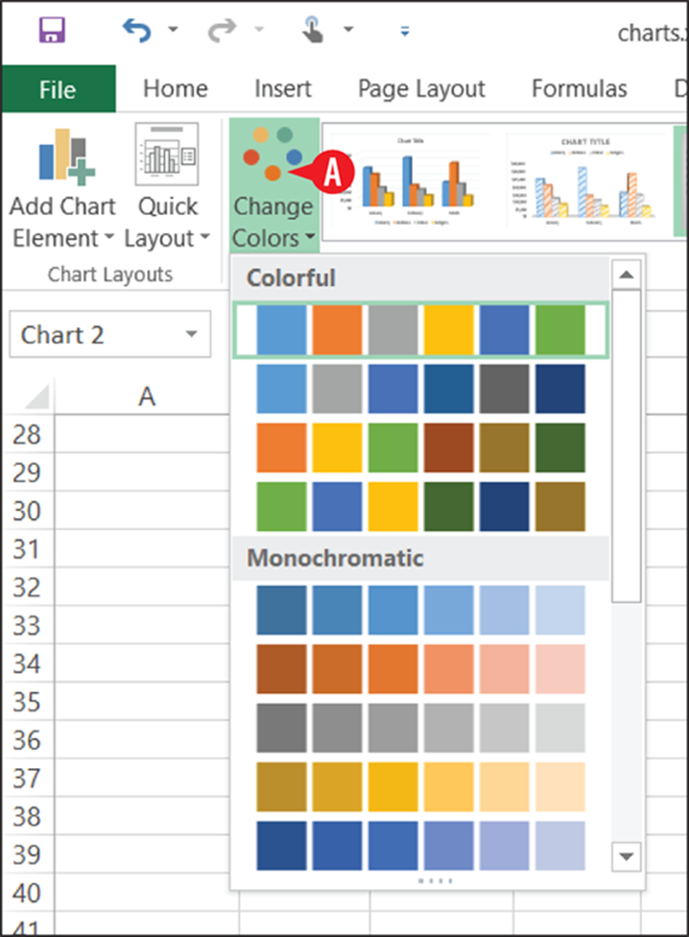
Figure 11-14: Change the colors used in the chart.
Note that these are not really different color schemes in the same sense as the overall color scheme for the entire workbook. The colors that appear on the Change Colors button’s menu are just different combinations, tints, and shades of the overall workbook’s colors.
Here’s another way to change the colors. With the chart selected, click the Chart Styles button (the paintbrush button) to the right of the chart’s frame. At the top of the pane that appears, click Colors, and then choose the desired colors.
If you want to change the overall colors of the workbook, do the following:
![]() On the Page Layout tab, click Colors.
On the Page Layout tab, click Colors.
![]() Click the desired color scheme. This changes all the color placeholders for the workbook and also affects the chart colors.
Click the desired color scheme. This changes all the color placeholders for the workbook and also affects the chart colors.
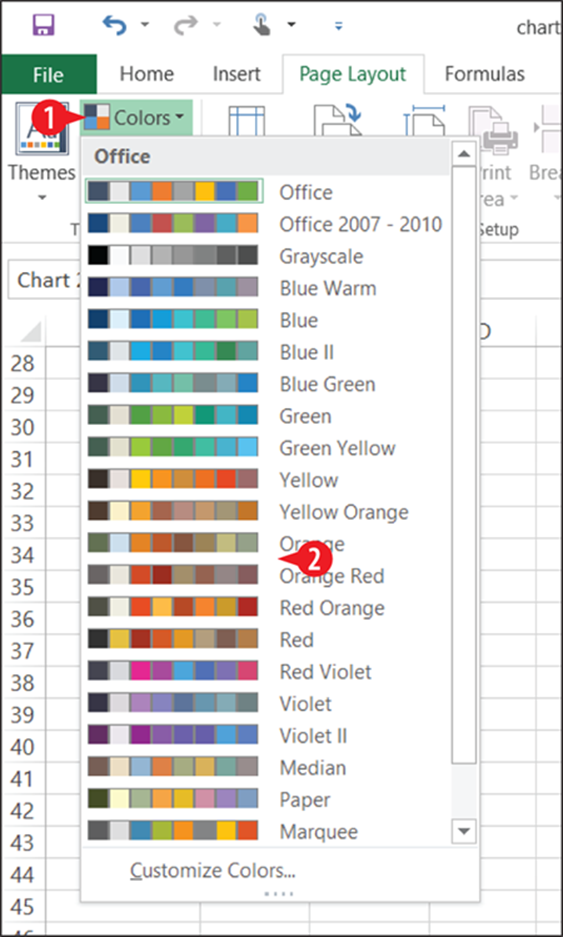
Figure 11-15: Apply a different color scheme to the entire workbook.
If you want to individually customize a particular chart element, such as making a certain data series or data point a specific color, see “Format a chart element” later in this chapter.
Add or remove chart elements
Chart elements refers to the individual parts of a chart that you can enable, adjust, and format separately. Figure 11-16 points out some of the most common chart elements. Most of these elements are optional and can be turned on/off.
 In Figure 11-16, I have increased the size of some of the text-based chart elements so you can see them better. To increase the size of a text-based element, such as data labels or a legend, select that element and then use the Grow Font button on the Home tab. Keep in mind, though, that if you manually change the size of some text, it won’t change automatically anymore if you resize the chart.
Here are some things to remember about chart elements:
![]() The chart area is the entire chart.
The chart area is the entire chart.
![]() A chart title describes the entire chart.
A chart title describes the entire chart.
![]() The plot area is the section of the chart area that contains the actual plotted data. It is usually set to the same background color as the chart area, so it’s not that noticeable, but in Figure 11-16 I’ve made it a different color so you can see it.
The plot area is the section of the chart area that contains the actual plotted data. It is usually set to the same background color as the chart area, so it’s not that noticeable, but in Figure 11-16 I’ve made it a different color so you can see it.
![]() The legend is a key that describes the meaning of each series color or pattern.
The legend is a key that describes the meaning of each series color or pattern.
![]() A data table shows the data on which the chart is based; it can be helpful to use a data table if the chart is not near the data.
A data table shows the data on which the chart is based; it can be helpful to use a data table if the chart is not near the data.
![]() An axis contains the scale on which the data is plotted. When the axis contains numeric values, it’s called the value axis. When the axis contains labels, like the months in Figure 11-16, it’s called the category axis.
An axis contains the scale on which the data is plotted. When the axis contains numeric values, it’s called the value axis. When the axis contains labels, like the months in Figure 11-16, it’s called the category axis.
![]() An axis label explains the unit of measurement or the meaning of the axis values.
An axis label explains the unit of measurement or the meaning of the axis values.
![]() Data labels report the exact value of each data point.
Data labels report the exact value of each data point.
![]() An individual bar, column, slice, or other data marker is a data point.
An individual bar, column, slice, or other data marker is a data point.
![]() The set of bars, columns, or other data markers of a common color or pattern is a data series.
The set of bars, columns, or other data markers of a common color or pattern is a data series.
![]() A 3D-style chart, like the one in Figure 11-16, has walls behind the data series, and a floor on which the bars sit. The walls and floor can be formatted separately from the chart or plot area and can even be formatted separately from one another.
A 3D-style chart, like the one in Figure 11-16, has walls behind the data series, and a floor on which the bars sit. The walls and floor can be formatted separately from the chart or plot area and can even be formatted separately from one another.
![]() Gridlines appear behind the columns or bars to help make the height of the columns or bars easier to read on the axis.
Gridlines appear behind the columns or bars to help make the height of the columns or bars easier to read on the axis.
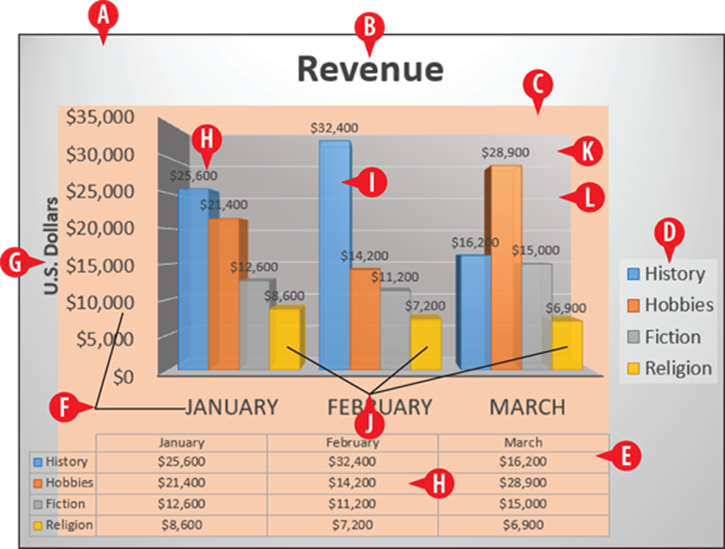
Figure 11-16: Parts of a chart.
A few of the elements of a chart are fairly essential, like the data points and the value axis, and you couldn’t remove them without the chart losing its meaning. Most of the other elements, however, are optional. A chart can still make sense without a data table, data labels, or even a legend, in some cases.
 Some chart elements can be removed by selecting them (by clicking) and then pressing the Delete key on the keyboard. The chart title and legend are that way, for example.
To add or remove a chart element:
1. Select the chart, so that icons appear in its upper right corner.
![]() Click Chart Elements. A menu of the optional chart elements appears.
Click Chart Elements. A menu of the optional chart elements appears.
![]() Mark or clear the check box for each element to turn it on or off.
Mark or clear the check box for each element to turn it on or off.
4. When you are finished, click Chart Elements again to close the menu.
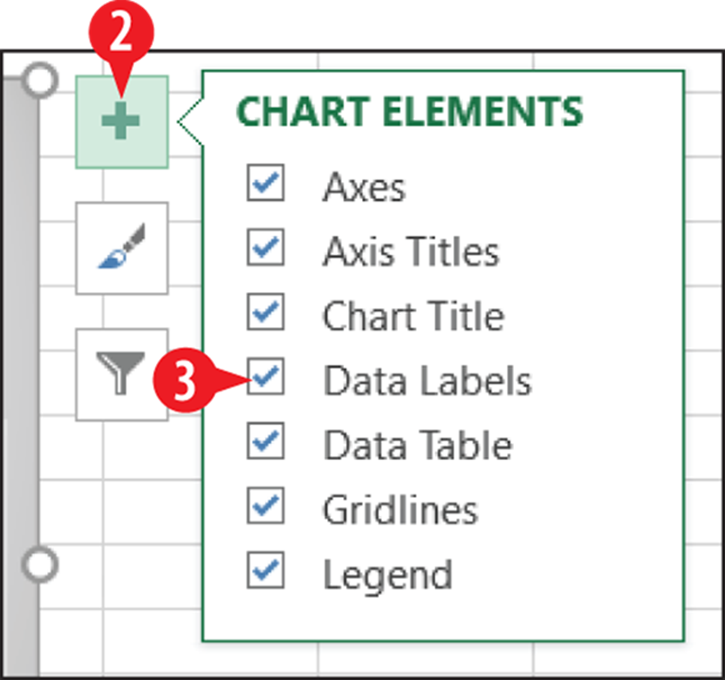
Figure 11-17: Add or remove chart elements.
Going the above route is the quickest and easiest way to enable or disable a certain element. However, if you are enabling an element, you might want a bit more control over how it appears. For some additional options, use the following method instead:
1. Select the chart.
![]() On the Chart Tools Design, tab, click Add Chart Element.
On the Chart Tools Design, tab, click Add Chart Element.
![]() Point to the desired chart element to see a submenu.
Point to the desired chart element to see a submenu.
![]() Click the desired option on the submenu.
Click the desired option on the submenu.
In Figure 11-17, if you hover over one of the items on the menu, you see a right-pointing triangle. Click that, and a submenu appears that contains many of the same options as in Figure 11-18.
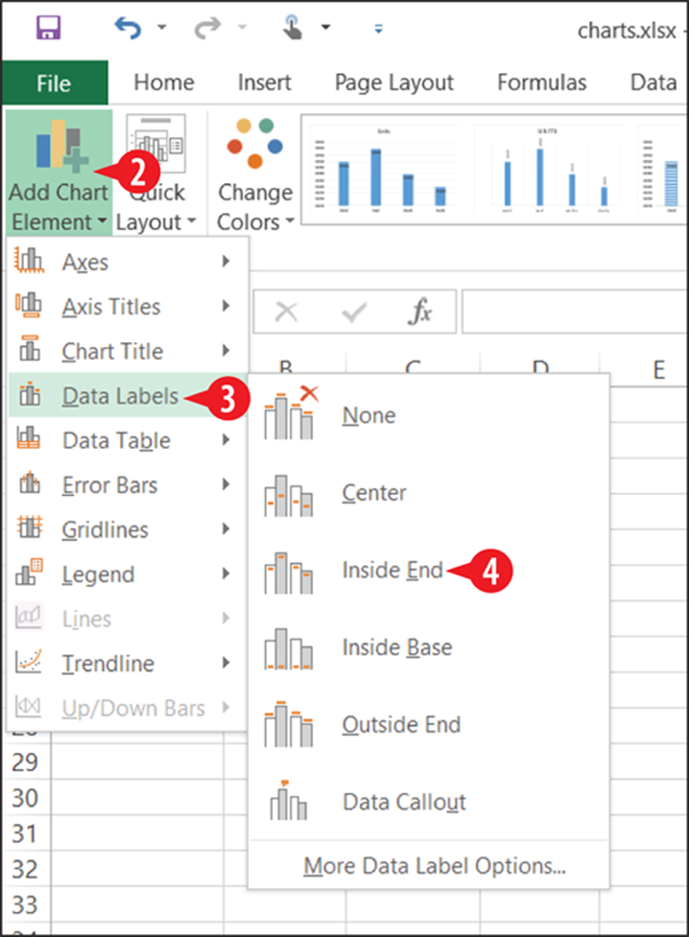
Figure 11-18: Add a chart element with specific options.
Format a chart element
Now let’s look at some ways to change a chart element’s appearance.
Reposition a chart element
As you saw in Figure 11-18, each element has a submenu on the Add Chart Element button’s menu. Some of these, like the ones for Legend and Chart Title, contain options for different positions within the chart area.
You can also drag-and-drop some of the chart elements to move them within the chart area:
![]() Select the chart element, so that selection handles appear around that element.
Select the chart element, so that selection handles appear around that element.
![]() Position the mouse over it so the pointer turns into a four-headed arrow.
Position the mouse over it so the pointer turns into a four-headed arrow.
3. Drag the element to a new location.
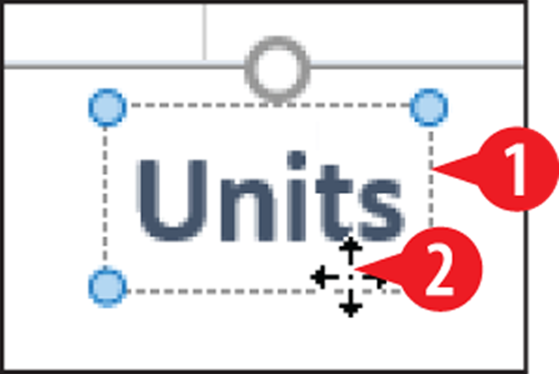
Figure 11-19: Add a chart element with specific options.
Not all chart elements can be repositioned. For example, the data points and the axes are in fixed locations, and a data table can’t appear anywhere other than below the chart.
Change the properties of a chart element
Each chart element has its own unique customizable properties. It’s hard to generalize about these, as they vary so dramatically depending on the element. For example, for a data series (a set of colored bars) in a 3D column chart, you can adjust the width of the bars, the gaps between them, and the shape of the bars (box, pyramid, cylinder).
To access an element’s properties, do the following:
![]() Click the chart element to select it.
Click the chart element to select it.
OR
![]() On the Chart Tools Format tab, open the Select Object drop-down list and choose the desired element.
On the Chart Tools Format tab, open the Select Object drop-down list and choose the desired element.
![]() On the Chart Tools Format tab, click Format Selection. The Format task pane opens for that element.
On the Chart Tools Format tab, click Format Selection. The Format task pane opens for that element.
![]() Click the rightmost icon on the task pane. Its name and appearance varies, but this is the one that shows the properties that are specific to the chosen element type.
Click the rightmost icon on the task pane. Its name and appearance varies, but this is the one that shows the properties that are specific to the chosen element type.
![]() Adjust the properties as desired.
Adjust the properties as desired.
![]() Close the task pane.
Close the task pane.
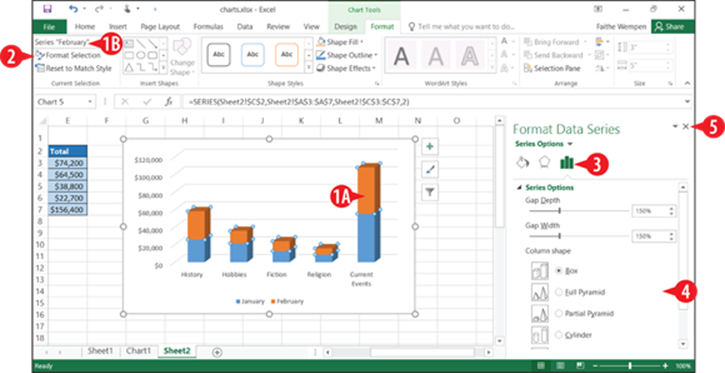
Figure 11-20: Change the chart element’s properties from its task pane.
While you’re in the task pane, check out the other sections to see what else you can do to change the appearance of that element. There are dozens of settings available.
Resize chart element text
To adjust the size of some text in a chart, do the following:
![]() Select the desired chart element. You can do this by clicking it or by using the Select Object drop-down list on the Chart Tools Format tab.
Select the desired chart element. You can do this by clicking it or by using the Select Object drop-down list on the Chart Tools Format tab.
![]() On the Home tab, click the Increase Font Size or Decrease Font Size button to change the font size.
On the Home tab, click the Increase Font Size or Decrease Font Size button to change the font size.
OR
![]() Open the Size drop-down list and select a specific size.
Open the Size drop-down list and select a specific size.
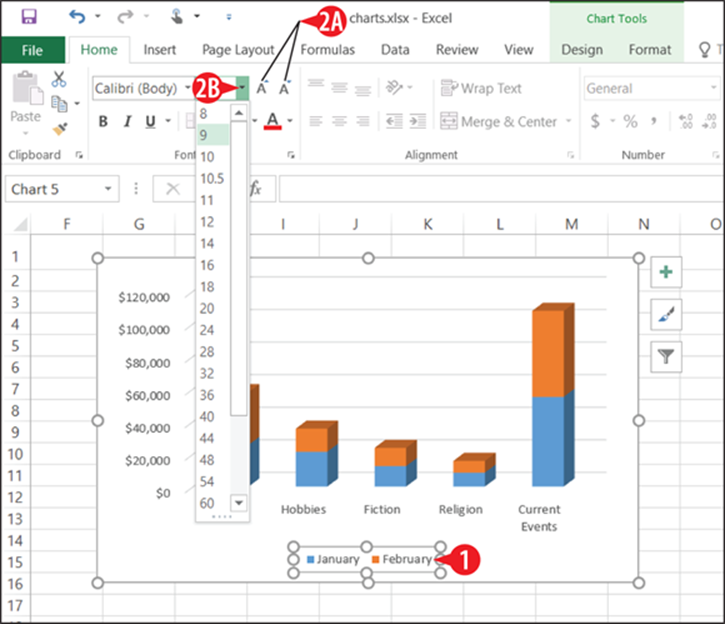
Figure 11-21: Use the Home tab controls to change the text size.
Format chart element text
You can also change the attributes of the text (bold, italic, and so on). From the Home tab, use the buttons in the Font group, as shown in Figure 11-22, or use keyboard shortcuts:
![]() Bold (Ctrl+B)
Bold (Ctrl+B)
![]() Italic (Ctrl+I)
Italic (Ctrl+I)
![]() Underline (Ctrl+U)
Underline (Ctrl+U)
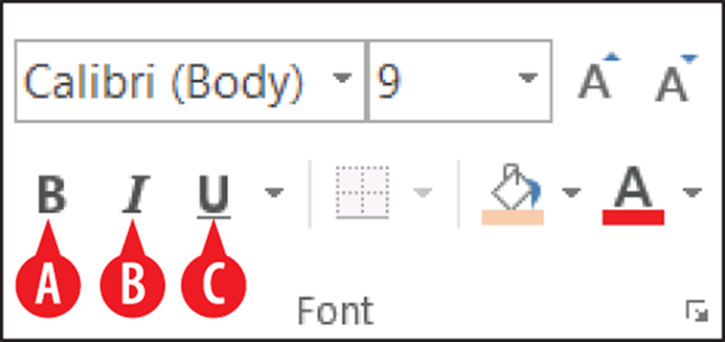
Figure 11-22: Apply bold, italics, or underline to a text element on a chart.
To apply further special effects to the text, use the Text Effects settings in the element’s task pane. Here’s how:
![]() Select the desired chart element.
Select the desired chart element.
![]() On the Chart Tools Format tab, click Format Selection to open the element’s task pane.
On the Chart Tools Format tab, click Format Selection to open the element’s task pane.
![]() At the top of the task pane, click the Text Options hyperlink.
At the top of the task pane, click the Text Options hyperlink.
![]() Click the Text Effects icon.
Click the Text Effects icon.
![]() Click an effect category to expand its settings.
Click an effect category to expand its settings.
![]() Adjust the settings as desired.
Adjust the settings as desired.
7. Repeat steps 5-6 as needed, and then close the task pane.
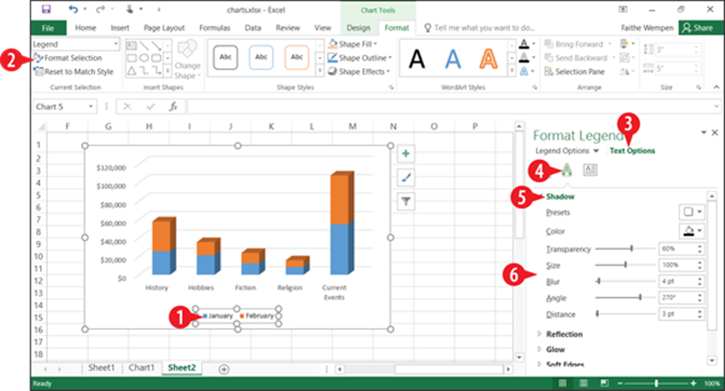
Figure 11-23: Apply special effects to a text-based element from the Text Effects section of its task pane.
Change a chart element’s border and fill
Most of the chart elements have their own rectangular frames around them, although by default that frame may not have any border or fill so the element blends in with the background behind it. For example, the plot area is its own separate rectangular area, but you usually don’t see it. The same is true for the legend, the axes, and the axis labels.
First, here’s a quick way to apply border and fill combinations to a chart element — apply a shape style to it:
1. Select the chart element.
![]() On the Chart Tools Format tab, click the More button in the Shape Styles group to open the Shape Styles gallery.
On the Chart Tools Format tab, click the More button in the Shape Styles group to open the Shape Styles gallery.
![]() Click one of the shape styles to apply it.
Click one of the shape styles to apply it.
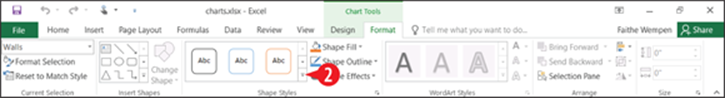
Figure 11-24: Click More to open the Shape Styles gallery.
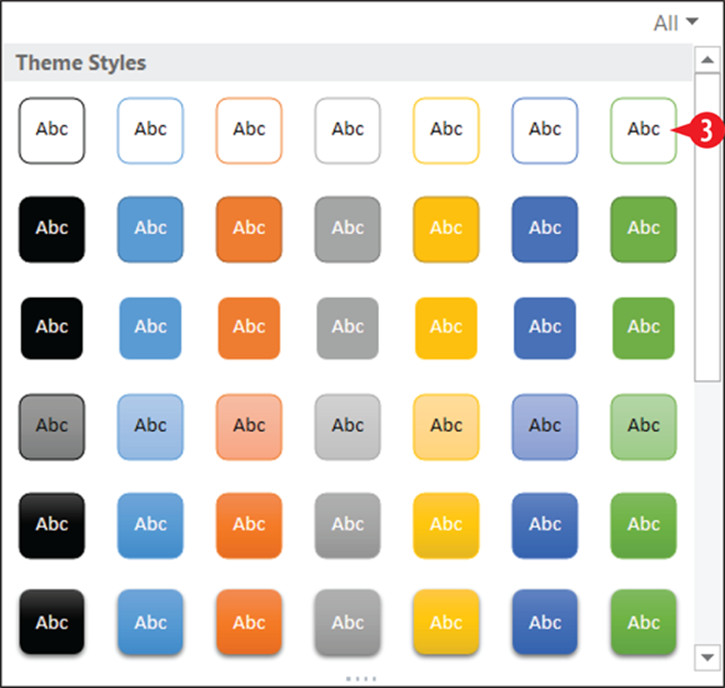
Figure 11-25: Choose a shape style.
Want more control? To manually change the fill and/or border of an element, follow these steps:
![]() Select the chart element.
Select the chart element.
![]() On the Chart Tools Format tab, open the Shape Fill button’s menu.
On the Chart Tools Format tab, open the Shape Fill button’s menu.
3. Select a fill color:
![]() Automatic allows Excel to choose the color based on the background color, and is the default.
Automatic allows Excel to choose the color based on the background color, and is the default.
![]() You can choose one of the theme colors.
You can choose one of the theme colors.
![]() You can choose a standard color. Click More Fill Colors for additional choices.
You can choose a standard color. Click More Fill Colors for additional choices.
![]() To remove the fill, click No Fill.
To remove the fill, click No Fill.
![]() You can also choose a picture, gradient, or texture fill.
You can also choose a picture, gradient, or texture fill.
![]() Open the Shape Outline button’s menu.
Open the Shape Outline button’s menu.
5. Select an outline color:
![]() Automatic allows Excel to choose the color based on the background color, and is the default.
Automatic allows Excel to choose the color based on the background color, and is the default.
![]() You can choose one of the theme colors.
You can choose one of the theme colors.
![]() You can choose a standard color.
You can choose a standard color.
![]() To remove the outline, click No Outline.
To remove the outline, click No Outline.
After selecting an outline color, you can optionally adjust the line style and thickness:
![]() Click the Shape Outline button again to reopen its menu.
Click the Shape Outline button again to reopen its menu.
![]() If you want a different line thickness, point to Weight and select a line weight.
If you want a different line thickness, point to Weight and select a line weight.
![]() The default is a solid outline; if you want a dotted or dashed line, point to Dashes and select a line style.
The default is a solid outline; if you want a dotted or dashed line, point to Dashes and select a line style.
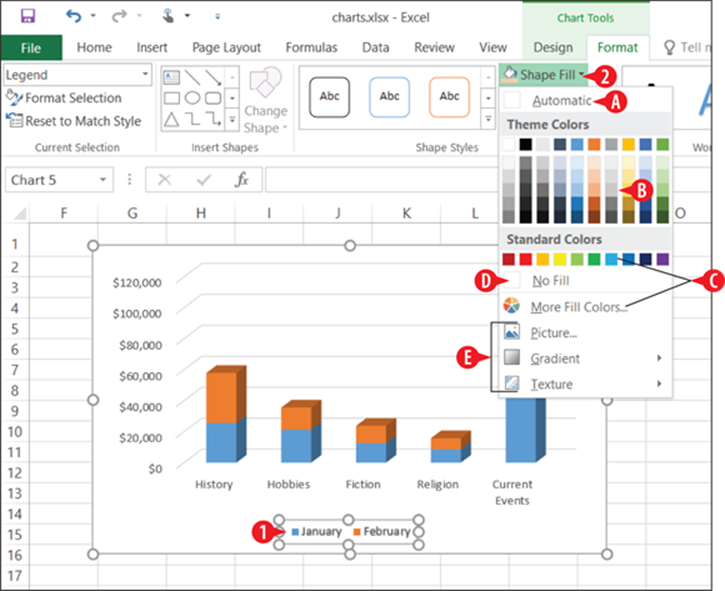
Figure 11-26: Choose a fill effect for the selected element.
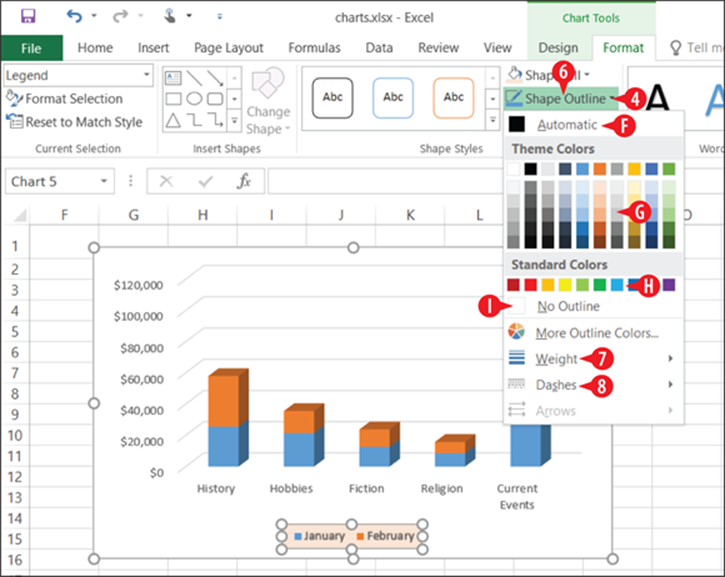
Figure 11-27: Choose an outline color for the selected element.
Apply special effects to a chart element
Special effects that you can add to an element include shadow, glow, soft edges, bevel, and 3D rotation. Most people don’t take the time to apply such effects, but you may encounter situations where it is worthwhile to do so.
To apply an effect:
![]() Select the chart element.
Select the chart element.
![]() On the Chart Tools Format tab, open the Shape Effects button’s menu.
On the Chart Tools Format tab, open the Shape Effects button’s menu.
![]() Point to an effect to open its submenu.
Point to an effect to open its submenu.
![]() Click the desired effect.
Click the desired effect.
To remove an effect, click the selection in the No area of the menu, such as No Bevel for a bevel. (See ![]() in Figure 11-28.)
in Figure 11-28.)
5. Repeat steps 2-4 to apply additional effects as desired.
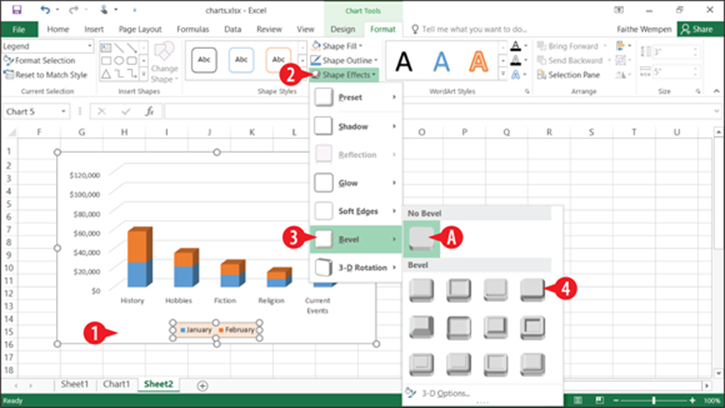
Figure 11-28: Apply special effects to a chart element.
All materials on the site are licensed Creative Commons Attribution-Sharealike 3.0 Unported CC BY-SA 3.0 & GNU Free Documentation License (GFDL)
If you are the copyright holder of any material contained on our site and intend to remove it, please contact our site administrator for approval.
© 2016-2026 All site design rights belong to S.Y.A.