My Office 2016 (2016)
6. Entering Excel Data
In this chapter, you learn about entering data into an Excel worksheet, building formulas, working with functions, and storing data in tables. Topics include the following:
![]() Entering numbers, text, dates, and times
Entering numbers, text, dates, and times
![]() Editing cell data
Editing cell data
![]() Building formulas to add calculations to a worksheet
Building formulas to add calculations to a worksheet
![]() Creating and working with Excel tables
Creating and working with Excel tables
If you’ve never used a spreadsheet before, Excel may seem intimidating, and getting it to do anything useful may seem daunting. However, a spreadsheet is really just a fancy electronic version of a numeric scratch pad. With the latter, you write down a few numbers and then use elementary school techniques to calculate a result. At its most basic level, an Excel worksheet is much the same: You type one or more values and then you create a formula that calculates a result.
The first part of this basic Excel method is entering your worksheet data, and that’s what this chapter is all about. You learn the best ways to get your data into the worksheet, some tips and tricks for easier data entry, how to build formulas, and how to use tables to make your data easier to read and understand.
Understanding Worksheet Cells and Data
A worksheet is a rectangular arrangement of rows and columns. The rows are numbered, where the topmost row is 1, the row below it is 2, and so on all the way to 1,048,576. (Although, as you can imagine, worksheets that use more than a million rows are rare!) The columns are labeled with letters, where A is the leftmost column, the next column is B, and so on. After column Z come columns AA, AB, and so on, all the way up to XFD; that’s 16,384 columns in all.
The intersection of each row and column is called a cell, and each cell has a unique address that combines its column letter (or letters) and row number. For example, the upper-left cell in a worksheet is at the intersection of column A and row 1, so its address is A1. When you click a cell, it becomes the active cell—which Excel designates by surrounding the cell with a heavy border and by displaying a small square in the lower-right corner—and its address appears in the Name box, which is located just above column A.
You use these worksheet cells to enter your data, which you learn more about in the next few sections. For now, you should know that worksheet cells can hold four kinds of data:
• Numbers—These entries can be dollar values, weights, interest rates, or any other numerical quantity.
• Text—These entries are usually labels, such as August Sales or Territory, that make a worksheet easier to read, but they can also be text/number combinations for items such as phone numbers and account codes.
• Dates and times—These entries are specific dates (such as 8/23/2016), specific times (such as 9:05 a.m.), or combinations of the two. You mostly use dates (and, to a lesser extent, times) in tables and lists to record when something took place, although Excel also lets you calculate with dates and times.
• Formulas—These are calculations involving two or more values, such as 2*5 or A1+A2+A3. See the “Working with Formulas and Functions” section later in this chapter.
Working with Numbers
Worksheets are all about numbers. You add them together, subtract them, take their average, or perform any number of mathematical operations on them. Excel recognizes that you’re entering a number if you start the entry with a decimal point (.), a plus sign (+), a minus sign (-), or a dollar sign ($). Here are some other rules for entering numbers:
• You can enter percentages by following the number with a percent sign (%). Excel stores the number as a decimal. For example, the entry 15% is stored as 0.15.
• You can use scientific notation when entering numbers. For example, to enter the number 3,879,000,000, you could enter 3.879E+09.
• You can also use parentheses to indicate a negative number. If you make an entry such as (125), Excel assumes you mean negative 125.
• You can enter commas to separate thousands, but you have to make sure that each comma appears in the appropriate place. Excel interprets an entry such as 12,34 as text.
• If you want to enter a fraction, you need to type an integer, a space, and then the fraction (5 1/8, for example). This is true even if you’re entering only the fractional part; in this case, you need to type a zero, a space, and then the fraction or else Excel interprets the entry as a date. For example, 0 1/8 is the fraction one-eighth, but 1/8 is January 8.
Working with Text
In Excel, text entries can include any combination of letters, symbols, and numbers. Although text is sometimes used as data, you’ll find that you mostly use text to describe the contents of your worksheets. This is important because even a modest-sized spreadsheet can become a confusing jumble of numbers without some kind of guideline to keep things straight. There is no practical limit on the length of text entries (they can be up to 32,767 characters long!), but in general, you shouldn’t use anything too fancy or elaborate; a simple phrase such as Monthly Expenses orPayment Date will usually suffice.
Working with Dates and Times
Excel uses serial numbers to represent specific dates and times. To get a date serial number, Excel uses December 31, 1899, as an arbitrary starting point and counts the number of days that have passed since then. For example, the date serial number for January 1, 1900, is 1; for January 2, 1900, it is 2; and so on. Table 6.1 displays some examples of date serial numbers.
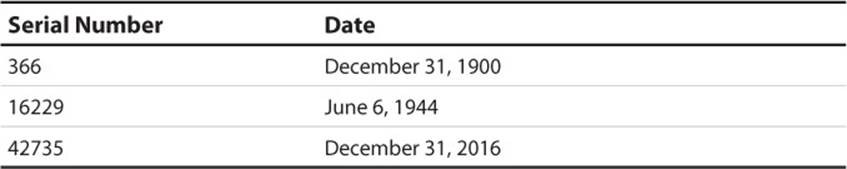
Table 6.1 Examples of Date Serial Numbers
To get a time serial number, Excel expresses time as a decimal fraction of the 24-hour day to get a number between 0 and 1. The starting point, midnight, is given the value 0, so noon—halfway through the day—has a serial number of 0.5. Table 6.2 displays some examples of time serial numbers.
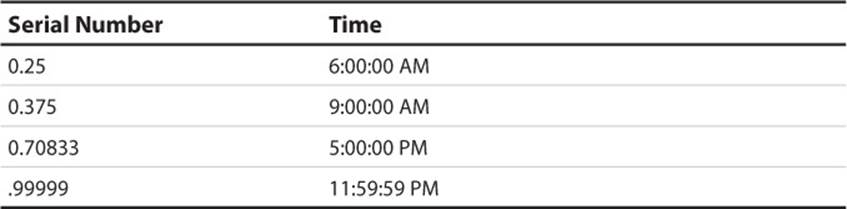
Table 6.2 Examples of Time Serial Numbers
You can combine the two types of serial numbers. For example, 42735.5 represents noon on December 31, 2016.
The advantage of using serial numbers in this way is that it makes calculations involving dates and times easy. A date or time is really just a number, so any mathematical operation you can perform on a number you can also perform on a date. This is invaluable for worksheets that track delivery times, monitor accounts receivable or accounts payable aging, calculate invoice discount dates, and so on.
Although it’s true that the serial numbers make it easier for the computer to manipulate dates and times, it’s not the best format for humans to comprehend. For example, the number 25,404.95555 is meaningless, but the moment it represents (July 20, 1969, at 10:56 p.m. EDT) is one of the great moments in history (the Apollo 11 moon landing). Fortunately, Excel takes care of the conversion between these formats so that you never have to worry about it.
To enter a date or time, use any of the formats outlined in Table 6.3. Note that no matter which format you use, Excel still stores the date or time as a serial number. Also, you’re not stuck with the format you use when you enter the date or time—you’re free to change the format any time.
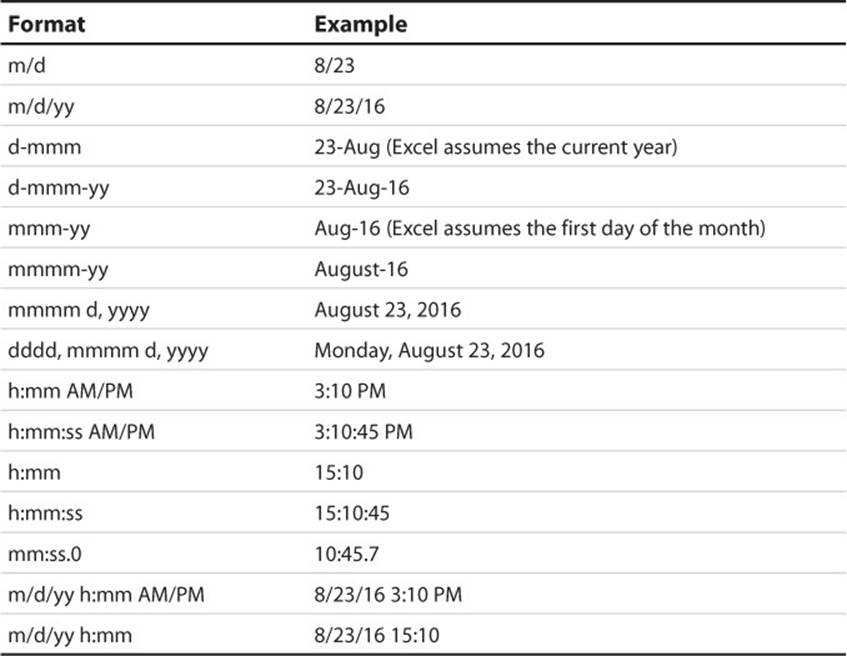
Table 6.3 Excel Date and Time Formats
Entering and Editing Data
A spreadsheet is only as useful—and as accurate—as the data it contains. Even a small mistake can render your results meaningless. So the first rule of good spreadsheet style is to enter and edit your data carefully.
Enter Cell Data
If you’re new to spreadsheet work, you’ll no doubt be pleased to hear that entering data into a worksheet cell is straightforward.
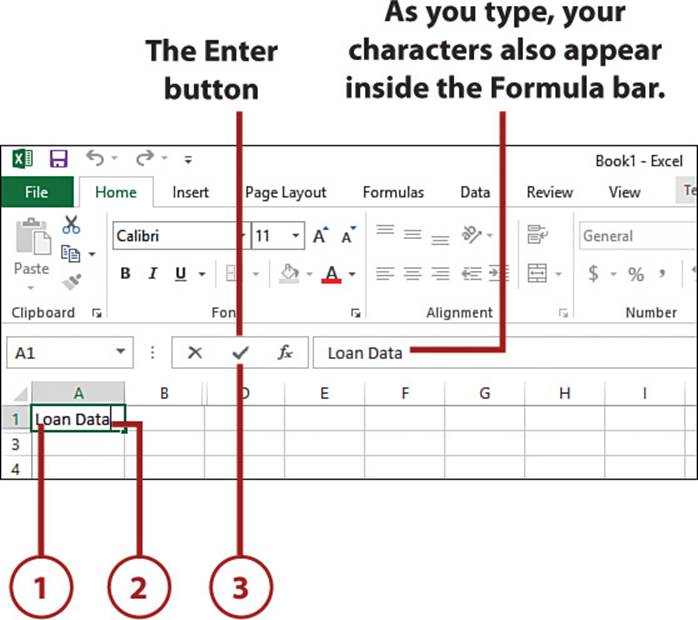
1. Select the cell you want to use to enter your data. The easiest way to do this is to click the cell, but you can also use the arrow keys to navigate to the cell you want.
2. Type your data. Excel automatically opens the cell for editing and places your typing inside the cell.
3. When your entry is complete, press Enter. Excel moves the active cell to the cell below. If you don’t want the active cell to move after you confirm your entry, click the Enter button, instead.
Confirming Data Entry with the Arrow Keys
You can also confirm your entry by pressing any of the arrow keys or by selecting another cell. The active cell moves either in the direction of the arrow or to the cell you selected. This feature is handy if you have, say, a lengthy row of data to type in. By pressing (in this case) the right arrow key to confirm each entry, you automatically move the active cell along the row.
Edit Cell Data
If you make a mistake when entering data or you have to update the contents of a cell, you need to edit the cell to get the correct value. If you want to replace the entire cell contents, follow the steps in the previous section. This section shows you how to make changes to a cell’s existing content.
1. Double-click the cell. The insertion point appears inside the cell.
Keyboard Shortcut
You can also open the active cell for editing by pressing F2.
2. Click (or use the left and right arrow keys) to position the insertion point where you want to make your changes.
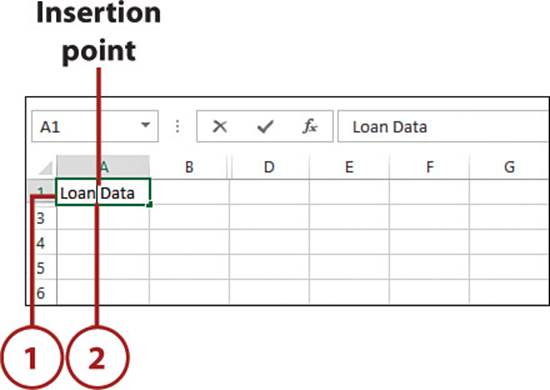
3. Edit the contents of the cell.
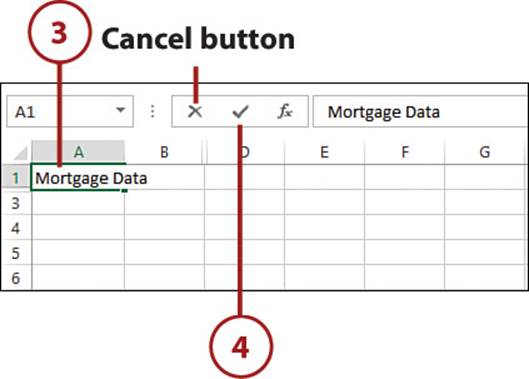
4. Confirm your changes by pressing Enter or clicking the Enter button. To cancel the edit without confirming your changes, press Esc or click the Cancel button.
Working with Formulas and Functions
Any worksheet is merely a collection of numbers and text until you define some kind of relationship between the various entries. You do this by creating formulas that perform calculations and produce results. This section takes you through some formula basics and then shows you how to build your own formulas.
Excel divides formulas into three main groups: arithmetic, comparison, and text. Each group has its own set of operators, and you use each group in different ways.
Let’s start with arithmetic formulas, which are by far the most common type of formula. They combine numbers, cell addresses, and function results with mathematic operators to perform calculations. Table 6.4 summarizes the mathematic operators used in arithmetic formulas.
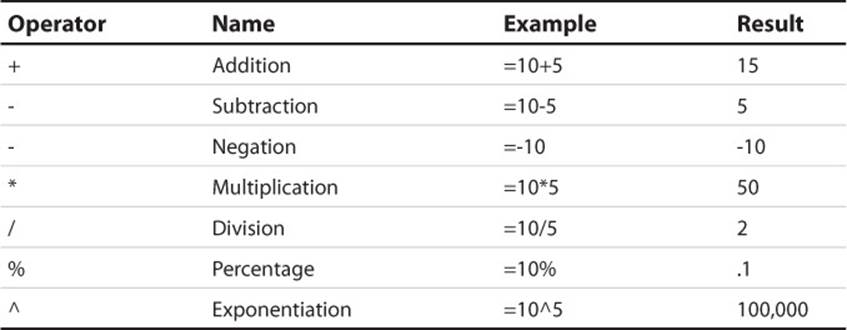
Table 6.4 The Arithmetic Operators
Most of the operators in Table 6.4 are straightforward, but the exponentiation operator may require further explanation. The formula =x^y means that the value x is raised to the power y. For example, =3^2 produces the result 9 (that is, 3*3=9). Similarly, =2^4 produces 16 (that is, 2*2*2*2=16).
A comparison formula is a statement that compares two or more numbers, text strings, cell contents, or function results. If the statement is true, the result of the formula is given the logical value TRUE (which is equivalent to 1). If the statement is false, the formula returns the logical value FALSE (which is equivalent to 0). Table 6.5 summarizes the operators you can use in comparison formulas.
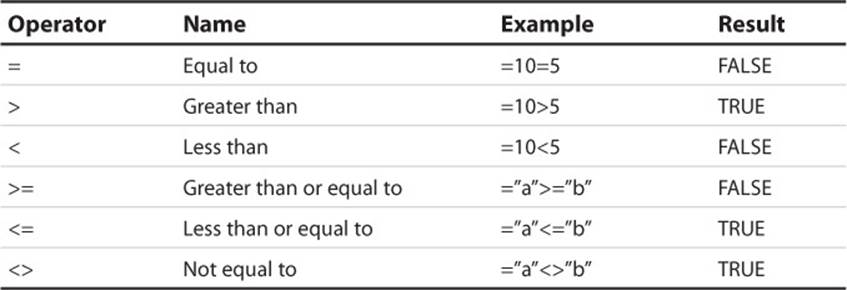
Table 6.5 Comparison Formula Operators
There are many uses for comparison formulas. For example, you could determine whether to pay a salesperson a bonus by using a comparison formula to compare the person’s actual sales with a predetermined quota. If the sales are greater than the quota, the salesperson is awarded the bonus. Another example is credit collection. If the amount a customer owes is, say, more than 150 days past due, you might send the receivable to a collection agency.
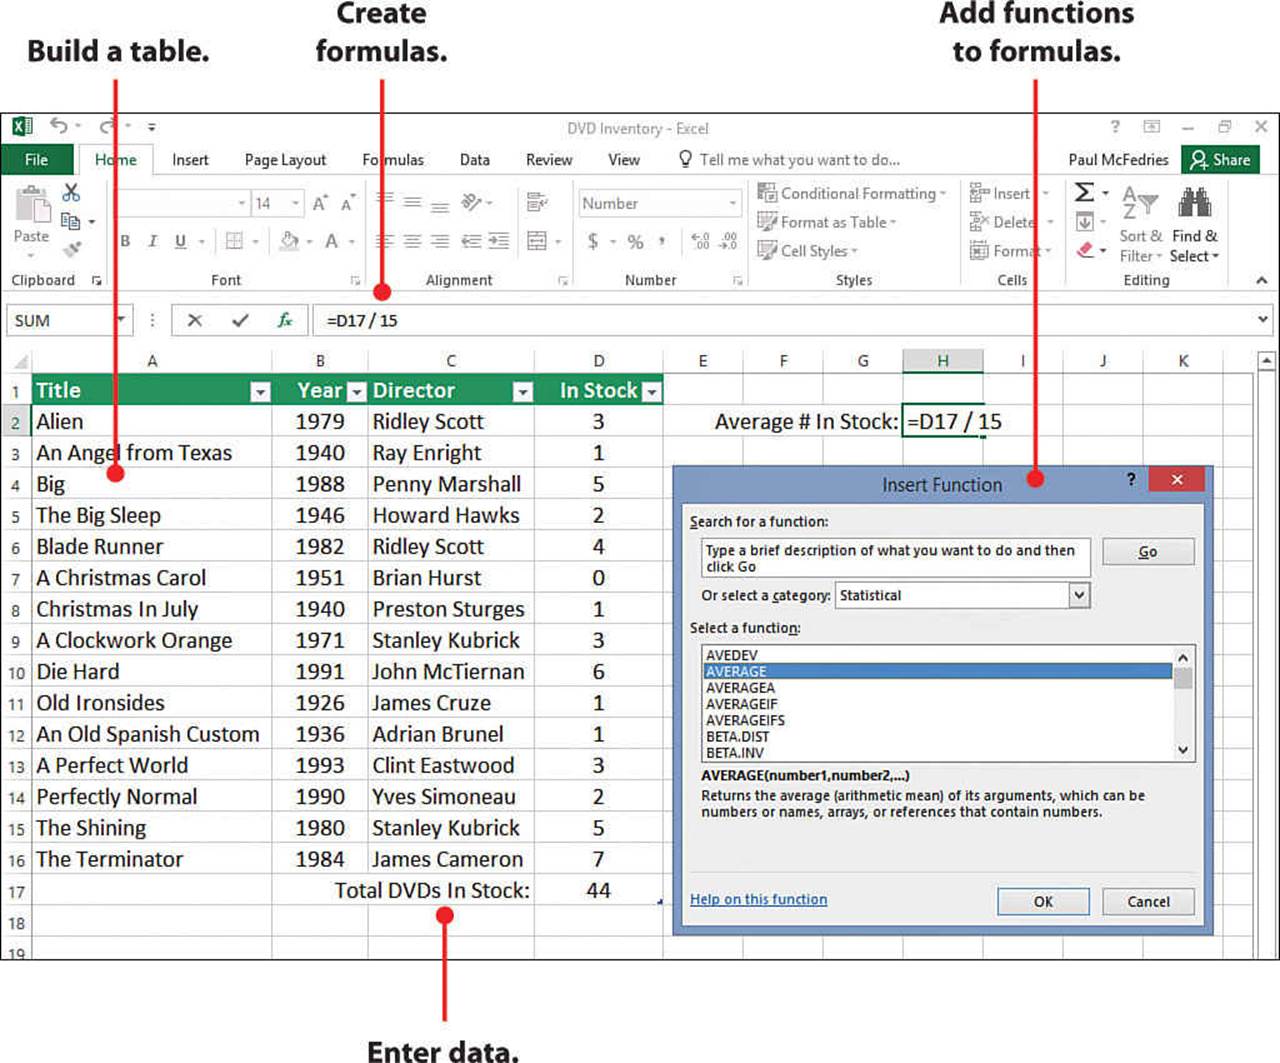
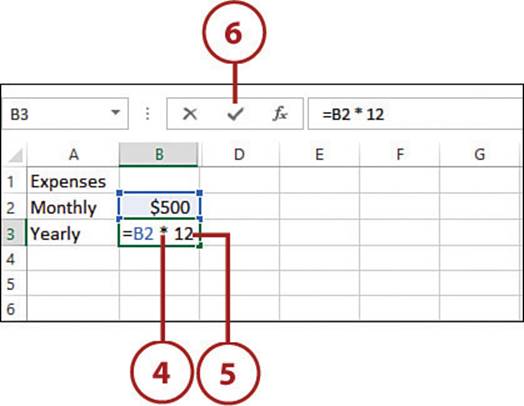
Build a Formula
Building a formula is much like entering data into a cell, with the exception that all Excel formulas must begin with an equal sign (=).
1. Select the cell you want to use for the formula.
2. Type an equal sign (=). Excel opens the cell for editing and enters the equal sign.
3. Enter a value, cell reference, range, range name, or function name.
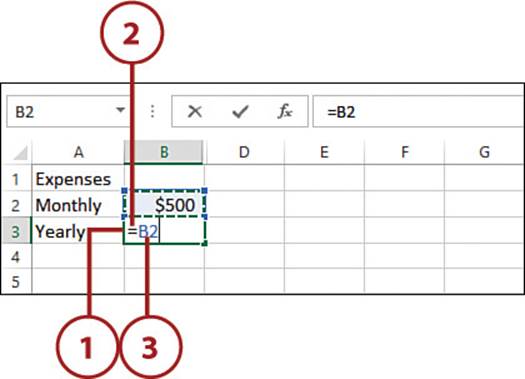
Clicking to Enter a Cell Address
When entering a cell reference in a formula, you could just type in the cell address, but it’s often faster and more accurate to let Excel do the work by clicking the cell. The address appears automatically in the formula at the insertion point.
4. Enter an operator (such as + or *).
5. Repeat steps 3 and 4 until the formula is complete.
6. Press Enter or click the Enter button to accept the formula.
>>>Go Further: Controlling the Order of Calculation
When you use the operators listed earlier in Tables 6.4 and 6.5, be aware that Excel processes the operators not only from left to right, but also by giving some operators precedence over others. For example, Excel always performs multiplication and division before it performs addition and subtraction. In some cases, you might need to control the order of calculation so that, say, Excel performs an addition operation before it performs a multiplication. To do this, enclose the operation you want performed first in parentheses. Excel always calculates expressions enclosed in parentheses first, so you can use this technique to force Excel to calculate your formulas in whatever order you require.
Understanding Functions
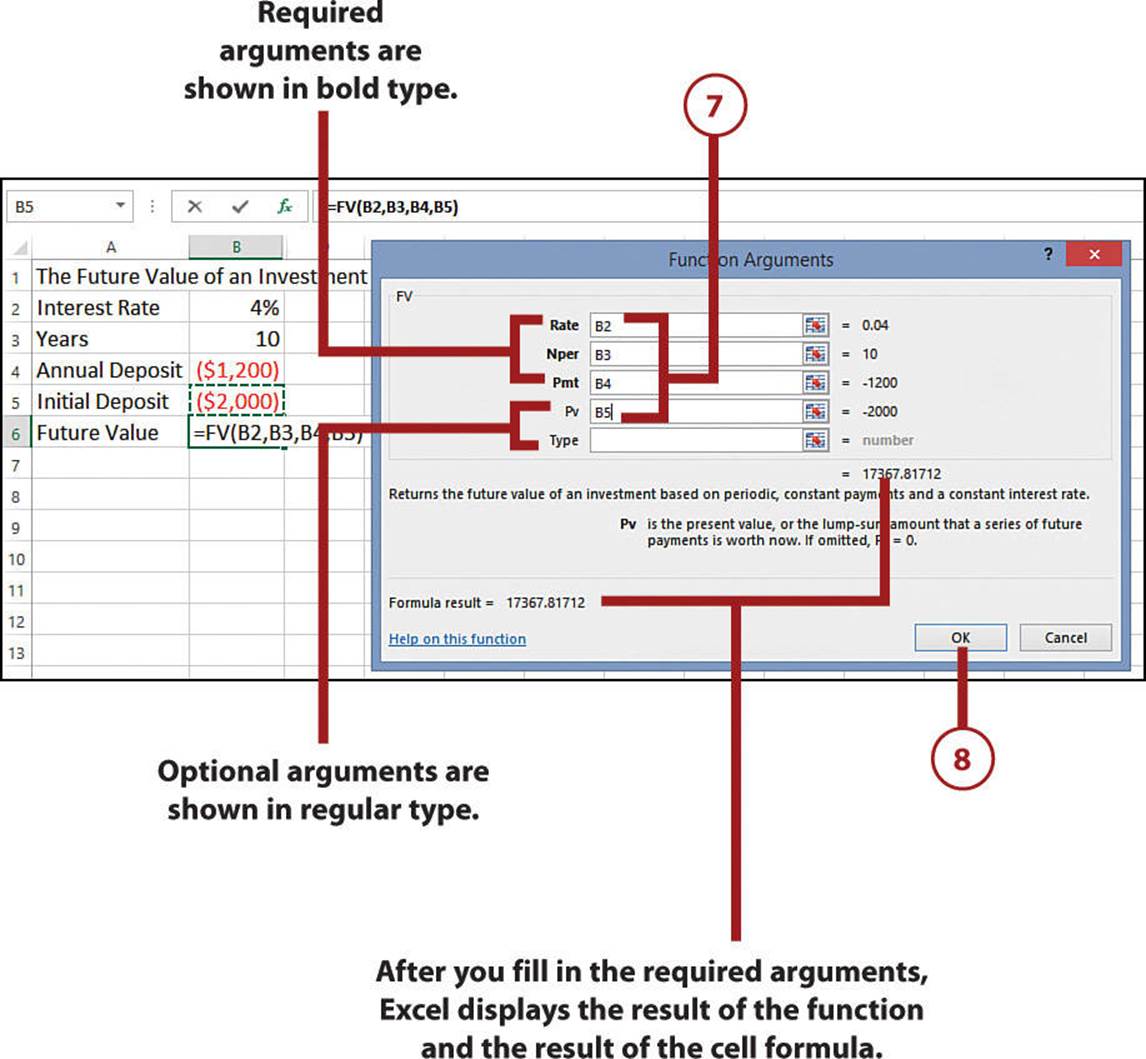
Consider the following scenario: You want to deposit a certain amount in an investment that earns a particular rate of interest over a particular number of years. Assuming you start at 0, how much will the investment be worth at the end of the term? Given a present value (represented by pv), a regular payment (pmt), an annual interest rate (rate), and some number of years (nper), here’s the formula that calculates the future value of the investment:
pv(1 + rate) ^ nper + pmt * (((1 + rate) ^ nper) - 1) / rate
That’s a really complex formula, but this complexity wouldn’t be a big deal if this formula were obscure or rarely used. However, calculating the future value of an investment is one of the most common Excel chores (it is, for example, the central calculation in most retirement planning models). Having to type such a formula once is bad enough, but it is one you may need dozens of times. Clearly, entering such a formula by hand so many times is both time consuming and prone to errors.
Fortunately, Excel offers a solution: a worksheet function called FV() (Future Value), which reduces the earlier formula to the following:
fv(rate, nper, pmt, pv)
Not only is this formula much simpler to use and faster to type, you also don’t have to memorize anything other than the function name because, as you soon see, Excel shows you the full function syntax (that is, the list of arguments and the order in which they appear) as you type it.
In general, a function is a predefined formula that calculates a result based on one or more arguments, which are the function’s input values (such as rate and nper in the FV() example). Note that most functions have at least one argument, and that for functions with two or more arguments, in most cases some of those arguments are required (that is, Excel returns an error if the arguments are not present) and some are optional.
Functions not only simplify complex mathematical formulas, but they also enable you to perform powerful calculations such as statistical correlation, the number of workdays between two dates, and square roots.
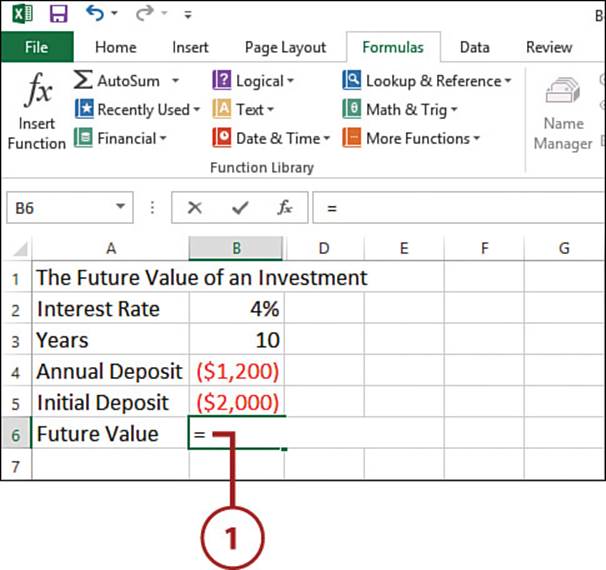
Add a Function Directly to a Cell
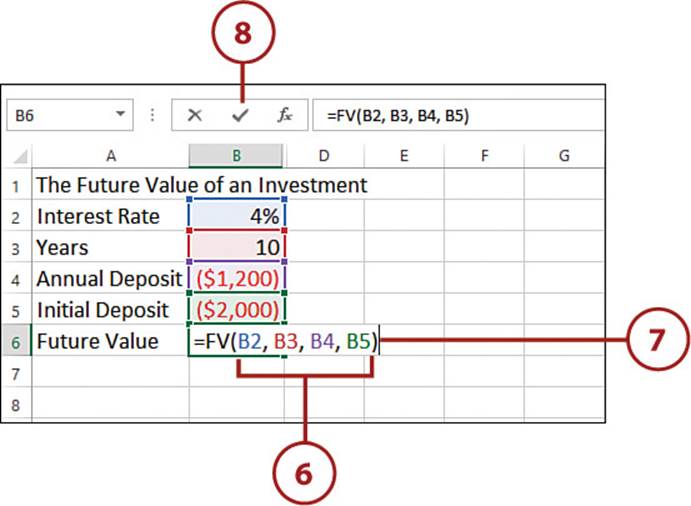
The quickest way to include a function in a formula is to type the function and its arguments directly into the cell.
1. Enter your formula up to the point where you want to include the function.
2. Begin typing the function name. As you type, Excel displays a list of function names that begin with what you have typed so far.
3. Click a function name to select it and see its description.
4. To add the selected function name to the formula, double-click it (or press Tab). Excel adds the function name and a left parenthesis—(.
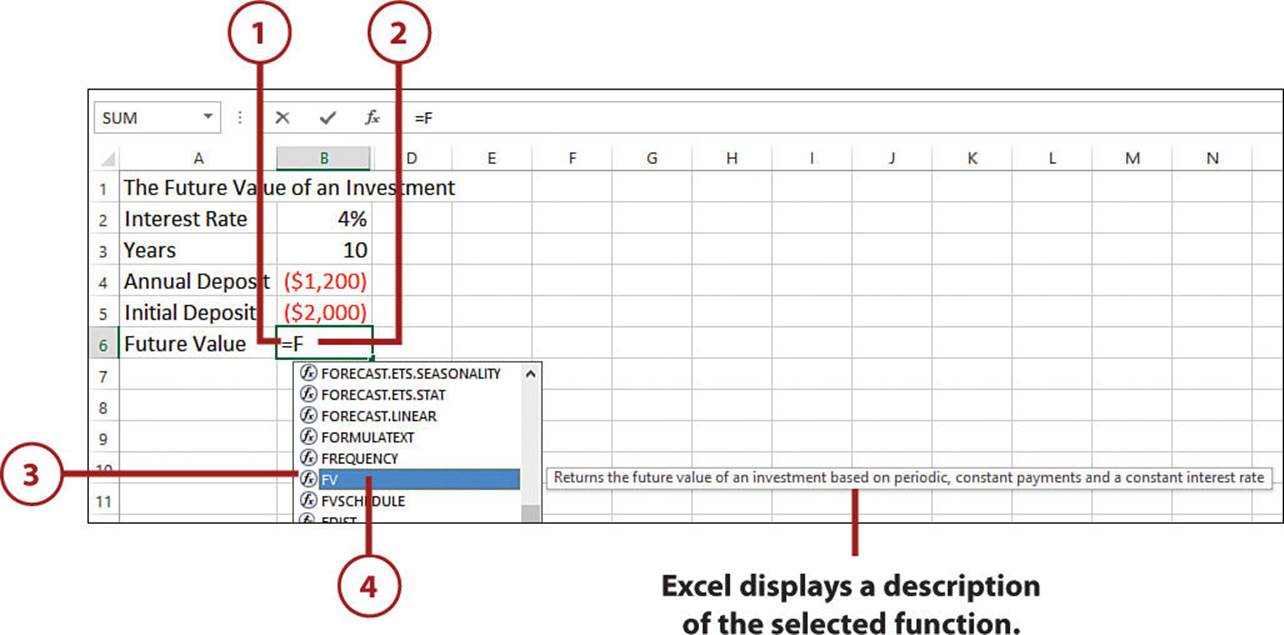
5. If you’re typing the function name by hand, be sure to add the left parenthesis after the name. Excel now displays a ScreenTip with the function syntax.
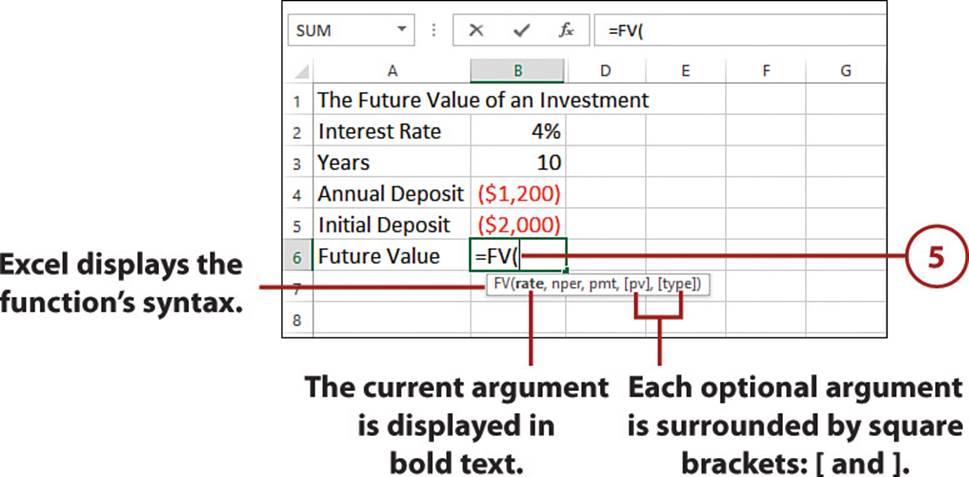
6. Enter the required arguments, separated by commas. If you also need to use any of the optional arguments, enter them separated by commas.
7. Type the right parenthesis: ).
8. Press Enter or click the Enter button. Excel enters the formula and displays the formula result in the cell.
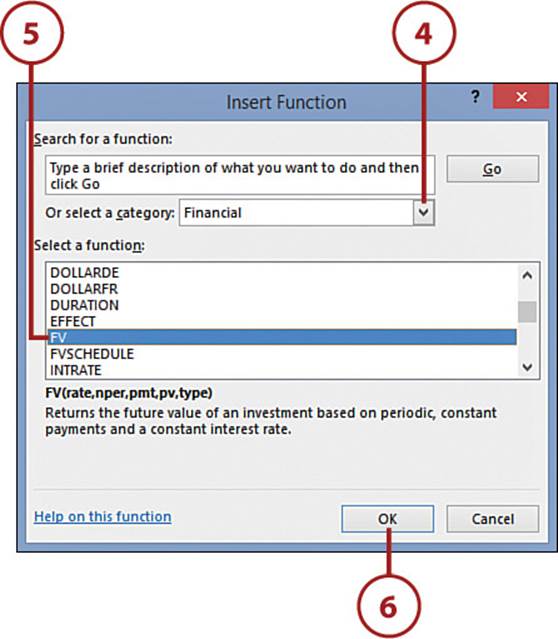
Add a Function Using the Function Wizard
Excel’s pop-up function list and syntax ScreenTips are so useful that typing functions by hand is almost always the fastest way to incorporate functions into your formulas. However, if you’re not sure which function you need, or if you want to see the function results before committing the function to the formula, you need to turn to Excel’s Function Wizard.
1. Enter your formula up to the point where you want to include the function.
2. Select the Formulas tab.
3. Select Insert Function. You can also click the Insert Function button beside the Formula bar. The Insert Function dialog box opens.
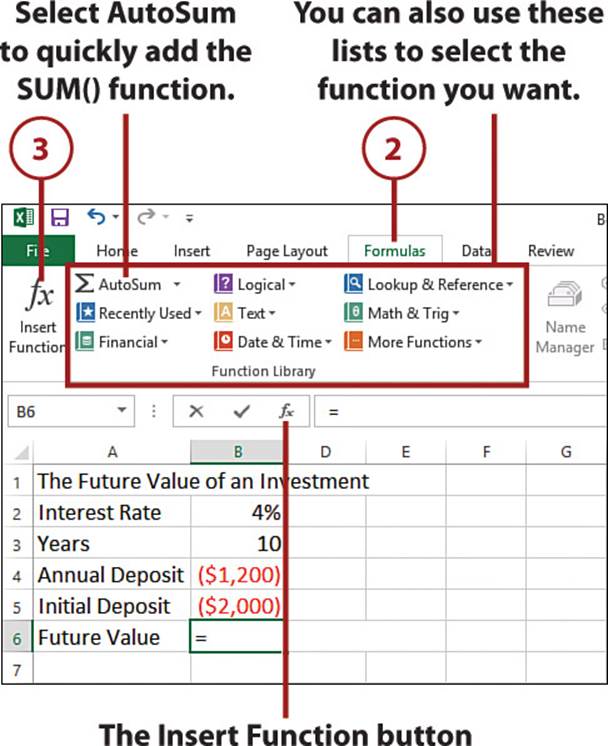
4. In the Or Select a Category list, select the category that contains your function. If you are not sure which category to choose, select All.
The Most Recently Used List
Excel maintains a list of the last 10 functions you have used. If the function you want is one that you used recently, click Most Recently Used in the list of categories, and then use the Select a Function list to click the function if it appears.
5. In the Select a Function list, select the function you want to use.
6. Select OK. Excel displays the Function Arguments dialog box.
7. Enter the values or cell references you want to use for each argument. If you want to use a cell reference, note that you can enter it by tapping the cell.
8. Select OK. Excel inserts the function into the formula.
Building a Table
Excel’s forte is spreadsheet work, of course, but its row-and-column layout also makes it a natural database manager. In Excel, a table is a collection of related information with an organizational structure that makes it easy to find or extract data from its contents. Specifically, a table is a collection of cells that has the following properties:
• Field—A single type of information, such as a name, an address, or a phone number. In Excel tables, each column is a field.
• Field value—A single item in a field. In an Excel table, the field values are the individual cells.
• Field name—A unique name you assign to every table field (worksheet column). These names are always found in the first row of the table.
• Record—A collection of associated field values. In Excel tables, each row is a record.
Convert Cells to a Table
Excel has a number of commands that enable you to work efficiently with table data. To take advantage of these commands, you must convert your data from normal cells to a table.
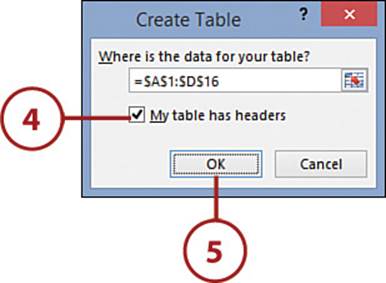
1. Select any cell within the group of cells that you want to convert to a table.
2. Select the Insert tab.
3. Select Table. Excel displays the Create Table dialog box.
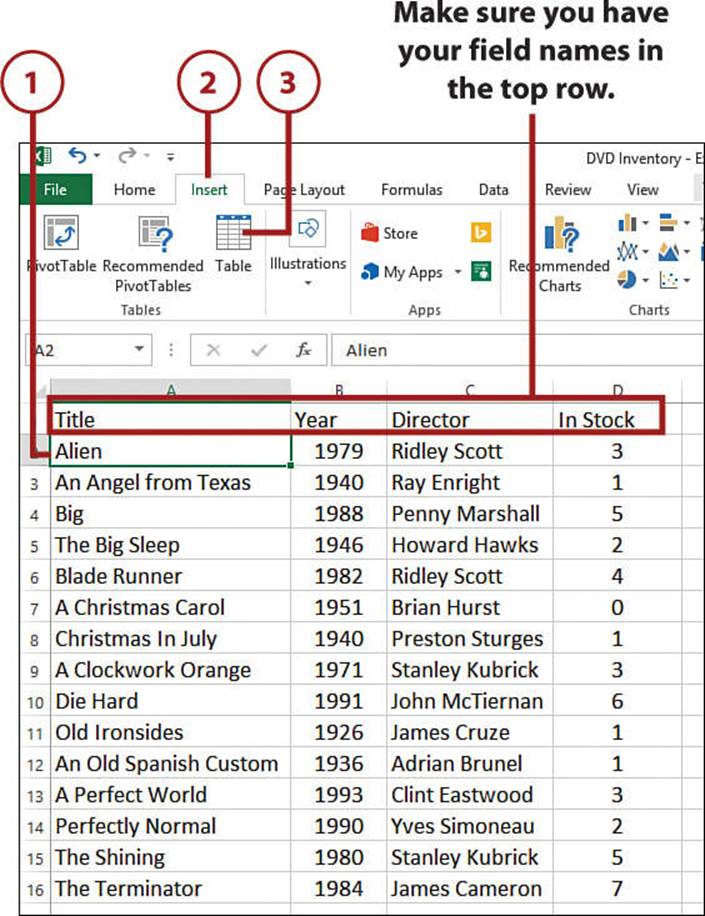
4. If your range has column headers in the top row (as it should), make sure the My Table Has Headers check box is selected.
5. Select OK. Excel converts the cells to a table.
Select Table Elements
Before you can change the layout or formatting of a table, you need to select the part of the table you want to work with. Here are the techniques to use:
• Select a cell—Click the cell.
• Select two or more adjacent cells—Select one of the cells and then click and drag to include the other cells.
• Select a row—Right-click a cell in the row, click Select, and then click Table Row.
• Select two or more adjacent rows—Select at least one cell in each row, right-click the selection, click Select, and then click Table Row.
• Select a column—Right-click a cell in the column, click Select, and then click either Entire Table Column (to include the header) or Table Column Data (to exclude the header).
• Select two or more adjacent columns—Select at least one cell in each column, right-click any cell in the selection, click Select, and then click either Entire Table Column (to include the headers) or Table Column Data (to exclude the headers).
Format a Table
To change the formatting of the table cells, you select the cells you want to work with and then use Excel’s standard formatting tools (font, paragraph, and so on). For more table-specific formatting, you can use the Design tab.
1. Click inside the table.
2. Select the Design tab.
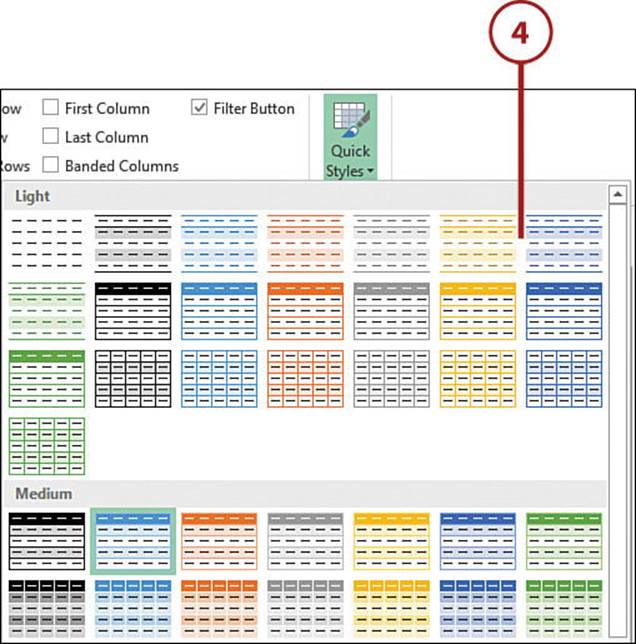
3. Select Quick Styles. Excel opens the Table Quick Styles gallery.
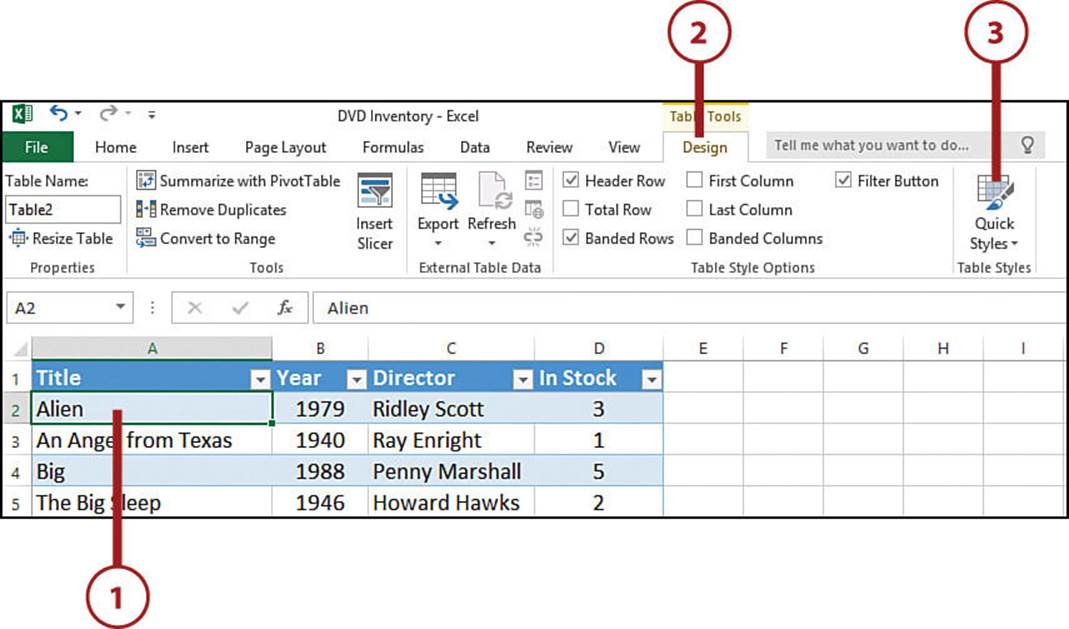
4. Select the style you want to apply to the table.
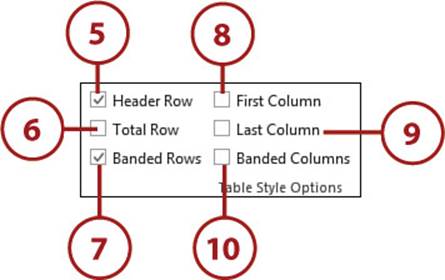
5. Select Header Row to toggle header formatting on and off for the first row. For example, in some styles the first row is given darker shading, top and bottom borders, and a bold font.
6. Select Total Row to toggle the Total row (which shows the totals for the table’s rightmost column) and that row’s total formatting on and off.
7. Select Banded Rows to toggle alternating formatting for all the rows.
8. Select First Column to toggle special formatting on and off for the first column.
9. Select Last Column to toggle special formatting on and off for the last column.
10. Select Banded Columns to toggle alternating formatting for all the columns.
Creating a Custom Table Style
If the predefined table styles aren’t quite what you’re looking for, you can create a custom style to suit your needs. Select Quick Styles to open the Table Quick Styles gallery, and then select New Table Style. In the New Table Style dialog box that opens, select a table element, select Format, and then use the controls to adjust the style’s fonts, colors, borders, and more. Repeat for each table element you want to format, and then select OK.
Add New Rows and Columns
When it’s time to add more data to your table, Excel provides several tools that enable you to expand the table. If you’re adding new items to the table, you need to add more rows; if you’re adding more details to each item, you need to add more columns.
1. To add a new row at the end of the table, select the lower-right cell—that is, the last column of the last row—and press Tab.
2. Select the Home tab.
3. To add a new row above an existing row, position the active cell inside the existing row, select Insert, and then select Insert Table Rows Above.
4. To add a new column to the left of an existing column, position the active cell inside the existing column, select Insert, and then select Insert Table Columns to the Left.
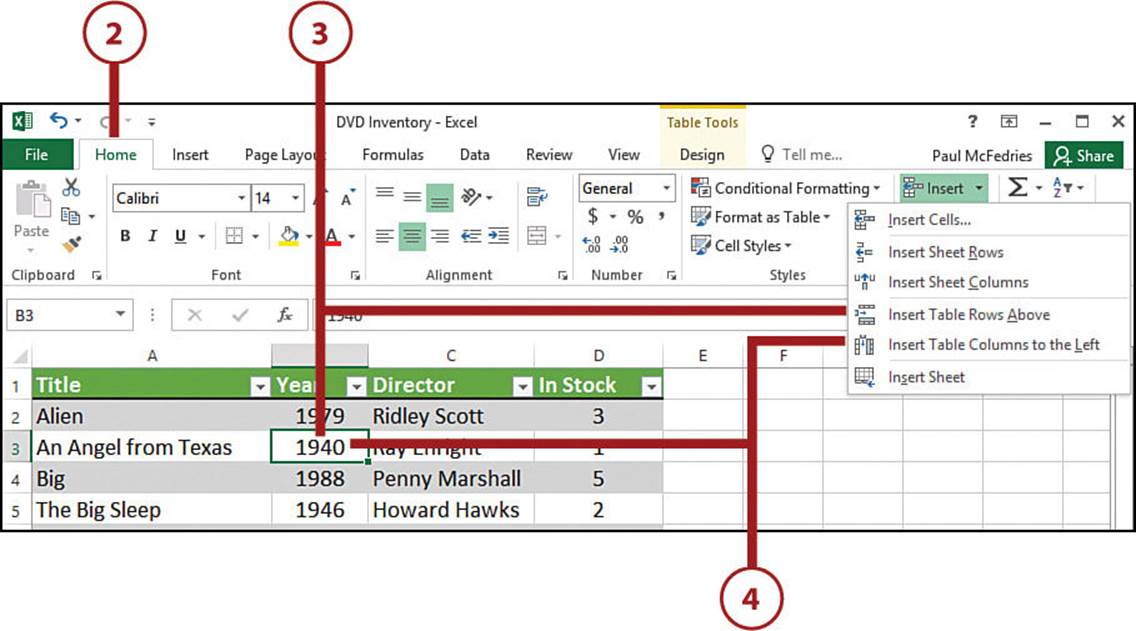
Adding Multiple Rows or Columns
If you want to insert multiple rows or columns, you can insert them all in one operation by first selecting the same number of existing rows or columns. For example, if you select two rows and then select Insert Table Rows Above, Excel inserts two rows above the selected rows.
Delete Rows and Columns
If you find you no longer need a part of your tables—for example, a row or a column—you can delete it. You can also delete multiple rows or columns.
1. Select the Home tab.
2. To delete a row, position the active cell inside the row, select Delete, and then select Delete Table Rows.
3. To delete a column, position the active cell inside the column, select Delete, and then select Delete Table Columns.
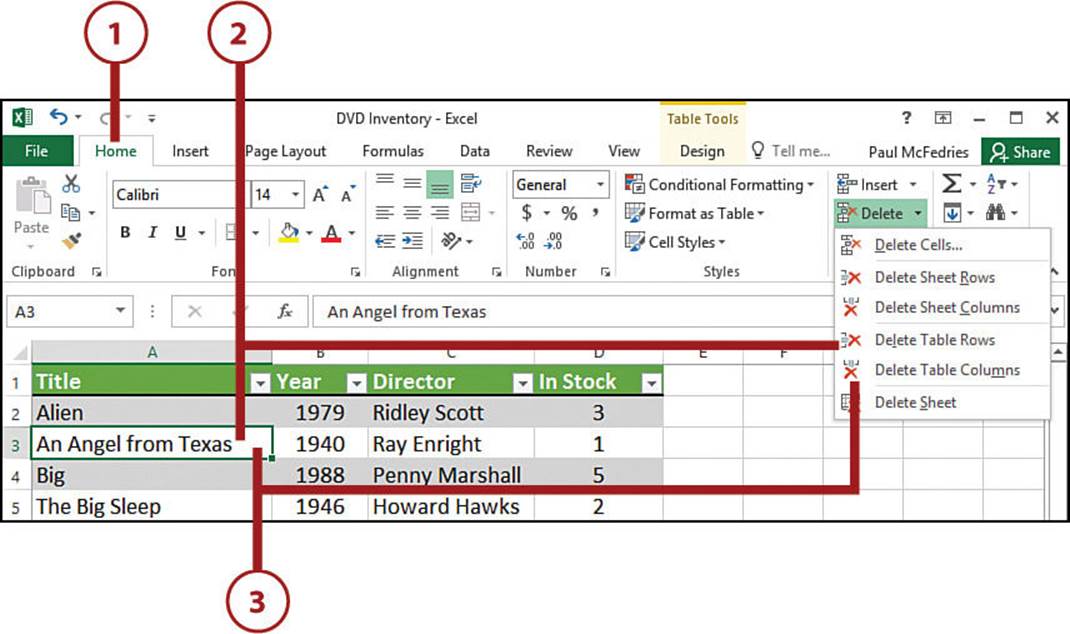
Selecting Elements for Deletion
If you want to delete a row or column, you need only select anywhere inside that row or column. If you want to delete multiple rows or columns, you need to select at least one cell in each row or column.
Sort a Table
One of the advantages of using a table is that you can rearrange the records so that they’re sorted alphabetically or numerically. Sorting enables you to view the data in order by customer name, account number, part number, or any other field.
Excel offers two kinds of sorts:
• Ascending—This type of sort arranges the items in a field from smallest to largest if the field is numeric, from A to Z if the field is text, and from oldest to newest if the field contains date or time data.
• Descending—This sort type arranges the items in a field from largest to smallest if the field contains numbers, from Z to A if the field contains text, and from newest to oldest if the field contains dates or times.
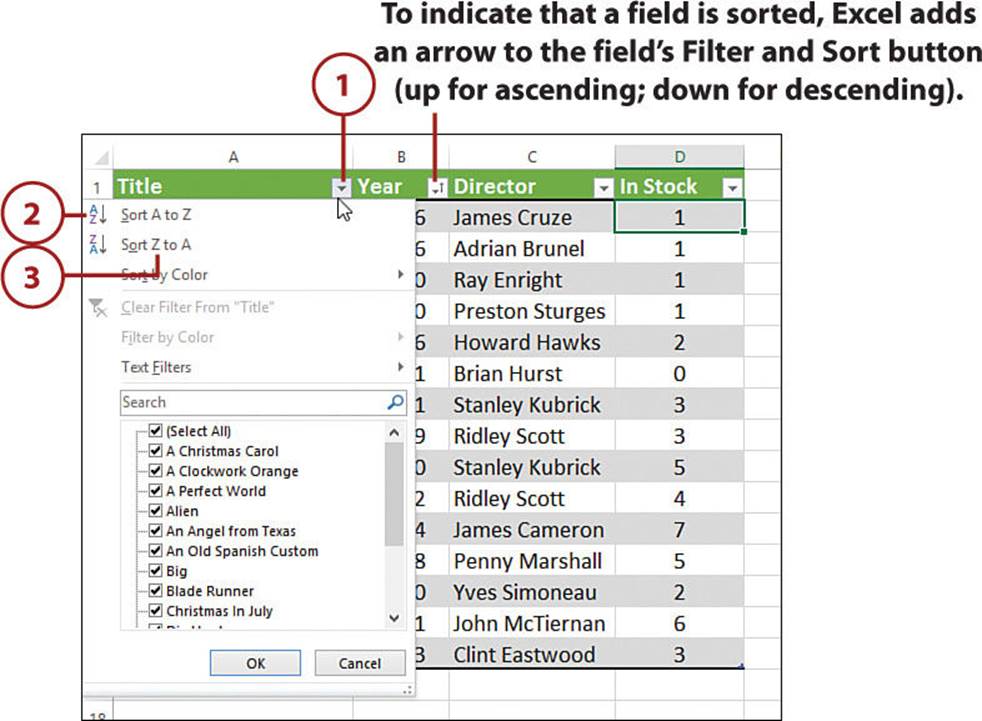
1. Select the Filter and Sort button (the drop-down arrow that appears beside the field header) for the field you want to use for the sort.
2. To sort a text field in ascending order, select Sort A to Z. If the field has numeric values, select Sort Smallest to Largest; if the field has date or time values, select Sort Oldest to Newest.
3. To sort a text field in descending order, select Sort Z to A. If the field has numeric values, select Sort Largest to Smallest; if the field has date or time values, select Sort Newest to Oldest.
Filter a Table
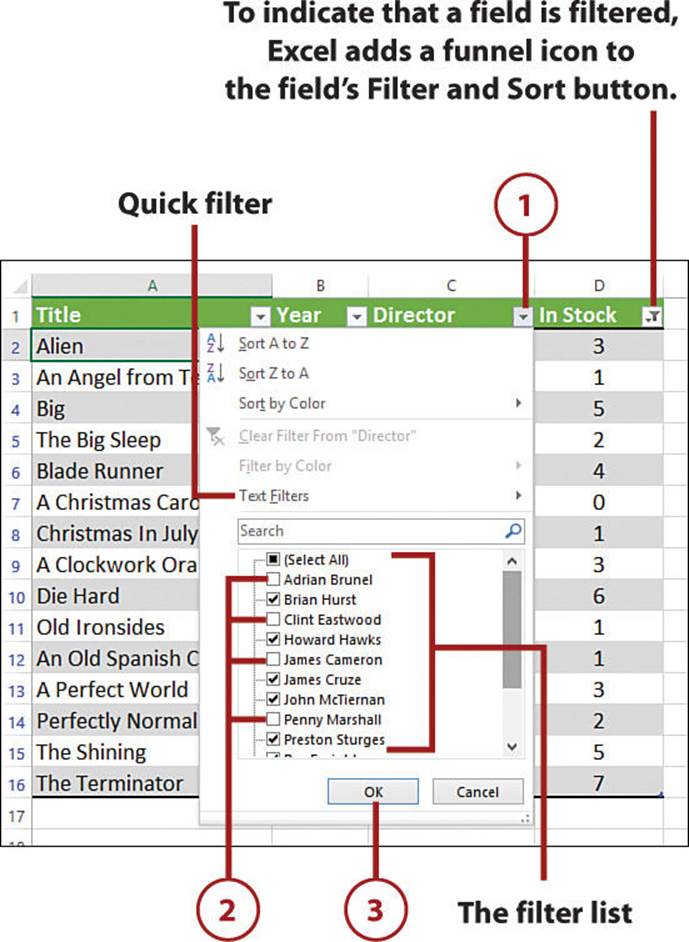
One of the biggest problems with large tables is that it’s often hard to find and extract the data you need. Sorting can help, but in the end, you’re still working with the entire table. You need a way to define the data that you want to work with and then have Excel display only those records onscreen. This is called filtering your data, and Excel’s Filter feature makes filtering out subsets of your data as easy as selecting check boxes from the filter list, a collection of the unique values in the field. When you deselect an item’s check box, Excel temporarily hides all the table records that include that item in the field.
1. Select the Filter and Sort button for the field you want to use for the filter. Excel displays the field’s filter list.
2. Deselect the check box for each item that you want to hide in the table.
3. Select OK.
>>>Go Further: Filtering Using Quick Filters
Besides allowing you to filter a table using a filter list, Excel also offers a set of quick filters that enable you to apply specific criteria. The quick filters you see depend on the data type of the field, but in each case, you access them by clicking a field’s Filter and Sort button and then clicking one of the following commands:
• Number Filters—This command appears when you’re working with a numeric field. It displays a submenu of filters, including Equals, Does Not Equal, Greater Than, Greater Than Or Equal To, Less Than, Less Than Or Equal To, Between, Top 10, Above Average, and Below Average.
• Date Filters—This command appears when you’re working with a date field. It displays a submenu of filters, including Equals, Before, After, Between, Tomorrow, Today, Next Week, This Month, and Last Year.
• Text Filters—This command appears when you’re working with a text field. It displays a submenu of filters, including Equals, Does Not Equal, Begins With, Ends With, Contains, and Does Not Contain.
In some cases, the quick filter doesn’t require any input from you. For example, Above Average filters a table to show just the records that have a field value above the average for the field. However, most of the quick filters require some kind of input from you to complete the filter criteria. For example, Greater Than filters your table to show just the records that have a field value above some value that you specify.
All materials on the site are licensed Creative Commons Attribution-Sharealike 3.0 Unported CC BY-SA 3.0 & GNU Free Documentation License (GFDL)
If you are the copyright holder of any material contained on our site and intend to remove it, please contact our site administrator for approval.
© 2016-2026 All site design rights belong to S.Y.A.