My Office 2016 (2016)
7. Getting More Out of Excel Ranges
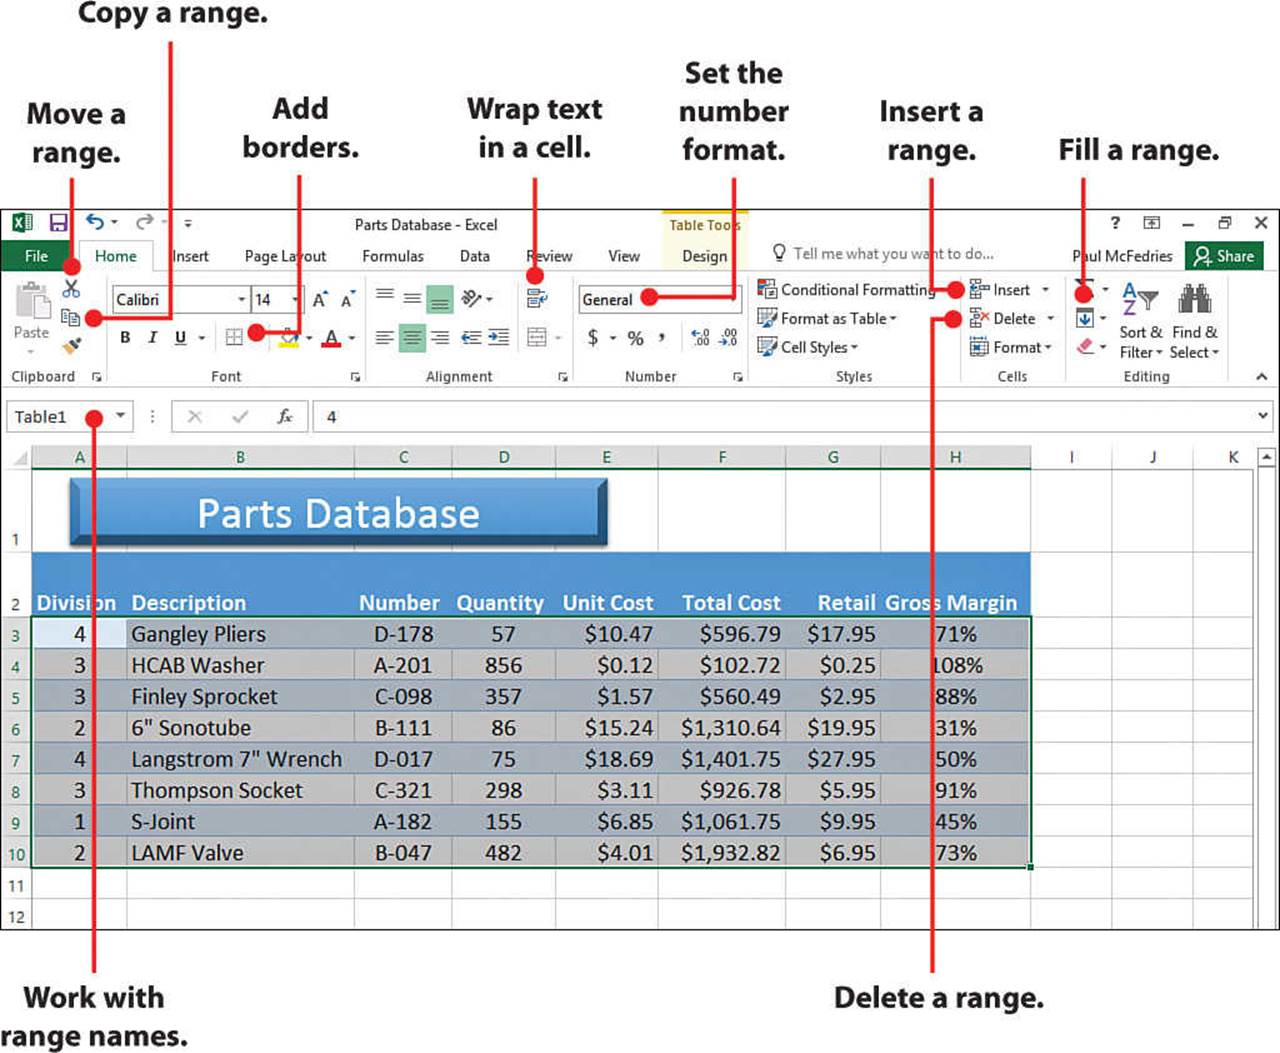
In this chapter, you learn about various techniques for working with Excel ranges, including selecting, filling, copying, moving, deleting, naming, and formatting ranges. Topics include the following:
![]() Selecting ranges
Selecting ranges
![]() Automatically filling a range with data
Automatically filling a range with data
![]() Copying, moving, inserting, and deleting ranges
Copying, moving, inserting, and deleting ranges
![]() Working with named ranges
Working with named ranges
![]() Applying formatting to a range
Applying formatting to a range
For small worksheets, working with individual cells doesn’t usually present a problem. However, as your worksheets get larger, you’ll find that performing operations cell by cell wastes both time and energy. To overcome this, Excel lets you work with multiple cells in a single operation. You can then move, copy, delete, or format the cells as a group.
A group of related cells is called a range. A range can be as small as a single cell and as large as an entire spreadsheet. Most ranges are rectangular groups of adjacent cells. Rectangular ranges, like individual cells, have an address, and this address is given in terms of range coordinates. Range coordinates have the form UL:LR where UL is the address of the cell in the upper-left corner of the range and LR is the address of the cell in the lower-right corner of the range (for example, A1:C5 and D7:G15).
This chapter shows you how to select ranges in Excel, and then how to work with ranges by filling them with data, copying and moving them, inserting and deleting them, applying names to them, and formatting them.
Selecting a Range
Ranges speed up your work by enabling you to perform operations or define functions on many cells at once instead of one at a time. For example, suppose you wanted to copy a large section of a worksheet to another file. If you worked on individual cells, you might have to perform the copy procedure dozens of times. However, by creating a range that covers the entire section, you could do it with a single copy command.
Similarly, suppose you wanted to know the average of a column of numbers running from B1 to B50. You could enter all 50 numbers as arguments in Excel’s AVERAGE() function, but typing AVERAGE(B1:B50) is decidedly quicker.
Select a Range with a Mouse
If you’re using Excel on a PC, the easiest way to select a range is by using the mouse.
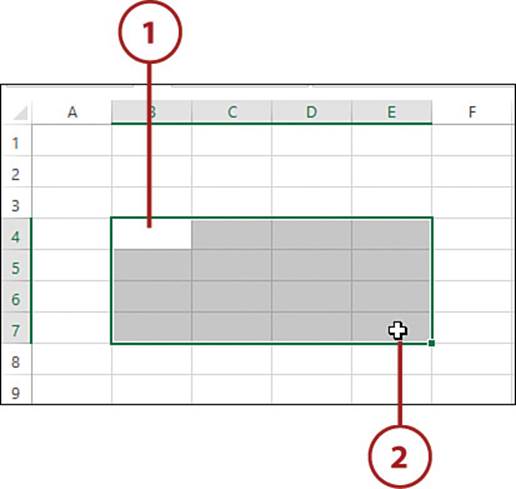
1. Click the first cell in the range you want to select. This is usually the cell in the upper-left corner of the range.
2. Drag the mouse to select the rest of the range. If the initial cell is the upper-left corner of the range, drag the mouse down and to the right until the range you want to work with is selected.
Selecting Entire Rows or Columns
To select an entire row, click the row’s heading. To select multiple rows, click and drag up or down along the row headings. To select an entire column, click the column’s heading. To select multiple columns, click and drag left or right along the column headings.
Select a Range on a Touchscreen
If you’re using Excel on a touchscreen PC, you can use gestures to select a range.
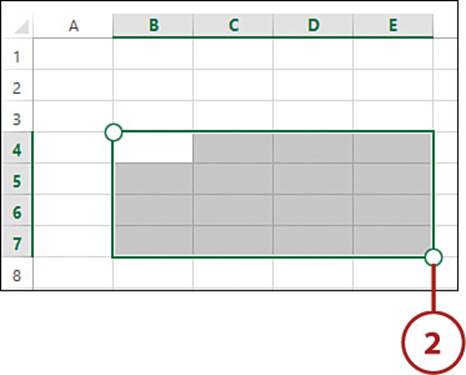
1. Tap the first cell in the range you want to select. This is usually the cell in the upper-left corner of the range.
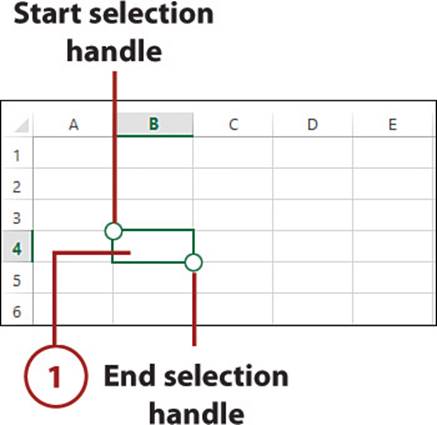
2. Tap and drag the end selection handle down (if you want to include multiple rows in the range) or to the right (to include multiple columns). As you drag the handle, Excel selects the cells.
Selecting Entire Rows or Columns
To select an entire row, tap the row’s heading. If you want to select multiple rows, tap and drag the selection handles left or right. To select an entire column, tap the column’s heading. If you want to select multiple columns, tap and drag the selection handles up or down.
Working with Excel Ranges
Once you’ve selected a range, you need to do something with it. What can you do with a range? Well, perhaps a better question would be what can’t you do with a range? Most Excel tasks you perform involve ranges in some form or another. The next few sections, though, show you only some of the most common range chores, including filling, copying, moving, inserting, and deleting ranges.
Fill a Range with a Specific Value
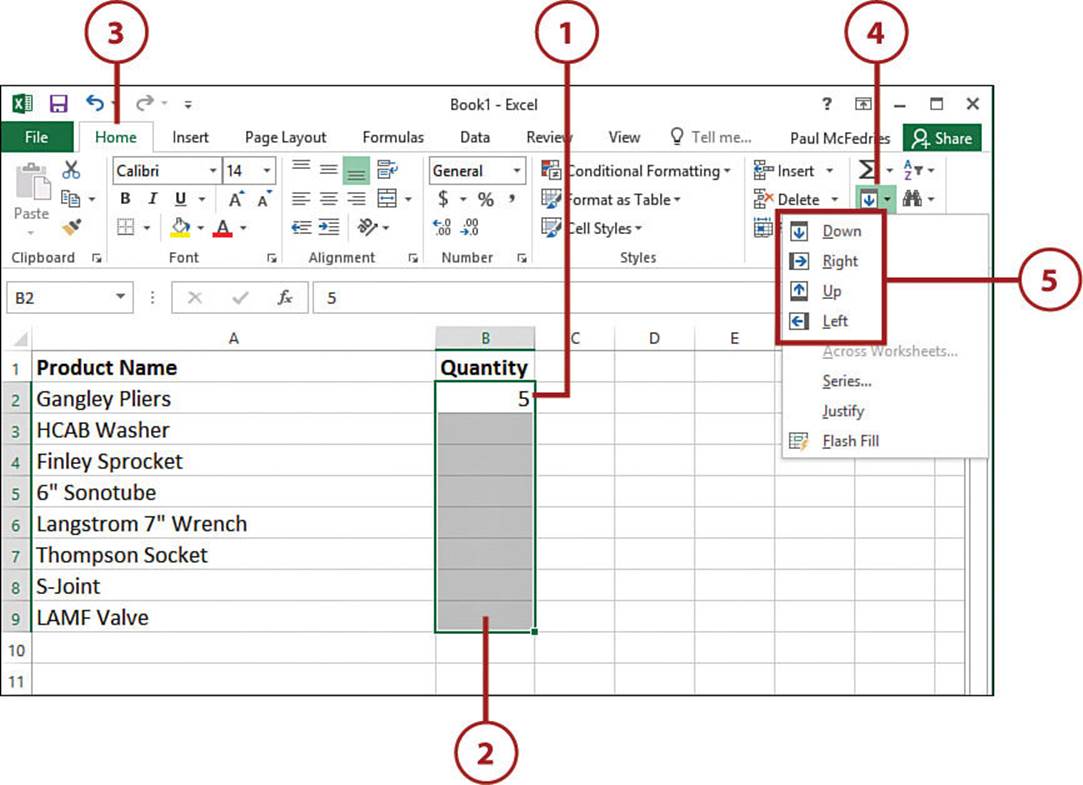
You might occasionally need to fill a range with a particular value. For example, you might want to populate a range with a number for testing purposes, or you might need a value repeated across a range. Rather than type the value in by hand for each cell, you can use Excel’s Fill tool to fill the range quickly.
1. Type the value you want to repeat.
2. Select the range you want to fill, including the initial cell.
3. Select the Home tab.
4. Select Fill.
5. Select the appropriate command from the submenu that appears. For example, if you’re filling a range down from the initial cell, select the Down command.
Keyboard Shortcut
Press Ctrl+D to select Home, Fill, Down; press Ctrl+R to select Home, Fill, Right. You can also select the range you want to fill, type the value or formula, and then press Ctrl+Enter.
Fill a Range with a Series of Values
Worksheets often use text series (such as January, February, March; or Sunday, Monday, Tuesday) and numeric series (such as 1, 3, 5; or 2014, 2015, 2016). Instead of entering these series by hand, you can use Excel’s Series feature to create them automatically.
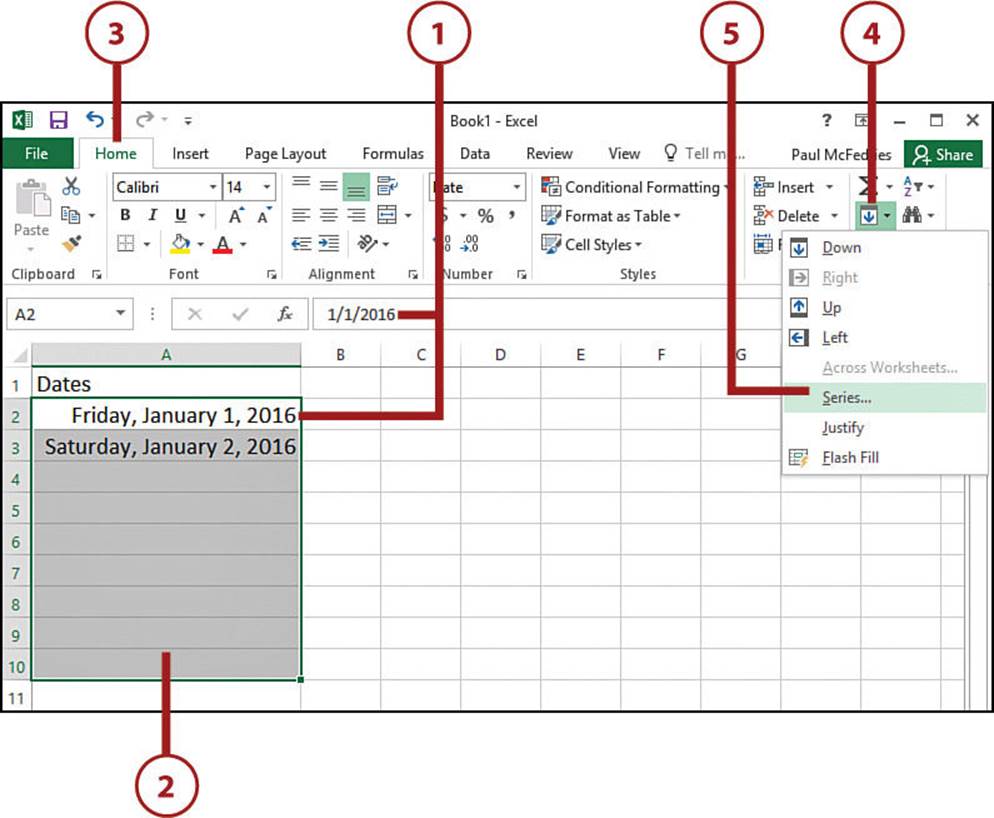
1. Select the first cell you want to use for the series and enter the starting value. If you want to create a series out of a particular pattern (such as 2, 4, 6, and so on), fill in enough cells to define the pattern.
2. Select the entire range you want to fill.
3. Select Home.
4. Select Fill.
5. Select Series. Excel displays the Series dialog box.
6. If you selected a column, select the Columns option; otherwise, select the Rows option.
7. Use the Type group to select the type of series you want. Select the Date option if you’re filling a series of dates. To fill in the range based on the pattern of the initial cell values you entered, select the AutoFill option. Use the Linear option to calculate the next series value by adding the step value (see step 9) to the preceding value in the series.
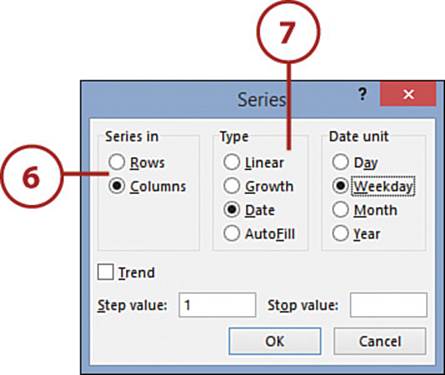
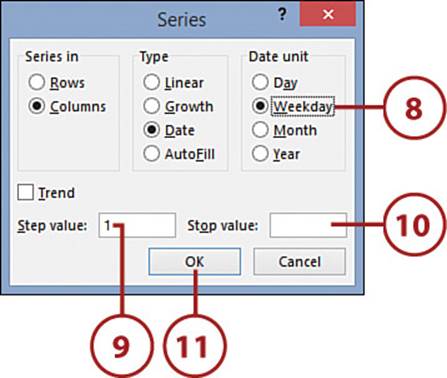
8. If you chose a Date series, select an option that specifies how you want the dates incremented: by Day, Weekday, Month, or Year.
9. If you chose a Linear or Date series type, enter a number in the Step Value box. Excel uses this number to increment each value in the series.
10. To place a limit on the series, enter the appropriate number in the Stop Value box.
11. Click OK. Excel fills in the series and returns you to the worksheet.
>>>Go Further: Using AutoFill
For many series, you can fill the range directly on the worksheet. Begin by entering two or more values—enough to define the range pattern—and then select those values. Move the mouse pointer to the bottom-right corner of the selection (the pointer changes to a cross), and then drag the corner down to the end of the range you want to fill. When you release the mouse, Excel fills the range based on the pattern established by the initial values.
Make a Copy of a Range
The quickest way to become productive with Excel is to avoid reinventing your worksheets. If you have a formula that works, or a piece of formatting that you’ve put a lot of effort into, don’t start from scratch if you need something similar. Instead, make a copy and then adjust the copy as necessary. Note that Excel automatically adjusts formula references in the copied cells.
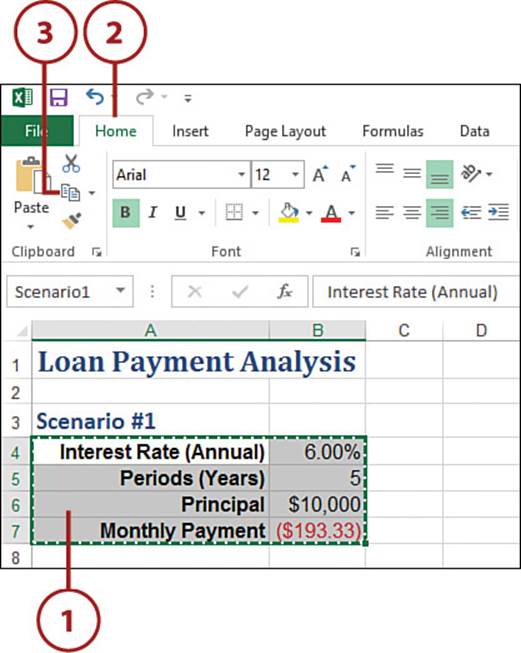
1. Select the range you want to copy.
2. Select the Home tab.
3. Select Copy. Excel copies the contents of the range to the Clipboard and displays a dashed border around the range.
Keyboard Shortcut
You can also run the Copy command by pressing Ctrl+C.
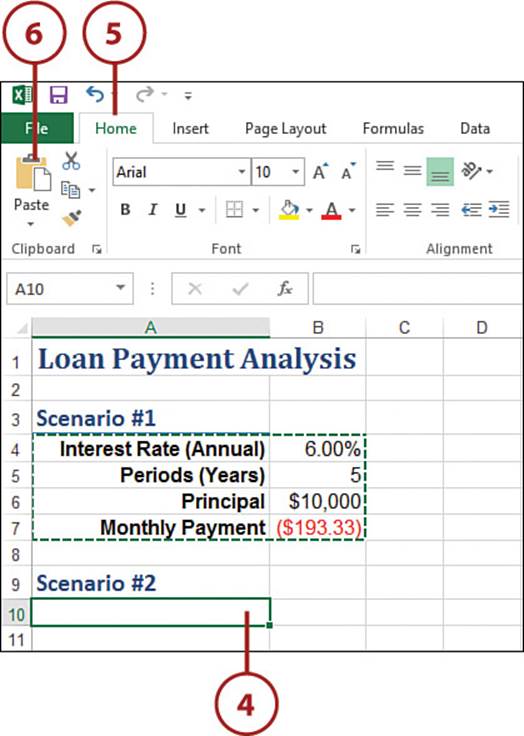
4. Select the upper-left cell of the destination range.
5. Select the Home tab.
6. Select the top half of the Paste button. Excel pastes a copy of the range from the Clipboard to your destination.
Keyboard Shortcut
You can also run the Paste command by pressing Ctrl+V.
It’s Not All Good: Don’t Overwrite Existing Cells
Before copying a range to another area, look at the destination area and make sure you won’t be overwriting any nonblank cells. Remember that you can use the Undo command if you accidentally destroy some data. If you want to insert the range among some existing cells without overwriting existing data, see the “Insert a Range” section later in this chapter.
Move a Range
If a range is in the wrong section of a worksheet, you can move the range to the sheet area that you prefer.
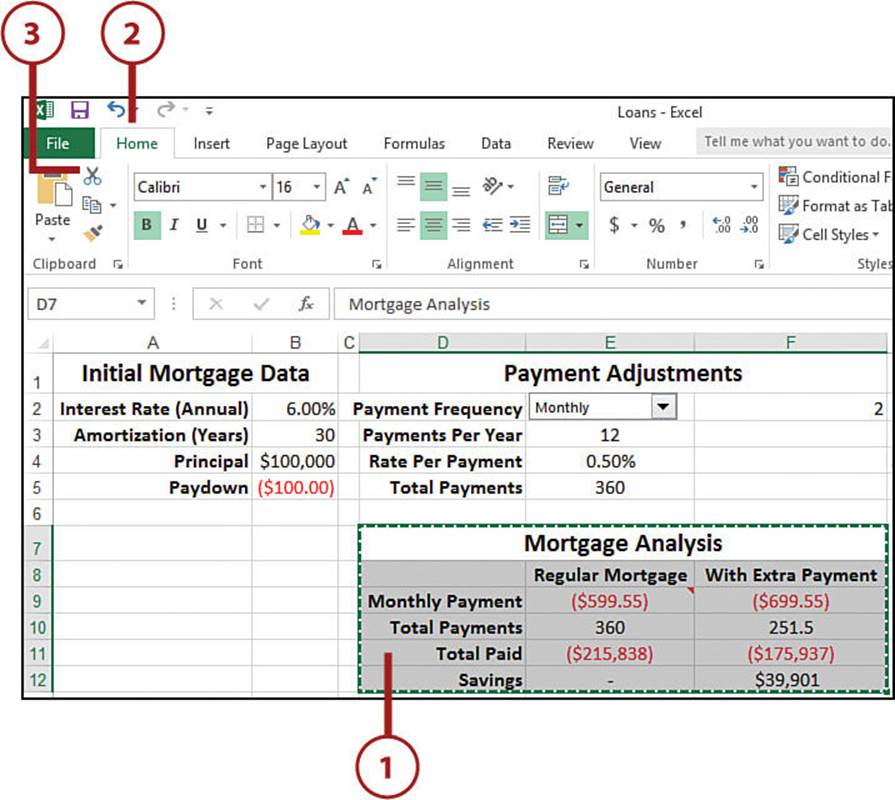
1. Select the range you want to move.
2. Select the Home tab.
3. Select Cut. Excel places the contents of the range on the Clipboard and displays a dashed border around the range.
Keyboard Shortcut
You can also run the Cutd command by pressing Ctrl+X.
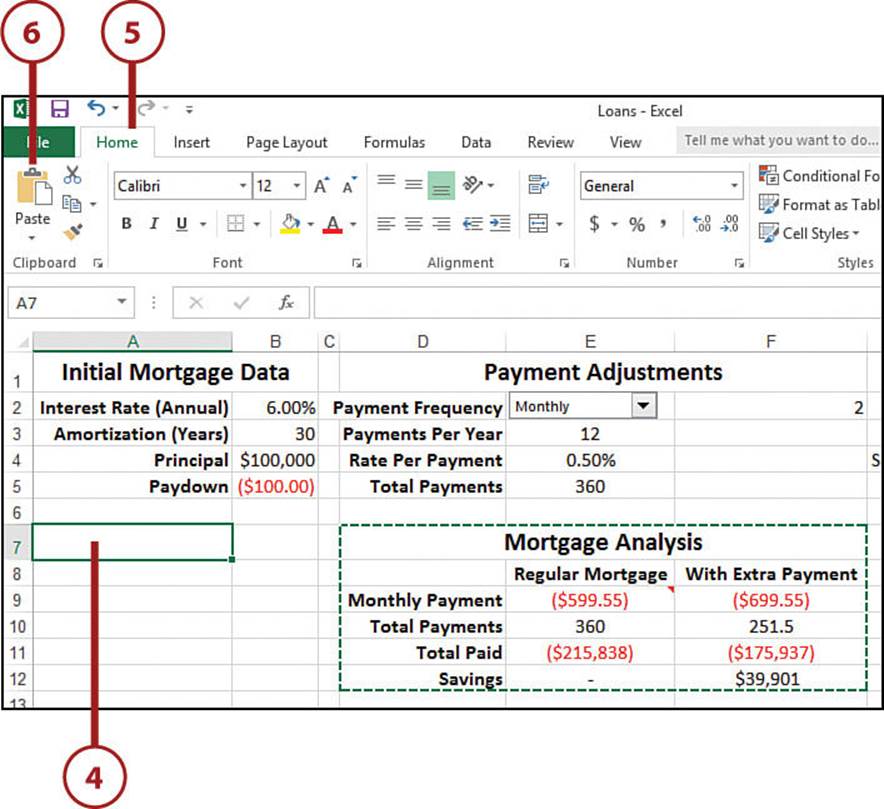
4. Select the upper-left cell of the destination range.
5. Select the Home tab.
6. Select the top half of the Paste button. Excel pastes the range data from the Clipboard to the destination and deletes the original text.
Insert a Range
When you begin a worksheet, you use up rows and columns sequentially as you add data and formulas. Invariably, however, you’ll need to go back and add in some values or labels that you forgot or that you need for another part of the worksheet. When this happens, you need to insert ranges into your spreadsheet to make room for your new information.
1. Select the range where you want the new range to appear. If you’re inserting a horizontal range, select the cells above which you want the new range to appear. If you’re inserting a vertical range, select the cells to the left of which you want the new range to appear.
2. Select the Home tab.
3. Drop down the Insert menu.
4. Select Insert Cells. The Insert dialog box opens.
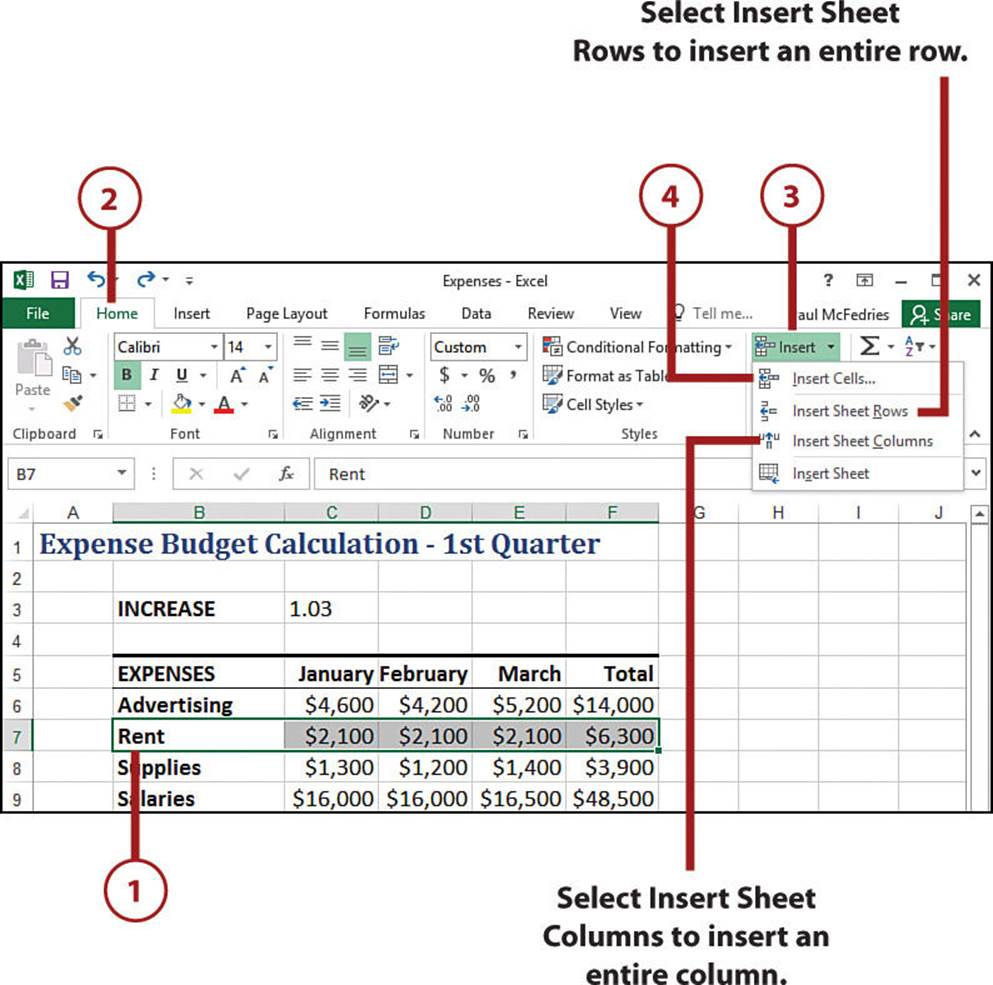
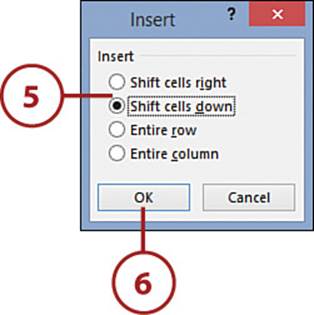
5. Select the option that fits how you want Excel to adjust the existing cells to accommodate your inserted range. For example, if you’re inserting a horizontal range, select Shift Cells Down to make horizontal room for your new range. Similarly, if you’re inserting a vertical range, select Shift Cells Right to make vertical room for your new range.
6. Select OK. Excel inserts the range and shifts the existing cells accordingly.
Delete a Range
When you’re building a worksheet, you often have to remove old or unnecessary data, and that requires you to delete ranges. It’s often easiest to delete an entire row or column, but in some worksheets, you may need to delete only a single cell or a range of cells so as not to disturb the arrangement of surrounding data.
1. Select the range you want to delete.
2. Select the Home tab.
3. Drop down the Delete menu.
4. Select Delete Cells. The Delete dialog box opens.
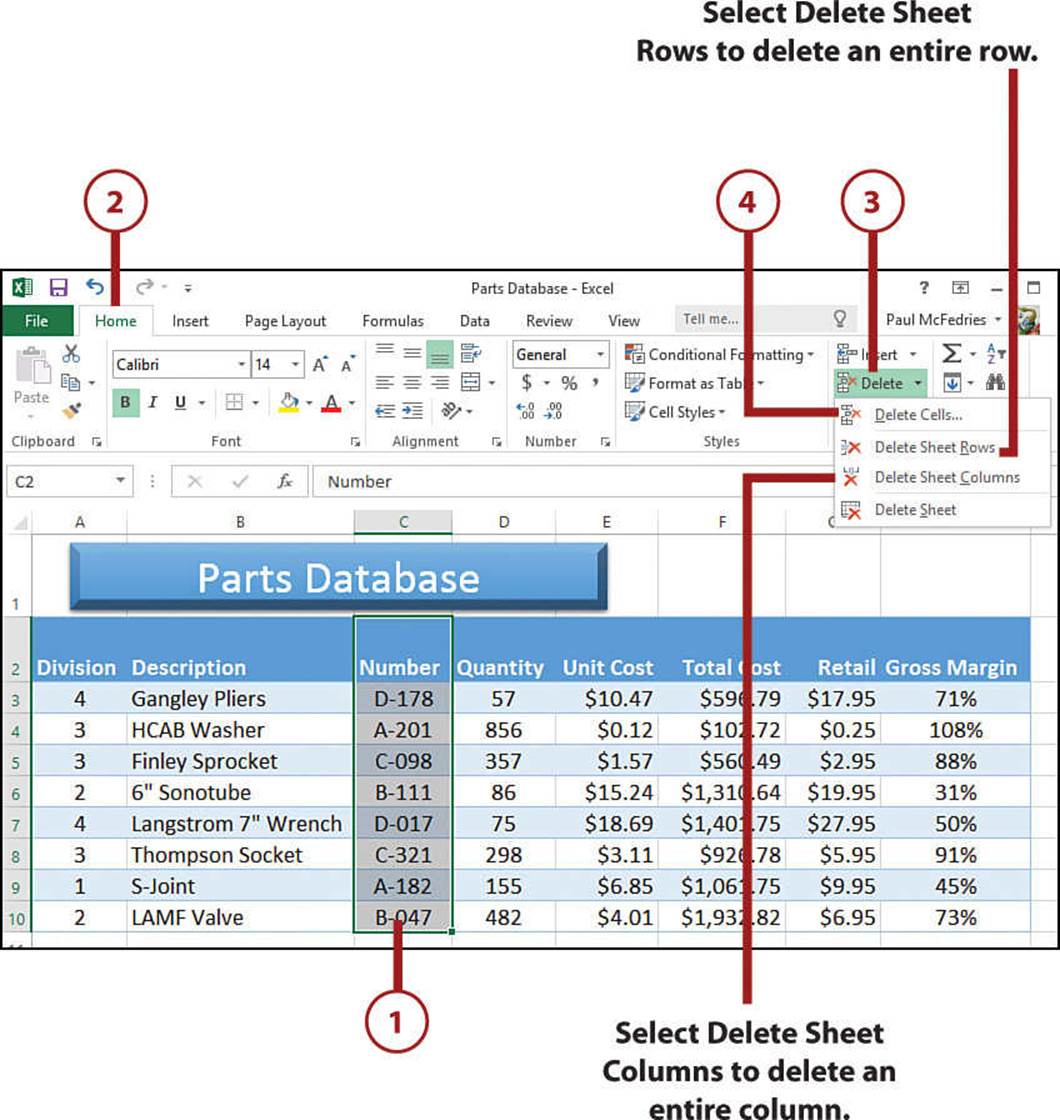
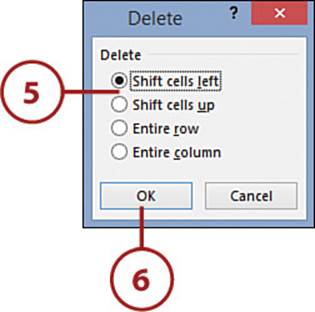
5. Select the option that fits how you want Excel to adjust the existing cells to accommodate your deleted range. For example, if you’re deleting a horizontal range, select Shift Cells Up to close the horizontal gap in your range. Similarly, if you’re deleting a vertical range, select Shift Cells Left to close the vertical gap in your range.
6. Select OK. Excel inserts the range and shifts the existing cells accordingly.
Working with Range Names
Working with multiple cells as a range is much easier than working with the cells individually, but range coordinates are not very intuitive. For example, if you see a formula that uses the function AVERAGE(A1:A25), knowing what the range A1:A25 represents is impossible unless you look at the range itself.
You can make ranges more intuitive using range names, which are labels that you assign to a single cell or to a range of cells. With a name defined, you can use it in place of the range coordinates. For example, assigning the name ClassMarks to a range such as A1:A25 immediately clarifies the purpose of a function such as AVERAGE(ClassMarks).
Excel also makes range names easy to work with by automatically adjusting the coordinates associated with a range name if you move the range or if you insert or delete rows or columns within the range.
Range names are generally flexible, but you need to follow a few restrictions and guidelines:
• The range name can be no longer than 255 characters.
• The range name must begin with either a letter or the underscore character (_). For the rest of the name, you can use any combination of characters, numbers, or symbols, except spaces. For multiple-word names, separate the words by using the underscore character or by mixing case (for example, August_Expenses or AugustExpenses). Excel doesn’t distinguish between uppercase and lowercase letters in range names.
• Don’t use cell addresses (such as Q1) or any of the operator symbols (such as +, –, *, /, <, >, and &) because they could cause confusion if you use the name in a formula.
• Keep your names as short as possible to reduce typing, but long enough that the name retains some of its meaning. NetProfit16 is faster to type than Net_Profit_For_Fiscal_Year_2016, and it’s certainly clearer than the more cryptic NetPft16.
The Name box to the left of Excel’s Formula bar usually just shows you the address of the active cell. However, the Name box also comes with two extra features that are useful when you are working with range names: After you define a name, it appears in the Name box whenever you select the range; the Name box contains a list of the defined names. To select a named range quickly, drop down the list and click the name you want.
Name a Range
The Name box is also the quickest way to define a range name.
1. Select the range you want to name.
2. Click inside the Name box to display the insertion point.
3. Type the name you want to use.
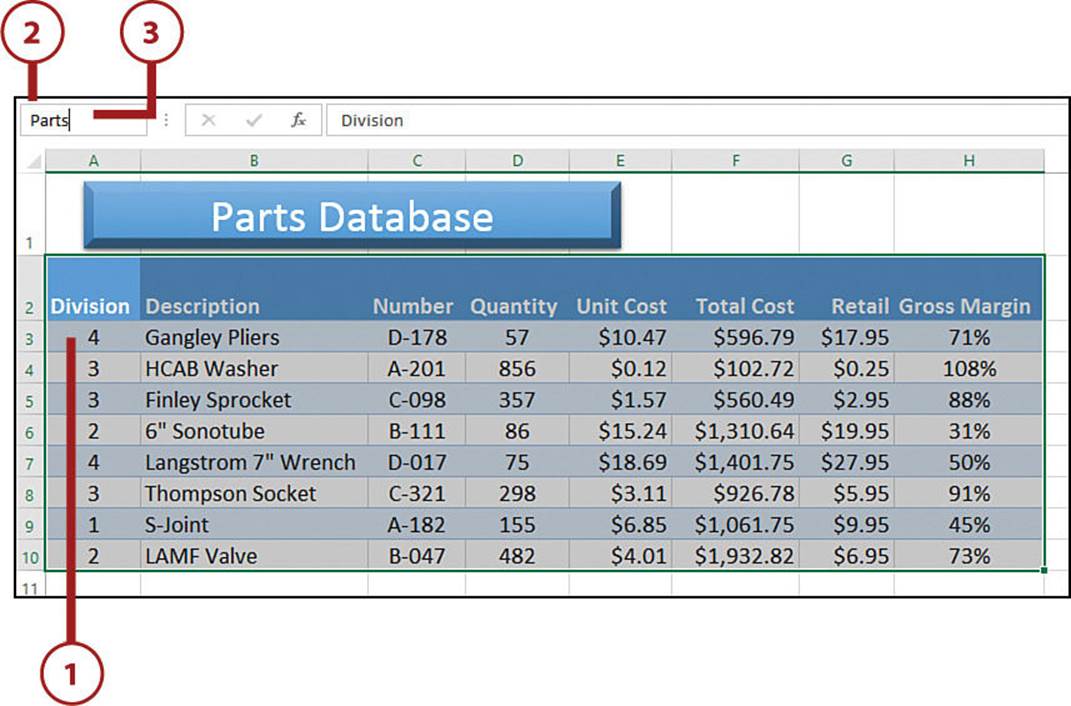
4. Press Enter. Excel defines the new name automatically.
>>>Go Further: Naming a Range Using Worksheet Text
If you have a few ranges to name—for example, a series of rows or columns—you can speed things up by using the worksheet text adjacent to each range as the range name. To try this, first select the range of cells you want to name, including the appropriate text cells that you want to use as the range names. Select the Formulas tab and then select Create from Selection. Excel displays the Create Names from Selection dialog box, and Excel guesses where the text for the range name is located and activates the appropriate check box (such as Top Row or Left Column). If this isn’t the check box you want, deselect it and then select the appropriate one. Click OK.
Formatting a Range
Your worksheets must produce the correct answers, of course, so most of your Excel time should be spent on getting your data and formulas entered accurately. However, you also need to spend some time formatting your work, particularly if other people will be viewing or working with thespreadsheet. Labels, data, and formula results that have been augmented with fonts, borders, alignments, numeric formats, and other formatting are almost always easier to read and understand than unformatted sheets.
Learning About Data Formats
One of the best ways to improve the readability of worksheets is to display data in a format that is logical, consistent, and straightforward. Formatting currency amounts with leading dollar signs, percentages with trailing percent signs, and large numbers with commas are a few of the ways you can improve your spreadsheet style.
When you enter numbers in a worksheet, Excel removes any leading or trailing zeros. For example, if you enter 0123.4500, Excel displays 123.45. The exception to this rule occurs when you enter a number that’s wider than the cell. In this case, Excel usually expands the width of the column to fit the number. However, in some cases, Excel tailors the number to fit the cell by rounding off some decimal places. For example, the number 123.45678 might be displayed as 123.4568. Note that, in this case, the number is changed for display purposes only; Excel still retains the original number internally.
When you create a worksheet, each cell uses this format, known as the general number format, by default. If you want your numbers to appear differently, you can choose from among Excel’s six categories of numeric formats:
• Number—The Number format has three components: the number of decimal places (0–30), whether the thousands separator (,) is used, and how negative numbers are displayed. For negative numbers, you can display the number in four ways: with a leading minus sign; in red; surrounded by parentheses; or in red surrounded by parentheses.
• Currency—The Currency format is similar to the Number format, except that the thousands separator is always used and the number appears with a leading dollar sign ($).
• Accounting—The Accounting format is the same as the Currency format, except Excel displays the dollar sign ($) flush left in the cell. All negative entries are displayed surrounded by parentheses.
• Percentage—The Percentage format displays the number multiplied by 100, with a percent sign (%) to the right of the number. For example, .506 is displayed as 50.6%. You can display 0–30 decimal places.
• Fraction—The Fraction format enables you to express decimal quantities as fractions.
• Scientific—The Scientific format displays the most significant number to the left of the decimal, 2–30 decimal places to the right of the decimal, and then the exponent. So, 123000 is displayed as 1.23E+05.
The quickest way to format numbers is to specify the format as you enter your data. For example, if you begin a dollar amount with a dollar sign ($), Excel automatically formats the number as Currency. Similarly, if you type a percent sign (%) after a number, Excel automatically formats the number as Percentage. Here are a few more examples of this technique. Note that you can enter a negative value using either the minus sign (-) or parentheses.
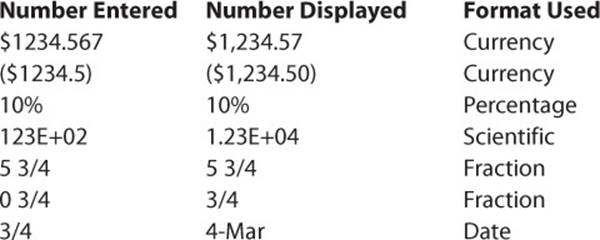
Entering a Simple Fraction
Excel interprets a simple fraction such as 3/4 as a date (March 4, in this case). Always include a leading zero, followed by a space, if you want to enter a simple fraction from the Formula bar.
If you include dates or times in your worksheets, you need to make sure that they’re presented in a readable, unambiguous format. For example, most people would interpret the date 8/5/16 as August 5, 2016. However, in some countries, this date would mean May 8, 2016. Similarly, if you use the time 2:45, do you mean a.m. or p.m.? To avoid these kinds of problems, you can use Excel’s built-in date and time formats, listed in Table 7.1.
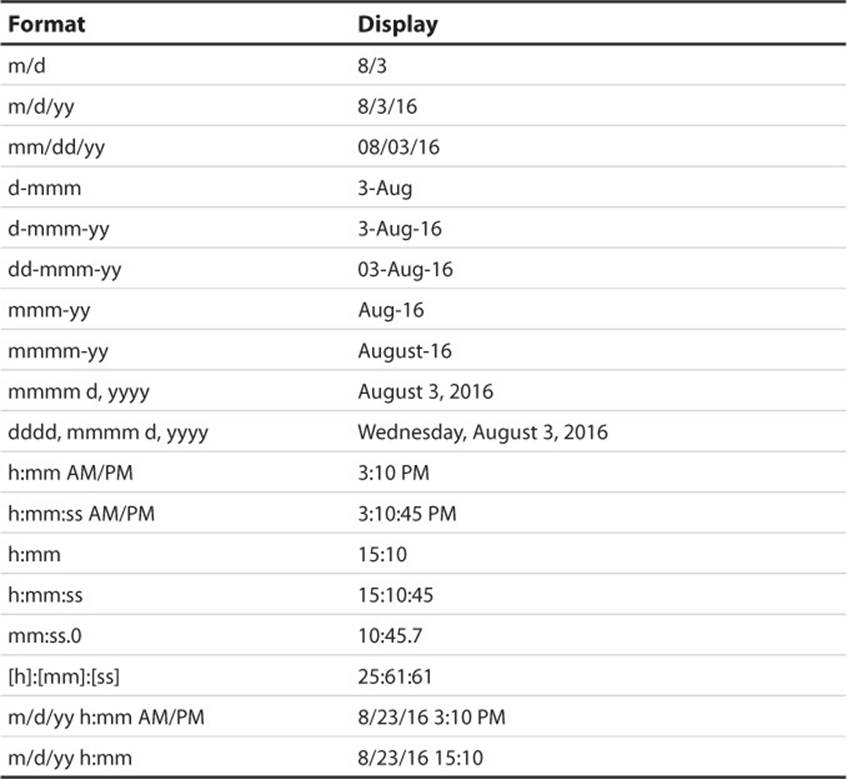
Table 7.1 Excel’s Date and Time Formats
You use the same methods to select date and time formats that you used for numeric formats. In particular, you can specify the date and time format as you input your data. For example, entering Jan-16 automatically formats the cell with the mmm-yy format. You also have the following commands available:
• Short Date—Choose this command to display a date using the mm/dd/yyyy format.
• Long Date—Choose this command to display a date using the dddd, mmmm d, yyyy.
• Time—Choose this command to display a time using the hh:mm:ss AM/PM format.
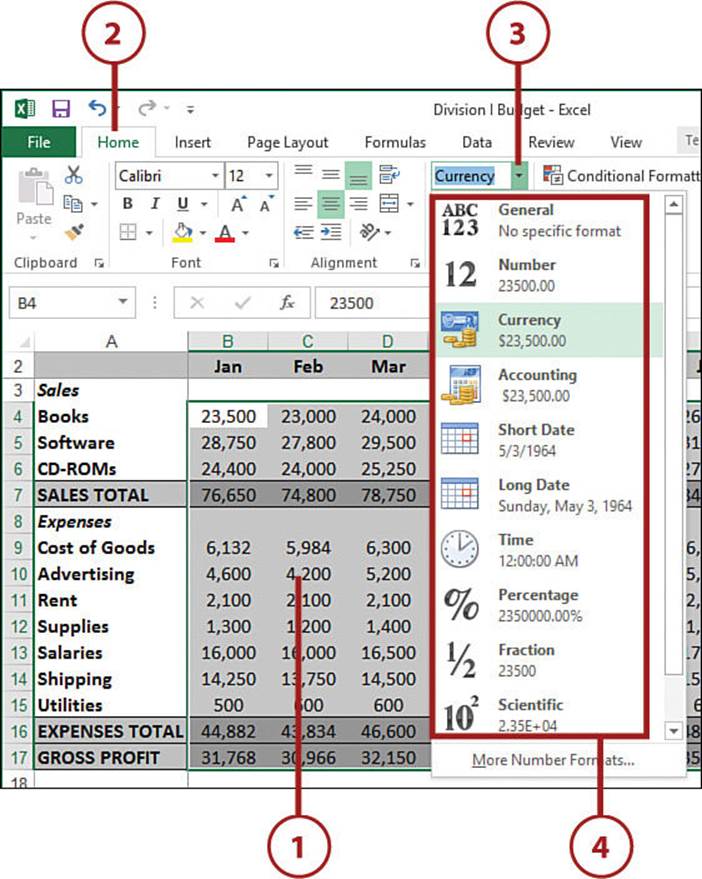
Apply a Numeric or Date Format
Specifying the numeric format as you enter a number is fast and efficient because Excel guesses the format you want to use. Unfortunately, Excel sometimes guesses wrong (for example, interpreting a simple fraction as a date). In any case, you don’t have access to all the available formats (for example, displaying negative dollar amounts in red). To overcome these limitations, you can select your numeric formats from a list.
1. Select the cell or range of cells to which you want to apply the new format.
2. Select the Home tab.
3. Drop down the Number Format list. Excel displays its built-in formats.
4. Select the format you want to use. Excel applies the numeric format to the cell or range.
Customizing Numeric Formats
To get a bit more control over the numeric formats, drop down the Number Format list and then select More Number Formats. The Number tab of the Format Cells dialog box enables you to specify the number of decimal places, the currency symbol, and more.
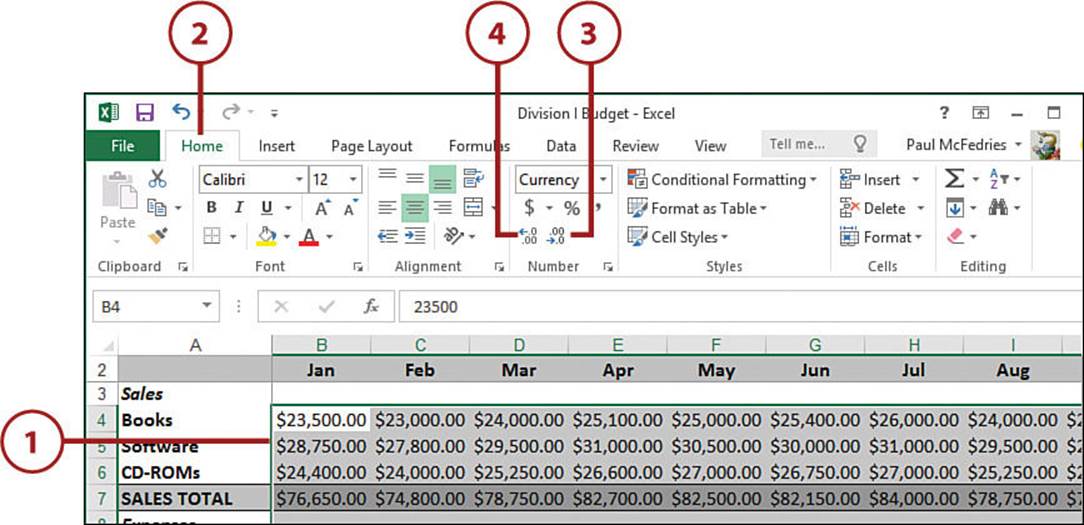
Control the Number of Decimal Places
You can make your numeric values easier to read and interpret by adjusting the number of decimal places that Excel displays. For example, you might want to ensure that all dollar-and-cent values show two decimal places, while dollar-only values show no decimal places. You can either decrease or increase the number of decimal places that Excel displays.
1. Select the range you want to format.
2. Select the Home tab.
3. In the Number group, select the Decrease Decimal button. Excel decreases the number of decimal places by one.
4. To increase the number of decimal places instead, select the Increase Decimal button.
Handling Multiple Numbers of Decimal Places
How does Excel handle situations in which the selected range has values that display different numbers of decimal places? In this case, Excel uses the value that has the most displayed decimal places as the basis for formatting all the values. For example, if the selected range has values that display zero, one, two, or four decimal places, Excel uses the value with four decimal places as the basis. If you click Decrease Decimal, Excel displays every value with three decimal places; if you click Increase Decimal, Excel displays every value with five decimal places.
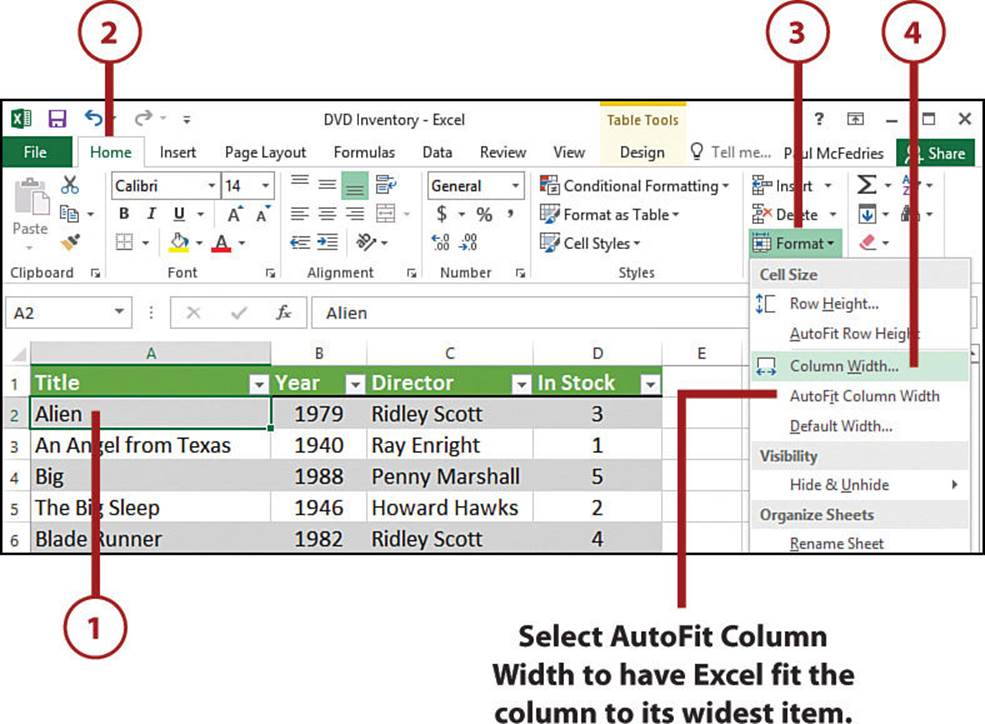
Resize Columns
You can use column width adjustments to improve the appearance of your worksheet in a number of different ways. For example, if you’re faced with a truncated text entry or a number that Excel shows as ######, you can enlarge the column so the entry can appear in full.
1. Select at least one cell in each column you want to resize.
2. Select the Home tab.
3. Select Format.
4. Select Column Width. Excel displays the Column Width dialog box.
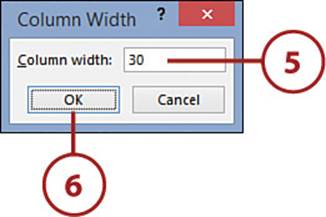
5. In the Column Width text box, type the width you want.
6. Select OK. Excel sets the column width and returns you to the worksheet.
Resizing a Column with a Mouse
It’s often faster to resize a column using the mouse. Move the mouse pointer to the column header area and position the pointer at the right edge of the column you want to resize. The mouse pointer changes to a two-headed horizontal arrow with a vertical bar in the middle. Either drag the edge of the column right (to increase the width) or left (to decrease the width), or double-click to automatically size the column to its widest entry.
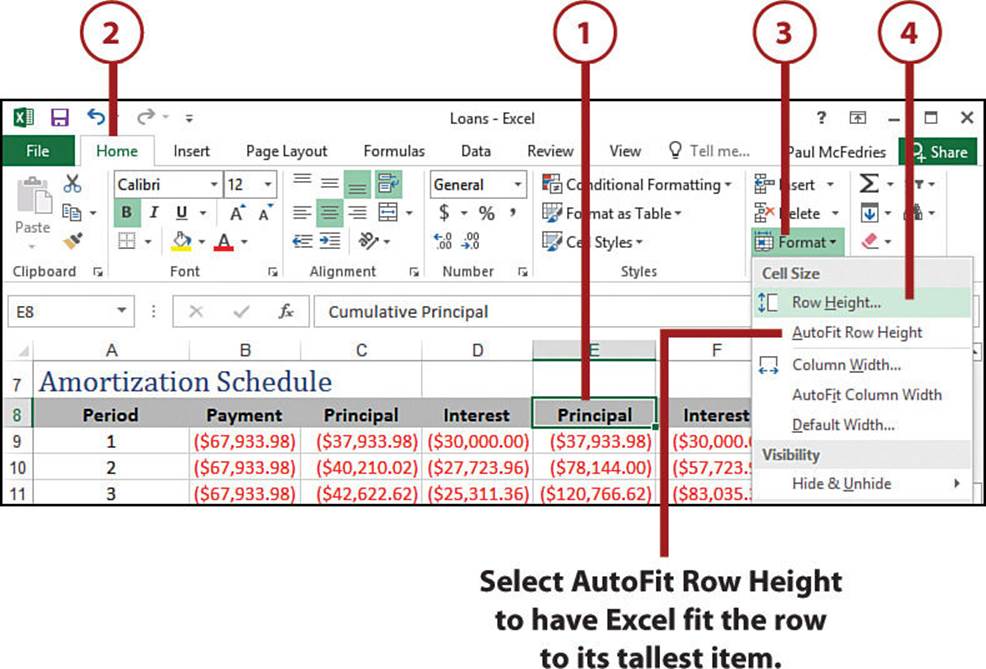
Resize Rows
Although Excel normally adjusts row heights automatically to accommodate the tallest font in a row, you can make your own height adjustments to give your worksheet more breathing room or to reduce the amount of space taken up by unused rows.
1. Select at least one cell in each row you want to resize.
2. Select the Home tab.
3. Select Format.
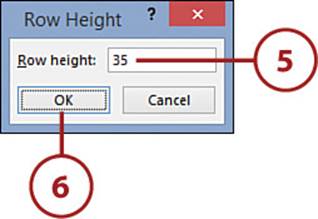
4. Select Row Height. Excel displays the Row Height dialog box.
5. In the Row Height text box, type the height you want.
6. Select OK. Excel sets the row height and returns you to the worksheet.
Resizing a Row with a Mouse
To adjust the row height with a mouse, move the mouse pointer to the row header area and position the pointer at the bottom edge of the row you want to resize. The mouse pointer changes to a two-headed vertical arrow with a horizontal bar in the middle. Either drag the edge of the row up (to increase the height) or down (to decrease the height), or double-click to automatically size the row to its tallest entry.
Add Borders
Excel lets you place borders of patterns around your worksheet cells or ranges. This is useful for enclosing different parts of the worksheet, defining data entry areas, and separating headings from data. You can also use borders to make a range easier to read. For example, if a range has totals on the bottom row, you can add a border above the totals.
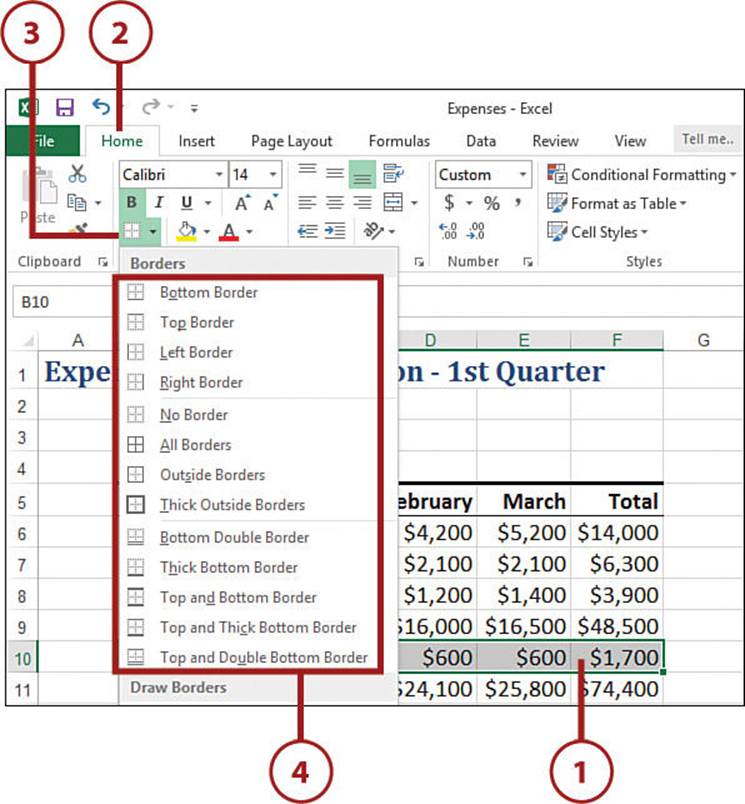
1. Select the range you want to format.
2. Select the Home tab.
3. Select Borders. Excel displays a list of border types.
4. Select the border type you want to use. Excel applies the border to the range.
Wrap Text Within a Cell
If you type more text in a cell than can fit horizontally, Excel either displays the text over the next cell if that cell is empty or displays only part of the text if the next cell contains data. To prevent Excel from showing only truncated cell data, you can format the cell to wrap text within the cell. Excel then increases the height of the row to ensure that all the text is displayed.
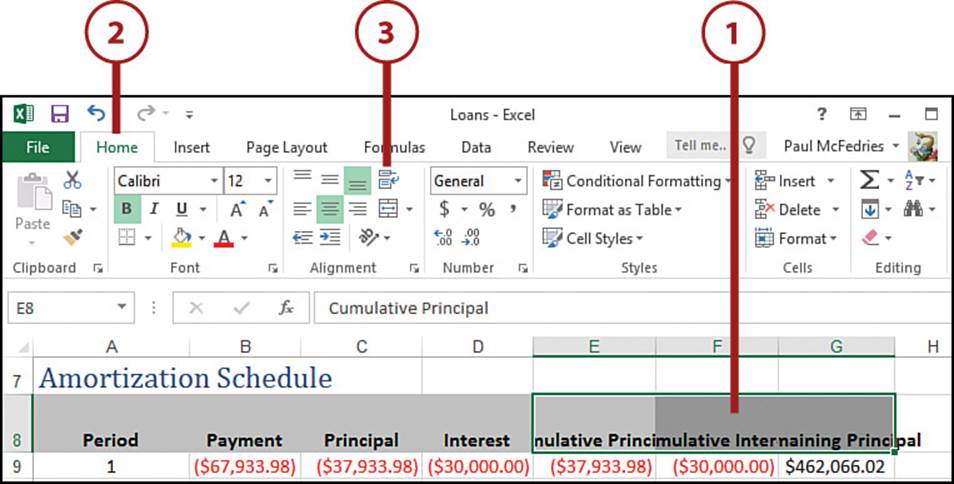
1. Select the range you want to format.
2. Click the Home tab.
3. In the Alignment group, click Wrap Text. Excel wraps the text as needed within each cell in the range and then increases the height of the row to ensure that all the text is displayed.
All materials on the site are licensed Creative Commons Attribution-Sharealike 3.0 Unported CC BY-SA 3.0 & GNU Free Documentation License (GFDL)
If you are the copyright holder of any material contained on our site and intend to remove it, please contact our site administrator for approval.
© 2016-2026 All site design rights belong to S.Y.A.