MCSA Windows Server 2012 R2 Administration Study Guide Exam 70-411 (2015)
Chapter 1
Manage and Maintain Servers
THE FOLLOWING 70-411 EXAM OBJECTIVES ARE COVERED IN THIS CHAPTER:
1. ![]() Deploy and manage server images
Deploy and manage server images
§ Install the Windows Deployment Services (WDS) role
§ Configure and manage boot, install, and discover images
§ Update images with patches, hotfixes, and drivers
§ Install features for offline images
§ Configure driver groups and packages
2. ![]() Implement patch management
Implement patch management
§ Install and configure the Windows Server Update Services (WSUS) role
§ Configure group policies for updates
3. ![]() Configure client-side targeting
Configure client-side targeting
§ Configure WSUS synchronization
§ Configure WSUS groups
§ Manage patch management in mixed environments
4. ![]() Monitor servers
Monitor servers
§ Configure Data Collector Sets (DCS)
§ Configure alerts
§ Monitor real-time performance
§ Monitor virtual machines (vms)
§ Monitor events
§ Configure event subscriptions
§ Configure network monitoring
§ Schedule performance monitoring
We have already discussed how to set up clients on a network and how to keep their systems running on that network. In this chapter, we will start the Windows Deployment Services. We will then turn the discussion to keeping your systems updated using Windows Server Update Services (WSUS).
Another important task of an IT team is to keep the network up and running quickly and efficiently. Keeping your network running at its peak performance is one way to make sure your end users continue to use the network and its resources without problems or interruptions. Remember, everyone has clients—salespeople have theirs, accountants have theirs, and so do we as system administrators. Our clients are the end users, and it’s our job to make sure that our clients can do their jobs.
When you are working with servers, it is important you make sure that your system’s information is safely backed up. Backups become useful when you lose data because of system failures, file corruptions, or accidental modifications of information. As consultants, we can tell you from experience that backups are among the most important tasks that an IT person performs daily.
Sometimes, performance optimization can feel like a luxury, especially if you can’t get your domain controllers to the point where they are actually performing the services for which you intended them, such as servicing printers or allowing users to share and work on files. The Windows Server 2012 R2 operating system has been specifically designed to provide high-availability services solely intended to keep your mission-critical applications and data accessible, even in times of disaster. Occasionally, however, you might experience intermittent server crashes on one or more of the domain controllers or other computers in your environment.
The most common cause of such problems is a hardware configuration issue. Poorly written device drivers and unsupported hardware can cause problems with system stability. Failed hardware components (such as system memory) may do so as well. Memory chips can be faulty, electrostatic discharge can ruin them, and other hardware issues can occur. No matter what, a problem with your memory chip spells disaster for your server.
Third-party hardware vendors usually provide utility programs with their computers that can be used for performing hardware diagnostics on machines to help you find problems. These utilities are a good first step in resolving intermittent server crashes. When these utility programs are used in combination with the troubleshooting tips provided in this and other chapters of this book, you should be able to pinpoint most network-related problems that might occur.
In this chapter, I’ll cover the tools and methods used for measuring performance and troubleshooting failures in Windows Server 2012 R2. Before you dive into the technical details, however, you should thoroughly understand what you’re trying to accomplish and how you’ll meet this goal.
Knowing How to Locate and Isolate Problems
In a book such as this, it would be almost impossible to cover everything that could go wrong with your Windows Server 2012 R2 system. This book covers many of the most common issues that you might come across, but almost anything is possible. Make sure you focus on the methodology used and the steps required to locate and isolate a problem—even if you are not 100 percent sure about the cause of the problem. Use online resources to help you locate and troubleshoot the problem, but don’t believe everything you read (some things that are posted online can be wrong or misleading). Test your changes in a lab environment, and try to read multiple sources. Always use Microsoft Support (http://support.microsoft.com/) as one of your sources because this site is most likely the right source for information. You won’t be able to find and fix everything, but knowing where to find critical information that will help you in your efforts never hurts. One of the tools that many of us in the industry use is Microsoft TechNet. The full version of TechNet (a paid subscription) is a resource that will help you find and fix many real-world issues.
Using Windows Deployment Services
In this section, you will look at how to install and configure Windows Deployment Services (WDS). WDS is a utility that allows an administrator to deploy an operating system remotely. The client machine that is receiving the operating system needs to use a set of disks (WDS client disks) that will automatically initiate a network card, connect to the WDS server, and download the operating system.
WDS allows an IT administrator to install a Windows operating system without using a CD or DVD installation disc. Using WDS allows you to deploy the operating system through a network installation. WDS can deploy Windows XP, Windows Server 2003, Windows Vista, Windows 7, Windows 8, Windows Server 2008, Windows Server 2008 R2, Microsoft Windows 2012, and Microsoft Windows Server 2012 R2.
The following are some of the advantages of using WDS for automated installation:
§ You can remotely install Windows 7 or Windows 8.
§ The procedure simplifies management of the server image by allowing you to access Windows 7 or Windows 8 distribution files from a distribution server.
§ You can quickly recover the operating system in the event of a computer failure.
Here are the basic steps of the WDS process from a PXE-enabled WDS client:
1. The WDS client initiates a special boot process through the PXE network adapter (and the computer’s BIOS configured for a network boot). On a PXE client, the user presses F12 to start the PXE boot process and to indicate that they want to perform a WDS installation.
2. A list of available Windows PE boot images is displayed. The user should select the appropriate Windows PE boot image from the boot menu.
3. The Windows Welcome screen is displayed. The user should click the Next button.
4. The WDS user is prompted to enter credentials for accessing and installing images from the WDS server.
5. A list of available operating system images is displayed. The user should select the appropriate image file to install.
6. The WDS user is prompted to enter the product key for the selected image.
7. The Partition And Configure The Disk screen is displayed. This screen provides the ability to install a mass storage device driver, if needed, by pressing F6.
8. The image copy process is initiated, and the selected image is copied to the WDS client computer.
The following sections describe how to set up the WDS server and the WDS clients and how to install Windows 7 or Windows 8 through WDS.
Windows Server 2012 R2 WDS Functionality
Windows Server 2012 R2 allows you to use many new and improved features of WDS. Table 1.1 shows some of the highpoints of what WDS can do when installed onto a Windows Server 2012 or Windows Server 2012 R2 system.
TABLE 1.1 WDS functionality with Windows Server 2012 R2
|
Feature |
Description |
|
OS deployed using WDS |
Windows XP, Windows Server 2003, Windows Vista SP1, Windows Server 2008, Windows 7, Windows Server 2008 R2, Windows Server 2012, Windows 8, Windows 8.1, Windows Server 2012 R2. |
|
Image types deployed |
.wim and .vhd images are both supported. .vhd images can now be managed via the WDS management snap-in in addition to the command line. Also, .vhdx files, the new file format available since Windows Server 2012, are supported directly and over multicast. |
|
Boot environment |
Windows PE. |
|
Administration options |
MMC snap-in and WDSUTIL. Windows PowerShell cmdlets added in Windows Server 2012 R2. |
|
Multicasting |
IPv6 and DHCPv6 support for TFTP and multicasting along with improved multicast deployments. |
|
Driver provisioning |
Drivers are automatically detected and installed. Because of this, duplicate driver packages are prevented from being installed into the driver store. |
|
PowerShell cmdlet scripting |
Supported on Windows Server 2012 R2 only. |
Preparing the WDS Server
With the WDS server, you can manage and distribute Windows 7 or Windows 8 operating system images to WDS client computers. The WDS server contains any files necessary for PXE booting, Windows PE boot images, and the Windows 7 or Windows 8 images to be deployed.
The following steps for preparing the WDS server are discussed in the upcoming sections:
1. Make sure that the server meets the requirements for running WDS.
2. Install WDS.
3. Configure and start WDS.
4. Configure the WDS server to respond to client computers (if this was not configured when WDS was installed).
For WDS to work, the server on which you will install WDS must meet the requirements for WDS and be able to access the required network services.
WDS Server Requirements
WDS needs some services and requirements installed before it will work properly:
§ Active Directory Domain Services must be present for WDS to function properly. The WDS server must be a domain controller or a member of the Active Directory domain.
§ At least one partition on the server must be formatted as NTFS.
§ The operating system must be Windows Server 2003, Windows Server 2008/2008 R2, Windows Server 2012, or Windows Server 2012 R2.
Network Services
Besides the server requirements, some networking requirements need to be installed for WDS. The following network services must be running on the WDS server or be accessible to the WDS server from another network server:
§ TCP/IP installed and configured.
§ A DHCP server, which is used to assign DHCP addresses to WDS clients. (Make sure your DHCP scope has enough addresses to accommodate all of the WDS clients that will need IP addresses.)
§ A DNS server, which is used to locate the Active Directory controller.
§ Active Directory, which is used to locate WDS servers and WDS clients as well as authorize WDS clients and manage WDS configuration settings and client installation options.
Installing the WDS Server Components
You can configure WDS on a Windows Server 2003/2008/2008 R2, Windows Server 2012, or Windows Server 2012 R2 computer by using the Windows Deployment Services Configuration Wizard or by using the WDSUTIL command-line utility. Table 1.2 describes the WDSUTIL command-line options.
TABLE 1.2 WDSUTIL command-line options
|
WDSUTIL option |
Description |
|
/initialize-server |
Initializes the configuration of the WDS server |
|
/uninitialized -server |
Undoes any changes made during the initialization of the WDS server |
|
/add |
Adds images and devices to the WDS server |
|
/convert-ripimage |
Converts Remote Installation Preparation (RIPrep) images to WIM images |
|
/remove |
Removes images from the server |
|
/set |
Sets information in images, image groups, WDS servers, and WDS devices |
|
/get |
Gets information from images, image groups, WDS servers, and WDS devices |
|
/new |
Creates new capture images or discover images |
|
/copy- image |
Copies images from the image store |
|
/export-image |
Exports to WIM files images contained within the image store |
|
/start |
Starts WDS services |
|
/stop |
Stops WDS services |
|
/disable |
Disables WDS services |
|
/enable |
Enables WDS services |
|
/approve-autoadddevices |
Approves Auto-Add devices |
|
/reject-autoadddevices |
Rejects Auto-Add devices |
|
/delete-autoadddevices |
Deletes records from the Auto-Add database |
|
/update |
Uses a known good resource to update a server resource |
The first step in setting up WDS to deploy operating systems to the clients is to install the WDS role. You do this by using Server Manager.
One of the advantages of using the Windows deployment server is that WDS can work with Windows image (.wim) files. Windows image files can be created through the use of the Windows Sysprep utility.
One component to which you need to pay attention when using the Windows deployment server is Preboot Execution Environment (PXE) network devices. PXE boot devices are network interface cards (NICs) that can talk to a network without the need for an operating system. PXE boot NIC adapters are network adapters that have a set of preboot commands within the boot firmware.
This is important when using WDS because PXE boot adapters connect to a WDS server and request the data needed to load the operating system remotely. Remember, most of these machines for which you are using WDS do not have an operating system on the computer. You need NIC adapters that can connect to a network without the need for an operating system for WDS to work properly.
For the same reason, you must set up DHCP to accept PXE machines. Those machines need a valid TCP/IP address so that they can connect to the WDS server.
Installing the WDS Services Using PowerShell
As we have stated multiple times throughout this book, we will show you how to do many of these tasks using the Windows PowerShell commands. Table 1.3 describes many of the WDS cmdlets that you can use in Windows Server 2012 R2.
TABLE 1.3 WDSUTIL command-line options
|
Cmdlet |
Description |
|
Add-WdsDriverPackage |
Adds an existing driver package to a driver group or injects it into a boot image |
|
Approve-WdsClient |
Approves clients |
|
Copy-WdsInstallImage |
Copies install images within an image group |
|
Deny-WdsClient |
Denies approval for clients |
|
Disable-WdsBootImage |
Disables a boot image |
|
Disable-WdsDriverPackage |
Disables a driver package in the Windows Deployment Services driver store |
|
Disable-WdsInstallImage |
Disables an install image |
|
Disconnect-WdsMulticastClient |
Disconnects a multicast client from a transmission or namespace |
|
Enable-WdsBootImage |
Enables a boot image |
|
Enable-WdsDriverPackage |
Enables a driver package in the Windows Deployment Services driver store |
|
Enable-WdsInstallImage |
Enables an install image |
|
Export-WdsBootImage |
Exports an existing boot image from an image store |
|
Export-WdsInstallImage |
Exports an existing install image from an image store |
|
Get-WdsBootImage |
Gets properties of boot images from the image store |
|
Get-WdsClient |
Gets client devices from the pending device database, or pre-staged devices from Active Directory or the standalone server device database. |
|
Get-WdsDriverPackage |
Gets properties of driver packages from the Windows Deployment Services driver store |
|
Get-WdsInstallImage |
Gets properties of install images from an image store |
|
Get-WdsInstallImageGroup |
Gets properties of install image groups |
|
Get-WdsMulticastClient |
Gets a list of clients connected to a multicast transmission or namespace |
|
Import-WdsBootImage |
Imports a boot image to the image store |
|
Import-WdsDriverPackage |
Imports a driver package into the Windows Deployment Services driver store |
|
Import-WdsInstallImage |
Imports an install image to an image store |
|
New-WdsClient |
Creates a prestaged client |
|
New-WdsInstallImageGroup |
Creates an install image group |
|
Remove-WdsBootImage |
Removes a boot image from the image store |
|
Remove-WdsClient |
Removes a prestaged client from AD DS or the stand-alone server device database or clears the Pending Devices database |
|
Remove-WdsDriverPackage |
Removes a driver package from a driver group or removes it from all driver groups and deletes it |
|
Remove-WdsInstallImage |
Removes an install image from an image store |
|
Remove-WdsInstallImageGroup |
Removes an install image group |
|
Set-WdsBootImage |
Modifies settings of a boot image |
|
Set-WdsClient |
Modifies a prestaged client device |
|
Set-WdsInstallImage |
Modifies the properties of an install image |
|
Set-WdsInstallImageGroup |
Modifies the name and access permissions of an install image group |
 This table comes directly from Microsoft TechNet at http://technet.microsoft.com/library/dn283416.aspx.
Preparing the WDS Client
The WDS client is the computer on which Windows 7 or Windows 8 will be installed. WDS clients rely on PXE technology, which allows the client computer to remotely boot and connect to a WDS server.
To act as a WDS client, the computer must meet all of the hardware requirements for Windows 7 or Windows 8 and have a PXE-capable network adapter installed. In addition, a WDS server must be present on the network. Furthermore, the user account used to install the image must be a member of the Domain Users group in Active Directory.
After the WDS server has been installed and configured, you can install Windows 7 or Windows 8 on a WDS client that uses a PXE-compliant network card.
To install Windows 7 or Windows 8 on the WDS client, follow these steps:
1. Start the computer. When prompted, press F12 for a network service boot. The Windows PE appears.
2. The Windows Welcome screen appears. Click the Next button to start the installation process.
3. Enter the username and password of an account that has permissions to access and install images from the WDS server.
4. A list of available operating system images stored on the WDS server appears. Select the image to install and click Next.
5. Enter the product key for the selected Windows 7 or Windows 8 image and click Next.
6. The Partition And Configure The Disk screen appears. Select the desired disk-partitioning options or click OK to use the default options.
7. Click Next to initiate the image-copying process. The Windows Setup process will begin after the image is copied to the WDS client computer.
Configuring Windows Server Update Services
To keep your Windows operating systems up-to-date and secure, you can use Windows Update, Automatic Updates, WSUS, and the Microsoft Baseline Security Analyzer.
Windows Update This utility attaches to the Microsoft website through a user-initiated process, and it allows Windows users to update their operating systems by downloading updated files (critical and noncritical software updates).
Automatic Updates This utility extends the functionality of Windows Update by automating the process of updating critical files. With Automatic Updates, you can specify whether you want updates to be downloaded and installed automatically or whether you just want to be notified when updates are available.
Windows Server Update Services (WSUS) This utility is used to deploy a limited version of Windows Update to a corporate server, which in turn provides the Windows updates to client computers within the corporate network. This allows clients that are limited to what they can access through a firewall to be able to keep their Windows operating systems up-to-date.
Microsoft Baseline Security Analyzer (MBSA) You can download this utility from the Microsoft website to ensure you have the most current security updates.
In the following sections, you will learn how to use these tools.
Windows Update
Windows Update is available through the Microsoft website, and it is used to provide the most current files for Windows operating systems. Examples of updates include security fixes, critical updates, updated help files, and updated drivers.
You can download Windows Update through the Help And Support page on the Microsoft website. Once it’s installed, click the Scan For Updates link on the Welcome To Windows Update screen to search for new updates.
The results of the Windows Update search will be displayed on the left side of the Windows Update screen. You will see the following options:
Pick Updates To Install This lists what updates are available for your computer, and it includes the following categories:
§ Critical Updates And Service Packs
§ Windows Server 2012 R2 Family
§ Driver Updates
Review And Install Updates This allows you to view all of the updates that you have selected to install, and it installs the updates.
View Installation History This allows you to track all of the updates that you have applied to your server.
Personalize Windows Update This customizes what you see when you use Windows Update.
Get Help And Support This displays help and support information about Windows Update.
Sometimes the updates that are installed require the computer to be restarted before they can take effect. In this event, Windows Update uses a technology called chained installation. With chained installation, all updates that require a computer restart are applied before the computer is restarted. This eliminates the need to restart the computer more than once.
The information that is collected by Windows Update includes the operating system and version number, the Internet Explorer version, the software version information for any software that can be updated through Windows Update, the Plug and Play ID numbers for installed hardware, and the region and language settings. Windows Update will also collect the product ID and product key to confirm that you are running a licensed copy of Windows, but this information is retained only during the Windows Update session and it is not stored. No personal information that can be used to identify users of the Windows Update service is collected.
Windows Automatic Updates
The Automatic Updates application extends the functionality of Windows Update by automating the update process. With Automatic Updates, Windows Server 2012 R2 recognizes when you have an Internet connection and will automatically search for any updates for your computer from the Windows Update website.
If any updates are identified, they will be downloaded using Background Intelligent Transfer Services (BITS). BITS is a bandwidth-throttling technology that allows downloads to occur using idle bandwidth only. This means that downloading automatic updates will not interfere with any other Internet traffic.
If Automatic Updates detects any updates for your computer, you will see an update icon in the notification area of the taskbar.
To configure Automatic Updates, you must have local administrative rights to the computer on which Automatic Updates is being configured. Requiring administrative rights prevents users from specifying that critical security updates not be installed. In addition, Microsoft must digitally sign any updates that are downloaded.
You configure Automatic Updates by selecting Start ⇒ Control Panel ⇒ Windows Update. You will see the Check For Updates button shown in Figure 1.1.
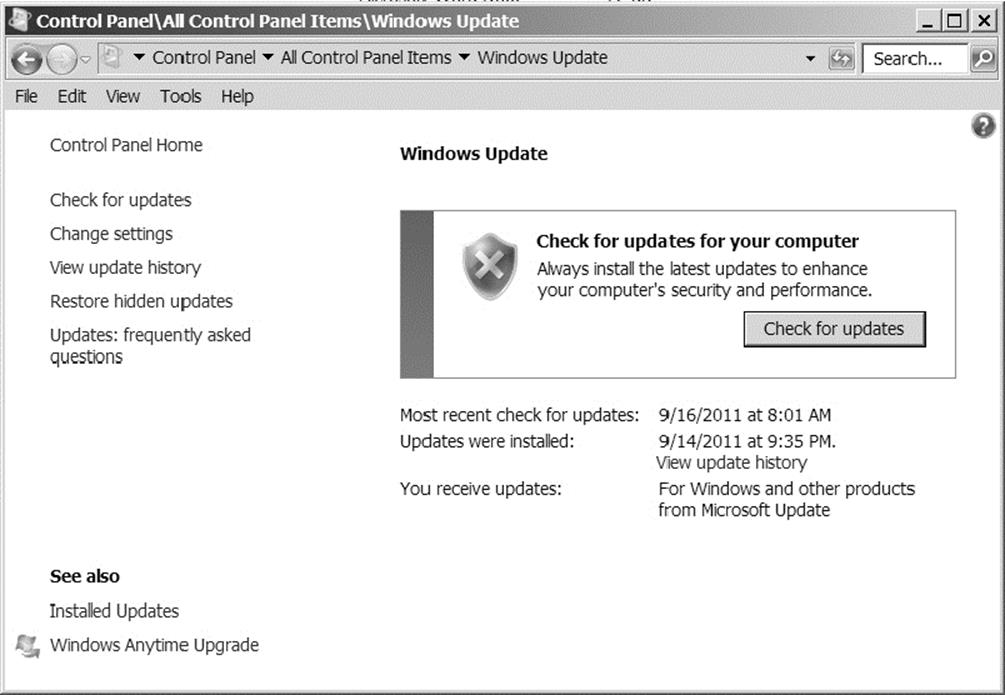
FIGURE 1.1 Windows Update control panel
You enable Automatic Updates by clicking the Change Settings link. With this setting enabled, Windows Update software may be automatically updated prior to applying any other updates (see Figure 1.2).
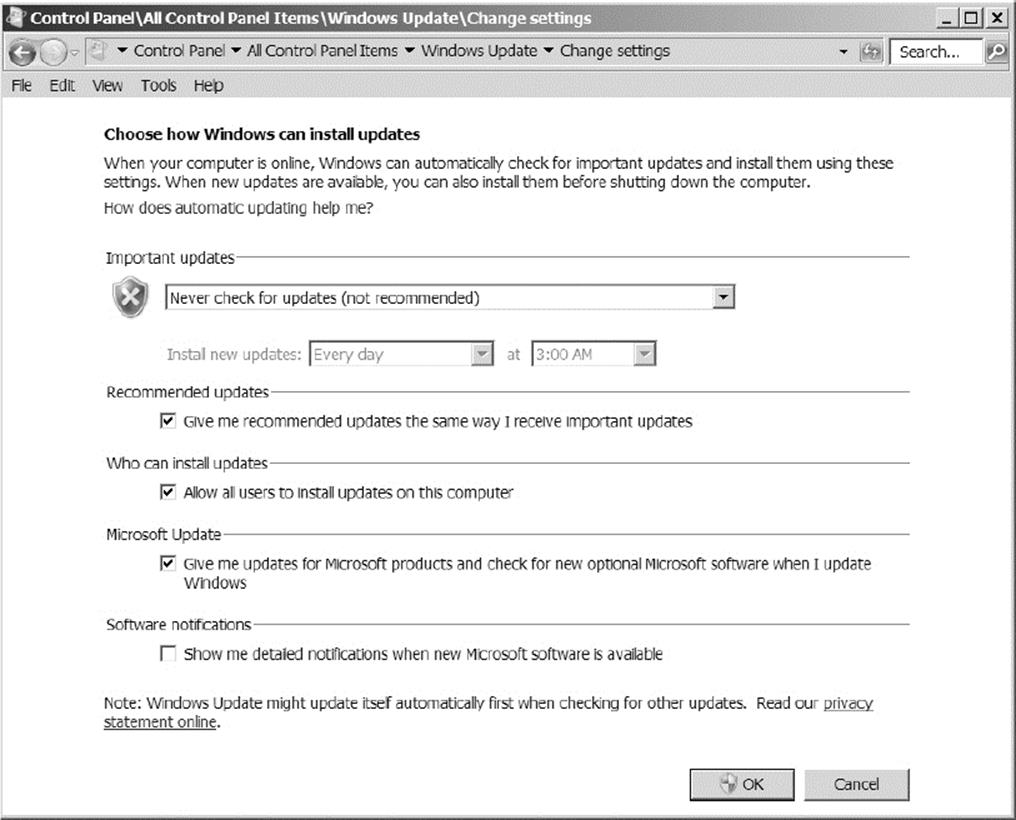
FIGURE 1.2 Change Settings window of the Windows Update control panel
Using Windows Server Update Services
Windows Server Update Services (WSUS), formerly known as Software Update Services (SUS), is used to leverage the features of Windows Update within a corporate environment. WSUS downloads Windows updates to a corporate server, which in turn provides the updates to the internal corporate clients. This allows administrators to test and have full control over what updates are deployed within the corporate environment. WSUS is designed to work in medium-sized corporate networks that are not using System Center Essentials 2012 R2.
Advantages of Using WSUS
Using WSUS has many advantages:
§ It allows an internal server within a private intranet to act as a virtual Windows Update server.
§ Administrators have selective control over what updates are posted and deployed from the public Windows Update site. No updates are deployed to client computers unless an administrator first approves them.
§ Administrators can control the synchronization of updates from the public Windows Update site to the WSUS server either manually or automatically.
§ Administrators can configure Automatic Updates on client computers to access the local WSUS server as opposed to the public Windows Update site.
§ WSUS checks each update to verify that Microsoft has digitally signed it. Any updates that are not digitally signed are discarded.
§ Administrators can selectively specify whether clients can access updated files from the intranet or from Microsoft’s public Windows Update site, which is used to support remote clients.
§ Administrators can deploy updates to clients in multiple languages.
§ Administrators can configure client-side targeting to help client machines get updates. Client-side targeting allows your organization’s computers to automatically add themselves to the computer groups that were created in the WSUS console.
§ Administrators can configure a WSUS statistics server to log update access, which allows them to track which clients have installed updates. The WSUS server and the WSUS statistics server can coexist on the same computer.
§ Administrators can manage WSUS servers remotely using HTTP or HTTPS if their web browser is Internet Explorer 6.0 or newer.
WSUS Server Requirements
To act as a WSUS server, the server must meet the following requirements:
§ It must be running Windows 2000 Server with Service Pack 4 or newer, Windows Server 2003 SP1 or greater, Windows Vista, Windows 7, Windows 8, Windows Server 2008, Windows Server 2008 R2, Windows Server 2012, or Windows Server 2012 R2.
§ It must have all of the most current security patches applied.
§ It must be running Internet Information Services (IIS) 6.0 or newer.
§ It must be connected to the network.
§ It must have an NTFS partition with 100MB free disk space to install the WSUS server software, and it must have 6GB of free space to store all of the update files.
§ It must use BITS version 2.0.
§ It must use Microsoft Management Console 3.0.
§ It must use Microsoft Report Viewer Redistributable 2008.
If your WSUS server meets the following system requirements, it can support up to 15,000 WSUS clients:
§ Pentium III 700MHz processor
§ 512MB of RAM
Installing the WSUS Server
WSUS should run on a dedicated server, meaning that the server will not run any other applications except IIS, which is required. Microsoft recommends that you install a clean or new version of Windows Server 2003 SP1 or newer, Windows Server 2008, Windows Server 2008 R2, Windows Server 2012, or Windows Server 2012 R2 and apply any service packs or security-related patches.
Exercise 1.1 walks you through the installation process for WSUS.
![]() EXERCISE 1.1: Installing a WSUS Server
EXERCISE 1.1: Installing a WSUS Server
1. Choose Server Manager by clicking the Server Manager icon on the taskbar.
2. Click option number 2, Add Roles And Features.
3. Choose role-based or featured-based installation and click Next.
4. Choose your server and click Next.
5. Choose Windows Server Update Service. Click the Add Features button when the dialog box appears. Then click Next.
6. At the Select features screen, just click Next.
7. At the Windows Server Update Services screen, click Next.
8. At the Select Role Services screen, make sure that WID Database and WSUS Services are both checked. Click Next.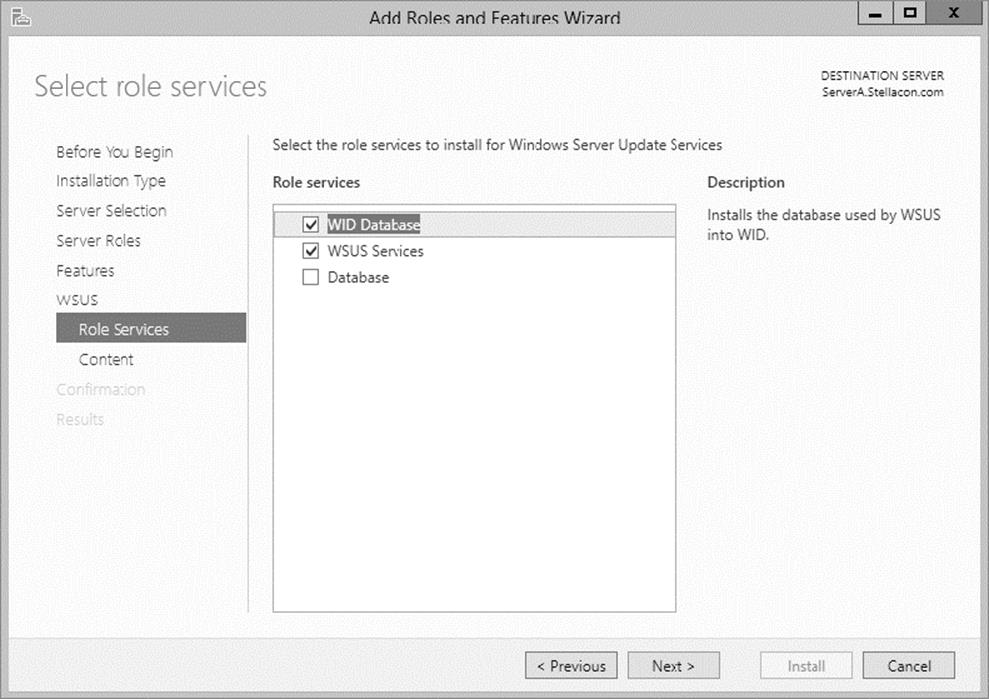
9. At the Content Location Selection screen, uncheck the box Store Updates In The Following Location and click Next. When you uncheck this box, updates are not stored locally. They are downloaded from Microsoft only once they are approved. This will help save hard drive space.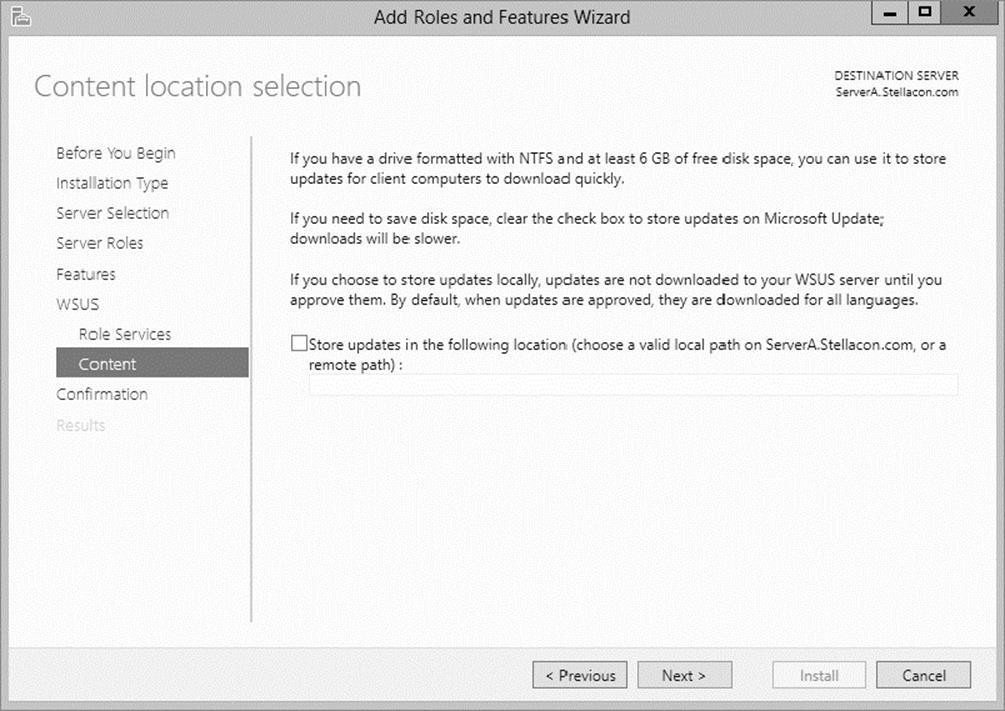
10.At the Confirmation screen, click the Install button.
11.The installation will begin, and you will see the progress. Once the installation is complete, click Close.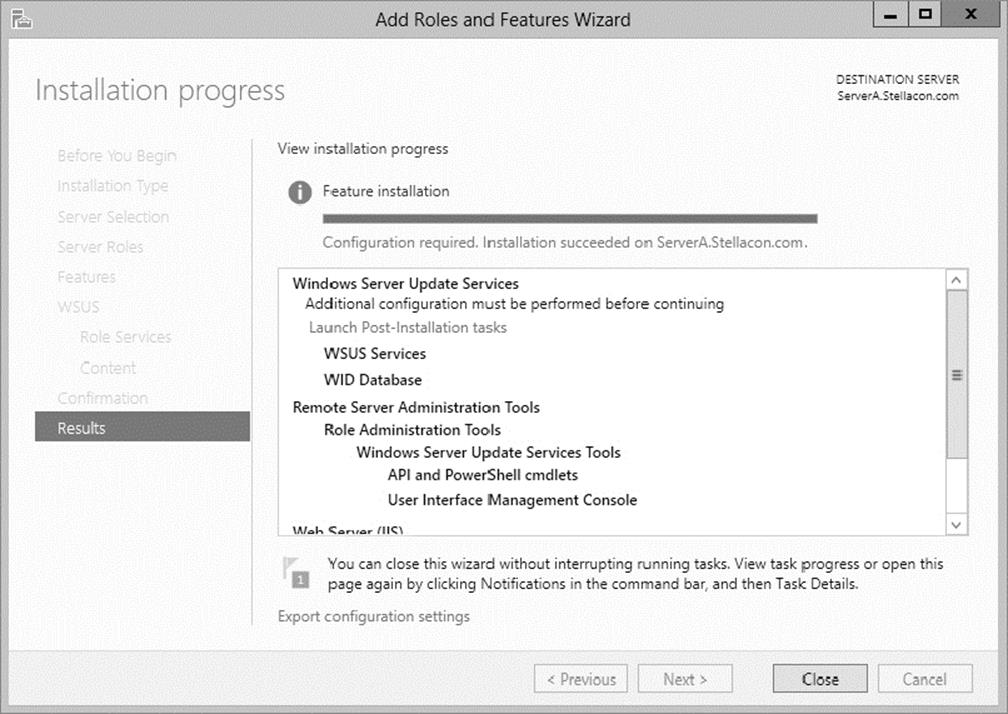
12.In Server Manager, click the WSUS link on the left side. Then click the More link next to Configuration Required For Windows Server Update Services.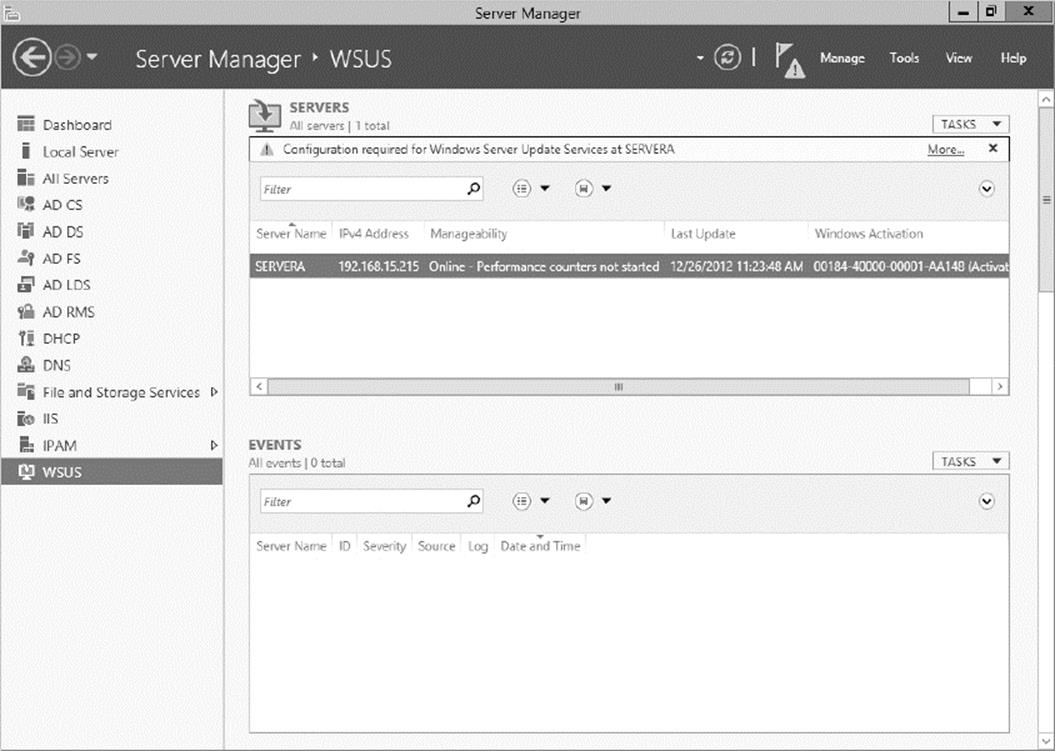
13.At the All Servers Task Details And Notifications screen, click the Launch Post-Installation Tasks link.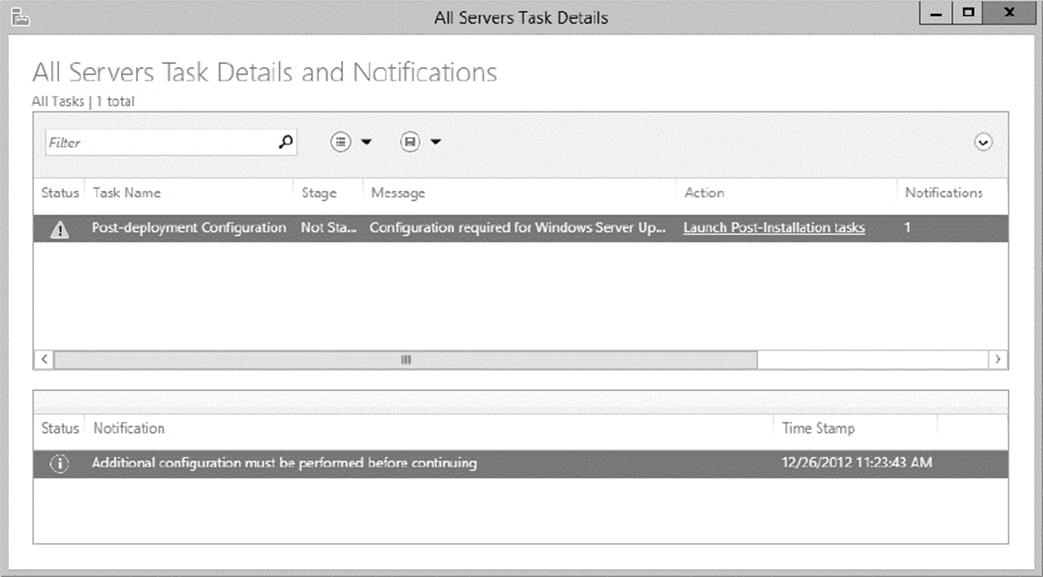
14.The installation process will automatically continue. Once it is finished, you will see Complete under Stage. Close the All Servers Task Details And Notifications screen.
15.Close Server Manager.
16.If a WSUS Configure Options box appears, just close it. You will set options in the next exercise.
Configuring a WSUS Server
Configuring a WSUS machine is a straightforward process. The easiest way to do it is to use the WSUS Server Configuration Wizard. This wizard walks you through the WSUS setup process, and it makes it easy to configure WSUS. When in the WSUS snap-in, you can configure different options.
Update Source And Proxy Server This option allows you to configure whether this WSUS server synchronizes either from Microsoft Update or from another WSUS server on your network.
Products And Classifications This option allows you to select the products for which you want to get updates and the type of updates that you want to receive.
Update Files And Languages This option allows you to choose whether to download update files and where to store these update files. This option also allows you to choose which update languages you want downloaded.
Automatic Approvals This option allows you to specify how to approve installation of updates automatically for selected groups and how to approve revisions to existing updates.
Synchronization Schedule This option allows you to configure how and when you synchronize your updates. Administrators can choose to synchronize manually or to set up a schedule for daily automatic synchronization.
Computers This option allows you to set computers to groups or use Group Policy or registry settings on the computer to receive updates.
Server Cleanup Wizard This option allows you to clean out old computers, updates, and update files from your server.
Reporting Rollup This option allows you to choose whether to have replica downstream servers roll up computer and update status to this WSUS server.
Email Notifications This option allows you to set up email notifications for WSUS. You can be notified when new updates are synchronized, or you can get email status reports. This option also allows you to set up the email server’s information on your WSUS server.
Microsoft Update Improvement Program This option allows you to choose whether you want to participate in the Microsoft Update Improvement program. When you choose to participate in this program, your WSUS server will automatically send information to Microsoft about the quality of your updates. This following information is included:
§ How many computers are in the organization
§ How many computers successfully installed each update
§ How many computers failed to install each update
Personalization This option allows you to personalize the way that information is displayed for this server. This option also allows you to set up a to-do list for WSUS.
WSUS Server Configuration Wizard This option allows you to set up many of the preceding options by just using this one setup wizard.
In Exercise 1.2, you will learn how to set up some of the WSUS server options. To complete this exercise, you need to have an Internet connection that can communicate with Microsoft.
![]() EXERCISE 1.2: Setting WSUS Server Options
EXERCISE 1.2: Setting WSUS Server Options
1. Open the Windows Server Update Services snap-in from Administrative Tools by pressing the Windows key on the keyboard and then choosing Administrative Tools. The Windows Server Update Services snap-in will be at the bottom of the list alphabetically.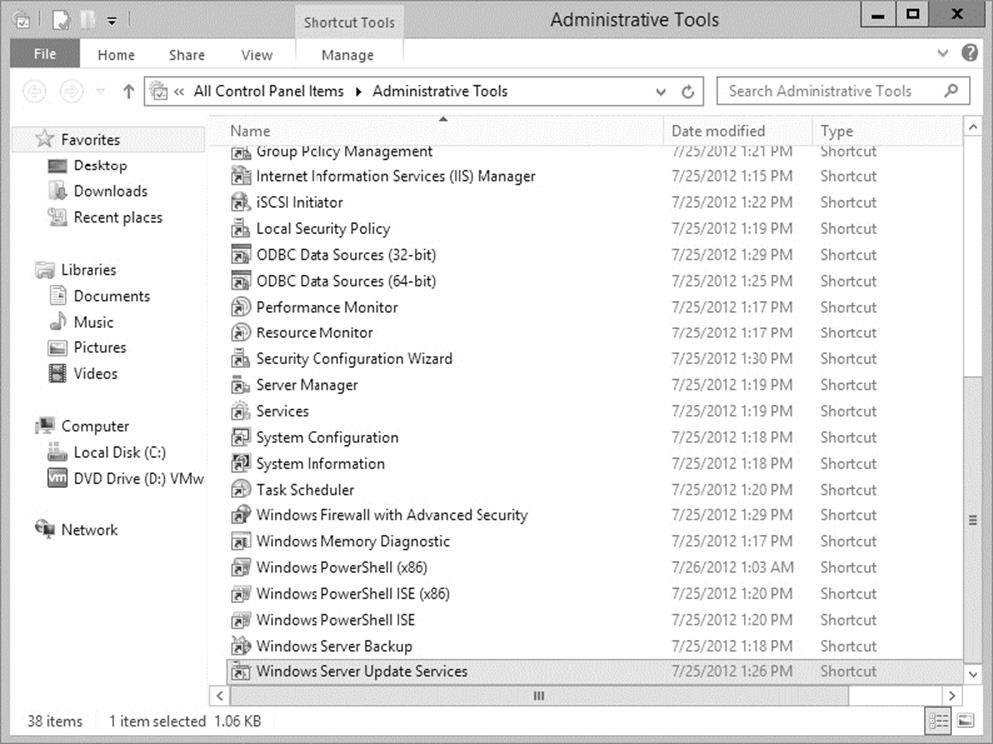
2. On the left side, click the name of your server. Then, in the middle section under To Do, click the Options link.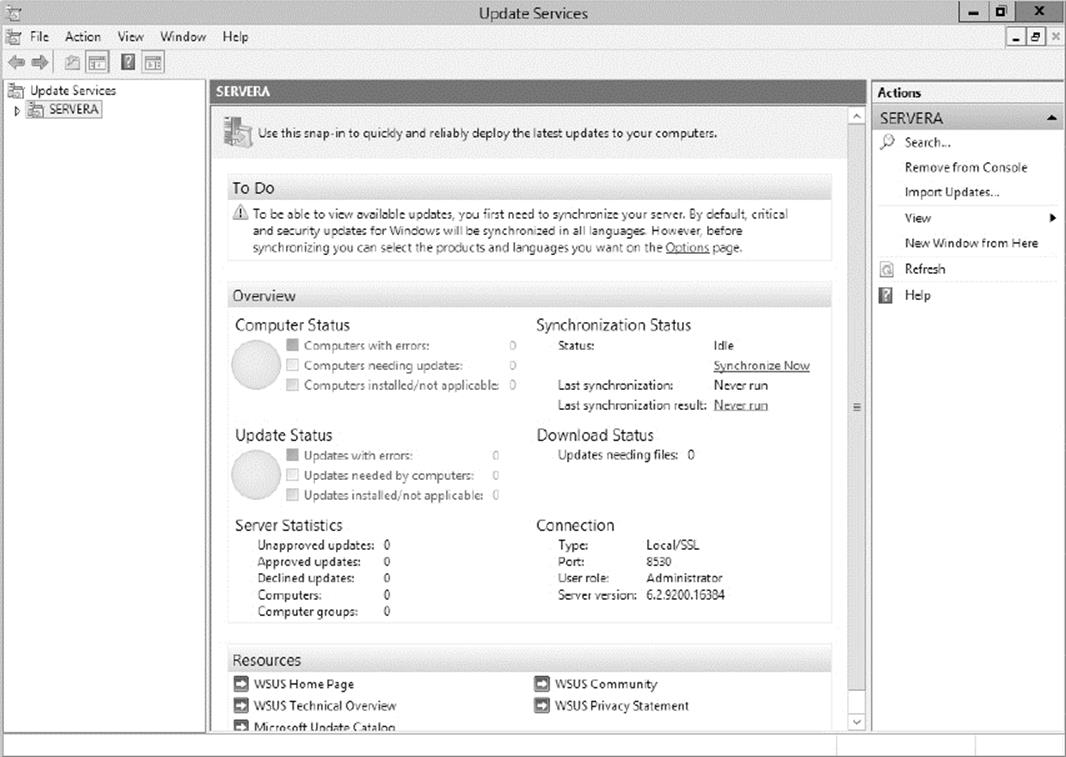
3. A WSUS Server Configuration Wizard appears at the bottom of the options list. Click this link.
4. Click Next at the Before You Begin screen.
5. At the Join Microsoft Update Improvement Program screen, uncheck the Yes box and click Next.
6. At the Choose Upstream Server screen, choose Synchronize From Microsoft Update and click Next.
7. Fill in the information at the Specify Proxy Server screen if you need to use a proxy server. If you do not need a proxy server, just click Next.
8. At the Connect To Upstream Server screen, click the Start Connecting button. This step can take a few minutes depending on your connection speed. Once it’s finished connecting, click Next.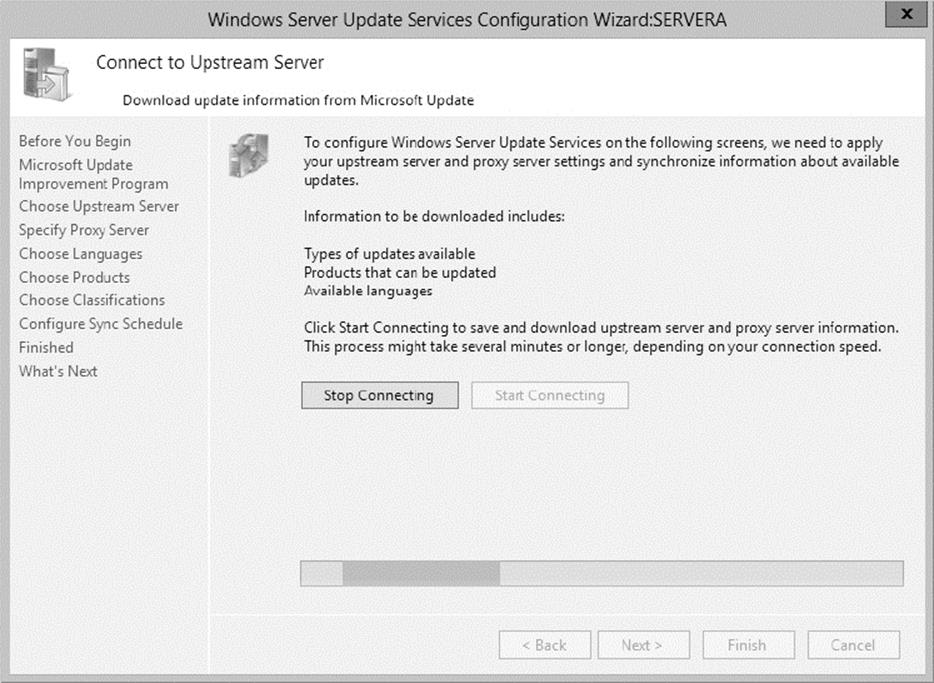
9. At the Choose Products screen, scroll down and choose the products for which you want to receive updates. Then click Next.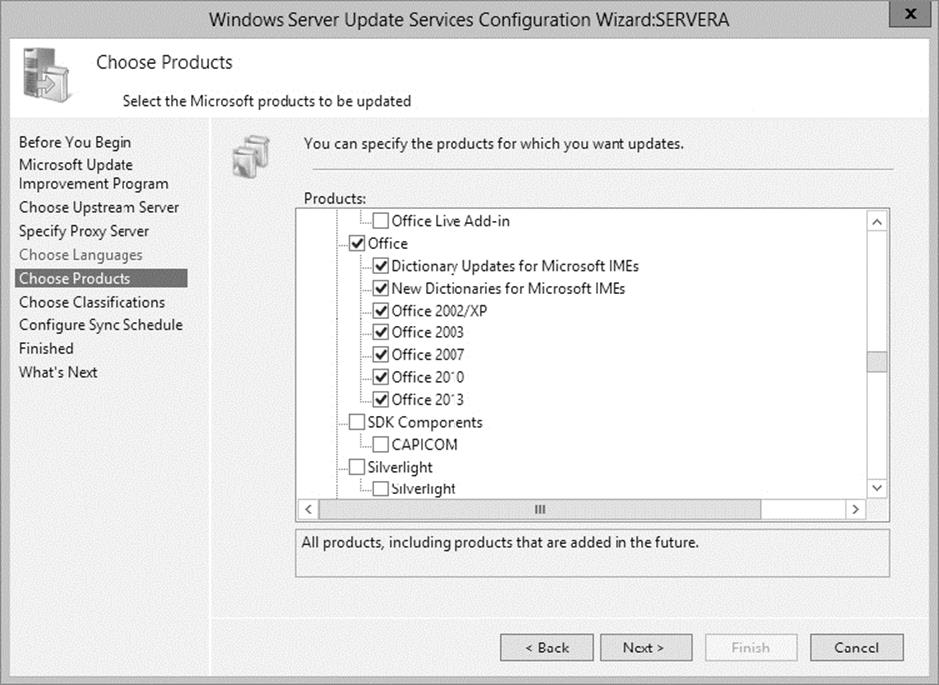
10.At the Choose Classifications screen, choose the classifications of updates you would like and click Next.
11.The Set Sync Schedule screen will appear next. At this screen, you can choose whether you want manual or automatic synchronizations. For this exercise, choose Synchronize Manually and click Next.
12.At the Finish screen, you can click Begin Initial Synchronization and click Finish. Be advised, this initial sync can take some time to finish. So if you don’t have time to complete it now, you can always synchronize later.
13.Close WSUS.
Testing and Approving Updates
The administrator should test and approve updates before they are deployed to WSUS clients. The testing should be done on a test machine that is not used for daily tasks.
To approve updates, from the welcome screen, click Updates on the site’s toolbar. Make your settings on the Updates page that appears.
Viewing the Synchronization Log
To view the synchronization log, click the Reports button on the site’s toolbar from the welcome screen. The Reports page will appear. Click Synchronization Results to view the results.
Configuring a Disconnected Network
You have the ability to use WSUS on a disconnected network. To do so, you download the updates to the Internet-connected WSUS server. After the download is complete, you can export the updates and then import the updates to the disconnected network.
WSUS Client Requirements
WSUS clients run a special version of Automatic Updates that is designed to support WSUS. The following enhancements to Automatic Updates are included:
§ Clients can receive updates from a WSUS server as opposed to the public Microsoft Windows Update site.
§ The administrator can schedule when the downloading of updated files will occur.
§ Clients can be configured via Group Policy or through editing the registry.
§ Updates can occur when an administrative account or nonadministrative account is logged on.
The following client platforms are the only ones that WSUS currently supports:
§ Windows XP Home Edition (with Service Pack 3)
§ Windows XP Professional (with Service Pack 3)
§ Windows Server 2003 (SP1 or newer)
§ Windows Vista (all platforms)
§ Windows 7 (all platforms)
§ Windows 8 (all platforms)
§ Windows Server 2008 and 2008 R2 (all platforms)
§ Windows Server 2012 R2 (all platforms)
Configuring the WSUS Clients
You can configure WSUS clients in two ways. The method you use depends on whether you use Active Directory in your network.
In a nonenterprise network (not running Active Directory), you would configure Automatic Updates through the Control Panel using the same process that was defined in the section “Windows Automatic Updates” earlier in this chapter. Each client’s registry would then be edited to reflect the location of the server providing the automatic updates.
Within an enterprise network, using Active Directory, you would typically see Automatic Updates configured through Group Policy. Group Policy is used to manage configuration and security settings via Active Directory. Group Policy is also used to specify what server a client will use for Automatic Updates. If Automatic Updates is configured through Group Policy, the user will not be able to change Automatic Updates settings by choosing Control Panel ⇒ System (for XP) or Windows Update (for Windows 8, Windows 7, Windows Vista, Windows Server 2008, Windows Server 2008 R2, Windows Server 2012, and Windows Server 2012 R2).
Configuring a Client in a Non–Active Directory Network
The easiest way to configure the client to use Automatic Updates is through the control panel. However, you can also configure Automatic Updates through the registry. The registry is a database of all your server settings. You can access it by choosing Start ⇒ Run and typing regedit in the Run dialog box. Automatic Updates settings are defined through HKEY_LOCAL_MACHINE\Software\Policies\Microsoft\Windows\WindowsUpdate\AU.
Table 1.4 lists some of the registry options that you can configure for Automatic Updates.
TABLE 1.4 Selected registry keys and values for Automatic Updates
|
Registry key |
Options for values |
|
NoAutoUpdate |
0: Automatic Updates are enabled (default). |
|
1: Automatic Updates are disabled. |
|
|
2: Notify of download and installation. |
|
|
3: Autodownload and notify of installation. |
|
|
4: Autodownload and schedule installation. |
|
|
5: Automatic Updates is required, but end users can configure. |
|
|
ScheduledInstallDay |
1: Sunday. |
|
2: Monday. |
|
|
3: Tuesday. |
|
|
4: Wednesday. |
|
|
5: Thursday. |
|
|
6: Friday. |
|
|
7: Saturday. |
|
|
UseWUServer |
0: Use public Microsoft Windows Update site. |
|
1: Use server specified in WUServer entry. |
To specify what server will be used as the Windows Update server, you edit two registry keys, which are found here:
HKEY_LOCAL_MACHINE\Software\Policies\Microsoft\Windows\WindowsUpdate
§ The WUServer key sets the Windows Update server using the server’s HTTP name—for example, http://intranetSUS.
§ The WUStatusServer key sets the Windows Update intranet WSUS statistics server by using the server’s HTTP name—for example, http://intranetSUS.
Configuring a Client in an Active Directory Network
If the WSUS client is part of an enterprise network using Active Directory, you would configure the client via Group Policy. In Exercise 1.3, we will walk you through the steps needed to configure the Group Policy object (GPO) for WSUS clients. The Group Policy Management Console (GPMC) needs to be installed to complete this exercise. If you don’t have the GPMC installed, you can install it using the Server Manager utility.
EXERCISE 1.3: Configuring a GPO for WSUS
1. Open the GPMC by pressing the Windows key and selecting Administrative Tools ⇒ Group Policy Management.
2. Expand the forest, domains, and your domain name. Under your domain name, click Default Domain Policy. Right-click and choose Edit.
3. Under the Computer Configuration section, expand Policies ⇒ Administrative Templates ⇒ Windows Components ⇒ Windows Update.
4. In the right pane, double-click the Configure Automatic Updates option. The Configure Automatic Updates Properties dialog box appears. Click the Enabled button. Then, in the drop-down list, choose Auto Download And Notify For Install. Click OK.
5. Double-click Specify Intranet Microsoft Update Service Location Properties. This setting allows you to specify the server from which the clients will get the updates. Click Enabled. In the two server name boxes, enter //servername (the name of the server on which you installed WSUS in Exercise 1.1). Click OK.
6. To configure the rescheduling of automatic updates, double-click Reschedule Automatic Updates Scheduled Installations. You can enable and schedule the amount of time that Automatic Updates waits after system startup before it attempts to proceed with a scheduled installation that was previously missed. Click Enabled. Enter 10 in the Startup (Minutes) box. Click OK.
7. To configure auto-restart for scheduled Automatic Updates installations, double-click No Auto-Restart For Scheduled Automatic Updates Installations. When you enable this option, the computer is not required to restart after an update. Enable this option and click OK.
8. Close the GPMC.
Configuring Client-Side Targeting
Administrators can use a GPO to enable client-side targeting. Client machines can be automatically added into the proper computer group once the client computer connects to the WSUS server. Client-side targeting can be a very useful tool when an administrator has multiple client computers and the administrator needs to automate the process of assigning those computers to computer groups.
Administrators can enable client-side targeting on the WSUS server by clicking the Use Group Policy or registry settings on client computers option on the Computers Options page.
1. On the WSUS console toolbar, click Options and then click Computer Options.
2. In Computer Options, choose one of the following options:
§ If an administrator wants to create groups and assign computers through the WSUS console (server-side targeting), click Use The Move Computers Task In Windows Server Update Services.
§ If an administrator wants to create groups and assign computers by using Group Policy settings on the client computer (client-side targeting), click Use Group Policy Or Registry Settings On Computers.
3. Under Tasks, click the Save Settings button and then click OK.
Overview of Windows Server 2012 R2 Performance Monitoring
The first step in any performance optimization strategy is to measure performance accurately and consistently. The insight that you’ll gain from monitoring factors such as network and system utilization will be extremely useful when you measure the effects of any changes.
The overall performance monitoring process usually involves the following steps:
1. Establish a baseline of current performance.
2. Identify the bottlenecks.
3. Plan for and implement changes.
4. Measure the effects of the changes.
5. Repeat the process based on business needs.
Note that the performance optimization process is never really finished because you can always try to gain more performance from your system by modifying settings and applying other well-known tweaks. Before you get discouraged, realize that you’ll reach some level of performance that you and your network and system users consider acceptable and that it’s not worth the additional effort it will take to optimize performance any further. Also note that as your network and system load increases (more users or users doing more), so too will the need to reiterate this process. By continuing to monitor, measure, and optimize, you will keep ahead of the pack and keep your end users happy.
Now that you have an idea of the overall process, let’s focus on how changes should be made. It’s important to keep in mind the following ideas when monitoring performance:
Plan Changes Carefully Here’s a rule of thumb that you should always try to follow: An hour of planning can save a week of work. When you are working in an easy-to-use GUI-based operating system like Windows Server 2012 R2, it’s tempting to remove a check mark here or there and then retest the performance. You should resist the urge to do this because some changes can cause large decreases in performance or can impact functionality. Before you make haphazard changes (especially on production servers), take the time to learn about, plan for, and test your changes. Plan for outages and testing accordingly.
Utilize a Test Environment Test in a test lab that simulates a production environment. Do not make changes on production environments without first giving warning. Ideally, change production environments in off-hours when fewer network and system users will be affected. Making haphazard changes in a production environment can cause serious problems. These problems will likely outweigh any benefits that you may receive from making performance tweaks.
Make Only One Change at a Time The golden rule of scientific experiments is that you should always keep track of as many variables as possible. When the topic is server optimization, this roughly translates into making only one change at a time.
One of the problems with making multiple system changes is that although you may have improved overall performance, it’s hard to determine exactly which change created the positive effects. It’s also possible, for example, that changing one parameter increased performance greatly while changing another decreased it only slightly. Although the overall result was an increase in performance, you should identify the second, performance-reducing option so that the same mistake is not made again. To reduce the chance of obtaining misleading results, always try to make only one change at a time.
The main reason to make one change at a time, however, is that if you do make a mistake or create an unexpected issue, you can easily “back out” of the change. If you make two or three changes at the same time and are not sure which one created the problem, you will have to undo all of the changes and then make one alteration at a time to find the problem. If you make only one change at a time and follow that methodology every time, you won’t find yourself in this situation.
 It’s important to remember that many changes (such as registry changes) take place immediately; they do not need to be applied explicitly. Once the change is made, it’s live. Be careful to plan your changes wisely.
Ensure Consistency in Measurements When you are monitoring performance, consistency is extremely important. You should strive to have repeatable and accurate measurements. Controlling variables, such as system load at various times during the day, can help.
Assume, for instance, that you want to measure the number of transactions that you can simulate on the accounting database server within an hour. The results would be widely different if you ran the test during the month-end accounting close than if you ran the test on a Sunday morning. By running the same tests when the server is under a relatively static load, you will be able to get more accurate measurements.
Maintain a Performance History In the introduction to this chapter, I mentioned that the performance optimization cycle is a continuous improvement process. Because many changes may be made over time, it is important to keep track of the changes that have been made and the results you have experienced. Documenting this knowledge will help solve similar problems if they arise. I understand that many IT professionals do not like to document, but documentation can make life much easier in the long run.
As you can see, you need to keep a lot of factors in mind when optimizing performance. Although this might seem like a lot to digest and remember, do not fear. As a system administrator, you will learn some of the rules you need to know to keep your system running optimally. Fortunately, the tools included with Windows Server 2012 R2 can help you organize the process and take measurements. Now that you have a good overview of the process, let’s move on to look at the tools that can be used to set it in motion.
Using Windows Server 2012 R2 Performance Tools
Because performance monitoring and optimization are vital functions in network environments of any size, Windows Server 2012 R2 includes several performance-related tools.
Introducing Performance Monitor
The first and most useful tool is the Windows Server 2012 R2 Performance Monitor, which was designed to allow users and system administrators to monitor performance statistics for various operating system parameters. Specifically, you can collect, store, and analyze information about CPU, memory, disk, and network resources using this tool, and these are only a handful of the things that you can monitor. By collecting and analyzing performance values, system administrators can identify many potential problems.
You can use the Performance Monitor in the following ways:
Performance Monitor ActiveX Control The Windows Server 2012 R2 Performance Monitor is an ActiveX control that you can place within other applications. Examples of applications that can host the Performance Monitor control include web browsers and client programs such as Microsoft Word or Microsoft Excel. This functionality can make it easy for applications developers and system administrators to incorporate the Performance Monitor into their own tools and applications.
Performance Monitor MMC For more common performance monitoring functions, you’ll want to use the built-in Microsoft Management Console (MMC) version of the Performance Monitor.
System Stability Index The System Stability Index is a numerical value from 1 (least stable) to 10 (most stable) that represents the stability of your network. Performance Monitor calculates and creates the System Stability Index. You can view a graph of this index value. The graph can help a network administrator identify when the network started encountering problems. The System Stability Index also offers side-by-side comparisons. An administrator can view when system changes occurred (installing applications, devices, or drivers) and when system problems started to occur. This way, you can determine whether any system changes caused the problems that you are encountering.
Data Collector Sets Windows Server 2012 R2 Performance Monitor includes the Data Collector Set. This tool works with performance logs, telling Performance Monitor where the logs are stored and when the log needs to run. The Data Collector Sets also define the credentials used to run the set.
To access the Performance Monitor MMC, you open Administrative Tools and then choose Performance Monitor. This launches the Performance MMC and loads and initializes Performance Monitor with a handful of default counters.
You can choose from many different methods of monitoring performance when you are using Performance Monitor. A couple of examples are listed here:
§ You can look at a snapshot of current activity for a few of the most important counters. This allows you to find areas of potential bottlenecks and monitor the load on your servers at a certain point in time.
§ You can save information to a log file for historical reporting and later analysis. This type of information is useful, for example, if you want to compare the load on your servers from three months ago to the current load.
You’ll get to take a closer look at this method and many others as you examine Performance Monitor in more detail.
In the following sections, you’ll learn about the basics of working with the Windows Server 2012 R2 Performance Monitor and other performance tools. Then you’ll apply these tools and techniques when you monitor the performance of your network.
 Your Performance Monitor grows as your system grows, and whenever you add services to Windows Server 2012 R2 (such as installing Exchange Server 2010), you also add to what you can monitor. You should make sure that, as you install services, you take a look at what it is you can monitor.
Deciding What to Monitor
The first step in monitoring performance is to decide what you want to monitor. In Windows Server 2012 R2, the operating system and related services include hundreds of performance statistics that you can track easily. For example, you may want to monitor IPsec by monitoring connection security rules. This is just one of many items that can be monitored. All performance statistics fall into three main categories that you can choose to measure:
Performance Objects A performance object within Performance Monitor is a collection of various performance statistics that you can monitor. Performance objects are based on various areas of system resources. For example, there are performance objects for the processor and memory as well as for specific services such as web services.
Counters Counters are the actual parameters measured by Performance Monitor. They are specific items that are grouped within performance objects. For example, within the Processor performance object, there is a counter for % Processor Time. This counter displays one type of detailed information about the Processor performance object (specifically, the amount of total CPU time all of the processes on the system are using). Another set of counters you can use will allow you to monitor print servers.
Instances Some counters will have instances. An instance further identifies which performance parameter the counter is measuring. A simple example is a server with two CPUs. If you decide you want to monitor processor usage (using the Processor performance object)—specifically, utilization (the % Total Utilization counter)—you must still specify which CPU(s) you want to measure. In this example, you would have the choice of monitoring either of the two CPUs or a total value for both (using the Total instance).
To specify which performance objects, counters, and instances you want to monitor, you add them to Performance Monitor using the Add Counters dialog box. Figure 1.3 shows the various options that are available when you add new counters to monitor using Performance Monitor.
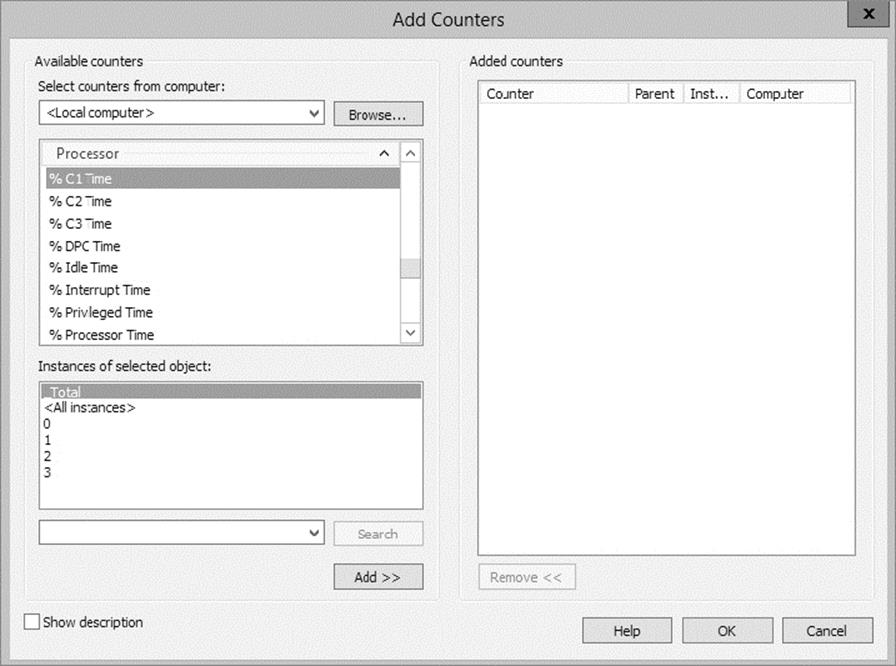
FIGURE 1.3 Adding a new Performance Monitor counter
The items that you will be able to monitor will be based on your hardware and software configuration. For example, if you have not installed and configured the IIS, the options available within the Web Server performance object will not be available. Or, if you have multiple network adapters or CPUs in the server, you will have the option of viewing each instance separately or as part of the total value.
Viewing Performance Information The Windows Server 2012 R2 Performance Monitor was designed to show information in a clear and easy-to-understand format. Performance objects, counters, and instances may be displayed in each of three views. This flexibility allows system administrators to define quickly and easily the information they want to see once and then choose how it will be displayed based on specific needs. Most likely, you will use only one view, but it’s helpful to know what other views are available depending on what it is you are trying to assess.
You can use the following main views to review statistics and information on performance:
Graph View The Graph view is the default display that is presented when you first access the Windows Server 2012 R2 Performance Monitor. The chart displays values using the vertical axis and displays time using the horizontal axis. This view is useful if you want to display values over a period of time or see the changes in these values over that time period. Each point that is plotted on the graph is based on an average value calculated during the sample interval for the measurement being made. For example, you may notice overall CPU utilization starting at a low value at the beginning of the chart and then becoming much higher during later measurements. This indicates that the server has become busier (specifically, with CPU-intensive processes). Figure 1.4 provides an example of the Graph view.
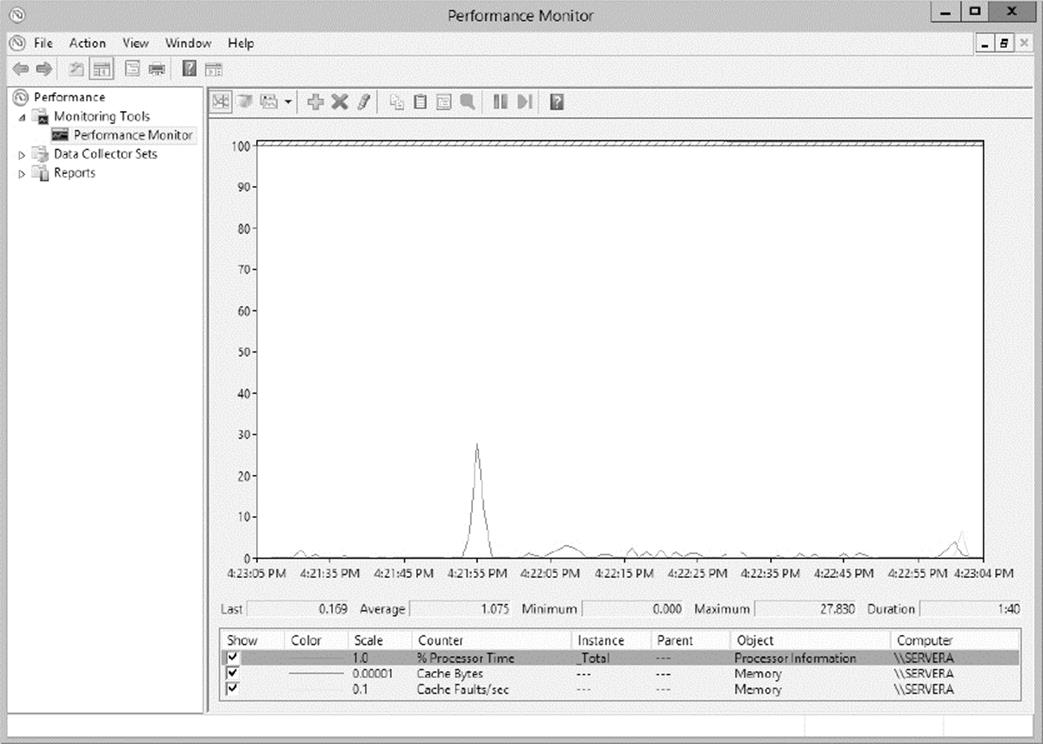
FIGURE 1.4 Viewing information in Performance Monitor Graph view
Histogram View The Histogram view shows performance statistics and information using a set of relative bar charts. This view is useful if you want to see a snapshot of the latest value for a given counter. For example, if you were interested in viewing a snapshot of current system performance statistics during each refresh interval, the length of each of the bars in the display would give you a visual representation of each value. It would also allow you to compare measurements visually relative to each other. You can set the histogram to display an average measurement as well as minimum and maximum thresholds. Figure 1.5 shows a typical Histogram view.
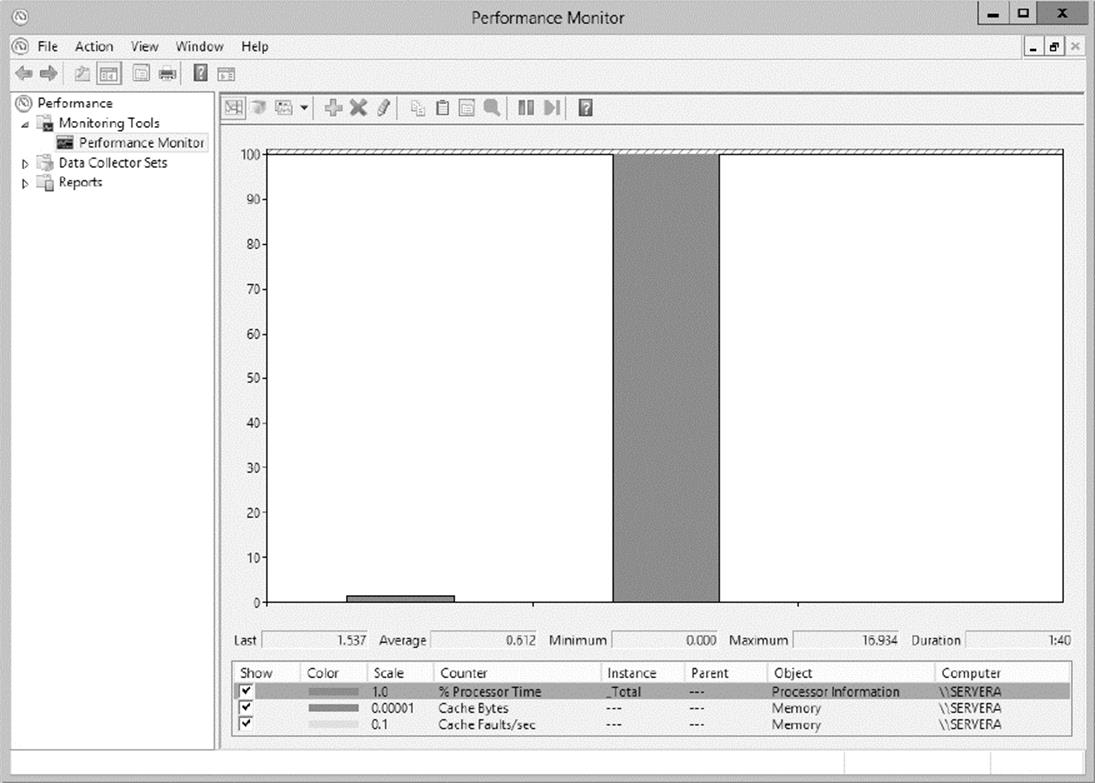
FIGURE 1.5 Viewing information in Performance Monitor Histogram view
Report View Like the Histogram view, the Report view shows performance statistics based on the latest measurement. You can see an average measurement as well as minimum and maximum thresholds. This view is most useful for determining exact values because it provides information in numeric terms, whereas the Chart and Histogram views provide information graphically. Figure 1.6 provides an example of the type of information you’ll see in the Report view.
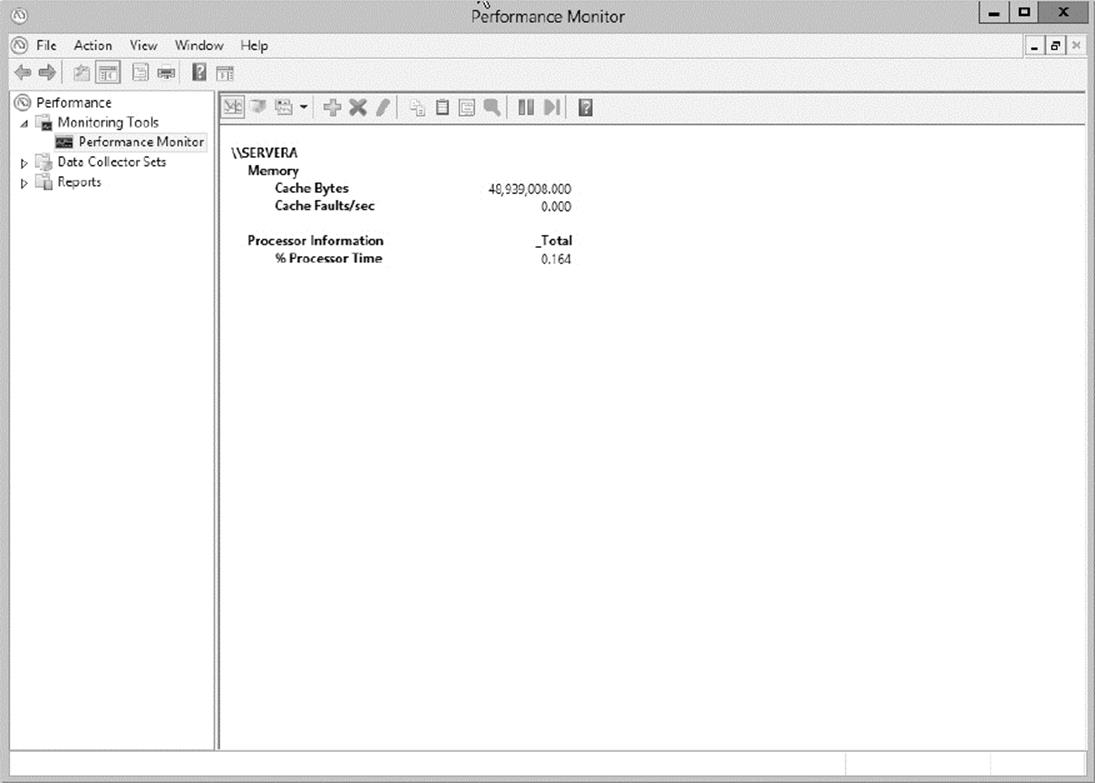
FIGURE 1.6 Viewing information in Performance Monitor Report view
Managing Performance Monitor Properties
You can specify additional settings for viewing performance information within the properties of Performance Monitor. You can access these options by clicking the Properties button in the taskbar or by right-clicking the Performance Monitor display and selecting Properties. You can change these additional settings by using the following tabs:
General Tab On the General tab (shown in Figure 1.7), you can specify several options that relate to Performance Monitor views:
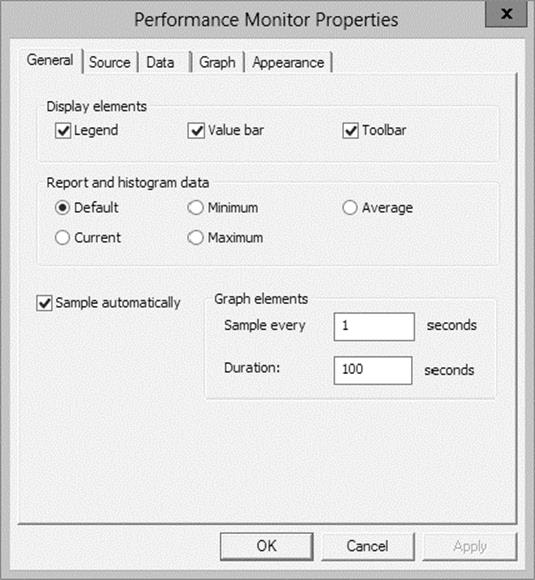
FIGURE 1.7 General tab of the Performance Monitor Properties dialog box
§ You can enable or disable legends (which display information about the various counters), the value bar, and the toolbar.
§ For the Report and Histogram views, you can choose which type of information is displayed. The options are Default, Current, Minimum, Maximum, and Average. What you see with each of these options depends on the type of data being collected. These options are not available for the Graph view because the Graph view displays an average value over a period of time (the sample interval).
§ You can also choose the graph elements. By default, the display will be set to update every second. If you want to update less often, you should increase the number of seconds between updates.
Source Tab On the Source tab (shown in Figure 1.8), you can specify the source for the performance information you want to view. Options include current activity (the default setting) or data from a log file. If you choose to analyze information from a log file, you can also specify the time range for which you want to view statistics. We’ll cover these selections in the next section.
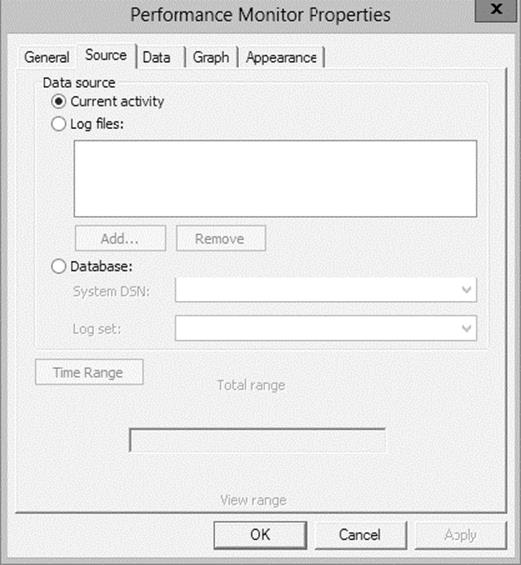
FIGURE 1.8 Source tab of the Performance Monitor Properties dialog box
Data Tab The Data tab (shown in Figure 1.9) lists the counters that have been added to the Performance Monitor display. These counters apply to the Chart, Histogram, and Report views. Using this interface, you can also add or remove any of the counters and change the properties, such as the width, style, and color of the line and the scale used for display.
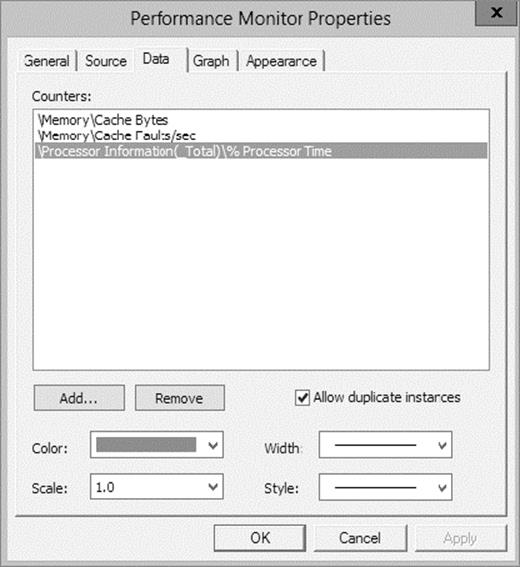
FIGURE 1.9 The Data tab of the Performance Monitor Properties dialog box
Graph Tab On the Graph tab (shown in Figure 1.10), you can specify certain options that will allow you to customize the display of Performance Monitor views. First you can specify what type of view you want to see (Line, Histogram, or Report). Then you can add a title for the graph, specify a label for the vertical axis, choose to display grids, and specify the vertical scale range.
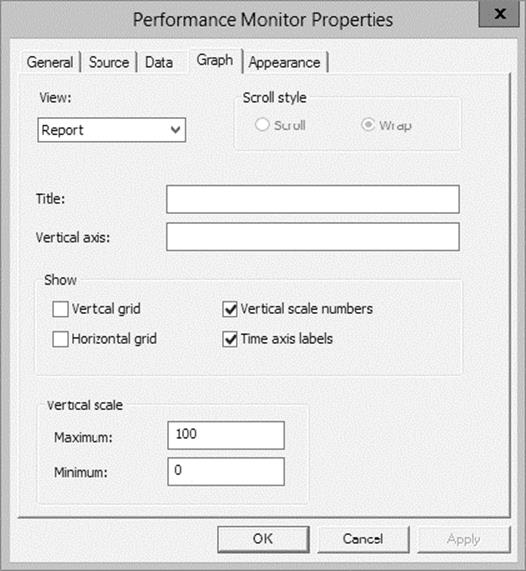
FIGURE 1.10 The Graph tab of the Performance Monitor Properties dialog box
Appearance Tab Using the Appearance tab (see Figure 1.11), you can specify the colors for the areas of the display, such as the background and foreground. You can also specify the fonts that are used to display counter values in Performance Monitor views. You can change settings to find a suitable balance between readability and the amount of information shown on one screen. Finally, you can set up the properties for a border.
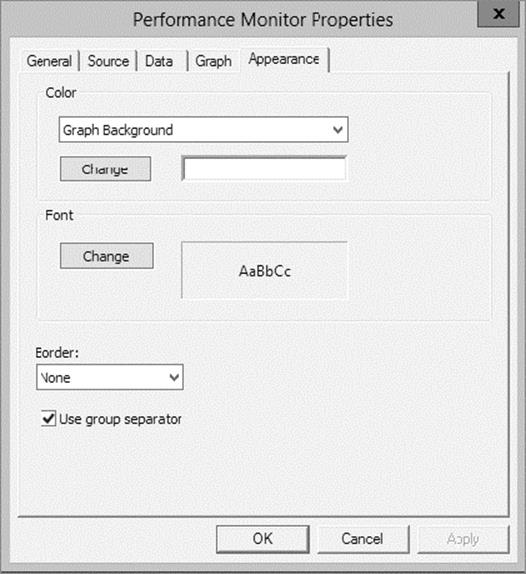
FIGURE 1.11 The Appearance tab of the Performance Monitor Properties dialog box
Now that you have an idea of the types of information Performance Monitor tracks and how this data is displayed, you’ll take a look at another feature—saving and analyzing performance data.
Saving and Analyzing Data with Performance Logs and Alerts
One of the most important aspects of monitoring performance is that it should be done over a given period of time (referred to as a baseline). So far, I have shown you how you can use Performance Monitor to view statistics in real time. I have, however, also alluded to using Performance Monitor to save data for later analysis. Now let’s take a look at how you can do this.
When viewing information in Performance Monitor, you have two main options with respect to the data on display:
View Current Activity When you first open the Performance icon from the Administrative Tools folder, the default option is to view data obtained from current system information. This method of viewing measures and displays various real-time statistics on the system’s performance.
View Log File Data This option allows you to view information that was previously saved to a log file. Although the performance objects, counters, and instances may appear to be the same as those viewed using the View Current Activity option, the information itself was actually captured at a previous point in time and stored into a log file.
Log files for the View Log File Data option are created in the Performance Logs And Alerts section of the Windows Server 2012 R2 Performance tool.
Three items allow you to customize how the data is collected in the log files:
Counter Logs Counter logs record performance statistics based on the various performance objects, counters, and instances available in Performance Monitor. The values are updated based on a time interval setting and are saved to a file for later analysis.
Circular Logging In circular logging, the data that is stored within a file is overwritten as new data is entered into the log. This is a useful method of logging if you want to record information only for a certain time frame (for example, the past four hours). Circular logging also conserves disk space by ensuring that the performance log file will not continue to grow over certain limits.
Linear Logging In linear logging, data is never deleted from the log files, and new information is added to the end of the log file. The result is a log file that continually grows. The benefit is that all historical information is retained.
Now that you have an idea of the types of functions that are supported by the Windows Server 2012 R2 Performance tools, you can learn how you can apply this information to the task at hand—monitoring and troubleshooting your Windows network.
![]()
Real-World Performance Monitoring
In our daily jobs as system engineers and administrators, we come across systems that are in need of our help…and may even ask for it. You, of course, check your Event Viewer and Performance Monitor and perform other tasks that help you troubleshoot. But what is really the most common problem that occurs? From my experience, I’d say that you suffer performance problems many times if your Windows Server 2012 R2 operating system is installed on a subpar system. Either the server hardware isn’t enterprise class or the minimum hardware requirements weren’t addressed. Most production servers suffer from slow response times, lagging, and so on, because money wasn’t spent where it should have been in the first place—on the server’s hardware requirements.
Using Other Performance-Monitoring Tools
Performance Monitor allows you to monitor different parameters of the Windows Server 2012 R2 operating system and associated services and applications. However, you can also use three other tools to monitor performance in Windows Server 2012 R2. They are Network Monitor, Task Manager, and Event Viewer. All three of these tools are useful for monitoring different areas of overall system performance and for examining details related to specific system events. In the following sections, you’ll take a quick look at these tools and how you can best use them.
The Network Monitor
Although Performance Monitor is a great tool for viewing overall network performance statistics, it isn’t equipped for packet-level analysis and doesn’t give you much insight into what types of network traffic are traveling on the wire. That’s where the Network Monitor tool comes in. Network Monitor has two main components: the Network Monitor Agent and the Network Monitor tool.
The Network Monitor Agent is available for use with Windows XP, Windows Server 2003, Windows Vista, Windows 7, Windows 8, Windows Server 2008, Windows Server 2008 R2, Windows Server 2012, and Windows Server 2012 R2. The agent allows you to track network packets. When you install the Network Monitor Agent, you will also be able to access the Network Segment System Monitor counter.
On Windows Server 2012 R2 computers, you’ll see the Network Monitor icon appear in the Administrative Tools program group. You can use the Network Monitor tool to capture data as it travels on your network.
A version of Network Monitor is available for free with Windows Server 2012 R2. The full version of Network Monitor is available at Microsoft’s download server. For more information, see www.microsoft.com/downloads/.
Once you have captured the data of interest, you can save it to a capture file or further analyze it using Microsoft Message Analyzer. Experienced network and system administrators can use this information to determine how applications are communicating and the types of data that are being passed via the network.
For the exam, you don’t need to understand the detailed information that Network Monitor displays, but you should be aware of the types of information that you can view and when you should use Network Monitor.
Task Manager
Performance Monitor is designed to allow you to keep track of specific aspects of system performance over time. But what do you do if you want to get a quick snapshot of what the local system is doing? Creating a System Monitor chart, adding counters, and choosing a view is overkill. Fortunately, the Windows Server 2012 R2 Task Manager has been designed to provide a quick overview of important system performance statistics without requiring any configuration. Better yet, it’s always readily available.
You can easily access Task Manager in several ways:
§ Right-click the Windows taskbar and then click Task Manager.
§ Press Ctrl+Alt+Del and then select Task Manager.
§ Press Ctrl+Shift+Esc.
Each of these methods allows you to access a snapshot of the current system performance quickly.
Once you access Task Manager, you will see the following five tabs:
Processes Tab The Processes tab shows you all of the processes that are currently running on the local computer. By default, you’ll be able to view how much CPU time and memory a particular process is using. By clicking any of the columns, you can quickly sort by the data values in that particular column. This is useful, for example, if you want to find out which processes are using the most memory on your server.
By accessing the performance objects in the View menu, you can add columns to the Processes tab. Figure 1.12 shows a list of the current processes running on a Windows Server 2012 R2 computer.
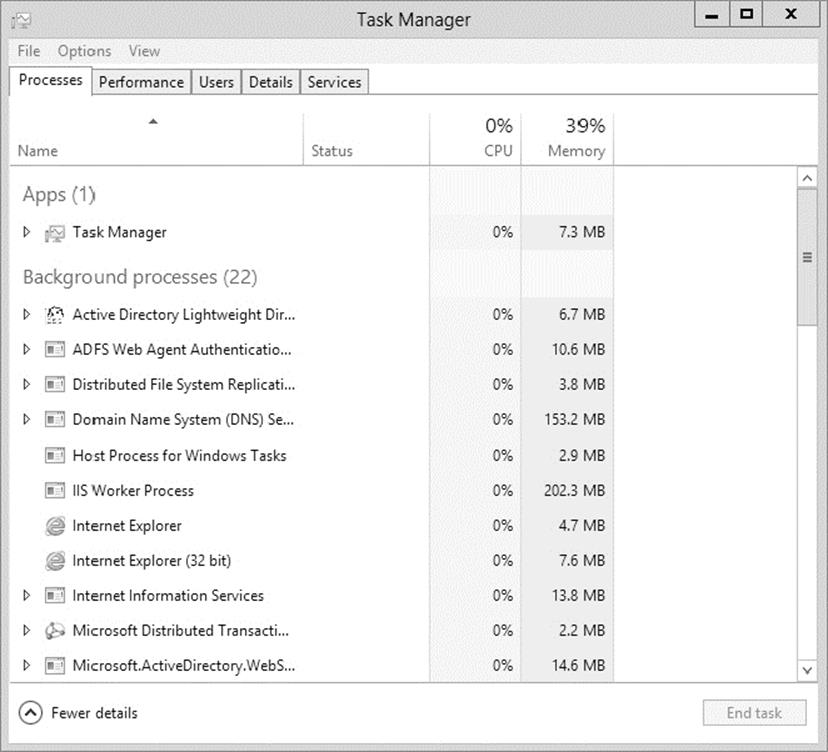
FIGURE 1.12 Viewing process statistics and information using Task Manager
Performance Tab One of the problems with using Performance Monitor to get a quick snapshot of system performance is that you have to add counters to a chart. Most system administrators are too busy to take the time to do this when all they need is basic CPU and memory information. That’s where the Performance tab of Task Manager comes in. Using the Performance tab, you can view details about how memory is allocated on the computer and how much of the CPU is utilized (see Figure 1.13).
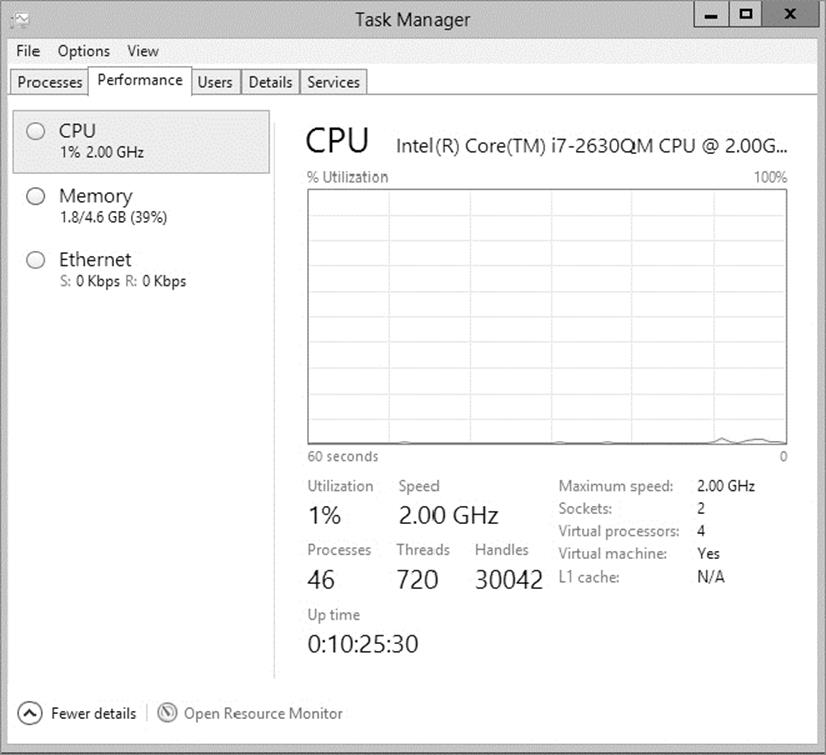
FIGURE 1.13 Viewing CPU and memory performance information using Task Manager
Users Tab The Users tab (see Figure 1.14) lists the currently active user accounts. This is particularly helpful if you want to see who is online and quickly log off or disconnect users. You can also send a console message to any remote user in the list by clicking the Send Message button. (The button is grayed out in Figure 1.14 because you cannot send a message to yourself. If you select a different user, the button will be available.)
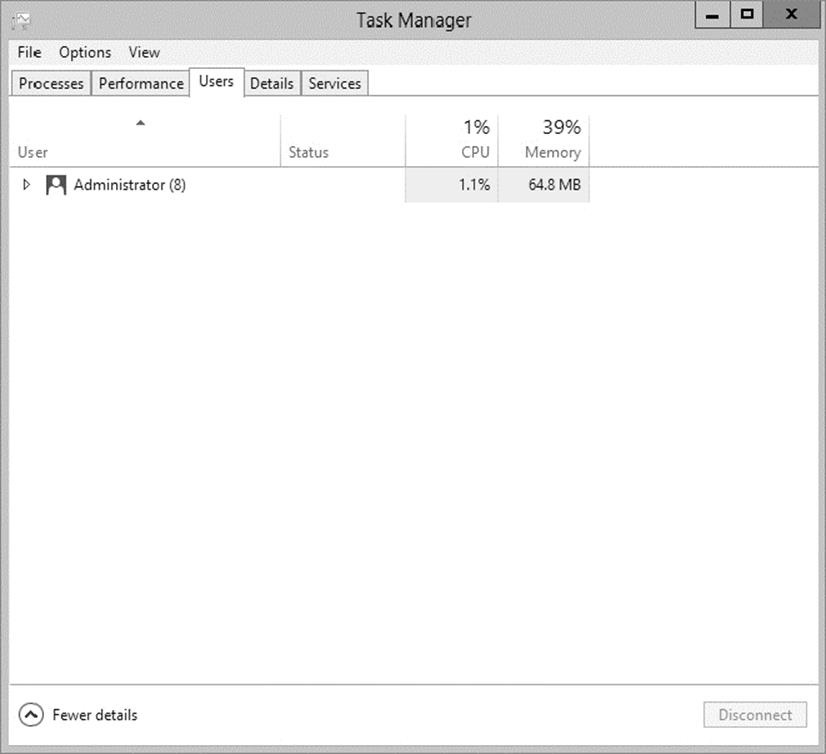
FIGURE 1.14 Viewing user information using Task Manager
Details Tab The Details tab (see Figure 1.15) shows you what applications are currently running on the system. From this location, you can stop an application from running by right-clicking the application and choosing Stop. You also have the ability to set your affinity level here. By setting the affinity, you can choose which applications will use which processors on your system.
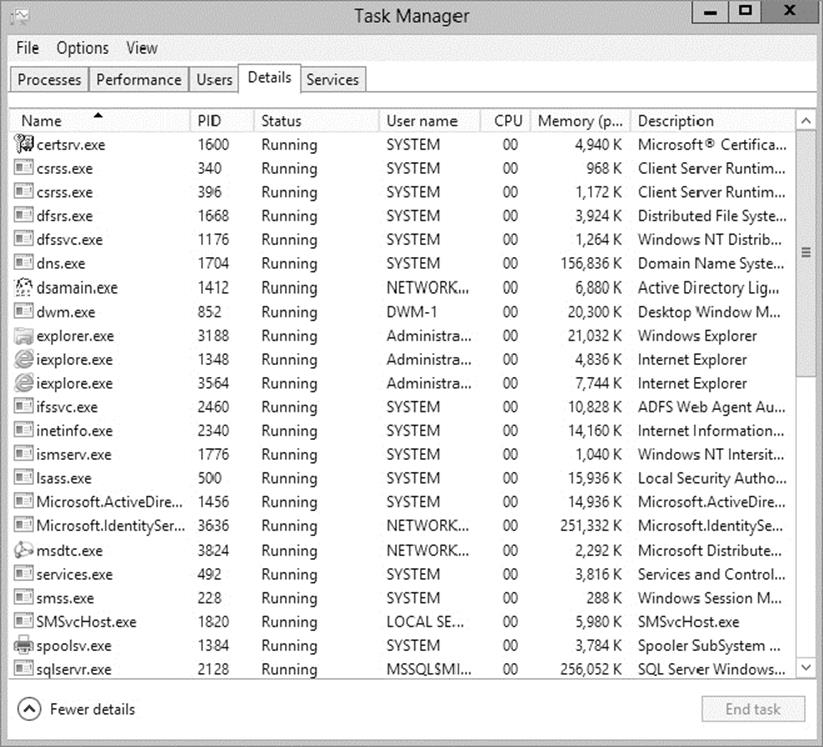
FIGURE 1.15 Viewing applications that are currently running using Task Manager
Services Tab The Services tab (see Figure 1.16) shows you what services are currently running on the system. From this location, you can stop a service from running by right-clicking the service and choosing Stop. The Open Services link launches the Services MMC.
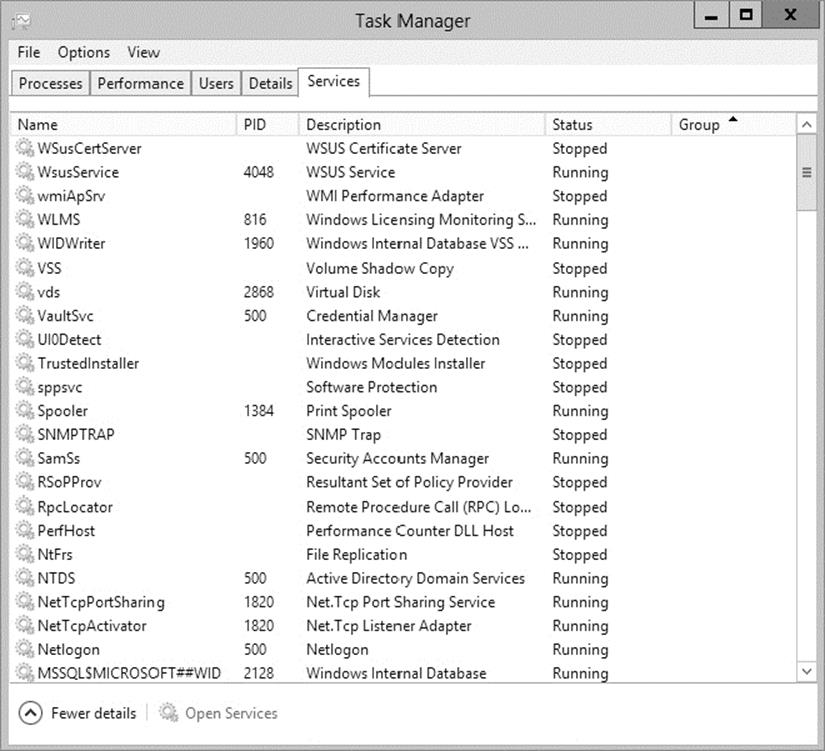
FIGURE 1.16 Viewing services information using Task Manager
These tabs can be different on Windows Client machines. For example, Windows 7 has six tabs, not five, and Windows 8 has seven tabs.
As you can see, Task Manager is useful for providing important information about the system quickly. Once you get used to using Task Manager, you won’t be able to get by without it!
Make sure that you use Task Manager and familiarize yourself with all that it can do; you can end processes that have become intermittent, kill applications that may hang the system, view NIC performance, and so on. In addition, you can access this tool quickly to get an idea of what could be causing you problems. Event Viewer, Network Monitor, and Performance Monitor are all great tools for getting granular information on potential problems.
Event Viewer
Event Viewer is also useful for monitoring network information. Specifically, you can use the logs to view any information, warnings, or alerts related to the proper functioning of the network. You can access Event Viewer by selecting Administrative Tools ⇒ Event Viewer. Clicking any of the items in the left pane displays the various events that have been logged for each item. Figure 1.17 shows the contents of the Directory Service log.
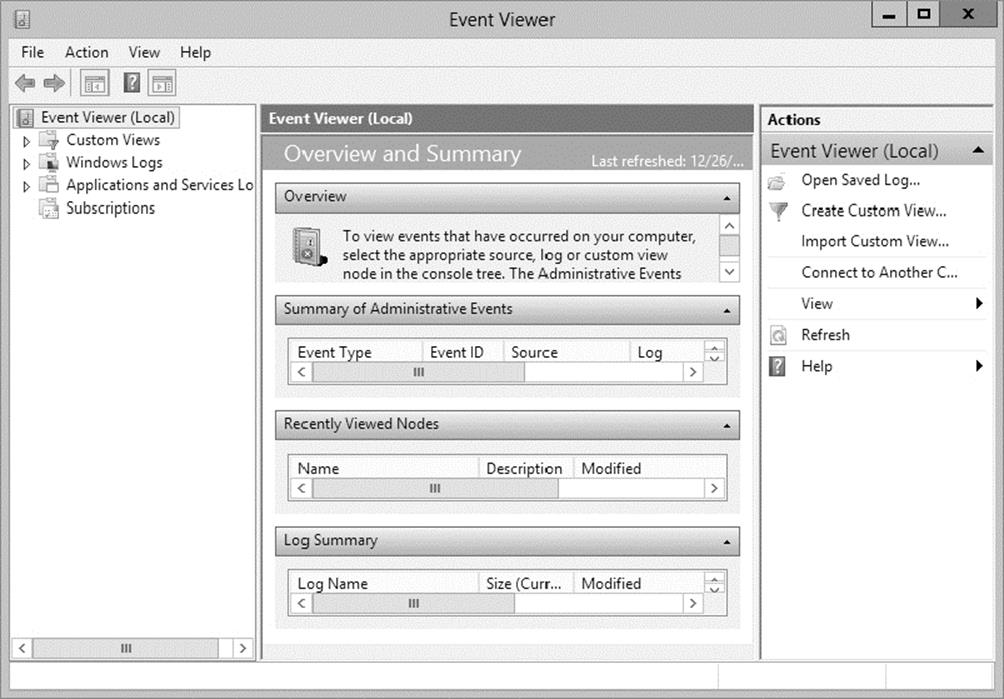
FIGURE 1.17 Event Viewer
Each event is preceded by a blue i icon. That icon designates that these events are informational and do not indicate problems with the network. Rather, they record benign events such as Active Directory startup or a domain controller finding a global catalog server.
A yellow warning icon or a red error icon, both of which are shown in Figure 1.18, indicate problematic or potentially problematic events. Warnings usually indicate a problem that wouldn’t prevent a service from running but might cause undesired effects with the service in question. For example, I was configuring a site with some fictional domain controllers and IP addresses. My local domain controller’s IP address wasn’t associated with any of the sites, and Event Viewer generated a warning. In this case, the local domain controller could still function as a domain controller, but the site configuration could produce undesirable results.
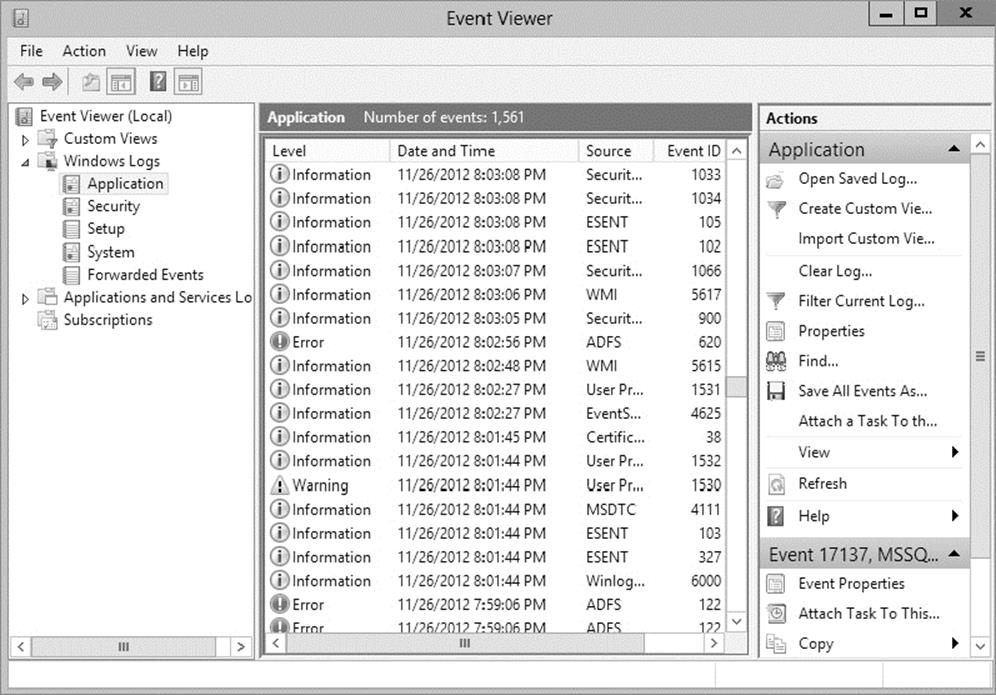
FIGURE 1.18 Information, errors, and warnings in Event Viewer
Error events almost always indicate a failed service, application, or function. For instance, if the dynamic registration of a DNS client fails, Event Viewer will generate an error. As you can see, errors are more severe than warnings because, in this case, the DNS client cannot participate in DNS at all.
Double-clicking any event opens the Event Properties dialog box, as shown in Figure 1.19, which displays a detailed description of the event.
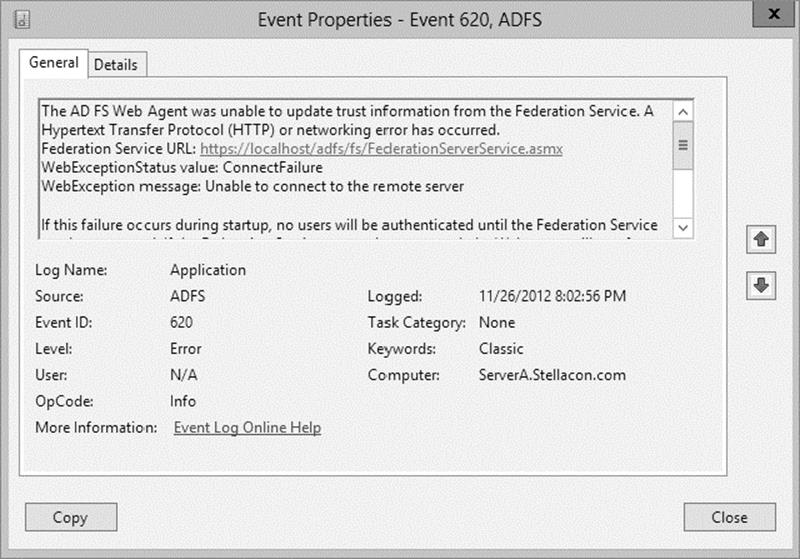
FIGURE 1.19 An Event Properties dialog box
Event Viewer can display thousands of different events, so it would be impossible to list them all here. The important points of which you should be aware are the following:
§ Information events are always benign.
§ Warnings indicate noncritical problems.
§ Errors indicate show-stopping events.
Let’s discuss some of the logs and the ways you can view data:
Applications and Services The applications and services logs are part of Event Viewer where applications (for example, Exchange) and services (DNS) log their events. DFS events would be logged in this part of Event Viewer. An important log in this section is the DNS Server log (see Figure 1.20). This is where all of your DNS events get stored.
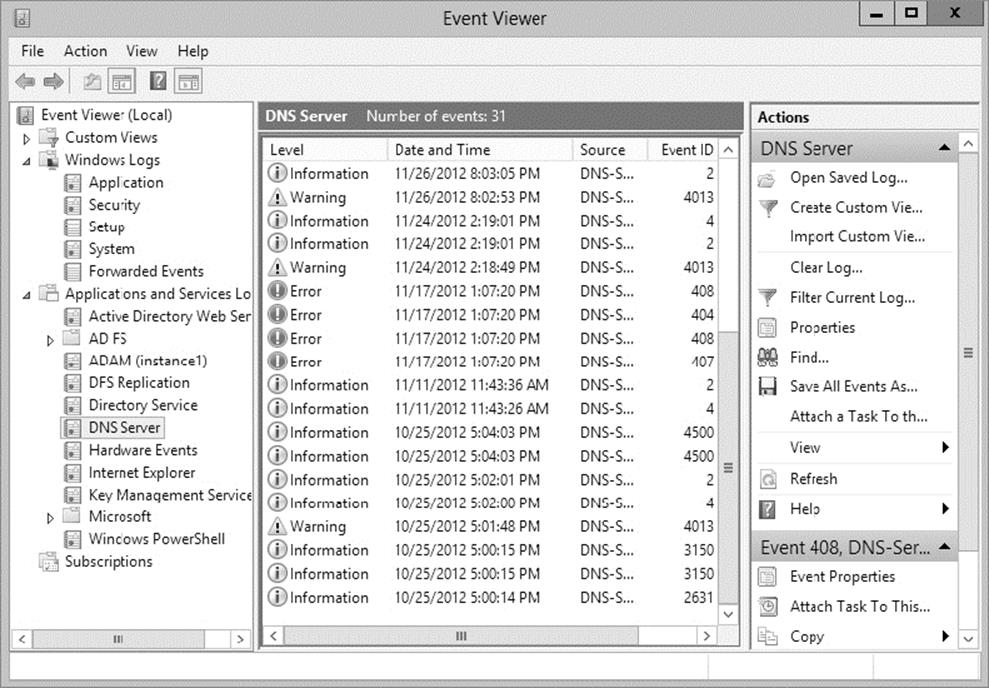
FIGURE 1.20 The applications and services DNS Server log
Custom Views Custom views allow you to filter events (see Figure 1.21) to create your own customized look. You can filter events by event level (critical, error, warning, and so on), by logs, and by source. You also have the ability to view events occurring within a specific timeframe. This allows you to look only at the events that are important to you.
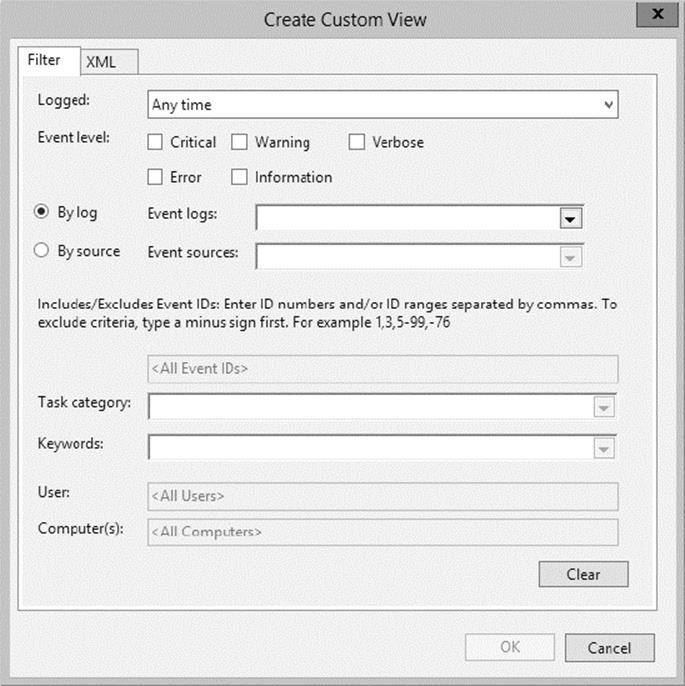
FIGURE 1.21 Create Custom View dialog box
Subscriptions Subscriptions allow a user to receive alerts about events that you predefine. In the Subscription Properties dialog box (see Figure 1.22), you can define what type of events you want notifications about and the notification method. The Subscriptions section is an advanced alerting service to help you watch for events.
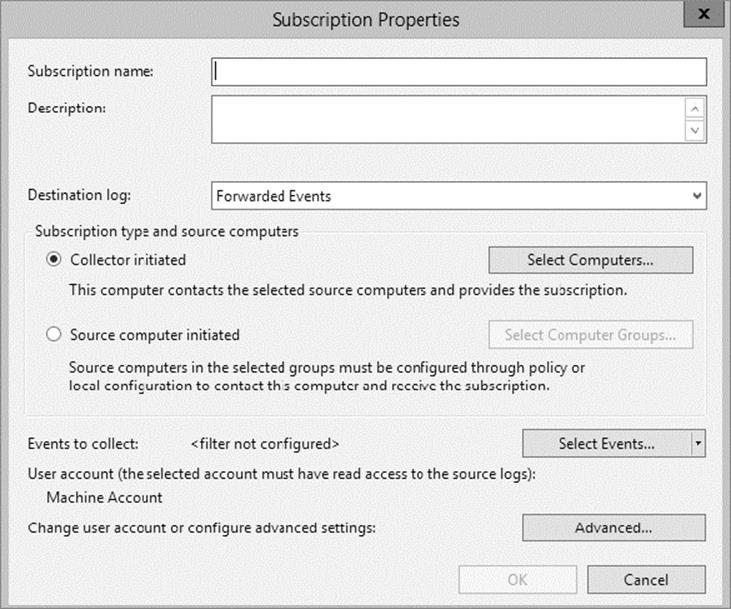
FIGURE 1.22 Subscription Properties dialog box
Microsoft Baseline Security Analyzer
The Microsoft Baseline Security Analyzer (MBSA) is a security assessment utility that you can download from the Microsoft website at the following location:
www.microsoft.com/en-us/download/details.aspx?id=19892
The filename of the download is mbsasetup.msi. It verifies whether your computer has the latest security updates and whether any common security violation configurations have been applied to your computer. MBSA can scan the following programs and operating systems:
§ Windows 2000
§ Windows XP
§ Windows Vista
§ Windows 7
§ Windows 8
§ Windows Server 2003
§ Windows Server 2008
§ Windows Server 2008 R2
§ Windows Server 2012
§ Windows Server 2012 R2
§ IIS 5 or newer
§ Internet Explorer, versions 6.0 and newer
§ SQL Server 7 or newer
§ Microsoft Office 2000 or newer
§ Windows Media Player, versions 6.4 and newer
To use MBSA, the computer must meet the following requirements:
§ It must be running Windows XP, Windows Vista, Windows 7, Windows 8, Windows Server 2003, Windows Server 2008, Windows Server 2008 R2, Windows Server 2012, or Windows Server 2012 R2.
§ It must be running Internet Explorer 5.01 or newer.
§ It must have an XML parser installed for full functionality.
§ It must have the Workstation and Server services enabled.
§ It must have Client for Microsoft Networks installed.
Using the GUI Version of MBSA
Once you have installed MBSA, you can access it by using the Windows key and choosing Microsoft Baseline Security Analyzer or by opening the command prompt and executing mbsa.exe. This opens the Baseline Security Analyzer utility. You can select from Scan A Computer, Scan More Than One Computer, and View Existing Security Reports.
When you click Scan A Computer, the Pick A Computer To Scan dialog box appears. You can specify that you want to scan a computer based on a computer name or IP address. You can also specify the name of the security report that will be generated.
The following are options for the security scan:
§ Check For Windows Vulnerabilities
§ Check For Weak Passwords
§ Check For IIS Vulnerabilities
§ Check For SQL Vulnerabilities
§ Check For Security Updates
If you use the Check For Security Updates option and are using WSUS, you can specify the name of the WSUS server that should be checked for the security updates.
Once you have made your selections, click Start Scan. When the scan is complete, the security report will be automatically displayed. If you have scanned multiple computers, you can sort the security reports based on issue name or score (worst first or best first).
Using the MBSA Command-Line Utility mbsacli.exe
After Microsoft Baseline Security Analyzer has been installed, you can use the command-line utility mbsacli.exe. Enter mbsacli.exe/hf and then customize the command execution with any of the options defined in Table 1.5.
TABLE 1.5 mbsacli.exe /hf command-line options
|
Option |
Description |
|
-h host name[, host name, …] |
Scans the specified host. You can specify that you want to scan multiple host computers by separating the hostnames with commas. |
|
-fh filename |
Scans the NetBIOS name of each computer that is to be scanned, and it saves the information as text within a file specified by filename. |
|
-i xxxx.xxxx.xxxx.xxxx[, xxxx.xxxx.xxxx.xxxx, …] |
Scans a computer based on the specified IP address. You can scan multiple computers by IP address by separating the IP addresses with commas. |
|
-fip filename |
Looks in the text file specified by filename for IP addresses and scans the computers with those IP addresses. The file can have up to a maximum of 256 IP addresses. |
|
-d domainname |
Scans the specified domain. |
|
-n |
Scans all of the computers on the local network. |
Simple Network Management Protocol
The Simple Network Management Protocol (SNMP) is a TCP/IP protocol monitor. The SNMP service creates trap messages that are then sent to a trap destination. One way you might use SNMP is to trap messages that don’t contain an appropriate hostname for a particular service.
When you set up SNMP, you set up communities. Communities are groupings of computers that help monitor each other.
Windows Server 2012 R2 includes SNMP with the operating system. To install the service, you must use Server Manager. In Exercise 1.4, you will walk through the process of installing the SNMP service.
EXERCISE 1.4: Installing SNMP
1. Open Server Manager by clicking the Server Manager icon on the taskbar.
2. Click option number 2, Add Roles And Features.
3. Choose role-based or feature-based installation and click Next.
4. Choose your server and click Next.
5. Click Next at the Select Server Roles screen.
6. When the Select Features window appears, click the SNMP Services check box. If an ADD Features dialog box appears, click the Add Features button. Click Next.
7. The Confirm Installation page appears. Click Install.
8. Click Close. Exit the Server Manager application.
Now that you have installed the SNMP service, you have to set up your community so that you can start trapping messages. As stated earlier, communities are a grouping of computers to help monitor each other. After you have created the initial community, you can add other computer systems to the community.
In Exercise 1.5, you will walk through the steps to set up the SNMP service and also set up your first community name. To complete this exercise, you must have completed Exercise 1.4.
EXERCISE 1.5: Configuring SNMP
1. Open Computer Management by pressing the keyboard’s Windows Key and selecting Administrative Tools ⇒ Computer Management.
2. Expand Services And Applications. Click Services. In the right pane, double-click SNMP Service.
3. The SNMP Service Properties window will open. Click the Traps tab. In the Community Name box, enter Community1. Click the Add To List button.
4. Click the General tab. Click the Start button to start the service. Click OK.
5. Close Computer Management.
Summary
This chapter began with a discussion of WSUS and what Windows Update can do for your network. You learned why you would want to use a WSUS server instead of having clients manually connect to the Internet to receive their updates.
The chapter also covered file server and print server optimization and reliability, including many tools that can help you monitor and manage your systems and the basics of troubleshooting the network in times of disaster.
Monitoring performance on servers is imperative to rooting out any issues that may affect your network. If your systems are not running at their best, your end users may experience issues such as latency, or worse, you may experience corruption in your network data. Either way, it’s important to know how to monitor the performance of your servers. You also looked at ways system administrators can optimize the operations of servers to ensure that end users experience adequate performance.
You also examined how to use the various performance-related tools that are included with Windows Server 2012 R2. Tools such as Performance Monitor, Task Manager, Network Monitor, and Event Viewer can help you diagnose and troubleshoot system performance issues. These tools will help you find typical problems related to memory, disk space, and any other hardware-related issues you may experience. Knowing how to use tools to troubleshoot and test your systems is imperative, not only to passing the exam but also to performing your duties at work. To have a smoothly running network environment, it is vital that you understand the issues related to the reliability and performance of your network servers and domain controllers.
Exam Essentials
Understand WSUS. Windows Server Update Services is one way to have your end users receive important updates from Microsoft. WSUS gives administrators the ability to download, test, and approve updates before they get released onto the network.
Understand the methodology behind troubleshooting performance. By following a set of steps that involves making measurements and finding bottlenecks, you can systematically troubleshoot performance problems.
Be familiar with the features and capabilities of the Windows Server 2012 R2 Performance Monitor tool for troubleshooting performance problems. The Performance Monitor administrative tool is a powerful method for collecting data about all areas of system performance. Through the use of performance objects, counters, and instances, you can choose to collect and record only the data of interest and use this information for pinpointing performance problems.
Know the importance of common performance counters. Several important performance-related counters deal with general system performance. Know the importance of monitoring memory, print server, CPU, and network usage on a busy server.
Understand the role of other troubleshooting tools. Windows Task Manager, Network Monitor, SNMP, Baseline Security Analyzer, and Event Viewer can all be used to diagnose and troubleshoot configuration- and performance-related issues.
Understand how to troubleshoot common sources of server reliability problems. Windows Server 2012 R2 has been designed to be a stable, robust, and reliable operating system. Should you experience intermittent failures, you should know how to troubleshoot device drivers and buggy system-level software.
Review Questions
1. You need to stop an application from running in Task Manager. Which tab would you use to stop an application from running?
A. Performance
B. Users
C. Options
D. Details
2. You are the network administrator for a Fortune 500 company. You are responsible for all client computers at the central campus. You want to make sure that all of the client computers are secure. You decide to use MBSA to scan your client computers for possible security violations. You want to use the command-line version of MBSA to scan your computers based on IP address. Which of the following commands should you use?
A. mdsacli.exe /hf -i xxxx.xxxx.xxxx.xxxx
B. mdsacli.exe /ip xxxx.xxxx.xxxx.xxxx
C. mbsa.exe /hf -ip xxxx.xxxx.xxxx.xxxx
D. mbsa.exe /ip xxxx.xxxx.xxxx.xxxx
3. You are the network administrator for a Fortune 500 company. You are responsible for all client computers at the central campus. You want to make sure that all of the client computers have the most current software installed for their operating systems, including software in the categories Critical Updates and Service Packs, Windows Server 2012 R2 Family, and Driver Updates. You want to automate the process as much as possible, and you want the client computers to download the updates from a central server that you are managing. You decide to use Windows Server Update Services. The WSUS server software has been installed on a server called WSUSServer. You want to test the WSUS server before you set up group policies within the domain. You install Windows 8. Which of the following registry entries needs to be made for the client to specify that the client should use WSUSServer for Windows Update? (Choose all that apply.)
A. Use HKEY_LOCAL_MACHINE\Software\Policies\Microsoft\Windows\WindowsUpdate\AU\UseWUServer and specify 0 data.
B. Use HKEY_LOCAL_MACHINE\Software\Policies\Microsoft\Windows\WindowsUpdate\AU\UseWUServer and specify 1 for data.
C. Use HKEY_LOCAL_MACHINE\Software\Policies\Microsoft\Windows\WindowsUpdate\AU\WUServer and specify http://WSUSServer.
D. Use HKEY_LOCAL_MACHINE\Software\Policies\Microsoft\Windows\WindowsUpdate\AU\WUServer and specify WSUSServer.
E. Use HKEY_LOCAL_MACHINE\Software\Policies\Microsoft\Windows\WindowsUpdate\WUServer and specify http://WSUSServer.
F. Use HKEY_LOCAL_MACHINE\Software\Policies\Microsoft\Windows\WindowsUpdate\WUServer and specify WSUSServer.
4. You are the administrator of a new Windows Server 2012 R2 machine. You need to install WSUS. From where do you install WSUS?
A. Add/Remove Programs
B. Programs
C. Server Manager
D. Administrative Tools
5. You are a network administrator for your company. The network consists of a single Active Directory domain. All servers run Windows Server 2012 R2. Windows Server Update Services (WSUS) is installed on two servers, SERVERA and SERVERB. SERVERA receives software updates from Microsoft Windows Update servers. You manually synchronized SERVERB with the Windows Update servers, and now you need to complete the WSUS configuration on SERVERB. Which of the following is not a step that you might take to complete the configuration of WSUS on SERVERB?
A. Approve the current updates.
B. Set SERVERB to receive updates from SERVERA and automatically synchronize with approved updates on SERVERA.
C. Set SERVERB to draw updates automatically from whichever sources that SERVERA is set to draw from.
D. Set SERVERB to receive daily updates automatically at a given time.
6. You are the network administrator for your company. The network consists of a single Active Directory domain. All servers run Windows Server 2012 R2. All client computers run Windows 7. The company has 16 mobile sales representatives who are all members of the Power Users local group on their computers. From 6 p.m. until 7 a.m., the sales representatives’ laptops are usually turned off and disconnected from the corporate network. The mobile sales representatives’ computers must receive software updates every day with minimal user interaction. While verifying the recent updates on one of the laptops, you notice that the updates from the Windows Update servers were not applied. On the Automatic Updates tab of the System Properties dialog box of the mobile computer, what should you do to make sure that software updates are applied to the computer? (Choose three.)
A. Set the scheduled time to every day at 12 a.m.
B. Select the option Automatically Download The Updates, And Install Them On The Schedule That I Specify.
C. Select the option Notify Me Before Downloading Any Updates And Notify Me Again Before Installing Them On My Computer.
D. Select the Keep My Computer Up To Date check box.
E. Select the option Download The Updates Automatically And Notify Me When They Are Ready To Be Installed.
F. Set the scheduled time to every day at 12 p.m.
7. You are responsible for managing several Windows Server 2012 R2 domain controller computers in your environment. Recently, a single hard disk on one of these machines failed, and the Active Directory database was lost. You want to perform the following tasks:
§ Determine which partitions on the server are still accessible.
§ Restore as much of the system configuration (including the Active Directory database) as possible.
Which of the following could be used to help meet these requirements?
C. Event Viewer
D. Performance Monitor
E. A hard disk from another server that is not configured as a domain controller
F. A valid system state backup from the server
8. You have been hired as a consultant to research a network-related problem at a small organization. The environment supports many custom-developed applications that are not well documented. A manager suspects that some computers on the network are generating excessive traffic and bogging down the network. You want to do the following:
§ Determine which computers are causing the problems.
§ Record and examine network packets that are coming to/from specific machines.
§ View data related only to specific types of network packets.
What tool should you use to accomplish all of the requirements?
C. Task Manager
D. Performance Monitor
E. Event Viewer
F. Network Monitor
9. You need to install Microsoft Baseline Security Analyzer. How do you need to do the install?
. Download MBSA from Microsoft’s website.
A. Install from Server Manager.
B. Use Add/Remove Programs.
C. Install from Programs.
10. While setting up WSUS, you need to configure the server from which you will be getting your Microsoft updates. Under which option would you set this up?
. Products And Classifications
A. Update Files and Languages
B. Update Source And Proxy Server
C. Synchronization Schedule
All materials on the site are licensed Creative Commons Attribution-Sharealike 3.0 Unported CC BY-SA 3.0 & GNU Free Documentation License (GFDL)
If you are the copyright holder of any material contained on our site and intend to remove it, please contact our site administrator for approval.
© 2016-2026 All site design rights belong to S.Y.A.