Windows Server 2012 R2 Essentials & Configuration (2014)
Chapter 5. Optimizing system performance
§ Preparing for monitoring
§ Performance logging
§ Tuning system performance
Monitoring a server isn’t something you should do haphazardly. You need to have a clear plan—a set of goals you hope to achieve. Troubleshooting a performance problem is a key reason for monitoring. For example, users might be having problems connecting to an application running on a server, and you might want to monitor the server to identify the source of the problem.
Another common reason for wanting to monitor a server is to improve server performance. You do this by improving disk I/O, reducing CPU usage, and cutting down the network traffic load on the server. Unfortunately, you often need to make trade-offs when it comes to resource usage. For example, as the number of users accessing a server grows, you might not be able to reduce the network traffic load, but you might be able to improve server performance through load balancing or by distributing key data files on separate drives.
Preparing for monitoring
Before you start monitoring a server, you might want to establish baseline performance metrics for your server. To do this, you measure server performance at various times and under different load conditions. You can then compare the baseline performance with subsequent performance to determine how the server is performing. Performance metrics that are well above the baseline measurements might indicate areas where the server needs to be optimized or reconfigured.
Creating a monitoring plan
After you establish baseline metrics, you should formulate a monitoring plan. A comprehensive monitoring plan includes the following steps:
1. Determine which server events should be monitored to help you accomplish your goal.
2. Set filters to reduce the amount of information collected.
3. Configure performance counters to watch resource usage.
4. Log the event data so that it can be analyzed.
5. Analyze the event data to help find solutions to problems.
These procedures are examined later in this chapter. Although you should usually develop a monitoring plan, sometimes you might not want to go through all these steps to monitor your server. For example, you might want to monitor and analyze activity as it happens rather than log and analyze the data later.
The primary tools you use to monitor your servers include the following:
§ Performance Monitor. Displays resource usage over time via counters that you configure. You can use this information to gauge the performance of the server and determine areas that can be optimized.
§ Reliability Monitor. Tracks changes to the system and compares them to changes in system stability. This gives you a graphical representation of the relationship between changes in the system configuration and changes in system stability.
§ Resource Monitor. Provides detailed information about resource usage on the server. The information provided is similar to that provided by Task Manager (though more extensive).
§ Event logs. Provides information that you can use to troubleshoot systemwide problems, including those from the operating system and configured applications. The primary logs you work with are the system, security, and application event logs, as well as logs for configured server roles.
Using the monitoring consoles
Resource Monitor, Reliability Monitor, and Performance Monitor are the tools of choice for performance tuning. You can access Resource Monitor by pressing Ctrl+Shift+Esc and then tapping or clicking the Open Resource Monitor button on the Performance tab of Task Manager. In Server Manager, you can access Resource Monitor in a stand-alone console by tapping or clicking Tools and then tapping or clicking Resource Monitor.
As shown in Figure 5-1, resource usage statistics are broken down into four categories:
§ CPU usage. The summary details show the current CPU utilization and the maximum CPU frequency (as related to processor idling). Expanding the CPU entry (by tapping or clicking the options button) displays a list of currently running executables by name, process ID, description, status, number of threads used, current CPU utilization, and average CPU utilization.
§ Disk usage. The summary details show the number of kilobytes per second being read from or written to disk, and the highest percentage of usage. Expanding the Disk entry (by tapping or clicking the options button) displays a list of currently running executables that are performing or have performed I/O operations. The list is displayed by name, process ID, file being read or written, average number of bytes being read per second, average number of bytes being written per second, total number of bytes being read and written per second, I/O priority, and the associated disk response time.
§ Network usage. The summary details show the current network bandwidth utilization in kilobytes and the percentage of total bandwidth utilization. Expanding the Network entry (by tapping or clicking the options button) displays a list of currently running executables that are transferring or have transferred data on the network. The list is displayed by name, process ID, server or IP address being contacted, average number of bytes being sent per second, average number of bytes received per second, and total bytes sent or received per second.
§ Memory usage. The summary details show the current memory utilization and the number of hard faults occurring per second. Expanding the Memory entry (by tapping or clicking the options button) displays a list of currently running executables by name, process ID, hard faults per second, commit memory in KB, working set memory in KB, shareable memory in KB, and private (nonshareable) memory in KB.
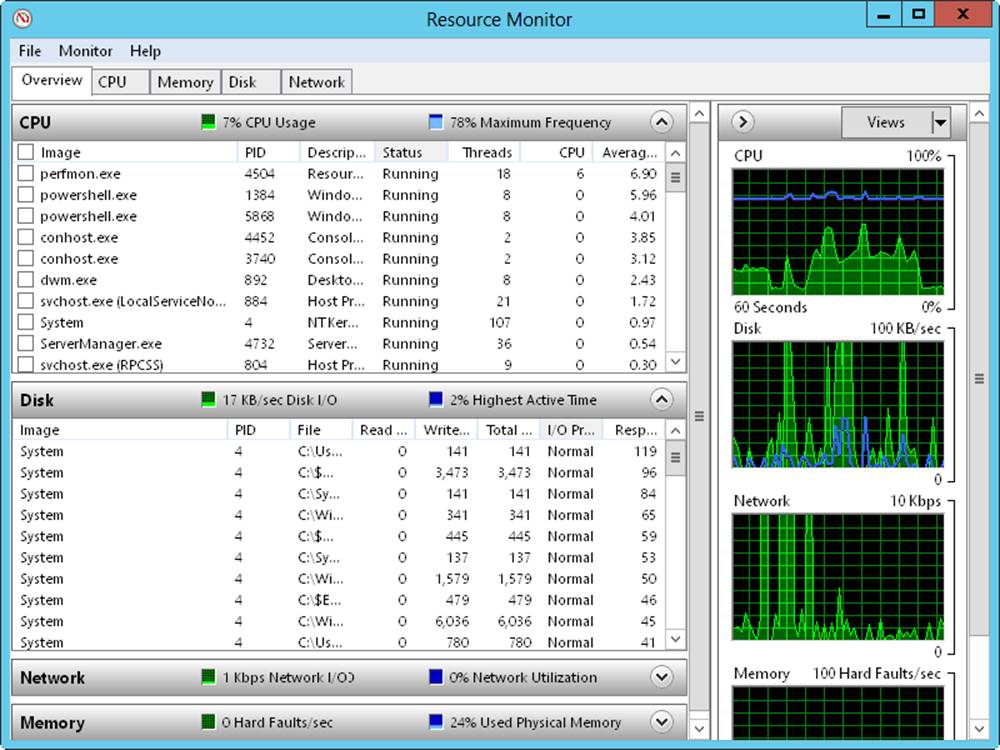
Figure 5-1. Review resource usage on the server.
TIP
You also can open Resource Monitor by typing Resource Monitor in the Everywhere search box and then pressing Enter. As with any locally installed administrative tool, Resource Monitor can only be found in an Everywhere search when you’ve selected the Show Administrative Tools option. If this option isn’t enabled, you can enable it from the Start screen. From the Start screen, press Windows key+C to display the charms and then select Settings. In the Settings panel, select Tiles, and then set Show Administrative Tools to Yes.
Performance Monitor displays statistics graphically for the set of performance parameters you’ve selected for display. These performance parameters are referred to as counters. When you install certain applications on a system, Performance Monitor might be updated with a set of counters for tracking the server’s performance. You also can update these counters when you install additional services and add-ons for the application.
In Server Manager, you can access Performance Monitor in a stand-alone console by tapping or clicking Tools and then tapping or clicking Performance Monitor. In Computer Management, you can access the tool as a snap-in in the System Tools node. Expand System Tools\Performance\Monitoring Tools, and then click Performance Monitor.
As Figure 5-2 shows, Performance Monitor creates a graph depicting the counters you’re tracking. The update interval for this graph is set to 1 second by default, but it can be configured with a different value. As is apparent when you work with Performance Monitor, the tracking information is most valuable when you record performance information in a log file so that the information can be played back. Also, Performance Monitor is helpful when you configure alerts to send messages when certain events occur.
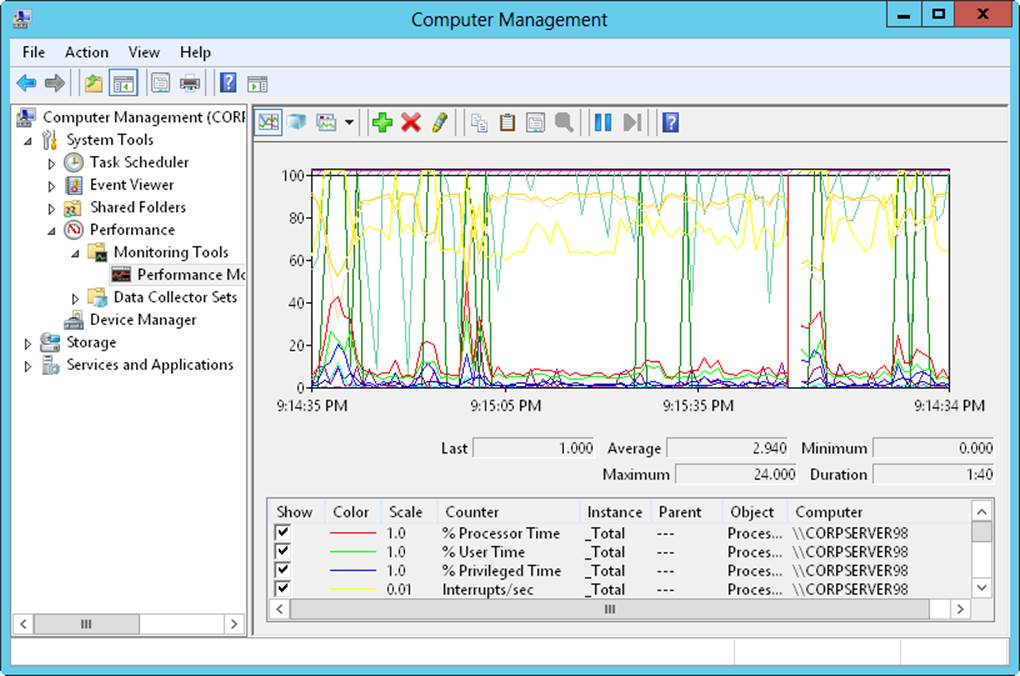
Figure 5-2. Review performance measurements for the server.
Windows Server 2012 R2 also includes Reliability Monitor. To access Reliability Monitor, follow these steps:
1. In Control Panel, under System And Security, tap or click Review Your Computer’s Status And Resolve Issues.
2. In Action Center, expand the Maintenance panel, and then tap or click View Reliability History.
Alternatively, you can run Reliability Monitor by entering perfmon /rel at a command prompt or in the Everywhere search box.
Reliability Monitor tracks changes to the server and compares them to changes in system stability, which provides a graphical representation of the relationship between changes in the system configuration and changes in system stability. Recording software installation, software removal, application failures, hardware failures, Windows failures, and key events regarding the configuration of the server provides a timeline of changes in both the server and its reliability, which you can use to pinpoint changes that are causing problems with stability. For example, if you notice a sudden drop in stability, you can tap or click a data point and then expand the related data set to find the specific event that caused the drop in stability.
Although reliability monitoring is enabled by default for Windows clients, it might be disabled for Windows servers. Opening Reliability Monitor on a server where reliability monitoring is disabled displays an information panel telling you to click here to view how to turn on or reconfigure RACTask. The RACTask is a scheduled task that runs in the background to collect reliability data.
If the RACTask is disabled, you can enable and configure the task by completing the following steps:
1. In Server Manager, on the Tools menu, click Task Scheduler. In Task Scheduler’s left pane, expand Task Scheduler Library\Microsoft\Windows, and then click the RAC node.
2. By default, the RACTask runs whenever the system is started, daily at approximately 5:00 P.M. (a random delay of up to 15 minutes is added each scheduled runtime) and when Customer Experience Improvement Program events are logged. Because performing reliability analysis and collection daily at around 5:00 P.M might not be optimal, select RacTask in the main pane and then click Properties on the Actions menu.
3. In the Properties dialog box, on the Triggers tab, select the One Time trigger, and then click Edit. Use the options provided to specify an optimal time to run this task. Cick OK twice to close the open dialog boxes.
4. With RacTask still selected in Task Scheduler, on the Action menu, click Enable. To run the task once now, on the Action menu, click Run.
Choosing counters to monitor
Performance Monitor displays information only for counters you’re tracking. Several thousand counters are available, and you’ll find counters related to just about every server role you’ve installed. The easiest way to learn about these counters is to read the explanations available in the Add Counters dialog box. Start Performance Monitor, tap or click Add on the toolbar, and then expand an object in the Available Counters list. Select the Show Description check box, and then scroll through the list of counters for this object.
When Performance Monitor is monitoring a particular object, it can track all instances of all counters for that object. Instances are multiple occurrences of a particular counter. For example, when you track counters for the Processor object on a multiprocessor system, you have a choice of tracking all processor instances or specific processor instances. If you think a particular processor is going bad or experiencing other problems, you could monitor just that processor instance.
To select which counters you want to monitor, follow these steps:
1. Performance Monitor has several views and view types. Be sure that current activity is displayed by tapping or clicking View Current Activity on the toolbar or pressing Ctrl+T. You can switch between the view types (Line, Histogram Bar, and Report) by tapping or clicking Change Graph Type or pressing Ctrl+G.
2. To add counters, tap or click Add on the toolbar, or press Ctrl+I. This displays the Add Counters dialog box, shown in Figure 5-3.
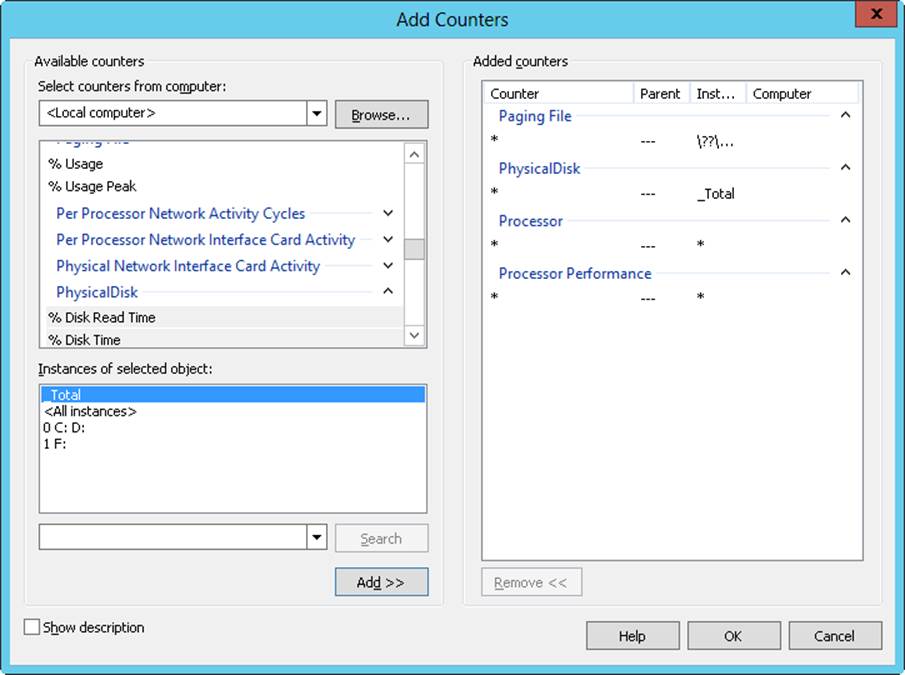
Figure 5-3. Select the objects and counters you want to monitor.
3. In the Select Counters From Computer list, enter the Universal Naming Convention (UNC) name of the server you want to work with, such as \\CorpServer84, or choose <Local Computer> to work with the local computer.
NOTE
You need to be at least a member of the Performance Monitor Users group in the domain or on the local computer to perform remote monitoring. When you use performance logging, you need to be at least a member of the Performance Log Users group in the domain or on the local computer to work with performance logs on remote computers.
4. In the Available Counters panel, performance objects are listed alphabetically. If you select an object entry by tapping or clicking it, all related counters are selected. Expanding an object entry displays all the related counters, and you can select individual counters by tapping or clicking them. For example, you could expand the entry for the Active Server Pages object and then select the Requests Failed Total, Requests Not Found, Requests Queued, and Requests Total counters.
5. When you select an object or any of its counters, the related instances are displayed. Choose All Instances to select all counter instances for monitoring, or select one or more counter instances to monitor. For example, you could select instances of Anonymous Users/Sec for individual websites or for all websites.
6. When you’ve selected an object or a group of counters for an object in addition to the object instances, tap or click Add to add the counters to the graph.
7. Repeat steps 4–6 to add other performance parameters.
8. Tap or click OK when you are finished.
TIP
Don’t try to chart too many counters or counter instances at once. You’ll make the display too difficult to read, and you’ll use system resources—namely, CPU time and memory—that might affect server responsiveness.
Performance logging
Data collector sets allow you to specify sets of performance objects and counters you want to track. After you create a data collector set, you can easily start or stop monitoring the performance objects and counters included in the set. In a way, this makes data collector sets similar to the performance logs used in early releases of Windows. However, data collector sets are much more sophisticated. You can use a single data set to generate multiple performance counters and trace logs. You can also do the following:
§ Assign access controls to manage who can access collected data.
§ Create multiple run schedules and stop conditions for monitoring.
§ Use data managers to control the size of collected data and reporting.
§ Generate reports based on collected data.
In Performance Monitor, you can review currently configured data collector sets and reports under the Data Collector Sets and Reports nodes, respectively. As shown in Figure 5-4, you’ll find data sets and reports that are user-defined and system-defined. User-defined data sets are created by users for general monitoring and performance tuning. System-defined data sets are created by the operating system to aid in automated diagnostics.
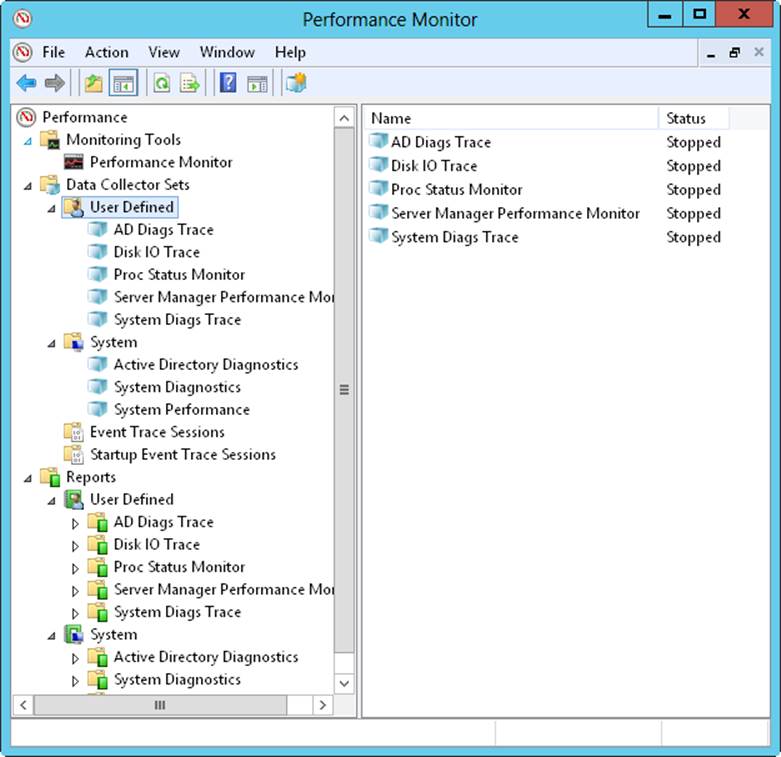
Figure 5-4. Access data collector sets and reports.
Creating and managing data collector sets
To view the currently configured data collector sets, click the Performance Monitor option in the Administrative Tools program group, and then expand the Data Collector Sets node. You can work with data collectors in a variety of ways:
§ You can view currently defined user or system data collector sets by selecting either User Defined or System, as appropriate. When you select a data collector set in the left pane, related data collectors are displayed in the main pane listed by name and type. The Trace type is for data collectors that record performance data whenever related events occur. The Performance Counter type is for data collectors that record data on selected counters when a predetermined interval has elapsed. The Configuration type is for data collectors that record changes to particular registry paths.
§ You can view running event traces by selecting Event Trace Sessions. You can then stop a data collector that is running a trace by pressing and holding or right-clicking it and then selecting Stop.
§ You can view the enabled or disabled status of event traces configured to run automatically when you start the computer by selecting Startup Event Trace Sessions. You can start a trace by pressing and holding or right-clicking a startup data collector and then selecting Start As Event Trace Session. You can delete a startup data collector by pressing and holding or right-clicking it and then tapping or clicking Delete.
§ You can save a data collector as a template that can be used as the basis of other data collectors by pressing and holding or right-clicking the data collector and then selecting Save Template. In the Save As dialog box, select a directory, enter a name for the template, and then tap or click Save. The data collector template is saved as an XML file that can be copied to other systems.
§ You can delete a user-defined data collector by pressing and holding or right-clicking it and then selecting Delete. If a data collector is running, you need to stop collecting data first and then delete the collector. Deleting a collector also deletes the related reports.
Collecting performance counter data
Data collectors can be used to record performance data on the selected counters at a specific sampling interval. For example, you could sample performance data for the CPU every 15 minutes.
To collect performance counter data, follow these steps:
1. In Performance Monitor, under the Data Collector Sets node, press and hold or right-click the User Defined node in the left pane, point to New, and then click Data Collector Set.
2. In the Create New Data Collector Set Wizard, enter a name for the data collector, such as System Performance Monitor or Processor Status Monitor. Note that if you enter an invalid name, such as one with a nonalphanumeric character, you won’t be able to continue.
3. Select the Create Manually option, and then tap or click Next.
4. On the What Type Of Data Do You Want To Include page, the Create Data Logs option is selected by default. Select the Performance Counter check box, and then tap or click Next.
5. On the Which Performance Counters Would You Like To Log page, tap or click Add. This displays the Add Counters dialog box, which you can use as previously discussed to select the performance counters to track. When you are finished selecting counters, tap or click OK.
6. On the Which Performance Counters Would You Like To Log page, enter a sampling interval and select a time unit in seconds, minutes, hours, days, or weeks. The sampling interval specifies when new data is collected. For example, if you sample every 15 minutes, the data log is updated every 15 minutes. Tap or click Next when you are ready to continue.
7. On the Where Would You Like The Data To Be Saved page, type the root path to use for logging collected data. Alternatively, tap or click Browse, and then use the Browse For Folder dialog box to select the logging directory. Tap or click Next when you are ready to continue.
BEST PRACTICES
The default location for logging is %SystemDrive%\PerfLogs\Admin. Log files can grow in size quickly. If you plan to log data for an extended period, be sure to place the log file on a drive with lots of free space. Remember, the more frequently you update the log file, the greater the drive space and CPU resource usage on the system.
8. On the Create Data Collector Set page, the Run As box lists <Default> to indicate that the log will run under the privileges and permissions of the default system account. To run the log with the privileges and permissions of another user, tap or click Change. Enter the user name and password for the account, and then tap or click OK. User names can be entered in domain\username format, such as cpandl\williams for the Williams account in the Cpandl domain.
9. Click the Open Properties For This Data Collector Set option, and then tap or click Finish. This saves the data collector set, closes the wizard, and then opens the related Properties dialog box.
10.By default, logging is configured to start manually. To configure a logging schedule, tap or click the Schedule tab, and then tap or click Add. You can now set the Active Range, Start Time, and run days for data collection.
11.By default, logging stops only if you set an expiration date as part of the logging schedule. Using the options on the Stop Condition tab, you can configure the log file to stop automatically after a specified period of time, such as seven days, or when the log file is full (if you set a maximum size limit).
12.Tap or click OK when you’ve finished setting the logging schedule and stop conditions. You can manage the data collector as explained previously.
NOTE
You can configure Windows to run a scheduled task when data collection stops. You configure tasks to run on the Tasks tab in the Properties dialog box.
Collecting performance trace data
You can use data collectors to record performance trace data whenever events related to their source providers occur. A source provider is an application or operating system service that has traceable events.
To collect performance trace data, follow these steps:
1. In Performance Monitor, under the Data Collector Sets node, press and hold or right-click the User Defined node in the left pane, point to New, and then click Data Collector Set.
2. In the Create New Data Collector Set Wizard, type a name for the data collector, such as Logon Trace or Disk IO Trace. Note that if you type an invalid name, such as one with a nonalphanumeric character, you won’t be able to continue.
3. Select the Create Manually option, and then tap or click Next.
4. On the What Type Of Data Do You Want To Include page, the Create Data Logs option is selected by default. Select the Event Trace Data check box, and then tap or click Next.
5. On the Which Event Trace Providers Would You Like To Enable page, tap or click Add. Select an event trace provider to track, and then tap or click OK. By selecting individual properties in the Properties list and tapping or clicking Edit, you can track particular property values rather than all values for the provider. Repeat this process to select other event trace providers to track. Tap or click Next when you are ready to continue.
6. Complete steps 7–12 from the procedure in the “Collecting performance counter data” section earlier in this chapter.
Collecting configuration data
You can use data collectors to record changes in registry configuration. To collect configuration data, follow these steps:
1. In Performance Monitor, under the Data Collector Sets node, press and hold or right-click the User Defined node in the left pane, point to New, and then click Data Collector Set.
2. In the Create New Data Collector Set Wizard, enter a name for the data collector, such as AD Registry or Registry Adapter Info.
3. Select the Create Manually option, and then tap or click Next.
4. On the What Type Of Data Do You Want To Include page, the Create Data Logs option is selected by default. Select the System Configuration Information check box, and then tap or click Next.
5. On the Which Registry Keys Would You Like To Record page, tap or click Add. Type the registry path to track. Repeat this process to add other registry paths to track. Tap or click Next when you are ready to continue.
6. Complete steps 7–12 from the procedure in the “Collecting performance counter data” section earlier in this chapter.
Viewing data collector reports
When you troubleshoot problems, you’ll often want to log performance data over an extended period of time and then review the data to analyze the results. For each data collector that has been or is currently active, you’ll find related data collector reports. As with data collector sets themselves, data collector reports are organized into two general categories: user-defined and system.
You can view data collector reports in Performance Monitor. Expand the Reports node, and then expand the individual report node for the data collector you want to analyze. Under the data collector’s report node, you’ll find individual reports for each logging session. A logging session begins when logging starts and ends when logging is stopped.
The most recent log is the one with the highest log number. If a data collector is actively logging, you won’t be able to view the most recent log. You can stop collecting data by pressing and holding or right-clicking a data collector set and the clicking Stop. For performance counters, collected data is shown by default in a graph view from the start of data collection to the end of data collection, as shown in Figure 5-5.
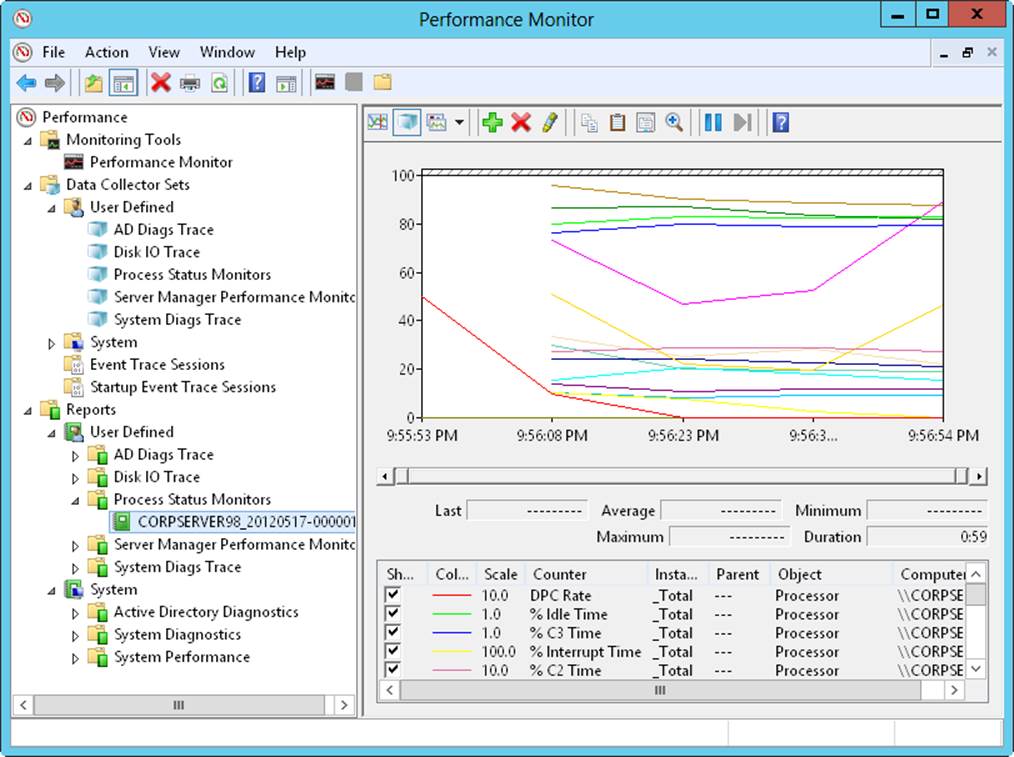
Figure 5-5. View data collector reports.
You can modify the report details by using the following process:
1. In the monitor pane, press Ctrl+Q or tap or click the Properties button on the toolbar. This displays the Performance Monitor Properties dialog box.
2. Tap or click the Source tab.
3. Specify data sources to analyze. Under Data Source, tap or click Log Files and then tap or click Add to open the Select Log File dialog box. You can now select additional log files to analyze.
4. Specify the time window you want to analyze. Tap or click Time Range, and then drag the Total Range bar to specify the appropriate starting and ending times. Drag the left edge to the right to move up the start time. Drag the right edge to the left to make the end time later.
5. Tap or click the Data tab. You can now select counters to view. Select a counter, and then tap or click Remove to remove it from the graph view. Tap or click Add to display the Add Counter dialog box, which you can use to select the counters you want to analyze.
NOTE
Only counters you selected for logging are available. If a counter you want to work with isn’t displayed, you need to modify the data collector properties, restart the logging process, and then check the logs at a later date.
6. Tap or click OK. In the monitor pane, tap or click the Change Graph Type button to select the type of graph.
Configuring performance counter alerts
You can configure alerts to notify you when certain events occur or when certain performance thresholds are reached. You can send these alerts as network messages and as events that are logged in the application event log. You can also configure alerts to start applications and performance logs.
To configure an alert, follow these steps:
1. In Performance Monitor, under the Data Collector Sets node, press and hold or right-click the User Defined node in the left pane, point to New, and then click Data Collector Set.
2. In the Create New Data Collector Set Wizard, enter a name for the data collector, such as Processor Alert or Disk IO Alert.
3. Click the Create Manually option, and then tap or click Next.
4. On the What Type Of Data Do You Want To Include page, click the Performance Counter Alert option, and then tap or click Next.
5. On the Which Performance Counters Would You Like To Monitor page, tap or click Add to display the Add Counters dialog box. This dialog box is identical to the Add Counters dialog box discussed previously. Use the dialog box to add counters that trigger the alert. Tap or click OK when you are finished.
6. In the Performance Counters panel, select the first counter, and then use the Alert When box to set the occasion when an alert for this counter is triggered. Alerts can be triggered when the counter is above or below a specific value. Select Above or Below, and then set the trigger value. The unit of measurement is whatever makes sense for the currently selected counter or counters. For example, to generate an alert if processor time is over 95 percent, select Above, and then enter 95. Repeat this process to configure other counters you’ve selected.
7. Complete steps 7–12 from the procedure in the “Collecting performance counter data” section earlier in this chapter.
Tuning system performance
Now that you know how to monitor your system, let’s look at how you can tune the operating system and hardware performance. Let’s examine the following areas:
§ Memory usage and caching
§ Processor utilization
§ Disk I/O
§ Network bandwidth and connectivity
Monitoring and tuning memory usage
Memory is often the source of performance problems, and you should always rule out memory problems before examining other areas of the system. Systems use both physical and virtual memory. To rule out memory problems with a system, you should configure application performance, memory usage, and data throughput settings, and then monitor the server’s memory usage to check for problems.
Application performance and memory usage settings determine how system resources are allocated. In most cases, you want to give the operating system and background applications the lion’s share of resources. This is especially true for Active Directory, file, print, and network and communications servers. On the other hand, for application, database, and streaming media servers, you should give the programs a server is running the most resources, as discussed in the “Setting application performance” section in Chapter 3
Using the monitoring techniques discussed previously in this chapter, you can determine how the system is using memory and check for problems. Table 5-1 provides an overview of counters you’ll want to track to uncover memory, caching, and virtual memory (paging) bottlenecks. The table is organized by issue category.
Table 5-1. Uncovering Memory-Related Bottlenecks
|
ISSUE |
COUNTERS TO TRACK |
DETAILS |
|
Physical and virtual memory usage |
Memory\Available Kbytes Memory\Committed Bytes |
Memory\Available Kbytes is the amount of physical memory available to processes running on the server. Memory\Committed Bytes is the amount of committed virtual memory. If the server has very little available memory, you might need to add memory to the system. In general, you want the available memory to be no less than 5 percent of the total physical memory on the server. If the server has a high ratio of committed bytes to total physical memory on the system, you might also need to add memory. In general, you want the committed bytes value to be no more than 75 percent of the total physical memory. |
|
Memory page faults |
Memory\Page Faults/sec Memory\Pages Input/sec Memory\Page Reads/sec |
A page fault occurs when a process requests a page in memory and the system can’t find it at the requested location. If the requested page is elsewhere in memory, the fault is called a soft page fault. If the requested page must be retrieved from disk, the fault is called a hard page fault. Most processors can handle large numbers of soft faults. Hard faults, however, can cause significant delays. Page Faults/sec is the overall rate at which the processor handles all types of page faults. Pages Input/sec is the total number of pages read from disk to resolve hard page faults. Page Reads/sec is the total disk reads needed to resolve hard page faults. Pages Input/sec will be greater than or equal to Page Reads/sec and can give you a good idea of your hard page fault rate. A high number of hard page faults could indicate that you need to increase the amount of memory or reduce the cache size on the server. |
|
Memory paging |
Memory\Pool Paged Bytes Memory\Pool Nonpaged Bytes |
These counters track the number of bytes in the paged and nonpaged pool. The paged pool is an area of system memory for objects that can be written to disk when they aren’t used. The nonpaged pool is an area of system memory for objects that can’t be written to disk. If the size of the paged pool is large relative to the total amount of physical memory on the system, you might need to add memory to the system. If the size of the nonpaged pool is large relative to the total amount of virtual memory allocated to the server, you might want to increase the virtual memory size. |
IMPORTANT
Increasing virtual memory isn’t something you should do without careful planning. For detailed guidance on tuning virtual memory, see Chapter 10, “Performance Monitoring and Tuning,” in Windows Server 2012 R2 Inside Out: Configuration, Storage, and Essentials by William R. Stanek (Microsoft Press, 2014).
Monitoring and tuning processor usage
The CPU does the actual processing of information on your server. As you examine a server’s performance, you should focus on the CPU after you eliminate memory bottlenecks. If the server’s processors are the performance bottleneck, adding memory, drives, or network connections won’t overcome the problem. Instead, you might need to upgrade the processors to faster clock speeds or add processors to increase the server’s upper capacity. You could also move processor-intensive applications, such as Microsoft SQL Server, to another server.
Before you make a decision to upgrade CPUs or add CPUs, you should rule out problems with memory and caching. If signs still point to a processor problem, you should monitor the performance counters listed in Table 5-2. Be sure to monitor these counters for each CPU installed on the server.
Table 5-2. Uncovering Processor-Related Bottlenecks
|
ISSUE |
COUNTERS TO TRACK |
DETAILS |
|
Thread queuing |
System\Processor Queue Length |
This counter displays the number of threads waiting to be executed. These threads are queued in an area shared by all processors on the system. If this counter has a sustained value of more than 10 threads per processor, you need to upgrade or add processors. |
|
CPU usage |
Processor\ % Processor Time |
This counter displays the percentage of time the selected CPU is executing a nonidle thread. You should track this counter separately for all processor instances on the server. If the % Processor Time values are high while the network interface and disk I/O throughput rates are relatively low, you need to upgrade or add processors. |
Monitoring and tuning disk I/O
With today’s high-speed disks, the disk throughput rate is rarely the cause of a bottleneck. That said, accessing memory is much faster than accessing disks. So, if the server has to do a lot of disk reads and writes, a server’s overall performance can be degraded. To reduce the amount of disk I/O, you want the server to manage memory efficiently and page to disk only when necessary. You monitor and tune memory usage as discussed in the “Monitoring and tuning memory usage” section earlier in this chapter.
In addition to memory tuning, you can monitor some counters to gauge disk I/O activity. Specifically, you should monitor the counters listed in Table 5-3.
Table 5-3. Uncovering Drive-Related Bottlenecks
|
ISSUE |
COUNTERS TO TRACK |
DETAILS |
|
Overall drive performance |
PhysicalDisk\% Disk Time in conjunction with Processorz\% Processor Time and Network Interface Connection\Bytes Total/sec |
If the % Disk Time value is high and the processor and network connection values aren’t high, the system’s hard disk drives might be creating a bottleneck. Be sure to monitor % Disk Time for all hard disk drives on the server. |
|
Disk I/O |
PhysicalDisk\Disk Writes/sec PhysicalDisk\Disk Reads/sec PhysicalDisk\Avg. Disk Write Queue Length PhysicalDisk\Avg. Disk Read Queue Length PhysicalDisk\Current Disk Queue Length |
The number of writes and reads per second tell you how much disk I/O activity there is. The write and read queue lengths tell you how many write or read requests are waiting to be processed. In general, you want very few waiting requests. Keep in mind that the request delays are proportional to the length of the queues minus the number of drives in a redundant array of independent disks (RAID) set. |
Monitoring and tuning network bandwidth and connectivity
No other factor matters more to the way a user perceives your server’s performance than the network that connects your server to the user’s computer. The delay, or latency, between when a request is made and the time it’s received can make all the difference. With a high degree of latency, it doesn’t matter if you have the fastest server on the planet: the user experiences a delay and perceives that your servers are slow.
Generally speaking, the latency experienced by the user is beyond your control. It’s a function of the type of connection the user has and the route the request takes to your server. The total capacity of your server to handle requests and the amount of bandwidth available to your servers are factors under your control, however. Network bandwidth availability is a function of your organization’s network infrastructure. Network capacity is a function of the network cards and interfaces configured on the servers.
The capacity of your network card can be a limiting factor in some instances. Although 10-Gbps networking is increasingly being used, most servers use 100-Mbps or 1-Gbps network cards, which can be configured in many ways. Someone might have configured a 1-Gbps card for 100 Mbps, or the card might be configured for half duplex instead of full duplex. If you suspect a capacity problem with a network card, you should always check the configuration.
As modern servers often ship with multiple network cards, be sure to check all enabled network adapters. If a server has multiple adapters, you might want to enable and configure NIC teaming to ensure the available bandwidth is used optimally. When NIC teaming is being used, you’ll also want to ensure the configuration is optimized for the way the server is currently being used. In Server Manager, you can configure NIC teaming as a Local Server option, which means you must log on locally to the server you want to configure or access the server through a Remote Desktop Connection.
To determine the throughput and current activity on a server’s network cards, you can check the following counters:
§ Network Adapter\Bytes Received/sec
§ Network Adapter\Bytes Sent/sec
§ Network Adapter\Bytes Total/sec
§ Network Adapter\Current Bandwidth
If the total bytes-per-second value is more than 50 percent of the total capacity under average load conditions, your server might have problems under peak load conditions. You might want to ensure that operations that take a lot of network bandwidth, such as network backups, are performed on a separate interface card. Keep in mind that you should compare these values in conjunction with PhysicalDisk\% Disk Time and Processor\% Processor Time. If the disk time and processor time values are low but the network values are very high, you might have a capacity problem. Solve the problem by optimizing the network card settings or by adding a network card. Remember, planning is everything—it isn’t always as simple as inserting a card and plugging it into the network.
All materials on the site are licensed Creative Commons Attribution-Sharealike 3.0 Unported CC BY-SA 3.0 & GNU Free Documentation License (GFDL)
If you are the copyright holder of any material contained on our site and intend to remove it, please contact our site administrator for approval.
© 2016-2026 All site design rights belong to S.Y.A.