Essential SharePoint 2013: Practical Guidance for Meaningful Business Results (2014)
Part I. Planning
Chapter 8. Developing a Value Measurement Strategy
Measurement is critical to being able to determine the level of success of your solution. As a foundation, you should focus on both the objectives for measurement and the various perspectives for your metrics. Many organizations see measurement and calculating a return on investment (ROI) as a mechanism to justify a project. However, measurement should be more than that. It should provide a process to ensure that you get the most value out of each project and initiative. This is especially true of SharePoint projects, where an effective measurement process will provide the necessary feedback about where you are going along the road to successfully leveraging your investment. At every stage in the journey, measurement (the process) and metrics (the indicators) provide a valuable means for focusing attention on business outcomes—not just ROI alone, but specific, meaningful business results described in a way that clearly demonstrates value. Having a measurement program in place helps managers assess, encourage, and reward relevant behaviors. You also can’t influence what you don’t measure.
In this chapter, we approach measurement from exactly this perspective—no matter what type of solution you are building with SharePoint, you need to understand and quantify the problem you are trying to solve so that you can determine whether the investment you will make in solving that problem is worth making. Furthermore, you have to measure your progress toward achieving that outcome objective so that you can focus your “solution energy” in the right place. Our objective is to provide a practical approach for measuring the value of investments in SharePoint solutions.
Here’s the main point: the only truly sustainable measure of value for a SharePoint solution is business impact. No matter what type of solution you are building using SharePoint 2013 as a foundation application—a public-facing Internet site, a decision support system, an intranet site, or a team or community collaboration solution—the only way to measure its value is to determine whether the estimated business benefits for the solution are greater than the estimated cost. It seems so simple, doesn’t it? Well, in theory, it is. Unfortunately, the fact is that it can be very difficult to understand the true cost for some of these types of solutions, and it can seem impossible to estimate the benefits, especially for intranet, social, and collaboration solutions where the benefits are not always direct.
Too often, organizations view adoption as the key measure of SharePoint success. Unless a solution is adopted, it cannot possibly deliver value. However, adoption alone is not a sufficient measure of success. While it is true that many failed or failing deployments can point to poor user adoption as a key indicator, the more important trait to consider is whether the solution has a clear connection to business goals. A good SharePoint solution includes a plan for demonstrating business value—a practical measurement plan that recognizes the key solution stakeholders and tells the success story in a way that clearly demonstrates business impact. The goal of this chapter is to help you identify and document these success stories.
What about the Cloud? Cloudy with a Chance of SharePoint
SharePoint 2013 presents an additional dimension in calculating both the costs and benefits of SharePoint solutions because you will need to consider the option of leveraging SharePoint in the cloud. In Chapter 11, “Taking SharePoint to the Cloud,” we talk about the benefits, risks, and considerations of on-premises versus cloud-based SharePoint solutions. However, many of the cloud-versus-on-premises trade-offs are about a dimension of measurement that will be more critical to technical decision makers than business decision makers and for the overall SharePoint investment, not specific business solutions. As long as your compliance and risk officers are comfortable with cloud-based solutions, the fact that SharePoint runs in the cloud versus on-premises will not have much relevance to the business impact assessment for an individual SharePoint solution. There can be many advantages to thinking strategically about the value of SharePoint in the cloud, not the least of which is Microsoft’s long-term commitment to a “cloud first” strategy and the fact that you will likely find it much easier to take advantage of new features and capabilities. However, you will likely be making your cloud-versus-on-premises decision for Office as whole, including not only SharePoint, but also Exchange, Lync, and the Office client itself. As a result, we cover the topic of assessing whether it is beneficial to look at SharePoint in the cloud for your organization only in Chapter 11. If you would like to explore a financial model that might help with the cloud-versus-on-premises solution, MIT professor Andrew McAfee has done some work with Google to create a model that is appropriate for small to medium-size businesses. It can be found at https://docs.google.com/spreadsheet/ccc?key=0AjFVAaH_U6vidG9EdFNrN3FyYTFhMWJERG03MERuX2c#gid=32.
What’s New in SharePoint 2013?
The fact that you need to measure is not new—but with SharePoint 2013, there are some new features that provide important measurable benefits that can be incorporated into your measurement plan. This section is by no means exhaustive, but it will help identify where you may find opportunities to focus your measurement plan for moving or upgrading to SharePoint 2013.
![]() Improvements to “social” that provide increased opportunities to benefit from people-to-people connections. Whether you are upgrading to SharePoint 2013 or starting with SharePoint for the first time, it’s likely that you are at least thinking about the social collaboration features. As we discuss throughout this book, Microsoft has made a significant investment in improving the social features of SharePoint in this latest release, and this investment will continue to mature in future upgrades. The ability to make more “people connections” and provide rich social interactions makes it much easier to find experts and keep track of topics of interest. Some of the places to look for the benefits of richer people connections include the number of new product or service innovations, reduction in the number of redundant or duplicative tools or approaches, and lower cost of doing business. SharePoint 2013, along with Yammer, enables a new suite of social interactions that previously required additional costly third-party add-on products to achieve, so there are also opportunities to reduce costs.
Improvements to “social” that provide increased opportunities to benefit from people-to-people connections. Whether you are upgrading to SharePoint 2013 or starting with SharePoint for the first time, it’s likely that you are at least thinking about the social collaboration features. As we discuss throughout this book, Microsoft has made a significant investment in improving the social features of SharePoint in this latest release, and this investment will continue to mature in future upgrades. The ability to make more “people connections” and provide rich social interactions makes it much easier to find experts and keep track of topics of interest. Some of the places to look for the benefits of richer people connections include the number of new product or service innovations, reduction in the number of redundant or duplicative tools or approaches, and lower cost of doing business. SharePoint 2013, along with Yammer, enables a new suite of social interactions that previously required additional costly third-party add-on products to achieve, so there are also opportunities to reduce costs.
![]() Improvements to search that save time and improve productivity. Search functionality has also improved significantly in SharePoint 2013. In addition to the many search improvements “behind the scenes,” users will immediately notice and be able to take advantage of rich results previews as well as many improvements to search relevance that can result in faster decisions, less wasted time getting answers, and overall improvements in information-finding activities. New analytics functionality in search can display recommendations based on usage patterns. By including recommendations on a page, you can guide users to other content that may be relevant for them, saving time and ensuring that important and valuable content is more easily found.
Improvements to search that save time and improve productivity. Search functionality has also improved significantly in SharePoint 2013. In addition to the many search improvements “behind the scenes,” users will immediately notice and be able to take advantage of rich results previews as well as many improvements to search relevance that can result in faster decisions, less wasted time getting answers, and overall improvements in information-finding activities. New analytics functionality in search can display recommendations based on usage patterns. By including recommendations on a page, you can guide users to other content that may be relevant for them, saving time and ensuring that important and valuable content is more easily found.
![]() Improvements to mobile access that enable better access to critical information “on the go” with a lower investment effort. SharePoint 2013 provides new viewing experiences across different mobile platforms, providing capabilities to work anytime, in any place, and on any device in far easier ways than in previous versions. If mobile access scenarios are critical to your business, you will likely find measurable business impact with these new features because SharePoint 2013 makes it far more cost-effective to build solutions for mobile access.
Improvements to mobile access that enable better access to critical information “on the go” with a lower investment effort. SharePoint 2013 provides new viewing experiences across different mobile platforms, providing capabilities to work anytime, in any place, and on any device in far easier ways than in previous versions. If mobile access scenarios are critical to your business, you will likely find measurable business impact with these new features because SharePoint 2013 makes it far more cost-effective to build solutions for mobile access.
![]() Improvements to the ability to brand SharePoint solutions that allow you to leverage a wider community of resources at potentially lower cost. From a technical perspective, SharePoint 2013 has some beneficial improvements for support, especially when it comes to designing user experiences and branding SharePoint sites. New features for publishing sites minimize the specialized SharePoint knowledge that was previously required to successfully brand a SharePoint site. With SharePoint 2013, designers can create a site design as they typically would using their preferred design tool (e.g., Dreamweaver or whatever else is popular these days) without having to learn to use SharePoint Designer or Visual Studio 2013 to brand a SharePoint site.
Improvements to the ability to brand SharePoint solutions that allow you to leverage a wider community of resources at potentially lower cost. From a technical perspective, SharePoint 2013 has some beneficial improvements for support, especially when it comes to designing user experiences and branding SharePoint sites. New features for publishing sites minimize the specialized SharePoint knowledge that was previously required to successfully brand a SharePoint site. With SharePoint 2013, designers can create a site design as they typically would using their preferred design tool (e.g., Dreamweaver or whatever else is popular these days) without having to learn to use SharePoint Designer or Visual Studio 2013 to brand a SharePoint site.
As with any new technology, there will be a learning curve cost associated with upgrading or migrating to SharePoint 2013. If you currently use an earlier version of SharePoint, the upgrade decision is probably more “when” rather than “if”—but you should make the timing decision based on your business needs and whether or not you actually have critical business impact scenarios that will be enabled by SharePoint 2013 and whether the cost of enabling those scenarios over the long term is greater than the short-term migration and upgrade costs. There is no magic wand to make this decision easy, and the answer will be very different for each organization. In addition to the learning curve, be aware that as with the introduction of enterprise Content Types and managed metadata in SharePoint 2010, some of the features of SharePoint 2013 cannot be effectively and successfully deployed without an investment in people resources. One key cost area to evaluate is the ongoing investment in moderators for community sites. If you are going to enable the “gamification” features in communities, moderation is not optional—someone will need to monitor how reputation points are earned and valued and ensure that communities and the conversations they enable are adding value to the business.
Why Measure?
Measurement is critical to being able to determine the level of success of your solution. As a foundation, you should focus on both the objectives for measurement and the various perspectives for your metrics.
Performance measures support decision making and communication throughout an organization to understand the progress, efficiency, value, and strategic alignment of SharePoint solutions. Performance measures for SharePoint solutions have several objectives throughout different parts of the solution life cycle—before you get started, during the solution development, and after the initial deployment—as outlined in Table 8-1.
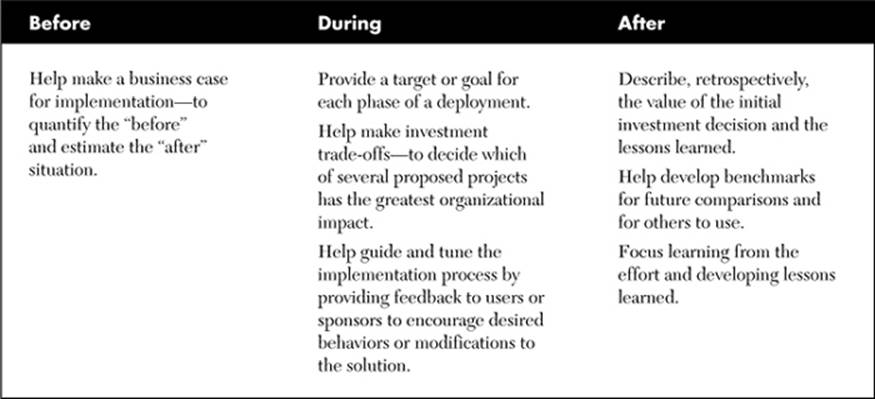
Table 8-1 Objectives for SharePoint Performance Measures Throughout the Life Cycle
Having a measurement program is important, not just to understand the business case for your investment, but also to understand the trade-offs or impact of selecting investment A over investment B and to help guide your deployment after your solution is operational. It’s not just about “Show me the money”; it’s also about “How can we achieve an even greater impact?”
The perspectives of the customer, department, organization, and individual in an organization are critical to its success. The implication of this for SharePoint metrics is important—when you think about metrics and the measurement process, it is important to identify who is likely to use the performance measurement information. Potential users include strategic decision makers, project decision makers, funding and approval stakeholders, government agencies involved in approval or regulation, users, and customers. There is no one “right” set of metrics for SharePoint solutions. Metrics should be stated in terms that are familiar to the stakeholder. For this reason, you may find that there are several different metrics that need to be captured for your solution. Most solutions will require a combination of measurement types and classes to effectively communicate with the key stakeholders.
Measurement Process Overview
The measurement process (see Figure 8-1) is presented as a series of questions that will help guide you through the decisions required to define, choose, and use the most appropriate metrics for your SharePoint solution.
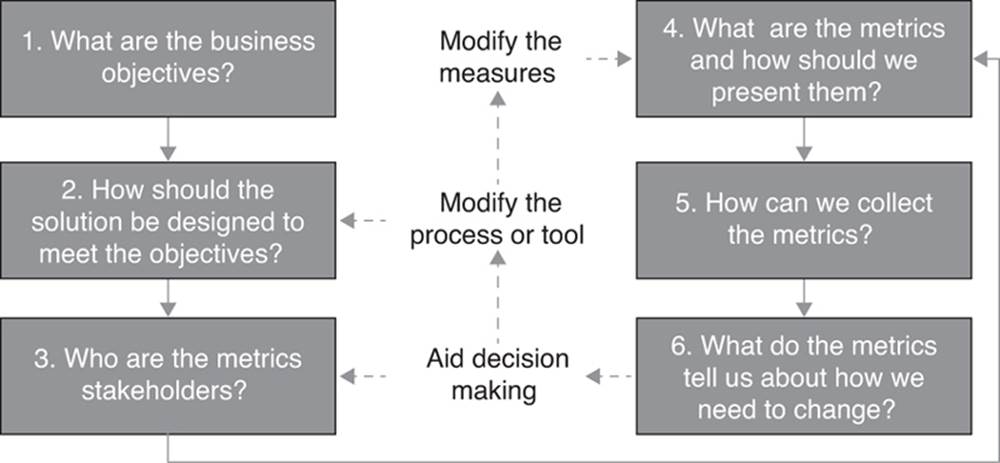
Figure 8-1 Measurement process
The first two questions are actually outside the scope of the measurement process, but because they provide a critical foundation for the approach, the process is not really complete without them. The remainder of this chapter discusses each question and provides examples of how they might be answered in your organization.
Question 1: What Are the Business Objectives?
Designing any good technology solution requires a comprehensive understanding of the business problem you are trying to solve. This is especially true if you are implementing the social computing features of SharePoint because one of the reasons many “social” solutions fail to gain traction is that they are disconnected from the key business challenges in the organization. There is only one reason for implementing SharePoint or any other collaboration or portal platform: you have a business problem to solve.
If you aren’t addressing an important or valuable business problem with your SharePoint solution, you need to go back to the beginning to find that problem, as well as a business sponsor who is committed to solving it. Be sure you are tying your SharePoint solution to a key organizational initiative or goal. If not, you are working on a “sideshow” project—one whose funding is going to be at risk no matter what your measurement program concludes. (This could also become a career-limiting move if you are the one responsible for the solution.)
Another reason to have a clear connection to business goals is to help make decisions about which potential SharePoint project(s) to implement. With limited time, budget, and resources, most organizations find that there are more possible projects for the SharePoint team than can possibly be accomplished. In this scenario, it’s important to have a framework for differentiating among opportunities that are competing for scarce resources.
Many organizations share a common list of objectives for SharePoint solutions. For example:
![]() Reducing the volume of organizational e-mail and e-mail attachments to save time and reduce the confusion resulting from multiple document versions
Reducing the volume of organizational e-mail and e-mail attachments to save time and reduce the confusion resulting from multiple document versions
![]() Reducing communications costs
Reducing communications costs
![]() Improving the ability to connect with partners, customers, and suppliers by making it easier to publish content on the Internet
Improving the ability to connect with partners, customers, and suppliers by making it easier to publish content on the Internet
![]() Increasing speed of access to existing knowledge assets
Increasing speed of access to existing knowledge assets
![]() Improving the ability to find experts and expertise
Improving the ability to find experts and expertise
![]() Improving decision-making time (search helps find things quickly, which can, in turn, streamline decision making and even business processes)
Improving decision-making time (search helps find things quickly, which can, in turn, streamline decision making and even business processes)
![]() Improving response time for nonroutine issues that don’t follow standard processes by providing tools to enable navigation across boundaries—connecting people to people to accelerate exception resolution
Improving response time for nonroutine issues that don’t follow standard processes by providing tools to enable navigation across boundaries—connecting people to people to accelerate exception resolution
![]() Decreasing travel costs
Decreasing travel costs
![]() Increasing customer, employee, and partner satisfaction
Increasing customer, employee, and partner satisfaction
![]() Reducing time to market and improving the ability to create innovative products or services
Reducing time to market and improving the ability to create innovative products or services
While it’s easy to say, “Yes, I want that too,” it’s important that you understand what these objectives mean for your business and how you specifically plan to measure your solution results. It’s really difficult (if not impossible) to plan your measurement strategy around these broad goals. Of course, we all want to achieve these strategic objectives in general, but to produce meaningful and measureable results, it’s far more helpful to identify a specific, tactical approach that works in your organization. Getting more tactical means getting SMARTer about your solution goals.
Get SMART
SMART is a mnemonic for thinking about setting meaningful and realistic objectives for any type of performance evaluation. The acronym describes the key characteristics of meaningful performance indicators:
![]() Specific (concrete and well defined)
Specific (concrete and well defined)
![]() Measurable (quantifiable, comparable)
Measurable (quantifiable, comparable)
![]() Achievable (feasible, actionable)
Achievable (feasible, actionable)
![]() Realistic (consider resources)
Realistic (consider resources)
![]() Time-bound (deadline driven)
Time-bound (deadline driven)
Thus, a good objective for measuring performance is expressed in a SMART way. For example, a good collaboration solution can speed the time to create critical deliverables. For a consulting organization, a SMART objective for a SharePoint proposal library solution might be to reduce the average amount of time it takes to produce complex proposals by 10% in Year X. (This is actually relatively easy to do if your organization assigns a unique project number to major proposal efforts.) When you start with a SMART business objective, you immediately have two critical elements of your measurement plan: a baseline measure to capture and the outcome that defines success.
The good news is that most important business problems in your organization will already have at least one baseline measure—but this is not always the case. Before you even think about getting started, try to quantify both the problem and the target—and get management buy-in regarding the change in outcome that means success. In other words, understand how success is spelled in your organization.
In addition, take a look around the organization to find examples of solutions that are already delivering value—solutions that users really like and that management holds up as examples of successes. If you can understand why those projects or solutions are considered successful, you can look for analogous problems or opportunities to find what might work in your own backyard.
Question 2: How Should the Solution Be Designed to Meet the Objectives?
There is not much point in trying to develop a measurement plan for a solution that doesn’t solve a critical business problem, so you really have to answer Question 1 before you can move on to Question 2. However, if you have a critical business problem to solve, it’s also critical to make sure that you are following good practices to design a solution to solve that problem. It’s not enough to just understand the business objective; it’s also essential to design a solution worth measuring! Fortunately, most of the content in this book is focused on sharing good practices for designing SharePoint 2013 solutions.
In the context of SharePoint, creating a great design means thinking about the answers to even more important questions, including these:
![]() What is the most appropriate site architecture and technical infrastructure for your solution?
What is the most appropriate site architecture and technical infrastructure for your solution?
![]() Which features of SharePoint will enable you to achieve your objectives?
Which features of SharePoint will enable you to achieve your objectives?
![]() What types of customizations make sense for your solution?
What types of customizations make sense for your solution?
![]() How will you support any planned customizations over the long term, and what impact will these customizations have on the ability to upgrade?
How will you support any planned customizations over the long term, and what impact will these customizations have on the ability to upgrade?
![]() What is the plan for security?
What is the plan for security?
![]() What is the governance model for your solution?
What is the governance model for your solution?
![]() Do you have a clear set of roles and responsibilities for deploying the solution?
Do you have a clear set of roles and responsibilities for deploying the solution?
![]() What types of training and communications are planned?
What types of training and communications are planned?
Question 3: Who Are the Metrics Stakeholders?
Part of understanding the business objective is identifying your key stakeholders. From the perspective of metrics, you need to identify who will use the measures, how your solution addresses the business problems they care about, and which solution metrics most effectively demonstrate an impact on those problems. Sue’s late Uncle Phil used to always say, “Everyone has their own set of nerves.” Think about her Uncle Phil when you think about your stakeholders—each one has a different set of objectives, business goals, and responsibilities. Your metrics story needs to speak directly to their needs.
In most cases, your solution stakeholders and your metrics stakeholders are the same people. However, not all stakeholders need the same type of information, and you may have a metrics stakeholder who has only a peripheral relationship to the solution itself—such as a high-level business executive. A helpful approach is to create a list of solution stakeholders and use brainstorming to identify additional stakeholders who care about specific metrics. Use that list to create a table to identify the type of information each stakeholder needs to know about your solution.
The type of information stakeholders will care about depends on the types of decisions that they need to make. Identify the key decisions and questions for each of your key stakeholders:
![]() How is their business unit or team evaluated?
How is their business unit or team evaluated?
![]() What keeps them up at night?
What keeps them up at night?
![]() What are the metrics that they use or review already to evaluate the success of business initiatives?
What are the metrics that they use or review already to evaluate the success of business initiatives?
![]() What information do they need to derive from your metrics in order to make better decisions or understand their business operations?
What information do they need to derive from your metrics in order to make better decisions or understand their business operations?
A word of caution: sometimes, stakeholders get carried away with the level of detail and measures they think they need to measure the success of the solution. As you work with your stakeholders to determine what they need to know, focus on the outcomes, and then work backward to figure out how you will measure those outcomes. For example, in a consulting firm, there was a core business objective related to understanding employee expertise so that the firm could both staff projects with the best possible resources and quickly respond to client questions. One of their initiatives included maintaining expertise information about their employees. While they could create reports to show the percentage of employees who had entered at least one expertise topic at the “expert” level (and to be sure, several executives really wanted to know that number), that metric was pretty useless in terms of telling executives the value of the data itself or the processes they had created to maintain it. In this example, high “adoption” told virtually nothing about the value of the information or the processes they had enabled to keep it up-to-date. The firm realized that the only true and useful measure of the value of the expertise identification information was how it was used. To capture the value of the information, they conducted an annual survey and offered prizes for people who could tell the best story about how the expertise information delivered value to their business unit or project or client. The firm asked the storyteller to quantify the value—typically in terms of time saved or revenue generated—and then applied a consistent, fully loaded average salary cost to estimate the monetary value of the story.
Question 4: What Are the Metrics and How Should We Present Them?
Once you identify your key stakeholders and understand what they need to know, you need to focus on identifying the types of metrics, how you will collect the metrics, and how you will communicate the metrics. Together, these three elements will form the measurement approach.
SharePoint and Traditional ROI Analysis
ROI is one way of looking at the potential value of a capital investment. The purpose of an ROI metric is to measure the per-period (typically annual) rate of return on money invested in order to make a financial decision. Quite simply, the ROI is the difference between the value of the benefits and the investment cost over a defined period of time.
Traditional ROI analysis is tricky for SharePoint solutions. The approach that you take to communicate about metrics will likely depend on where you are in the life cycle of your project. If you are at the beginning and you are focused on demonstrating why SharePoint 2013 is the right application to use to build your solution, and you are not already using SharePoint for other business solutions, you may have some unique criteria for your ROI analysis. For example, if you are building a solution to support just one small area of the business, but everyone in the organization will need to use it, you will want to understand how much of the cost burden for SharePoint should be factored into the first SharePoint solution. While the initial cost analysis might be perceived as supporting just one solution (and might seem expensive), that same cost infrastructure will eventually be shared by all of your SharePoint solutions—and shouldn’t be unfairly associated with just the first one. However, if that initial solution is your company’s public Web site or intranet, you may want to consider the infrastructure cost as primarily being associated with the initial enterprise project. The point is that a traditional ROI analysis where you need to consider ongoing operational and infrastructure costs is easier and most appropriate for investing in SharePoint as an application platform but may be less relevant for analyzing alternative SharePoint investments or measuring the impact of an ongoing SharePoint solution. However, each solution, as well as the platform as a whole, has a total-cost-of-ownership element, which includes calculating the time and effort and resources that will be needed to fix the solution when it breaks. These costs, plus the cost of fielding user support calls, should also be included in your overall analysis of costs.
Once the SharePoint infrastructure is in place, the incremental cost of each new investment is relatively trivial, so if you choose a traditional ROI measure for your solution, you will need to determine whether and how to account for infrastructure costs. The best advice here is to choose an approach and be consistent. It can be very challenging to estimate how much data storage one solution will need as opposed to another and very difficult to determine a consistent method for estimating storage in advance. So, if you decide to leave storage infrastructure or the ongoing operational cost of maintaining the SharePoint environment out of the measurement equation, leave it out for all of your prospective or existing solutions. From a practical perspective, it’s impossible to imagine an ROI calculation that is 100% precise—and that really shouldn’t be your goal. Your measurement goal is to ensure that you have a consistent approach to ensure that value is being delivered with each solution or incremental investment.
“ROI-Lite” in Practice
One organization we know employs an “ROI-lite” measurement approach to prioritize and evaluate potential SharePoint projects—but the ROI that they calculate does include cost measures for routine projects. Many of these projects involve using SharePoint to automate an existing process or workflow. They have a small team of internal resources to help with the creation of SharePoint solutions. To determine which projects to work on, they calculate a baseline metric for executing the process before SharePoint—sometimes by measuring process throughput and other times by observing the time it takes to do a task. They then estimate the process or throughput times expected in the “after” situation and multiply this number by the number of times the process is executed in a year and then by an average fully loaded hourly cost for an employee. The initial calculation helps prioritize which projects to work on. Then, to ensure that the solutions are delivering the expected value, they go back to each project after about 90 days and measure actual results. These new metrics help provide insight into potential repeatable solutions for other business areas. While metrics based on averages may not provide a precise measure of ROI, the repeated use of a consistent calculation can be used to assess priorities and disseminate best practices—both of which are important elements of an overall measurement program.
ROI is really only part of the measurement story for SharePoint—and it won’t be the right metric for all of your stakeholders. While employees using a collaboration solution might appreciate the benefit the organization gets from the platform, it’s not the measurement that they really care about. The metric that drives their day-to-day behavior is not the overall benefit for the company; it’s a more personal metric that answers the question “What’s in it for me?”
User Adoption and Measurement
The most important characteristic to consider when choosing or defining a performance measure is whether the metric tells something about the outcome you are trying to achieve. Just because you have 75% of your organization completing a robust user profile in SharePoint 2013 does not necessarily mean that SharePoint 2013 is successful. Adoption is not the end of the road. Business results are the only true measure of SharePoint success.
Choose the metrics you want to capture in terms of the use cases that are of highest interest to your stakeholders and their business objectives. It’s also important to pick a small number of metrics that are both relevant to the business and have a more direct relationship to business outcomes—and can be collected at a relatively low cost. For example, a possible metric for a best practices library is the number of times the library has been accessed. A large number of accesses or “hits” for the library or an individual document suggests that people are reading documents, but this does not definitively indicate whether the content was useful to anyone or whether it improved operational efficiency or quality. To get a better measure of value, you could enable the ratings function in SharePoint 2013 along with very clear directions regarding the context of the ratings (in this context, a good rating metric would be to ask users to rate the degree to which they were able to reuse the document). Adding ratings makes the hits or downloads metric much more valuable than either would be on its own because it combines a quantitative measure of usage with a qualitative measure of value. Adding a user survey to seek out specific cases where the information helped and how it was used would add even more meaning to your metric—because you would now have specific examples that your stakeholders can relate to (and share with others).
Types of Measurement
The specific measurement approaches you choose for your SharePoint initiative can be quantitative or qualitative. In general, a measurement program should include both types:
![]() Quantitative measurement approaches use numbers and typically provide “hard” data to evaluate performance between points (such as last month to this month) or to spot trends. For example, you can collect quantitative data on site usage or the number of hours spent on a particular task. Even if the absolute value of hard data such as the number of site accesses in a given month doesn’t tell you much about the value of the solution, a significant drop or increase in that metric can give you important clues about the content or the solution itself. Some quantitative measurements can be obtained automatically from native SharePoint 2013 usage data, and others require third-party tools. One of the major investment areas for SharePoint 2013 is in the area of usage measurement. Examples of some of the quantitative system measurement data you can obtain from SharePoint 2013 are described later in this chapter.
Quantitative measurement approaches use numbers and typically provide “hard” data to evaluate performance between points (such as last month to this month) or to spot trends. For example, you can collect quantitative data on site usage or the number of hours spent on a particular task. Even if the absolute value of hard data such as the number of site accesses in a given month doesn’t tell you much about the value of the solution, a significant drop or increase in that metric can give you important clues about the content or the solution itself. Some quantitative measurements can be obtained automatically from native SharePoint 2013 usage data, and others require third-party tools. One of the major investment areas for SharePoint 2013 is in the area of usage measurement. Examples of some of the quantitative system measurement data you can obtain from SharePoint 2013 are described later in this chapter.
![]() Qualitative measurement approaches, often referred to as “soft” data, include stories, anecdotes, and future scenarios. When it is difficult to capture meaningful quantitative metrics (for example, at the beginning of a project), qualitative metrics can have a significant benefit. The best measurement programs incorporate both quantitative and qualitative measurements. The qualitative metrics—especially those with a quantitative “punch line”—add richness to your quantitative metrics.
Qualitative measurement approaches, often referred to as “soft” data, include stories, anecdotes, and future scenarios. When it is difficult to capture meaningful quantitative metrics (for example, at the beginning of a project), qualitative metrics can have a significant benefit. The best measurement programs incorporate both quantitative and qualitative measurements. The qualitative metrics—especially those with a quantitative “punch line”—add richness to your quantitative metrics.
Quantitative Metrics
Too often, SharePoint solution owners spend too much time capturing metrics that have very little impact on the true value of the SharePoint solution. Every metric you capture, whether it’s a system metric that is automatically provided or a business metric that might require some additional effort to record, needs to fit into the story you are trying to tell.
System metrics (often called “usage analytics”) are captured directly from SharePoint 2013 or a third-party tool. System metrics alone do not directly measure business value, but they can be especially useful in providing clues to where users are getting value and to help quickly spot content problems or gaps and areas for improvement. System metrics don’t typically cost very much to collect, but because they are more loosely coupled with the outcome you are trying to measure, you will almost always need to make a decision about how much and which “nonsystem” metrics you need to add to your system metrics to create a meaningful measurement approach.
Figure 8-2 lists some of the most helpful usage metrics that are available out of the box with SharePoint 2013 and the business value objective for each of these metrics. Not all metrics and targets should be the same. For example, usage metrics depend on the type of content. A news site, especially if it is the home page, is likely to be visited every day. A policy site would not need to be visited daily to deliver the same value. In SharePoint 2013, all analytics processing is part of the search service. Usage analytics are significantly improved with SharePoint 2013 and, when combined with search analytics, provide new and useful information that can add value to the SharePoint experience.
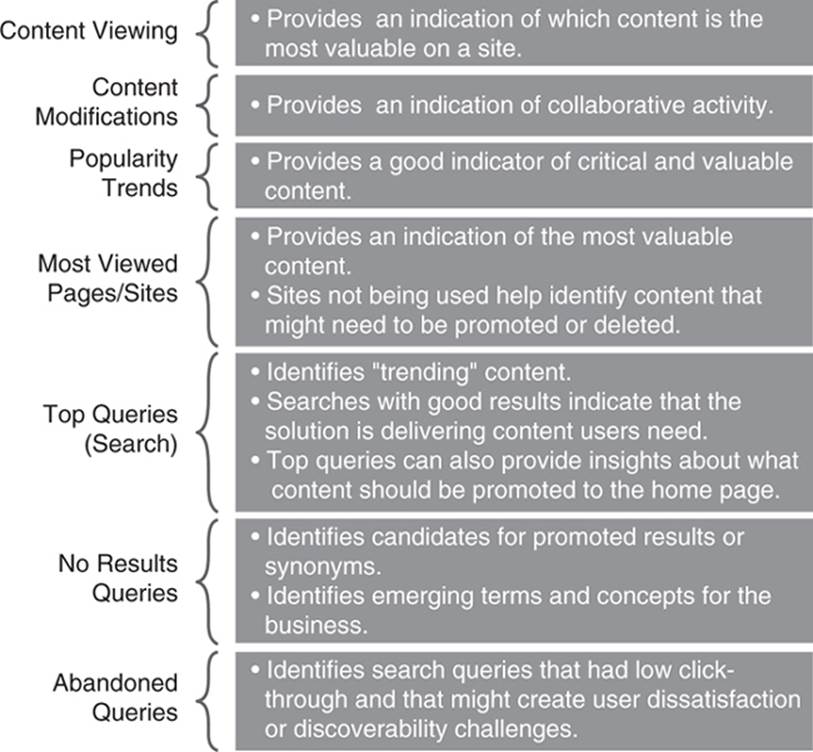
Figure 8-2 Examples of SharePoint 2013 system usage metrics
In SharePoint 2013, usage analytics capture user actions such as clicks and viewed items. These usage events are added to the search index. Each time a user views an item, SharePoint creates a usage event. SharePoint 2013 logs every click in SharePoint sites and provides a count of hits for every document. This information is used to provide “item-to-item” recommendations (people who viewed this also viewed this), to show “view counts” in search results, to provide a count of the top items in a list or a site, and to influence relevancy in search results. There are three types of usage events that are configured by default, and if needed, you can configure up to 12 additional custom events. The default usage events are
![]() Views: the number of times an item, page, or document has been viewed
Views: the number of times an item, page, or document has been viewed
![]() Recommendations displayed: the number of times an item, page, or document was shown in a recommendation
Recommendations displayed: the number of times an item, page, or document was shown in a recommendation
![]() Recommendations clicked: the number of times an item, page, or document was clicked when it was shown in the context of a recommendation
Recommendations clicked: the number of times an item, page, or document was clicked when it was shown in the context of a recommendation
In practice, these events help more than just “count” system usage; they are used dynamically by SharePoint to influence search results and create a more helpful user experience.
Business or outcome metrics are used to tell the story of how the solution impacts the organizational business processes. It is very likely that your organization is already tracking a significant number of business metrics related to the core business activities you perform. These may include metrics such as the number of new customers acquired over a given period, metrics related to order processing, or metrics related to financial accounting such as average accounts receivable. In the ideal world, you should look to your SharePoint deployment to have an impact on these key business metrics—because if your solution is solving a core business problem, you clearly want to make sure you can directly impact the “main event.” But it’s almost impossible to measure SharePoint’s unique impact on these metrics. If your story can be shown alongside positive movement in key corporate metrics, or if your solution is really directly related to one or more of these metrics, you need to track and showcase them in your metrics reports or dashboards. You may not always be able to directly impact the “main event,” but you really want the problem you are addressing to be at least part of or connected to the bigger picture. Here are a few examples of business metrics that might help you get started:
![]() Number of hours per week to process data or execute a business process: Let’s say that your business objective is to reduce the amount of time it takes to execute a specific task. For example, you’ve designed a data capture and workflow solution in SharePoint 2013 to improve the processing flow. The first thing you need to do is get a baseline measure for the current process—the “as is.” There are a number of techniques that you can use, ranging from asking the people who are doing the job today to timing them either informally or with a time and motion study. If your process is less concrete, such as finding experts to work on an assignment or answer a question, you will have to be creative about identifying your baseline metric. As discussed later in this chapter, you may need to try to quantify the current problem through the capture and use of stories, anecdotes, interviews, surveys, and other qualitative measures. As long as you apply consistent assumptions in your baseline and post-project metrics, you should be in a good position to demonstrate a positive impact.
Number of hours per week to process data or execute a business process: Let’s say that your business objective is to reduce the amount of time it takes to execute a specific task. For example, you’ve designed a data capture and workflow solution in SharePoint 2013 to improve the processing flow. The first thing you need to do is get a baseline measure for the current process—the “as is.” There are a number of techniques that you can use, ranging from asking the people who are doing the job today to timing them either informally or with a time and motion study. If your process is less concrete, such as finding experts to work on an assignment or answer a question, you will have to be creative about identifying your baseline metric. As discussed later in this chapter, you may need to try to quantify the current problem through the capture and use of stories, anecdotes, interviews, surveys, and other qualitative measures. As long as you apply consistent assumptions in your baseline and post-project metrics, you should be in a good position to demonstrate a positive impact.
![]() Number of [proposals, contracts, etc.] produced per month/quarter/year: If the objective for your solution is to improve the ability to create new proposals, contracts, or other documents that rely on reusable content, one useful outcome metric is the number of these artifacts that you produce in a given time period. For proposals, you might want to track both the number produced and the number of successful proposals.
Number of [proposals, contracts, etc.] produced per month/quarter/year: If the objective for your solution is to improve the ability to create new proposals, contracts, or other documents that rely on reusable content, one useful outcome metric is the number of these artifacts that you produce in a given time period. For proposals, you might want to track both the number produced and the number of successful proposals.
![]() Number of “[Your Organization] All” e-mails: Reading e-mail messages that aren’t really targeted to you takes time—time that could be spent focused on other critical tasks. In addition, untargeted e-mails have a cost to the organization in terms of mailbox storage. Transferring even a small portion of the “All” e-mails to targeted SharePoint news or announcements can have a direct positive impact on productivity and e-mail cost.1 Calculating a baseline number for “[Your Organization] All” e-mails is a good productivity-related metric.
Number of “[Your Organization] All” e-mails: Reading e-mail messages that aren’t really targeted to you takes time—time that could be spent focused on other critical tasks. In addition, untargeted e-mails have a cost to the organization in terms of mailbox storage. Transferring even a small portion of the “All” e-mails to targeted SharePoint news or announcements can have a direct positive impact on productivity and e-mail cost.1 Calculating a baseline number for “[Your Organization] All” e-mails is a good productivity-related metric.
1. If you are looking for a great way to estimate the cost of the “info-glut” related to e-mail, take a look at The Hamster Revolution by Mike Song, Vicki Halsey, and Tim Burress (Berrett-Koehler Publishers, Inc., 2007). They estimate that if you send and receive as few as 60 e-mails per workday and spend an average of two minutes per e-mail, you are spending a total of 60 days per year just on e-mail! If you multiply that by the number of people in the organization, you can see that you wouldn’t have to eliminate too many messages in order to make a significant impact on productivity. (If you combine the impact of using SharePoint 2013 to publish information and some of the other great suggestions in this book, you could make an even bigger impact.)
![]() Number of e-mail attachments: E-mail attachments have a significant cost in terms of both productivity (users may never know if they are looking at the most recent version of a document) and storage.
Number of e-mail attachments: E-mail attachments have a significant cost in terms of both productivity (users may never know if they are looking at the most recent version of a document) and storage.
![]() Average application training costs: One benefit that many organizations find from investing in SharePoint portal solutions is the ability to significantly reduce the amount of money they spend on application training. The reason is that many users of enterprise applications use only a small fraction of the functionality, and by creating Web Parts for the most common functions, you may be able to eliminate application training for these users.
Average application training costs: One benefit that many organizations find from investing in SharePoint portal solutions is the ability to significantly reduce the amount of money they spend on application training. The reason is that many users of enterprise applications use only a small fraction of the functionality, and by creating Web Parts for the most common functions, you may be able to eliminate application training for these users.
![]() Cost savings to retire an existing application: Many organizations are slowly retiring existing third-party or custom applications and are rebuilding the solutions with SharePoint. For a baseline metric, look to the annual hardware and software maintenance costs for your legacy solutions.
Cost savings to retire an existing application: Many organizations are slowly retiring existing third-party or custom applications and are rebuilding the solutions with SharePoint. For a baseline metric, look to the annual hardware and software maintenance costs for your legacy solutions.
If you want to translate the time it takes to execute a current business process to dollars, you’ll need to know the average fully loaded hourly cost of the employee who performs the task currently. You can probably get this number from your human resources or finance department.
Qualitative Metrics
Qualitative metrics provide context and meaning for quantitative metrics. When it is difficult to capture meaningful quantitative metrics (such as the value to the individual for being a member of a community), qualitative metrics (such as a story from a member about how the community helped solve a critical problem) can have as much or more impact on stakeholders. Qualitative metrics can augment quantitative metrics with additional context and meaning.
The best qualitative metrics are what we like to call “serious anecdotes.” A serious anecdote is a story with a meaningful (dollar value) punch line—a story that describes a measurable business result. The serious anecdotes in the sidebars describe examples from several industries. Even though these anecdotes describe specific instances, they may be relevant to your situation. If you can collect and quantify multiple similar serious anecdotes as part of your measurement program (approaches for collecting these stories are described later in the chapter), the combination of the serious outcomes of your qualitative stories demonstrates a real and significant metric to associate with your solution investment.
Example Of a Serious Anecdote: Consulting
I joined the organization on March 16 without previous experience. After one week of training, I joined a project team.
After one day of training on the project, I was assigned a task to learn a particular technology that was new to everyone on the team. I was given a bunch of books and told that I had three days to learn how to create a project using this technology.
In my first week of training, I remembered learning about the company’s expertise database. I sent an e-mail to four people I found in the database asking for their help. One of them sent me a document containing exactly what I wanted.
Instead of three days, my task was completed in one-half a day.
Example of a Serious Anecdote: Pharmaceutical
A scientist with expertise in thrombotic and joint diseases in Frankfurt began a project to isolate and culture macrophages and needed some help.
Meanwhile, two scientists in the United States had deep experience with protocols for this area.
The Frankfurt scientist consulted the intranet to find expertise within the company and contacted the two U.S. scientists.
Both scientists in the United States quickly responded with assistance. One helped with culturing protocols and the other helped with information about magnetic cell sorting.
By reaching out to the other scientists via online search, the Frankfurt scientist was able to leverage existing internal expertise and, in the process, reduced his research effort by four weeks.
Example of a Serious Anecdote: Construction
ICA is a construction company in Mexico with operations in the Americas and Europe. They created an enterprise content management system using SharePoint. It provides a way to organize and search terabytes of documents and create knowledge communities.2
2. www.microsoft.com/casestudies/Microsoft-Sharepoint-Server-2010/ICA/Construction-Firm-Speeds-Project-Completion-with-Centralized-Content-Management/4000010862
From the case study: “Because ICA stores and organizes project documentation in one place, it can better track customer change orders throughout project life cycles, which can add up to tens of thousands of dollars’ worth of work.”
Prior to the implementation of the SharePoint solution, it was difficult to charge customers for changes because they were not well documented. According to the Web infrastructure manager, “Now, we can track and document every task completed so that we can bill for it.”
Even if you have a rich collection of quantitative metrics, you will want to have some qualitative metrics to provide context and meaning for your measurement program. The collection of anecdotes or stories is probably the most common type of qualitative measurement approach. But what if you haven’t yet implemented your solution and you don’t yet have any stories to capture? In this case, there is a special type of story that is particularly helpful. These types of stories describe a future vision for the organization or business unit or describe a “day in the life” of one or more types of employees and are often referred to as “future scenarios.” A future scenario might start like this: “Imagine the future . . .” The following example is an excerpt of a future scenario for a “next-generation” intranet at a management consulting firm.
Future Scenario Example
Imagine the future . . . On December 15, 2016, just after his morning coffee, Rick Jones, a consultant working with a financial institution, is asked by the client for advice on creating a social media strategy.
Rick has limited social media experience, and the client wants a proposal with a fairly detailed plan before the holidays so the budget money can be allocated prior to the end of the year.
Over his next cup of coffee, Rick accesses the intranet and searches the topic “social media strategy.” A graphic view of a knowledge map helps him navigate the abundance of information.
Rick finds the firm’s social media strategy methodology, several sample proposals for similar clients that have five-star ratings by the Social Computing Community of Practice, 25 applicable qualification statements, a list of the members of the Social Computing Community of Practice, and links to their personal profile pages.
Rick clicks on a three-minute embedded video that features social media expert Liz Picone talking about the key challenges for “social business” engagements.
Rick sees that the qualifications in the business area of the financial institution he’s working with are limited, so he executes a search outside the intranet, using research services to which the company subscribes and Web sites “certified” by the corporate library.
After lunch, Rick sees that several of the social media experts are online, and he calls a few to ask their advice on how to address a particularly unique aspect of the potential engagement.
Rick downloads one of the proposals recommended by an expert for a head start. As he begins adding details that are unique to his client’s needs, the search agent built into the intranet pops up with three additional proposals that are also similar to Rick’s and an article in a Gartner research database that rates his company as a premier provider of social media consulting services.
On December 18, the proposal is completed and mailed to the client.
When the proposal is completed, Rick clicks the option “save to intranet” so that his newly completed proposal is immediately available to others across the firm.
Rick is prompted for some simple metadata so that his proposal can be indexed and cataloged appropriately.
In three weeks, the system prompts Rick for a status update on the proposal: Did we win? What was the feedback from the client? Rick updates the proposal database simply by replying to the automatically generated e-mail message.
This example “future scenario” concluded with a summary of the vision for knowledge management at the company. Did it work? Draw your own conclusion. In the meeting where this vision was presented, one of the executives in the room raised his hand and said, “I can’t wait to work for that company!”
SharePoint 2013 provides yet another particularly interesting way to capture qualitative metrics with the ratings and likes features. Consider using ratings for a very simple purpose: to ask users to indicate whether a page or document is helpful. In other words, the messaging for your ratings program is both simple and clear—all you are asking users is “Was this asset helpful?” or “Were you able to get value from this asset?” This simple approach gives you a way to quantify your qualitative metrics in a meaningful way, and it also gives you a way to capture more meaningful stories by reaching out to those people who liked or rated a document or page. People will typically tell you more in a conversation than they will write down, so if you use a “journalist approach” to find the lead and then interview the storyteller, you will probably get much better results.
Telling the Measurement Story
Communicating the measurement story is as important as picking the measures in the first place. Telling the measurement story for your SharePoint solution is no different from telling any other type of business story—you need to understand your audience, what they need to know, and their preferred platform for evaluating metrics. And, even more important than for other business stories, you need to consider carefully where you are in the life cycle of your investment—because the story you tell and the measures you use will be different at each phase.
Determine a Baseline
If you’ve selected a key business problem to automate using SharePoint 2013, it’s likely that you already have some baseline measures in place. Note that one major mistake people often make when documenting their measures of success with SharePoint is that they try to demonstrate business impact without knowing where they started. This approach is doomed to failure. You need to have a good baseline or you will have no ability to measure the impact of your SharePoint solution. The first places to look for outcome measures are the metrics that you are already capturing for the business problem that you are trying to solve. If those metrics do not already exist, you will want to establish a good baseline measure before you get started. You can’t tell how far you’ve come if you don’t know where you started!
With that in mind, you will most likely want to capture both quantitative measures and qualitative metrics for your baseline “before.” After you have deployed your solution, and sometimes along the way as you are implementing it, you will want to use the same approach to capture your “after” story.
Package and Present
The approach you use to package and present your metrics should be aligned with your solution objectives, your overall strategic goals, the expectations of your key stakeholders, and techniques that are already being used in your organization. You may need to present your metrics in multiple ways depending on the audience. Two options that are particularly helpful include preparing a balanced scorecard and a metrics “dashboard” summary.
There are dozens of other approaches that you could consider for presenting your metrics. In one organization, the portal team prepared a dashboard in a report card format each year to show the impact of the intranet and collaboration solution on the business. The criteria were similar to what was used in their balanced scorecard, but the presentation style helped highlight where they were especially successful and where their approach or communications or user adoption needed improvement.
The balanced scorecard is a strategic planning and management system that was made popular by Drs. Robert Kaplan and David Norton as a measurement framework that added key nonfinancial performance metrics to traditional financial metrics so that executives would get a more balanced view of organizational performance. An approach based on a balanced scorecard is especially useful in creating a framework for looking at SharePoint solution investments—even if not all of the elements of an organizational balanced scorecard are applicable. One organization used a very successful balanced scorecard approach to craft a metrics model for a new expertise location system. The team knew that the solution required both changes in user behavior (to create their profiles and to use the system to find expertise) and the implementation of new technology. The goal for the initial metrics plan was to create a meaningful way of showing executives specific measurement targets for the pilot deployment along with the ability to objectively track the metrics results. The most important thing they did in advance was to gain consensus from the executive sponsors that if the target goals for the pilot were achieved, the executives would consider the pilot a success and recommend funding a full deployment. The team wanted to emphasize that there were several different types of measures that together presented the most balanced way to evaluate the pilot success, so they adapted the balanced scorecard model to show information that was especially meaningful to their stakeholders.
Figure 8-3 shows three specific categories of measures you can use to create a balanced scorecard for SharePoint projects.
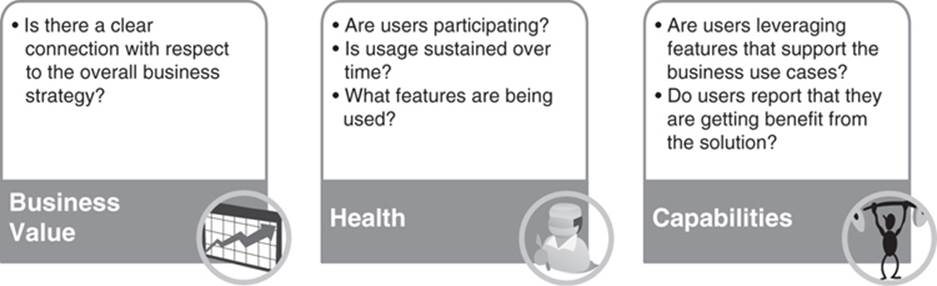
Figure 8-3 Balanced scorecard categories
For each category in your scorecard, you will likely have multiple metrics. For each metric, you will want to track three key attributes:
![]() Target: the goal for the metric during the period covered by your SMART objective. Review target metrics with management in advance so that the key stakeholders and decision makers can define how they will measure success.
Target: the goal for the metric during the period covered by your SMART objective. Review target metrics with management in advance so that the key stakeholders and decision makers can define how they will measure success.
![]() Actual: the results measured at the end of the evaluation period.
Actual: the results measured at the end of the evaluation period.
![]() Differences: percentage that the target differs from the actual.
Differences: percentage that the target differs from the actual.
Table 8-2 shows examples of metrics that you can consider adapting for your balanced scorecard or dashboard report.
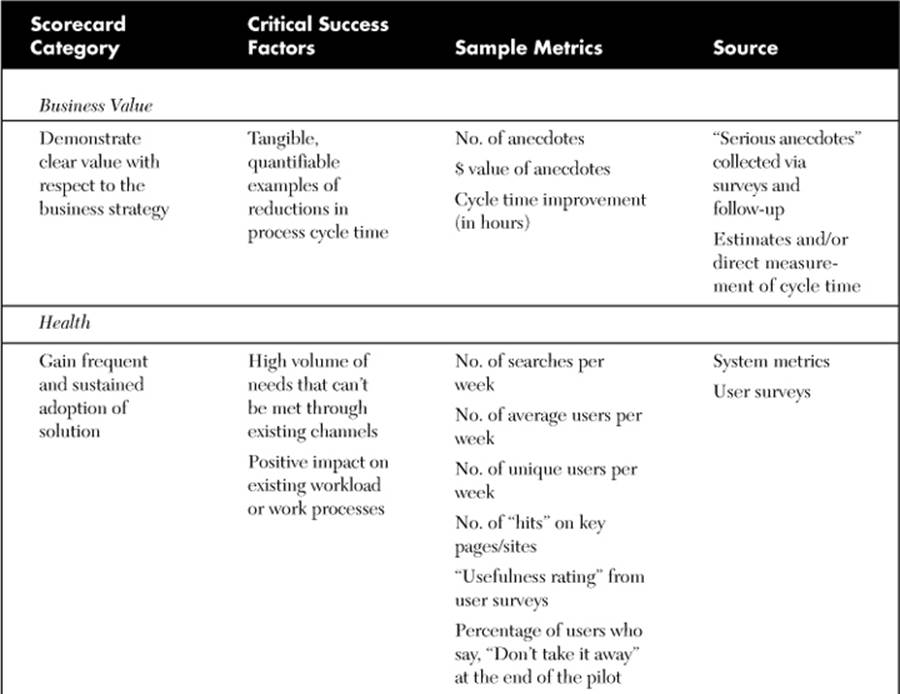
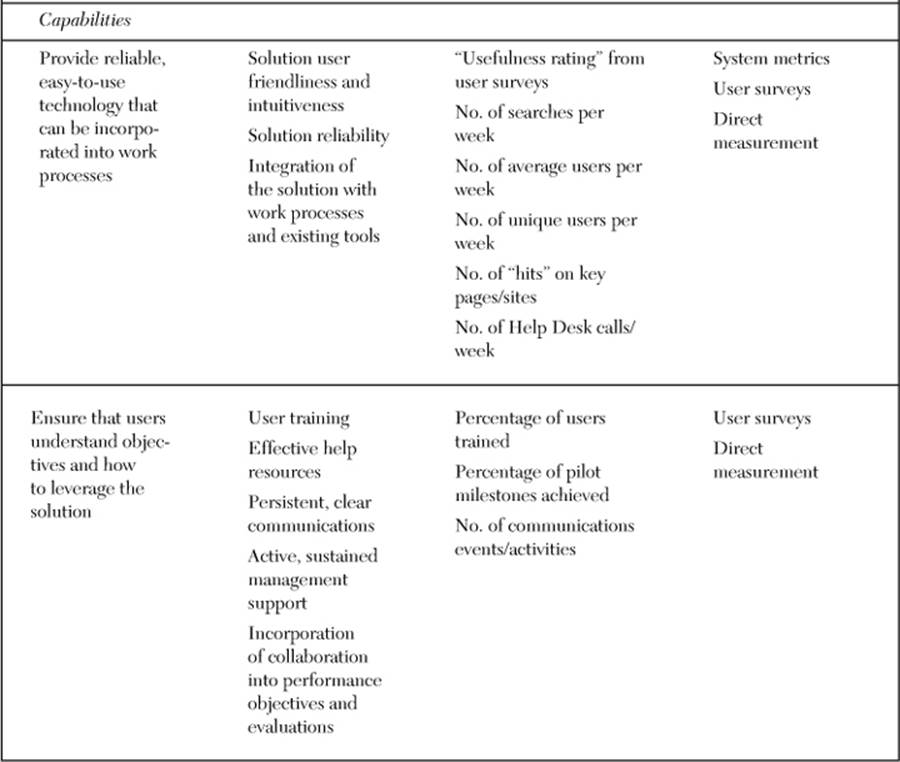
Table 8-2 Balanced Scorecard Metrics
Table 8-3 shows a template that you can use to create a balanced scorecard for your SharePoint initiative. If relevant, consider using some of the sample metrics shown in Table 8-2 in your scorecard.
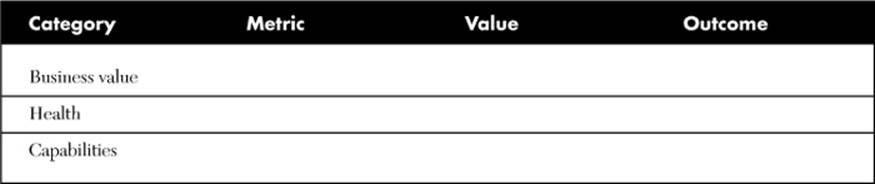
Table 8-3 Balanced Scorecard Template
If a balanced scorecard doesn’t quite work to present your metrics, SharePoint 2013 provides some excellent dashboard and charting tools that can be used to present quantitative metrics and qualitative survey results in meaningful ways. A good metrics dashboard tells a story visually without overwhelming the user. Not all data requires visualization to make the point. Don’t go overboard picking the coolest-looking visualization approach just because you can. Be careful when choosing colors; to a colorblind person, red-green indicators can be very difficult to discern unless combined with other indicators that are not dependent on color. Try to stick with simple and familiar approaches (pie and bar charts will almost always win out over speedometer-type gauges), but the best approach depends on the type of data you are presenting.
While some of your usage data might be interesting in real time, most of your measurements will not need to be presented in real time to tell an effective story. Choose a time period for both collecting and presenting metrics that achieves a balance between the cost of collecting and presenting the metrics and the value that they provide.
Question 5: How Can We Collect the Metrics?
As you identify the metrics that you want to capture, you will need to define a measurement process to collect them. Be careful not to overdo capturing and producing metrics for your key stakeholders. You are looking for the appropriate balance; you want to capture and report on just the right metrics—not too few and not too many. You want to make sure that you are not spending more time counting than you are “doing.”
Some of the available system metrics in SharePoint 2013 were provided in Figure 8-3. Wherever possible, use automated approaches to capture system metrics. Qualitative metrics are harder to collect. The following approaches have been successful in several organizations.
Usability Testing
The goal of usability testing is to identify any usability problems, collect quantitative data on participants’ performance (e.g., time on task, error rates), as well as determine user satisfaction with the solution.3 For successful solutions, usability testing is an ongoing process, which means that you can and should be using this process to capture value metrics for your solution! At a minimum, consider some type of usability testing every six months as an element of your measurement program.
3. Marissa Peacock, “The What, Why and How of Usability Testing,” April 13, 2010. www.cmswire.com/cms/web-engagement/the-what-why-and-how-of-usability-testing-007152.php
Usability testing does not have to be an expensive proposition. Usability expert Jakob Nielsen says that elaborate usability tests are not always necessary. Excellent results can come from testing no more than five users and running as many small tests as you can afford.4
4. Jakob Nielsen’s Alertbox, “Why You Only Need to Test with 5 Users,” March 19, 2000. www.useit.com/alertbox/20000319.html
One organization incorporated measures of usability in a post-pilot survey for a new collaboration solution in addition to a more formal usability study and used both as part of its balanced scorecard. Table 8-4 shows the questions in the usability survey and the “metrics” that were derived from the survey results.
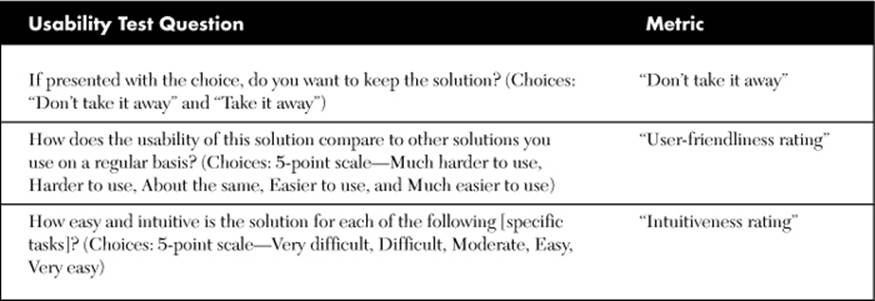
Table 8-4 Usability Testing Metrics
User Feedback
A great way to collect qualitative metrics on an ongoing basis is to make sure that all your sites and pages include a feedback button or link and/or a link to a site or page owner that provides the ability for users to provide feedback. If feedback is distributed to individual site owners, you will need to provide a mechanism to ensure that qualitative feedback is shared with the team responsible for solution metrics, which could be the site owner but might also be the business owner of SharePoint as a whole. Keeping track of what users take the time to note about your solution is a great way to monitor value on an ongoing basis.
Ongoing User Surveys
Periodically survey users to identify users with good value stories—and then interview the users to capture both the story and their estimate of value. Ask questions such as
![]() What have you found on [the solution] that you have been able to reuse?
What have you found on [the solution] that you have been able to reuse?
![]() How much effort did that save?
How much effort did that save?
One technique that might help collect good “serious anecdotes” from periodic surveys is to give respondents an option to follow up the survey with an interview. Here is a question that you might add to your user survey: “If you prefer, we can contact you directly to gather this information. We would take no more than a couple of minutes to record your experience. Would you rather have us contact you?”
Keep all stories in a document library or list with good metadata so that you have the results available to report or demonstrate as needed. Keep a list of user quotes to use in presentations and reports.
Question 6: What Do the Metrics Tell Us about How We Need to Change?
In an article in Washingtonian magazine in August 2012, Chris Tracy, president and chief operating officer of the Chef Geoff’s restaurant group started by his brother, Geoff Tracy, was quoted as saying, “Numbers are just tools. The idea is to get better. To constantly improve.”5 This is as important for managing restaurant groups as it is for running any type of organization. The goal for your measurement program is to use the information to make good decisions—about the solution as well as the business. Figure 8-1 shows not just the six key measurement process questions, but also a feedback loop as a reminder that your measurement program provides critical input to how your SharePoint solution can be adapted over time to continue to provide value. The complex and dynamic nature of pretty much all organizations means that the SharePoint solutions we build are going to have to be flexible enough to change in order to continue to provide value. The only way to understand what changes you need to make is to execute your measurement plan.
5. Todd Kliman, “Everywhere at Once,” Washingtonian, August 2012, p. 172
Use your measurement framework to assess how users are taking advantage of the solution and let it act as an early-warning system to identify both new metrics and new capabilities that can help achieve your business objectives. When a metric shows an unexpected result, try to find out whether it was a one-time event or an indicator of a trend. Ask yourself if the result you are seeing tells you that you may be measuring the wrong thing. At the very least, metrics will help you get ideas for how to improve your solution. Collect and prioritize these new ideas and go back to your original plans and assumptions to see if they need to be changed. Then, build consensus on what needs to be changed, how to make the change, and when and how to introduce the change to your users.
Key Points
Metrics alone won’t make your SharePoint solution successful. To be helpful, the metrics need
![]() A person whose job it is to monitor them
A person whose job it is to monitor them
![]() A person or team who is accountable for making changes based on metrics analysis
A person or team who is accountable for making changes based on metrics analysis
In other words, it’s as important to have a plan for acting on metrics as it is to collect them in the first place! Identify who will be responsible for producing and reviewing metrics reports. This will likely include people from both your SharePoint administration team and business owners. Your measurement plan puts a sharp focus on the things that you are measuring. This gives everyone a clear indication of what is important to the organization. And if it’s important, someone needs to have responsibility for paying attention!
Evaluate whether the best approach to capture and monitor metrics is via a third-party tool or custom code. Custom reports using existing data may provide the least expensive option for capturing the desired metrics, but using a third-party tool will provide the most flexible long-term solution. Most of the third-party tools that are designed to work with SharePoint have capabilities to leverage out-of-the-box metrics and collect and capture additional custom metrics. They typically provide a repository for collecting metrics so that trending analysis can be accomplished for key metrics.
Once you decide the specific approaches you will use for your SharePoint measurement program:
![]() Develop a plan to capture qualitative metrics.
Develop a plan to capture qualitative metrics.
![]() Develop a library or list to capture and categorize qualitative metrics.
Develop a library or list to capture and categorize qualitative metrics.
![]() Develop an approach to produce regular metrics analysis (e.g., a balanced scorecard showing both qualitative and quantitative metrics as well as actions taken as a result of metrics analysis).
Develop an approach to produce regular metrics analysis (e.g., a balanced scorecard showing both qualitative and quantitative metrics as well as actions taken as a result of metrics analysis).
All materials on the site are licensed Creative Commons Attribution-Sharealike 3.0 Unported CC BY-SA 3.0 & GNU Free Documentation License (GFDL)
If you are the copyright holder of any material contained on our site and intend to remove it, please contact our site administrator for approval.
© 2016-2026 All site design rights belong to S.Y.A.