Expert Cube Development with SSAS Multidimensional Models (2014)
Chapter 5. Handling Transactional-Level Data
In this chapter, we will analyze how to add detailed information about each transaction in a fact table, such as invoice document and line number. We'll compare the use of MOLAP (Multidimensional Online Analytical Processing) and ROLAP (Relational Online Analytical Processing) dimensions for this purpose, and we will use the drillthrough feature to expose this data to the end user. We will also explain the reason this approach is better than exposing a large dimension directly to the end user.
In the second part of this chapter, we will add a dimension to the sales cube that describes the reasons for a sale. Since each sale can have multiple reasons associated with it, we will make use of the many-to-many dimensions relationship feature of Analysis Services, discussing its properties and possible performance issues. We will also take a brief look at possible modeling patterns available using many-to-many dimension relationships.
Details about transactional data
The goal of a multidimensional cube is to analyze aggregated data across several dimensions. However, when there is some interesting data, the user might be interested in drilling down to a lower level of detail. For example, when it comes to sales analysis, it could be interesting to look at the individual invoices that caused a particular high volume of sales in a single month. This is a very common request for end users to make; in fact, the question is not if the users will need this, but when.
One approach to solve this issue is to add a regular dimension to the cube which has the same granularity as the fact table (as we saw in Chapter 2, Building Basic Dimensions and Cubes); this is referred to as a Fact dimension. Using columns such as invoice number, invoice line number, and notes on the fact table, we can link each fact sale with a dimension member, calling the dimension itself something as Document. At this point, the end users will have a dimension that can be used with other one. If they filter by a particular month in their client tool and put the Invoice Number attribute of the Document dimension on rows, the resulting query will display the list of invoices of that particular month. However, this is not a good idea.
The most important reason to avoid making a fact dimension navigable to end users is performance. Adding a large dimension to the cube (and a dimension with a granularity near to the fact table, such as Document, will be always large) increases the multidimensional space that can be queried. The Analysis Services engine might spend a lot of time filtering the visible members of the Document dimension, and this could be critical when the query involves calculated members or other MDX calculations. The performance of this type of scenario has been improved in Analysis Services 2008 and then 2012, if compared to 2005. However, even if the query was lightning fast, there is still an issue for the client tool: before making a query, many client tools get all cube and dimension metadata to populate their navigation controls. A Document dimension might have millions of members on a single attribute, with no possible hierarchies to group them. Getting this metadata will slow down the client tools even before the user is able to query the cube. Some client tools are able to handle large dimensions quite well, but the original problem is always the same: why should we display a dimension when we really don't need to navigate it?
If we consider the original requirement carefully, there is a similarity between the need to get information at the transaction level and the need to get descriptive properties of an attribute member of a dimension. When we see a member on the Customer hierarchy, we might want to see the customer's phone number, their picture, or their address on a map, but this information will never be used as the filter in a query. For this reason, we should set the AttributeHierarchyEnabled property of all these descriptive attributes to false; this means, they are only visible as properties of a Customer member. The need to see the transaction details is somewhat similar, with the difference being that the information is related to each single row of the fact table. Analysis Services offers the drillthrough feature, which should satisfy this kind of need. However, this functionality is not perfect in its actual implementation. There are limitations in its use and you'll often encounter performance issues using it. In the next section, we will describe how to use the drillthrough feature in the most effective way.
Drillthrough
In conceptual terms, the drillthrough feature of Analysis Services allows you to retrieve data at the fact table granularity for any multidimensional tuple. From a practical point of view, when users look at a pivot table result, they can request the list of fact table rows that are aggregated into any specific cell in the result set. For example, the following screenshot shows the sales of a particular month divided by product categories and regions:
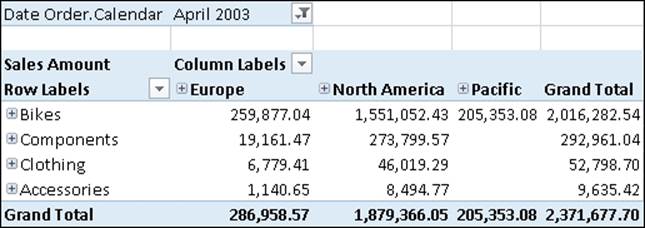
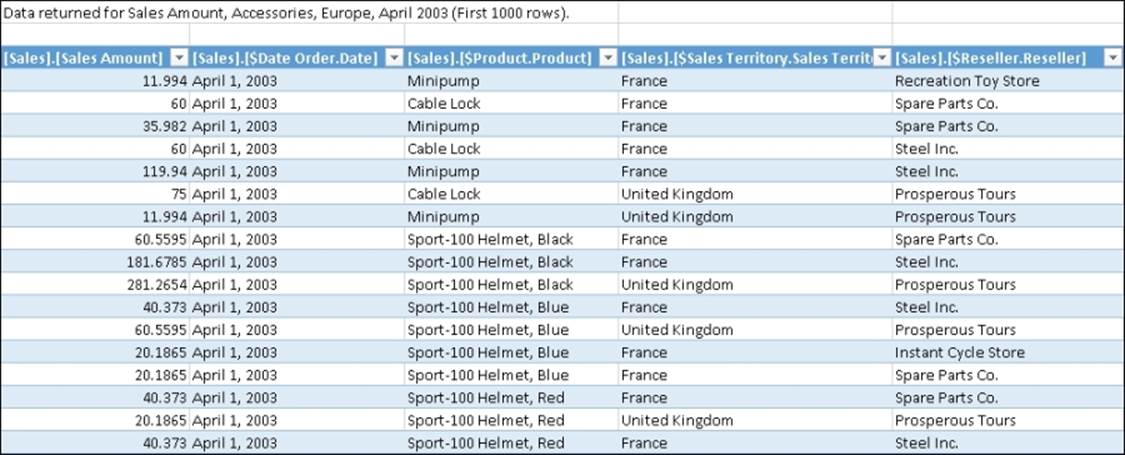
With Excel, when you double-click on a cell (for instance, the sales of Accessories in Europe, whose value is 1,140.65) a DRILLTHROUGH query is sent to Analysis Services and the result is shown in a new worksheet, returning the list of fact table rows that correspond to that cell, as shown in the following screenshot:
Note
The drillthrough operation differs from a generic drilldown because it is intended to retrieve a set of rows from the relational source data that has been aggregated into a single cell, while drilldown typically operates on predefined hierarchies of data. While drilldown navigates in a multidimensional space returning a "cellset" (a sort of array with usually two or three dimensions), the drillthrough goes directly to the lowest granularity of data.
In terms of MDX language, there is a specific keyword for this purpose: DRILLTHROUGH. It precedes an MDX SELECT statement that has to return only one cell, which is the one to be expanded with the drillthrough operation.
What is happening behind the scenes? From an MDX point of view, the DRILLTHROUGH query can be built by the client using any attributes from any of the dimensions in the cube. From a functional point of view, the choice of the columns to display can be customized by defining Drillthrough Actions on the cube. Next, we will start describing how to define drillthrough actions and how to customize them. Later, we will describe the DRILLTHROUGH operation in detail and how to model the cube and its dimensions to better leverage this feature.
Actions
Before we start, let's take a brief look at what we can do with Actions. Actions are pieces of metadata that are passed to the client to customize the user interface, offering the possibility to perform specific operations in a context-related way. For example, with an action, you tell a client tool that when a user clicks on the name of a city in a Geography dimension, it should open up a web browser with a given URL, generated by Analysis Services, to display a map of that particular city. An action defines a target (the part of the cube on which it can be activated), a condition (an MDX expression that must result true to make the action usable), and a set of parameters that define what action is required.
There are three types of actions:
· Generic action: This is a general purpose action with a specific action type, which can be:
· URL
· Rowset
· DataSet
· Proprietary
· Statement
· Reporting action: This action generates a link to a report stored in an instance of SQL Server Reporting Services (SSRS), and passes parameters to that report that are generated using context-sensitive MDX expressions
· Drillthrough action: This action executes a DRILLTHROUGH query using the cell on which the action has been called as a reference for the drillthrough
URL and Reporting actions are commonly used to link external reporting systems to cubes, and allow you not to have to worry too much about which client will be used to navigate the cube.
Drillthrough actions are useful to bring data back into the client tool, instead of for linking to an external resource. For example, when calling a drillthrough action in Excel, a DRILLTHROUGH query is executed and a new worksheet is created to display what it returns to the end user.
It is not our goal to cover action types other than drillthrough; for more information on them, please refer to Books Online.
Drillthrough actions
The definition of a drillthrough action on a cube is simply a set of metadata that is passed to the client. This metadata defines a set of columns that will be used by the client to build the DRILLTHROUGH statement that will be sent back to the server. There is no directDRILLTHROUGH statement generation made in this metadata, except for the default drillthrough setting that we will cover later in this section. In the following screenshot, we can see the Actions panel displaying the settings for a new drillthrough action. We will refer to the action field names in the following part of this section.
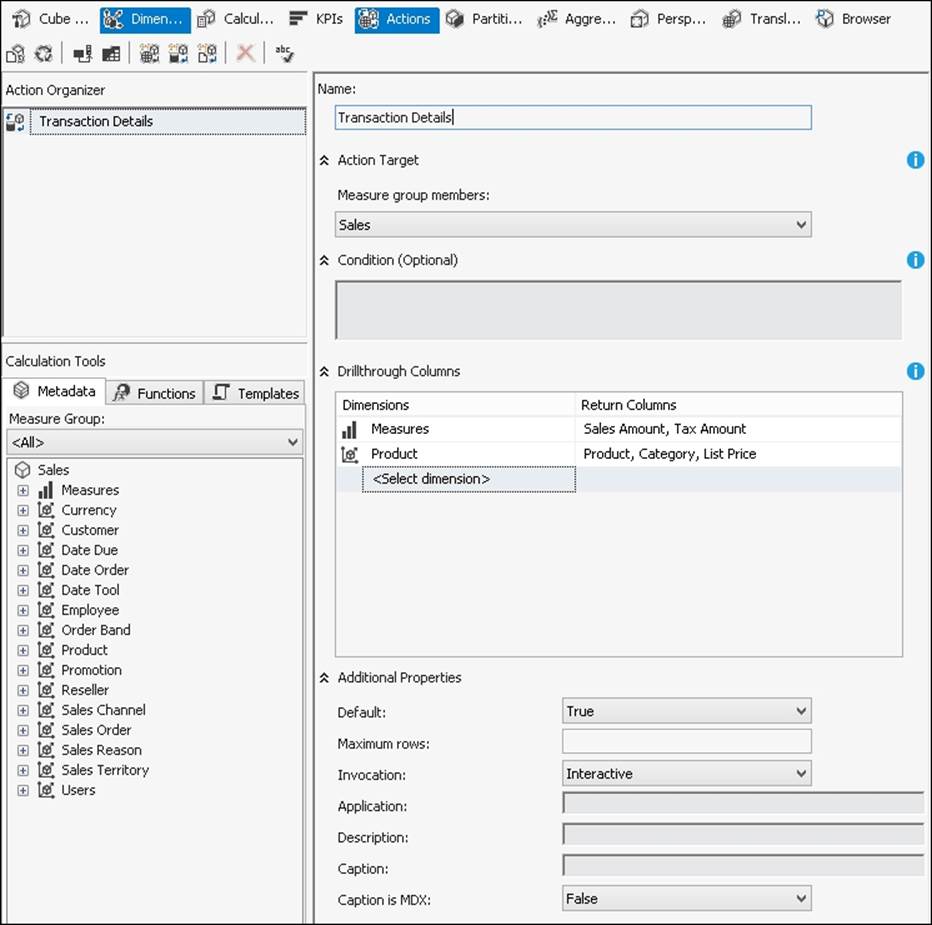
The Action Target section defines the measure group on which the action can be used. If we define <All>, then every measure group will have this drillthrough action available; otherwise, we can limit the action to all the measures of a single measure group in the cube. The Condition property defines an optional MDX expression that is evaluated on a cell to evaluate whether the action can be used on that cell or not (for example, we might limit the measures on which the drillthrough operates inside a specific measure group). It is not common to use this property for a drillthrough action, while it could be helpful to limit the display of URL or reporting actions in cases where there is data available for the selected cell.
The Drillthrough Columns property is the most important one. We can specify one or more dimensions belonging to the cube, and for each one we can specify one or more attributes that will be used as columns in the result. We can choose only attributes that have the AttributeHierarchyEnabled property set to true.
We will not go into the details of the properties in the Additional Properties section, except for the Default property. We should set the Default property to True for only one drillthrough action per measure group. This defines the default action for that measure group.
Note
Excel allows you to execute a default drillthrough action by double-clicking on a cell in a pivot table. This operation will execute the default drillthrough action for the measure group to which the selected measure belongs. However, even if there are no drillthrough actions defined, Excel will generate a drillthrough operation by asking for all the measures of the relevant measure group, plus the key attribute for each related dimension. We can disable all drillthrough operations on the server through role security. We can define whether a specific drillthrough action is enabled or not for a particular user by using the Condition property (there is an example at http://tinyurl.com/actioncondition). However, disabling all the drillthrough actions for a user in this way does not prevent the user from sending a DRILLTHROUGH statement to the server manually.
If we have more than one default drillthrough action defined for a measure group, only the first one will be used as the default. Thus, it makes sense to define a default drillthrough action for the <All> measure groups option at the end of the Measure Group Members drop-down list, which will be used as the default drillthrough action if one has not been defined for a particular measure group.
After we have defined new actions or updated existing ones, we can deploy the new version of our cube without needing to reprocess it. Actions operate only on cube metadata and do not have any effect on cube data.
Drillthrough columns order
The user interface of the Actions pane has some limitations: for instance, we cannot modify the order of the Drillthrough Columns section—they will always be displayed in the same order as the dimensions are shown in the list. Moreover, we do not have control over the order of the columns displayed for each dimension: they are always shown in the same order as the attributes that they relate to are defined. The combination of these limitations can be very annoying. It is common to have drillthrough actions that return many columns and we might want to control the order that these columns are displayed, just to improve readability when the user get the results of the drillthrough.
The good news is that these limitations only exist in the user interface of the Actions pane. In our Visual Studio project, the cube is defined as an XML file with the .cube extension. We can open it by right-clicking on the cube in Solution Explorer and then choosing the View Code menu item. This file can be modified to get the desired order for Drillthrough Columns, but this manual modification will be lost if we will further modify the action using the Actions pane.
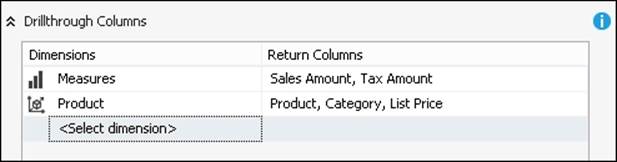
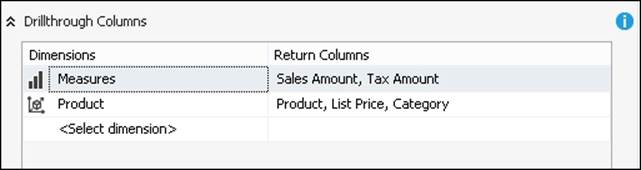
For example, consider the Drillthrough Columns setting shown in the following screenshot. It will return drillthrough columns in the following order: Sales Amount, Tax Amount, Product, Category, and finally List Price.
This is the XML produced by the preceding settings; we can easily find the Actions definitions by looking for the <Actions> tag in a cube file.
<Actions>
<Action xsi:type="DrillThroughAction">
<ID>Drillthrough Action</ID>
<Name>Transaction Details</Name>
<TargetType>Cells</TargetType>
<Target>MeasureGroupMeasures("Sales")</Target>
<Type>DrillThrough</Type>
<Default>true</Default>
<Columns>
<Column xsi:type="MeasureBinding">
<MeasureID>Sales Amount</MeasureID>
</Column>
<Column xsi:type="MeasureBinding">
<MeasureID>Tax Amount</MeasureID>
</Column>
<Column xsi:type="CubeAttributeBinding">
<CubeID>Adv DM 1</CubeID>
<CubeDimensionID>Product</CubeDimensionID>
<AttributeID>Products</AttributeID>
<Type>All</Type>
</Column>
<Column xsi:type="CubeAttributeBinding">
<CubeID>Adv DM 1</CubeID>
<CubeDimensionID>Product</CubeDimensionID>
<AttributeID>Category</AttributeID>
<Type>All</Type>
</Column>
<Column xsi:type="CubeAttributeBinding">
<CubeID>Adv DM 1</CubeID>
<CubeDimensionID>Product</CubeDimensionID>
<AttributeID>List Price</AttributeID>
<Type>All</Type>
</Column>
</Columns>
</Action>
</Actions>
Tip
Downloading the example code
You can download the example code files for all Packt books you have purchased from your account at http://www.PacktPub.com. If you purchased this book elsewhere, you can visit http://www.PacktPub.com/support and register to have the files e-mailed directly to you.
As we can see, the XML definition does not have constraints that force the columns of the same dimension to stay grouped together. In fact, we can move the columns in any order. For example, the following XML shows us how to arrange the columns definition to get the order Sales Amount, Product, List Price, Tax Amount, and Category.
<Actions>
<Action xsi:type="DrillThroughAction">
<ID>Drillthrough Action</ID>
<Name>Sales Details</Name>
<TargetType>Cells</TargetType>
<Target>MeasureGroupMeasures("Sales")</Target>
<Type>DrillThrough</Type>
<Default>true</Default>
<Columns>
<Column xsi:type="MeasureBinding">
<MeasureID>Sales Amount</MeasureID>
</Column>
<Column xsi:type="CubeAttributeBinding">
<CubeID>Adv DM 1</CubeID>
<CubeDimensionID>Product</CubeDimensionID>
<AttributeID>Products</AttributeID>
<Type>All</Type>
</Column>
<Column xsi:type="CubeAttributeBinding">
<CubeID>Adv DM 1</CubeID>
<CubeDimensionID>Product</CubeDimensionID>
<AttributeID>List Price</AttributeID>
<Type>All</Type>
</Column>
<Column xsi:type="MeasureBinding">
<MeasureID>Tax Amount</MeasureID>
</Column>
<Column xsi:type="CubeAttributeBinding">
<CubeID>Adv DM 1</CubeID>
<CubeDimensionID>Product</CubeDimensionID>
<AttributeID>Category</AttributeID>
<Type>All</Type>
</Column>
</Columns>
</Action>
</Actions>
At this point, if we close the XML file and return to the Actions pane, we will see the updated Drillthrough Columns list, as shown in the following screenshot:
The only visible change is that the Category column has been switched with List Price in the Product dimension. However, the output columns returned by this drillthrough action will be in the order we specified when we manually altered the XML file, with columns from different dimensions appearing wherever we want them to. We have to be careful about making further modifications in the Drillthrough Columns list. If we don't make any further modifications to the columns of the dimensions we manually altered in the XML file, we should be able to keep the order we defined manually. Otherwise, we have to repeat the manual modification of the XML file to get the desired column order.
Drillthrough and calculated members
We have seen that the drillthrough feature can apparently operate on any cell of the cube. In particular, we define drillthrough by choosing the measure group on which the drillthrough action will be active. However, the drillthrough operation works only on "real" measures. If we have defined calculated measures, drillthrough will not operate on these cells. Moreover, drillthrough does not operate on any cell that references any calculated member on any dimension, not just measures.
The rationale behind this is very simple. A calculated member may not have a direct relationship with a set of rows in the fact table. In reality, that relationship could be described for many calculated members, but Analysis Services does not offer a way to define this relationship. For this reason, drillthrough is not supported on calculated members.
There are two possible workarounds. The first is to create real members instead of calculated members on a dimension, and use assignments to overwrite their value in the MDX Script. For example, take a look at the DateTool dimension described in Chapter 6,Adding Calculations to the Cube, drillthrough is enabled on any noncalculated member that belongs to a dimension, even if that dimension is not related to any measure group. However, if the calculation in the MDX Script refers to values from somewhere else in the cube, drillthrough does not reflect this and always returns the same result, ignoring the possibility that it might not have any connection at all to the value displayed in the cell.
Note
For example, the DateTool dimension may include a member to calculate the year-to-date sum of any measure. Therefore, looking at the result for March 2009, we could expect that drillthrough would return the set of fact table rows from January 1 to March 31. However, in reality, we will only receive data from March 1 to March 31 if we look at the March member; similarly, if we go down to the Day level and drillthrough on March 31, we will get only the transactions from that day. In both cases, we might prefer that drillthrough operations follow the calculation logic as well as the physical coordinates, but it is not possible to customize the way Analysis Services determines which rows should be returned.
The second workaround is to create an action of type rowset, defining as target type all the cells and using the Condition expression to ensure it is only enabled for the calculated measures we want to use it on. This type of action can have an MDX DRILLTHROUGHstatement that returns the data we want and we have full control over the rows and columns returned by this action. Clients such as Excel support rowset actions and display their results in the same way they do those of drillthrough actions, because we always get a rowset as a result. However, in this case the MDX query for the drillthrough is not built by the client but by the server and there are some other differences in behavior. For example, the maximum rows returned by a drillthrough cannot be controlled by the client if we are using a rowset action. More information about this workaround is available on Mosha Pasumansky's blog in this post: http://tinyurl.com/drillcalc.
Tip
As an alternative to drillthrough, it's also possible to implement an action that returns a rowset and specify your own SQL for the query that it runs. To do this, however, you need to create an Analysis Services stored procedure in .NET and call it from the Actionexpression. More information on how to do this can be found here: http://tinyurl.com/ssas-sql
Drillthrough modeling
We started this chapter with a precise requirement. We wanted to add detailed information about each transaction, such as invoice document and line number, to our cube. The drillthrough feature we introduced is what we will use to display this data. However, there are several ways to model this data in the cube, so that it can be queried using the drillthrough feature.
We have seen that drillthrough can show both measures and related dimension attributes. Thus, we have two possible ways to model our data—in a dimension or in measures. The most common approach is to define a separate dimension with transaction details. This dimension would have a fact dimension relationship with the related measure group. The other option is to store this data in the measures defined in a separate measure group, with their AggregateFunction property set to None (although this is only possible in the Enterprise edition). This option is limited to numeric attributes, but document and line numbers might be numeric values that could leverage this option, which we will call drillthrough on alternate fact table.
Drillthrough using a transaction detail dimension
The Sales fact table has two fields, SalesOrderNumber and SalesOrderLineNumber, which we want to display in drillthrough queries. We need to create a dimension that will have these two attributes. To keep our model using surrogate keys in the key attribute of a dimension, we will use the surrogate key of the Sales fact table (ID_FactSales) as the key of this dimension. All the degenerate dimension attributes will be attributes of this dimension. In other words, we are creating a dimension that will have the same granularity as the fact table.
Note
If our degenerate attributes have a cardinality that results in the dimension's granularity being much higher than the fact table, then creating a separate dimension table in the relational model and a regular Analysis Services dimension would be a better idea.
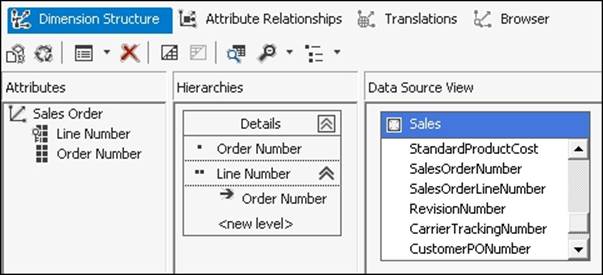
Considering that the surrogate key of the fact table will not have any meaning to our users, we will not display it directly to them, but we will use it in the KeyColumns property of the key attribute. In the following screenshot, we can see the resulting Invoice Detailsdimension. The Line Number attribute has the KeyColumns property set to ID_FactSales and the NameColumn property set to SalesOrderLineNumber. The Order Number attribute has the KeyColumns property set to SalesOrderNumber.
We might wonder why we didn't want to waste an attribute on the Surrogate key column on the fact table. The reason is that this dimension will be a very large one. Its number of members will be the same as the number of rows in the fact table. Using MOLAP storage for the dimension (which is the default of the dimension's StorageMode property) a SELECT DISTINCT query is sent to the relational source for each attribute of the dimension.
Note
Setting the dimension ProcessingGroup property to ByTable may not be a good idea here. This setting reduces the number of SQL queries generated during dimension processing to just one, with Analysis Services finding the distinct dimension members itself. However, for a very large dimension such as this it would mean Analysis Services doing a lot of work that could exhaust its memory resources and cause dimension processing to fail.
The next step is to build the relationship between this dimension and the fact table. We can use two relationship types: fact and regular. If we choose the regular relationship type, we have to identify Line Number as the granularity attribute, and use ID_FactSales for both Dimension Columns and Measure Group Columns in the Define Relationship dialog box. Choosing the fact relationship type does not require any further properties to be set. Both relationship types are equivalent in this case. We might prefer the fact relationship type just because, when looking at the Dimension Usage tab, it immediately reminds us that we are using the fact table as a dimension.
At this point, it is clear that having a large dimension for transaction details might be time and resource consuming. The dimension process operation will take a very long time (similar if not slower than the measure group process!) and it is hard to optimize in an incremental update since there is no way to partition a dimension. If we have a few million rows in our fact table, this solution will probably work well enough. But if we have tens, hundreds, or even thousands of millions of rows in our fact table, then processing time will likely be too long to be affordable. At this point, we need to consider some alternatives that can improve processing time.
Drillthrough with ROLAP dimensions
The simplest change we can make to our dimension is on its StorageMode property. It is set to MOLAP by default, which means that all dimension data is read during dimension processing and is stored in Analysis Services' own native compressed, indexed, and optimized format; at query time, Analysis Services only uses this copy of the data. Usually, this will give us the fastest query response times we can hope to have.
As an alternative, we can try to change the StorageMode property of the Sales Order dimension to ROLAP. At this point, we'll see different behavior for both dimension processing and drillthrough queries. Processing a ROLAP dimension does not require any SQL queries to be generated to fetch data; it simply empties the Analysis Services cache. When it comes to querying, we'll see different behavior depending on the relationship type used between the measure group and the ROLAP dimension.
In all cases, a drillthrough query on a ROLAP dimension will produce a complex SQL statement that will join the fact table with all the dimensions included in the cube, filtering data with the same criteria specified in the drillthrough query in MDX. This is, unfortunately, necessary to ensure that Analysis Services returns correct results. However, this is extremely expensive. We could try to index and optimize the relational tables, but it will be hard to avoid complete scans of the fact table for all possible queries. Only extremely clever partitioning of the fact table could give acceptable results. As a result, think carefully before using ROLAP dimension in large cubes for drillthrough operations, because query response times might be very long and will consume a lot of resources on the relational source database.
Note
Our personal opinion is that we recommend you do not use drillthrough with ROLAP measure groups and/or dimensions and large volumes of data. It's really not worth the pain! Look for some kind of workaround, such as Reporting Services reports linked to the cube with reporting actions.
Moreover, if we decide to use ROLAP dimensions anyway, pay attention to the relationship type used with the measure group. In this situation, it is much better to use the fact relationship type. This is because, if we use a regular relationship type, before the time consuming query we just talked about, a SELECT DISTINCT statement over the whole fact table (without filters) will be executed just to populate the possible dimension values in memory. It would be the same as the SELECT statement executed to process a dimension with ProcessingGroup set to ByTable, and it could fail if there is too much data to process.
Drillthrough on alternate fact table
As we said before, there is another option for storing the information to be queried using drillthrough, but it can be used only on numeric attributes. We can add measures to the cube, making them not visible in the cube metadata and so not visible to the end users. We can also add these measures in a separate measure group, so that they can have a different storage mode.
These special measures cannot be aggregated and for this reason, they should have their AggregateFunction property set to None (which is available only in the Enterprise edition). This approach might seem strange, but it is common to separate measures built on degenerate dimension attributes from cube measures because they have a different meaning and the main measure group is faster, if it does not contain useless measures (smaller is always faster).
If we need to implement drillthrough on a single ID which can be stored in a 32-bit integer, putting it in an invisible measure in the measure group and including it in the Drillthrough Columns list will always be the fastest and cheapest way to do it. If, on the other hand, there are several fields, all numeric, that we want to see in Drillthrough Columns and that are not already measures in the cube, we might opt for a separate measure group. We could use a separate fact table too, but if one hasn't been created it is better to create another view that will be used as the basis for the secondary measure group that will only contain measures used for drillthrough operations. This secondary measure group will not need to have any aggregations designed for it.
Note
It is possible to create two measure groups from the same fact table in the cube editor, but it isn't obvious how to do it. First of all you have to add a new distinct count measure to an existing measure group. Every time you do this, a new measure group is created and immediately afterwards we can change the AggregateFunction of the new measure from DistinctCount to None. Adding other measures requires some manual modification of the XML file containing the cube definition. Having a separate fact table, even if only through a view, is much simpler to handle.
Processing a MOLAP measure group does not require sending a SELECT DISTINCT query to the relational source in the way that a dimension does—a simple SELECT query is used instead. Therefore, if we are going to use MOLAP storage, the alternate fact table technique processes faster than the dimension approach, and can also leverage partitioning, if needed. Also, this new measure group can be processed incrementally or on a per-partition basis similar to any other measure group.
If we want to use the alternate fact table approach, we might also consider shortening processing time and lowering used disk space by changing the StorageMode property of the measure group to ROLAP. However, this is not a good idea for reasons similar to those that discourage the use of ROLAP dimensions for drillthrough purposes. While processing time for a ROLAP measure group is practically nothing, at query time Analysis Services generates a SQL query that is similar to the one generated for drillthrough on a ROLAP dimension. This query will have several JOIN conditions and it often produces a full scan of the fact table. Therefore, with large cubes, choosing ROLAP storage for measure groups can be dangerous; choosing MOLAP for measure groups created expressly for drillthrough operations is usually a better idea.
To make the measures that we added in this way visible to drillthrough operations, we have to be careful. The drillthrough operation must be usable from the main measure group, but the Drillthrough Columns list will contain only measures from the new measure group. We can specify measures from measure groups different to the one specified in the Action Target section with no problems; the only constraint is that all the measures in a drillthrough action must belong to the same measure group.
Drillthrough recap
In the following table, we can see all the combinations of drillthrough techniques, storage modes, and dimension relationships and their impact on cube processing and queries. It is a shame that ROLAP storage always has very slow performance if you keep the data in the relational database.
|
Technique |
Storage |
Dimension relationship |
Impact on processing |
Impact on querying |
|
Transaction Detail Dimension |
MOLAP |
Regular |
Execute a SQL SELECT DISTINCT on drillthrough attributes |
Fast query. |
|
Fact |
Fast query. |
|||
|
ROLAP |
Regular |
No operations in cube process |
Complex SQL query to get the drillthrough result. It also executes a SELECT DISTINCT query on drillthrough attributes. |
|
|
Fact |
No operations in cube process |
Complex SQL query to get the drillthrough result. |
||
|
Alternative Measure Group (only for numeric attribute) |
MOLAP |
N/A |
Executes SQL SELECT queries on the fact table, without using any SELECT DISTINCT before |
Fast query. |
|
ROLAP |
N/A |
No operations in cube process |
Complete scan in the fact table. Dangerous with large fact tables. |
Many-to-many dimension relationships
In the dimensional model, the fact table has a many-to-one relationship with each dimension. However, sometimes this kind of modeling cannot represent the real world: for example, a product might belong to several categories. One way of solving this problem might be to choose a "primary" category for each product, to allow the use of a classical star schema. But, doing this, we lose possibly important information.
Analysis Services 2005 introduced the ability to handle many-to-many relationships between dimensions. This feature brings to the OLAP world the approach of modeling many-to-many relationships using bridge tables or factless fact tables that we saw in Chapter 2, Building Basic Dimensions and Cubes.
Implementing a many-to-many dimension relationship
Our example scenario for implementing a many-to-many relationship is based on Sales Reason. In Adventure Works, each Internet sale has a list of reasons for the transaction. This list is the result of the customer being asked a multiple choice question. Therefore, each transaction can have zero, one, or more sales reasons linked to it. To represent this in the relational model, we have a regular dimension, SalesReasons, that has all the possible reasons for a sale, and a bridge table that makes the connection between a regular dimension (in this case the Sales Order degenerate dimension that we created in the drillthrough section) and the dimension with the many-to-many relationship. The bridge table has a row for each existing combination of order and sales reason, in this way defining the many-to-many relationship that exists between Sales Reasons and Sales Orders.
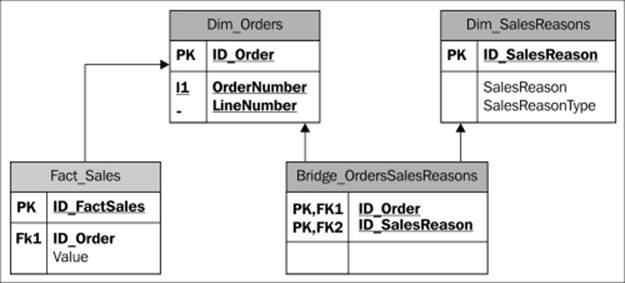
Usually, a bridge table links two regular dimensions and is represented in the relational model as shown in the following diagram:
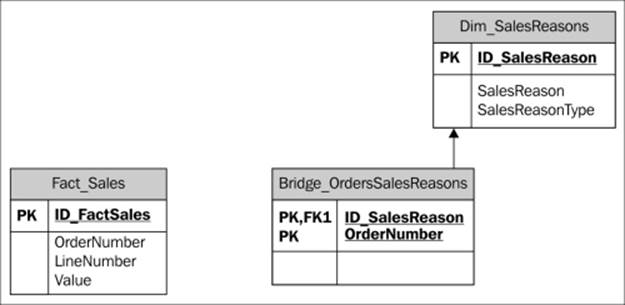
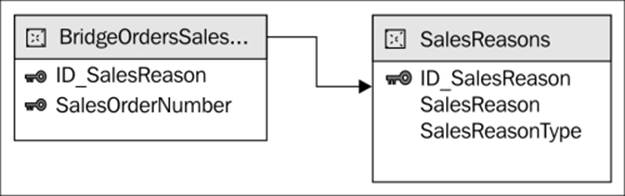
However, in this case, we do not have the relational table corresponding to the dimension that links the two measure groups. The following diagram describes the situation we are modeling in our scenario. The dimension is created from the OrderNumber andLineNumber fields in the fact table, forming a degenerate dimension. For this reason, we cannot graphically represent the relationship between the bridge table and the degenerate dimension.
We can model this relationship directly in our Analysis Services cube without needing to materialize the degenerate dimension into a physical table. We already have the SalesReason dimension defined in our cube, and we only need to add a measure group corresponding to the bridge table BridgeOrdersSalesReasons defined in the Sales schema of our data mart. First of all, we will make this table visible through a view, named BridgeOrdersSalesReasons in the CubeSales schema. Then, we add this table to the Data Sourceview of our project, adding a relationship between its ID_SalesReason field and the corresponding primary key of the SalesReasons table, as in the following diagram:
At this point, we create a new measure group named Bridge Sales Reasons, containing a single, hidden measure named Bridge Sales Reasons Count that will count the number of rows of the BridgeOrdersSalesReasons table; this measure might never be used in queries, but every measure group has to contain at least one measure. This will be our intermediate measure group in the many-to-many dimension relationship. In the Dimension Usage tab, we add the Sales Reason dimension, which will have a regular relationship with theBridge Sales Reasons measure group. What is less intuitive is how to create the relationship between the Sales Order dimension and the new measure group.
The Sales Order dimension is a degenerate dimension and its content is stored in the fact table. Moreover, the granularity of the bridge table is the order number, while the granularity of the Sales Order dimension is the order line number. However, we can define a regular relationship with a non-key granularity attribute, such as Order Number using the SalesOrderNumber column, as we can see in the following screenshot:
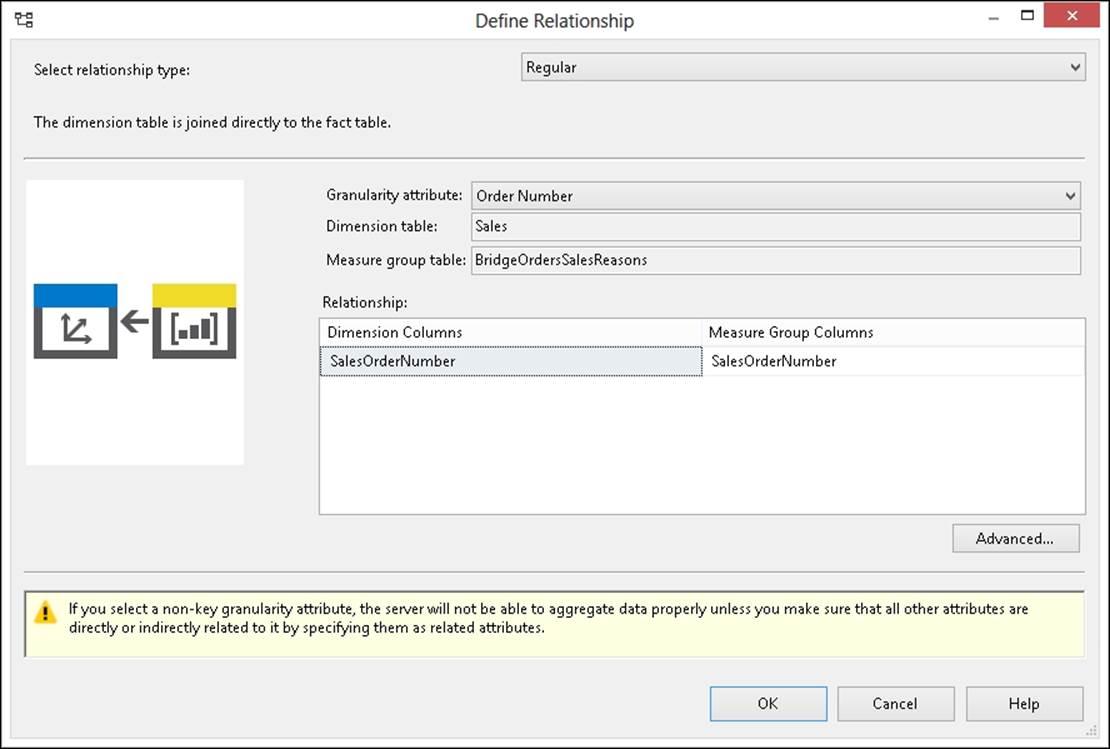
Defining relationships using the non-key granularity attribute is an important skill to learn.
Note
As we saw in Chapter 4, Measures and Measure Groups, when we define a dimension relationship using a non-key granularity attribute there is a warning about possible issues when aggregating data. However, using this technique with bridge tables for many-to-many relationships shouldn't have any side effects because the bridge table doesn't contain visible measures; so, the user will never query this measure group directly and Analysis Services will only use data at the granularity of the fact table to resolve the many-to-many relationship.
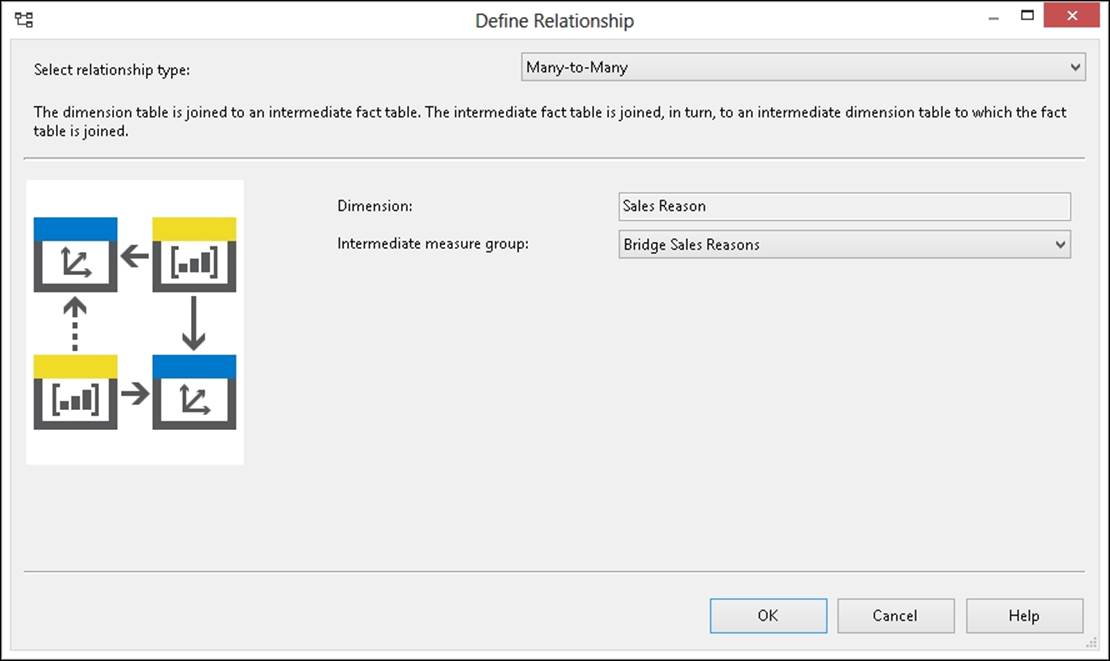
Finally, we have to define the relationship between the Sales Reason dimension and the Sales measure group. To do that, we use a Many-to-Many relationship type in the Define Relationship dialog box as shown in the following screenshot. The intermediate measure group must be Bridge Sales Reasons, which we have just defined. Note that we cannot use a measure group as an intermediate one in this dialog box if it does not have a regular relationship with one of the other dimensions of the primary measure group where we are defining the many-to-many dimension relationship.
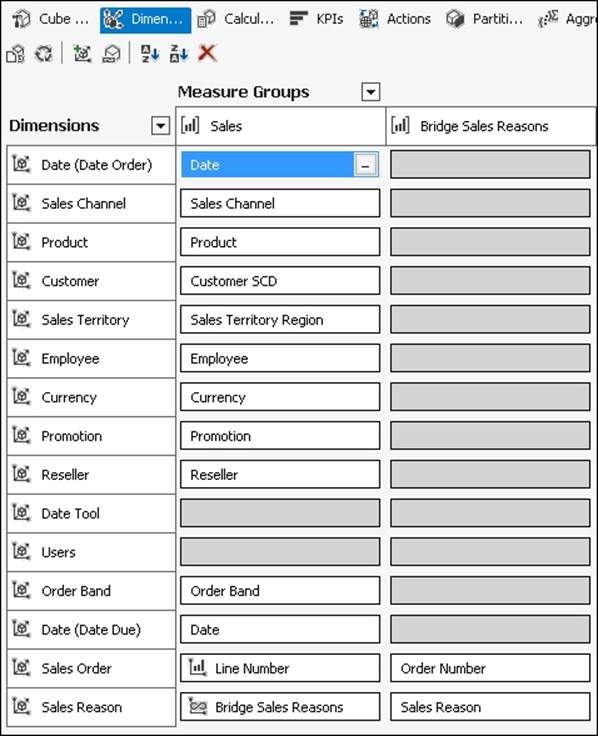
After these changes, we will have the following configuration in the Dimension Usage tab:
Now, we can process the cube and navigate it. In the following screenshot, we can see a pivot table showing the Order Quantity measure filtered by sales made in Central U.S. through Internet Sales Channel. We are filtering by sales made over the Internet because Sales Reasons are gathered only for this kind of sale. The filter for Central U.S. is only to get a small enough subset of data to make the calculation easy to explain.
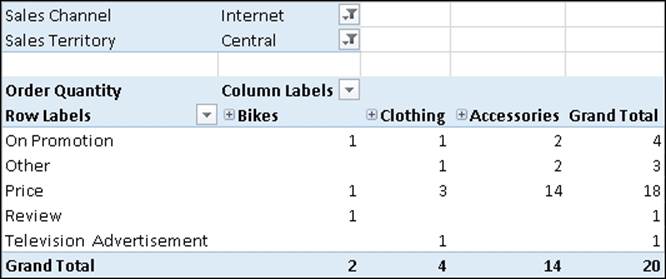
The total number of bikes sold is two. However, we have three different reasons shown in this column. It means that at least one bike sale has more than one related reason. The same is true for the other product categories. We can see that the total in each column does not correspond to the sum of the preceding rows. However, the total for each row corresponds to the sum of the preceding columns. This is because the Sales Reason dimension that is displayed on rows has a many-to-many relationship with the measure we are analyzing, while Product Categories , which( ) is displayed on columns has a regular relationship and can be aggregated in the traditional way.
The aggregation of measures on a many-to-many relationship is a sort of "distinct sum". In other words, when summing values, each item has to be summed only once. If a bike has been sold because it was On Promotion, we don't have to sum its value twice if it has been sold also because of its Price. This kind of behavior requires that calculations on measures over a dimension having a many-to-many dimension relationship need to be done at query time and cannot be calculated in advance and stored in the fact table. However, these calculations can still leverage the cache of Analysis Services.
Advanced modeling with many-to-many relationships
Many-to-many dimension relationships can be leveraged to present data in ways that are not feasible with a traditional star schema. This opens a brand new world of opportunities that transcends the limits of traditional OLAP and enables advanced data analysis by using pivot tables without writing queries.
One common scenario where many-to-many relationships can be used is a survey consisting of questions that have predefined answers with both simple and multiple choices. The typical star schema model (one fact table with answers joined with a questions/answers dimension and a case dimension) is fully queryable using SQL. However, while it is very simple to compare different answers to the same question, it could be very difficult to relate answers to more than one question. For example, if we have a question asking the respondent which sports they played (multiple choices) and another one asking what job they did, we would probably like to know what relationships exists between those two attributes. The normal way to solve it is to have two different attributes (or dimensions) that users can combine on rows and columns of a pivot table. Unfortunately, having an attribute for each question is not very flexible; more importantly, we have to change our star schema to accommodate having a single row into the fact table for each case. This makes it very difficult to handle any multiple choice questions.
Instead, we can change our perspective and leverage many-to-many relationships. We can build a finite number (as many as we want) of question/answer dimensions, using role-playing dimensions to duplicate an original dimension and providing to the user with a number of "filter" dimensions that can be nested in a pivot table or can be used filter data that, for each case, satisfies defined conditions for different questions.
Another scenario is the one where a snapshot fact table contains the state of data over time, recording "snapshots" of that state. If, for example, we register the credit rating of a customer each month, an OLAP cube is pretty good at returning the number of customers for each rating rank in each month. However, it is usually much harder to analyze the flow of changes. For example, if we had 30 customers rated AAA and 20 rated AAB in January, then we see that we have 20 customer rated AAA and 35 rated AAB in June, what does it mean? It could be that we had 10 customers previously-rated AAA that have been downgraded to AAB and we acquired 5 new customer AAB. But, it could also be that we lost 5 AAA customers and 2 AAB customers, we retained 5 AAA downgraded to AAB and got 12 new customer rated AAB.
Looking at the total numbers, any hypothesis could be true, but in reality the data can be examined to give the real numbers. By using a many-to-many relationship, it is possible to create a multidimensional model with a "start period" and an "end period" date and a rating dimension. Using a pivot table, the user can create a transition matrix that correlates each possible rating at the start period with each possible rating at the end period.
Further description of this kind of advanced modeling technique is beyond the goal of this book. These scenarios and many others are described in detail in a paper named The Many-to-Many Revolution, which is downloadable from http://www.sqlbi.com/.
Performance issues
The particular calculations made at runtime to resolve queries involving many-to-many dimension relationships can be quite expensive and result in performance issues. To understand why this is, we need to understand how queries involving many-to-many dimensions are resolved. Taking the example query we've been looking at using Sales Reason, when the query is run, Analysis Services first takes the set of sales reasons selected, then scans the intermediate measure group to find all of the individual sales orders from the Sales Order dimension associated with each sales reason, and then queries the main measure group to aggregate the requested measures for all of these sales orders. If there are a large number of sales orders associated with each sales reason, this could take a lot of time to do, and because the query on the main measure group is resolved at the sales order granularity, this severely restricts the ability of Analysis Services to use aggregations to improve performance.
The critical issue is the size (that is the number of rows) in the intermediate measure group. If it is small, it could be possible to build some aggregations on the main measure group at the level of the granularity attributes of the dimensions that make the join with the intermediate measure group. In these cases, aggregations can improve the execution time of the queries. However, if the intermediate measure group has millions of rows, aggregations will not improve execution time much.
In general, to optimize cubes with many-to-many dimension relationships, it is necessary to reduce the number of rows in the intermediate measure groups somehow—this can be achieved by "compressing" the data, so that frequently occurring patterns of relationships are represented by a single row in the intermediate measure group instead of multiple rows. After that, we can try to minimize the number of rows scanned for each query, for example, by partitioning the intermediate measure group using one of the dimensions that has a regular relationship with the intermediate measure group as well as the "primary" measure group. In the case of transition matrix, the Date dimension should be related to both measure groups as a regular dimension, and partitioning the intermediate measure group by members of the Date dimension will reduce the number of rows scanned at query time.
The optimization of many-to-many dimension relationships, including the compression technique mentioned previously, is covered in a white paper named Analysis Services Many-to-Many Dimensions: Query Performance Optimization Techniques, which is downloadable here: http://tinyurl.com/m2moptimize.
Finally, in some scenarios where there is a large dimension linking the intermediate measure group and the main measure group, the users do not actually need to be able to query it directly—it is just used to resolve the many-to-many relationship and its Visibleproperty is set to false. If this is the case, we can avoid the processing overhead associated with such a large dimension by breaking it up into multiple smaller dimensions, and at the same time, improve performance of many-to-many queries too. This technique is described in detail here: http://tinyurl.com/breaklargedims
Summary
In this chapter, we have seen how to use the drillthrough feature, discussing in detail several options available to model and optimize drillthrough actions. We have seen the differences between using MOLAP and ROLAP dimensions to enable drillthrough on transaction details. We have also discussed how to include a many-to-many dimension relationship in our model, highlighting that this single feature enables much more complex modeling techniques, giving some examples of the possible scenarios and providing links to external resources about modeling and optimization for this feature. In the next chapter, we will show how to add complex calculations to the model.
All materials on the site are licensed Creative Commons Attribution-Sharealike 3.0 Unported CC BY-SA 3.0 & GNU Free Documentation License (GFDL)
If you are the copyright holder of any material contained on our site and intend to remove it, please contact our site administrator for approval.
© 2016-2026 All site design rights belong to S.Y.A.