WCF Multi-layer Services Development with Entity Framework Fourth Edition (2014)
Chapter 4. Debugging the HelloWorld WCF Service
In the previous chapters, we built a basic HelloWorld WCF service and hosted it in a few different ways. We have also deployed this service to an on-premise machine and to the cloud. In this chapter, we will learn how to debug WCF services.
In this chapter, we will cover the following topics:
· Debugging a WCF service from a client application
· Directly debugging a WCF service
· Attaching the debugger to a running WCF service process
· Debugging a WCF service hosted in the cloud
Debugging a WCF service from a client application
Now that we have a fully working WCF service, let's have a look at the debugging options of this service. We will use our original client, HelloWorldClient, to discuss the debugging options; so, in the following sections, whenever you come across terms such as client, the client program, or the client application, refer to HelloWorldClient.
The first and the most common scenario is to start a client program in the debug mode and then step into our WCF service. Next, we will try this option to debug the service.
Starting the debugging process
Follow these steps to start the debugging process from the client application:
1. Start Visual Studio as an administrator and open the HelloWorld solution.
2. Change the client program's configuration file to call HelloWorldService hosted within IIS Express. Open the App.config file inside the HelloWorldClient project and set the address of the endpoint to http://localhost:55859/HostExpressServer/HelloWorldService.svc.
Note
Remember that the port number can be different in your environment. You should change it to the port that IIS Express has assigned to your service.
3. In the Solution Explorer, right-click on the HelloWorldClient project and select Set as Startup Project from the context menu.
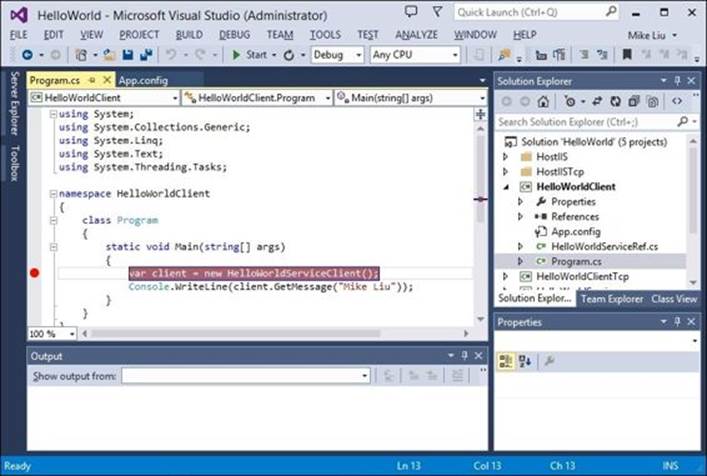
4. Open the Program.cs file inside the HelloWorldClient project and set a breakpoint at the following line:
var client = new HelloWorldServiceClient();
Your screen will look as follows:
5. Now, press F5 or select menu options DEBUG | Start Debugging to start the debugging process.
Debugging the client application
When we start debugging our application, the cursor stops at the breakpoint line, as you can see in the following HelloWorld (Debugging) screenshot. The active line is highlighted, and you can examine the variables just as you can do for any other C# applications:
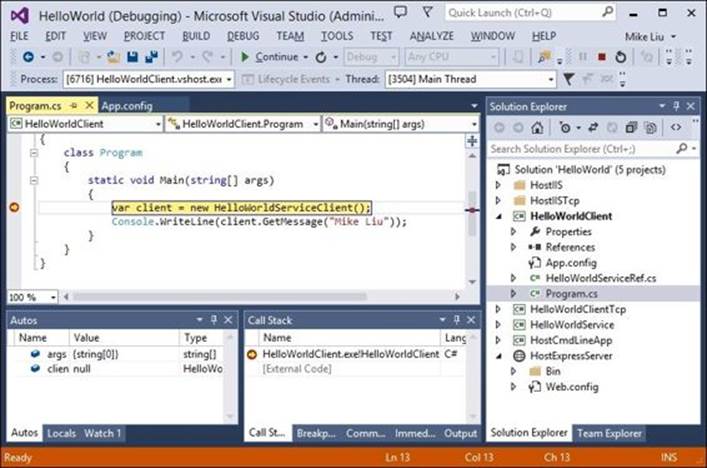
At this point, the channel between the client and the hosting server (HostExpressServer) has not been created. Press F10 or select menu options DEBUG | Step Over to skip over this line. If you don't have the menu options DEBUG | Step Over, you might have to reset your development environment settings through the menu options TOOLS | Import and Export Settings… (check appropriate options in Import and Export Settings Wizard).
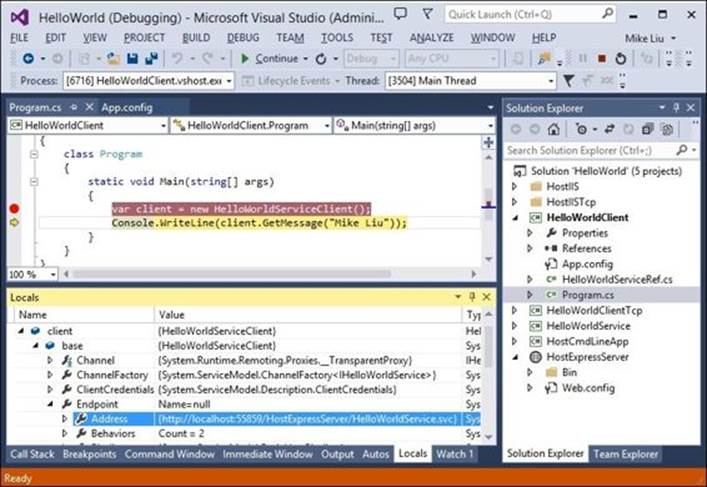
Now, the line following the highlighted line in the preceding screenshot should be active and highlighted. At this point, we have a valid client object, which contains all of the information related to the WCF service such as the channel, the endpoint, the members, and the security credentials.
The following screenshot shows the details of the endpoint of the client variable:
Stepping into the WCF service
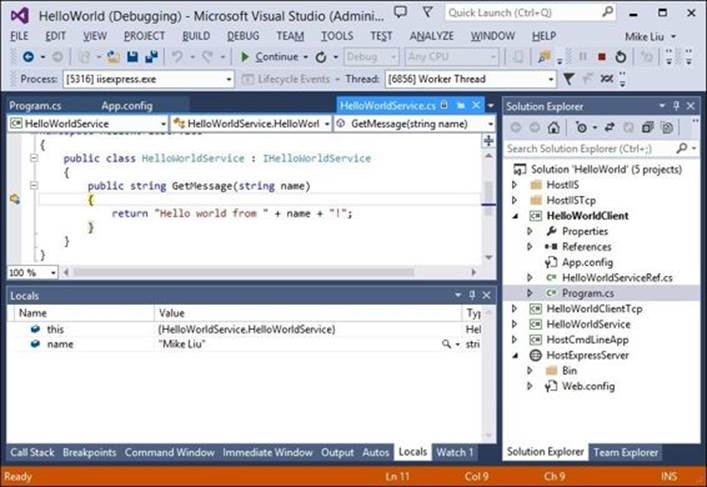
Now, press F11 to step into the service code. The cursor now resides on the opening bracket of the GetMessage method of HelloWorldService. You can now examine the variables and their values inside HelloWorldService just as you would for any other program. Keep pressing F10and you should eventually come back to the client program.
However, if you stay inside the HelloWorldService project for too long, when you come back to the HelloWorldClient project, you will get an exception which says that it has timed out. This is because, by default, the HelloWorldClient will call the HelloWorldService and wait for a response for a maximum time of one minute. You can add an attribute, sendTimeout/receiveTimeout, to the binding and set it to a higher value in the App.config configuration file, depending on your own needs.
You might also have noticed that you don't see the output window of the HelloWorldClient. This is because, in the debug mode, once a console application finishes, the console window is closed. You have to add one line at the end of Program.cs to wait for a keystroke so that you can look at the output before it closes. You can do this by adding the following line of code:
Console.ReadKey();
Note
You can step into the service from the client only if TOOLS own the source code of the service and the service is hosted on the same machine as the client program. In certain environments, you might not be able to step inside the service directly from the client application due to some debugging settings of your Visual Studio or IIS Express. In this case, you can use the techniques we will learn in the Attaching the debugger to a running WCF service process section, later in this chapter, to debug the service.
Directly debugging the WCF service
In the previous section, we started debugging the client program and then stepped into the service program. Sometimes, we might not want to run the client application in the debug mode. For example, if the client application is a third-party product, we won't have the source code, or the client application might run on a different machine altogether. In such cases, if we need to we can run the service in the debugging mode and debug only the service.
Starting the WCF service in the debugging mode
To start the HelloWorldService in the debug mode, first set the HostExpressServer as the startup project. Then, open HelloWorldService.cs from the HelloWorldService project, and set a breakpoint on the first line inside the GetMessage method.
Now, press F5 to start the service in the debugging mode, it will wait for requests. A browser will open, displaying the 403.14 error page. If you go back to the Visual Studio IDE, you will find that a new solution folder, Script Documents, has been added to the solution. This folder is the actual content of the web page being displayed in the browser. As its content is dynamically generated, this folder will only be included in the solution when the HostExpressServer is being debugged. Whenever you stop the debugging session, this folder will go away automatically.
Starting the client application
Now that we have the WCF service running in the debugging mode, we need to start the client application so that we can step inside the WCF service that is being debugged.
However, first let's remove the breakpoint on the client program so that we can focus on the service itself.
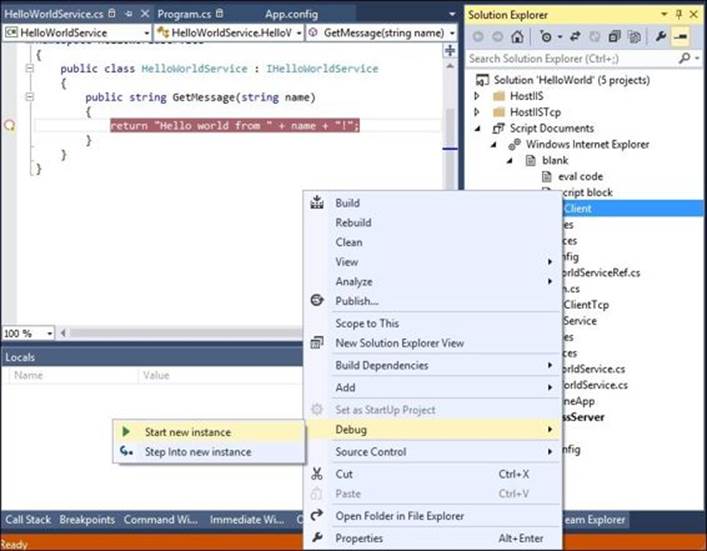
Now, there are two ways to start the HelloWorldClient program. The first one is to start it within the same instance of Visual Studio. While leaving the HelloWorldService running in the debugging mode, in the Solution Explorer of the Visual Studio, right-click on theHelloWorldClient project and select Debug | Start new instance so that HelloWorldClient will also start running in the debugging mode. Immediately, you will step inside the WCF service, stopping on the first line of the GetMessage method within HelloWorldService. From this point onwards, you can keep debugging the service as you would do for any other program.
Another way to start HelloWorldClient is to start it from Windows Explorer. Go to the C:\SOAwithWCFandEF\Projects\HelloWorld\HelloWorldClient\bin\Debug directory and double-click on the HelloWorldClient.exe file. You will then get the same result as you did when you started it from within Visual Studio.
Attaching the debugger to a running WCF service process
Another common scenario while debugging is when attaching the debugger to a running WCF service. Suppose HelloWorldService is hosted and running outside Visual Studio, either in IIS or in a managed application such as HostCmdLineApp. In this case, the client application is also running outside of Visual Studio. At a certain point, you might want to start debugging the running WCF service. In this case, we can attach the debugger to the running WCF service process and start debugging it.
Note
Even if the WCF service is hosted inside Visual Studio, like with the HostExpressServer website, in certain environments, you might still not be able to step inside the service directly from the client application due to some debugging settings of your Visual Studio or IIS Express. In this case, you can use the same technique we will learn here to debug the service, just by attaching to the IIS Express process.
Running the WCF service and client applications in a non-debugging mode
To test this scenario, change the App.config file in the client program project to use the IIS hosting HelloWorldService. This means that we use the following address for the endpoint in the App.config file for the HelloWorldClient project:http://localhost/HelloWorldService/HelloWorldService.svc.
Build the solution and set a breakpoint inside the GetMessage method of the HelloWorldService project. Then, set the HelloWorldClient project as the startup project and run HelloWorldClient in a non-debugging mode by pressing Ctrl + F5. You will see the breakpoint that we had previously set within the HelloWorldService is not hit this time. This is because the service is now hosted by IIS and is not available for debugging by this instance of Visual Studio.
Debugging the WCF service hosted in IIS
To debug the service hosted by IIS, we can attach the debugger to the IIS process. However, before we can debug it, we have to enable debugging for the web application. Just open the Web.config file under the HostIIS folder and change the debug value to True.
Now, perform the following steps:
1. Start Visual Studio and select menu options DEBUG | Attach to Process…. The Attach to Process window should now appear. If you can't see the DEBUG menu from Visual Studio, just open any project or create a new empty project.
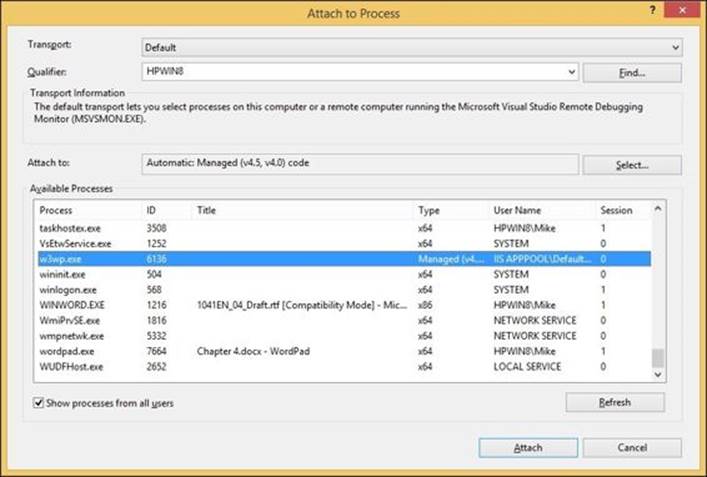
2. Select the w3wp.exe process from the list of available processes and click on the Attach button. Note that you need to check Show processes from all users in order to see w3wp.exe in the available processes list. If it is still not there, run HelloWorldClient once and hit theRefresh button; w3wp.exe will appear in the list.
3. Now, you will find the IIS worker process attached to the debugger. Open the HelloWorldService.cs file and set a breakpoint if you haven't done so already.
4. Now, run the HelloWorldClient program in the non-debugging mode from Windows Explorer or run it in the debugging mode by right-clicking on the HelloWorldClient project and selecting the Debug | Start new instance option from Visual Studio. You will see that the breakpoint inside the service is now hit.
If you are not able to set a breakpoint inside the HelloWorldService.cs file (or the breakpoint is disabled after you attach a debugger to the w3wp.exe process), make sure you have enabled debugging for the HostIIS application (as we did at the beginning of this section) and theHostIIS\bin folder contains the latest binary files from the HelloWorldService folder.
If you didn't start Visual Studio as an administrator, you will get a dialog window asking you to restart Visual Studio using different credentials. Select Restart under different credentials and you will be able to continue.
When you have finished debugging HelloWorldService using this method, you can select menu options DEBUG | Detach All or DEBUG | Stop Debugging to exit the debugging mode.
You might also have noticed that when you attach to w3wp.exe, IIS Express is also started, even though we have not used it at all at this time. This is because the Always Start When Debugging property of HostExpressServer is set to True. You can turn it off if you feel it is annoying.
Debugging a WCF service hosted in the cloud
In previous sections of this chapter, we learned how to debug WCF services, but the services are all hosted on an on-premise computer. Now, in the last section of this chapter, we will learn how to debug the WCF service, HelloWorldCloud, that we have deployed to the cloud in the last chapter. We will enable the debugging of the service, attach a debugger to the service process, and debug it using Visual Studio on our local computer.
Enabling debugging of the service
To debug a cloud service from a remote machine, debugging functionality must be enabled explicitly when the service is deployed to the cloud. When debugging is enabled for a cloud service, required services (msvsmon.exe, for example) will be installed on the virtual machines that run the role instances. As we didn't enable remote debugging when we published the HelloWorld service to the cloud, we have to republish the service with remote debugging enabled.
You can follow these steps to create a new hosting website.
1. Start Visual Studio as an administrator and open the HelloWorld solution.
2. From the Solution Explorer, right-click on the publishing website HostBaseServer and select Publish Web Site from the context menu. The Publish Web dialog box should appear.
3. Select HelloWorldCloud (2) from the profiles drop-down list.
4. Click the Settings link from the left-hand side of the dialog box and choose Debug from the Configuration drop-down list.
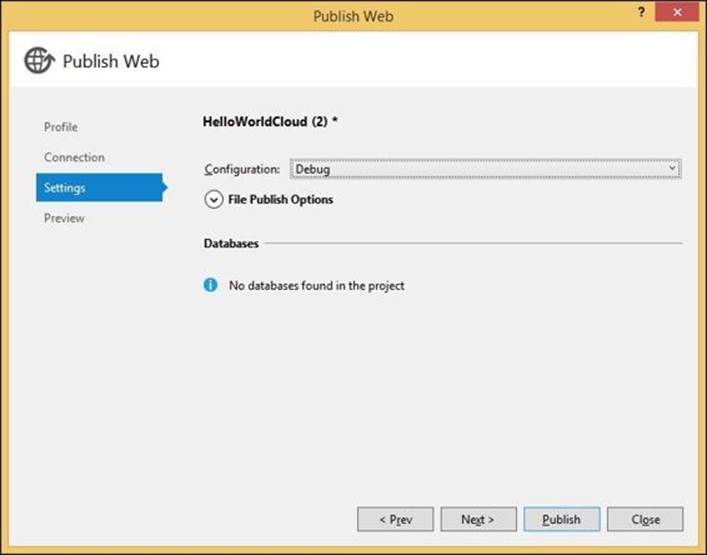
5. Click on the Publish button to republish the WCF service to the cloud.
Note
Enabling remote debugging for a cloud service doesn't exhibit degraded performance or incur additional charges to the service. However, you shouldn't use remote debugging on a production service because clients who use the service might be adversely affected.
Attaching to the cloud service process
Now, the service has been redeployed to the cloud with debugging enabled, and we can start debugging it remotely from Visual Studio. First, let's attach debugger to it from Visual Studio.
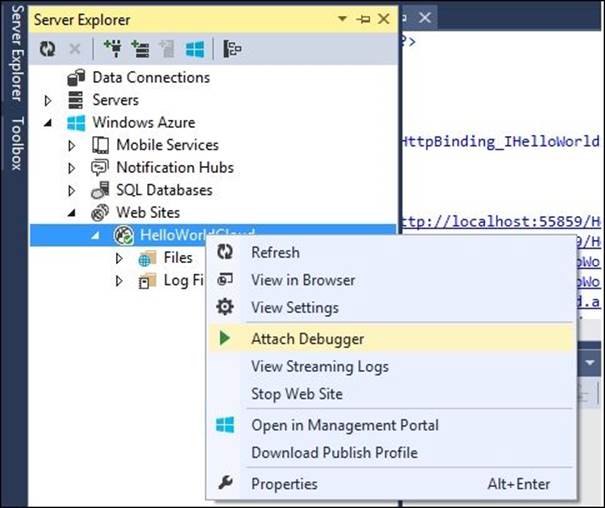
1. From the Server Explorer, expand the node Windows Azure | Web Sites. Here, you should see the website you created and deployed the HelloWorldCloud service to in Chapter 3, Deploying the HelloWorld WCF Service. We use HelloWorldCloud as an example here, but you should see your own website:
2. You might need to sign in to Azure again if you haven't done so, or you haven't checked the keep me signed in flag. If you don't see your website after signing in, you can refresh the Web Sites node.
3. Now, right-click on the website and select Attach Debugger from the context menu. The service process in the cloud is now attached to the debugger and Visual Studio is changed to be in the debugging mode.
4. Restart the website.
Debugging the service
Now we have attached the Visual Studio debugger to the cloud service, let's start debugging this service.
1. From the Solution Explorer, open the Web.config file from the HelloWorldClient project.
2. Change the endpoint address to be the cloud one.
3. Open the HelloWorldService.cs file in the HelloWorldService project.
4. Set a breakpoint within the file.
5. Right-click on the HelloWorldClient project and select Debug | Start new instance to start the client application.
6. Press F11 when the service is being called.
7. Watch the breakpoint inside the HelloWorldService file being hit when the client application runs.
Note
If you cannot set a breakpoint inside the HelloWorldService file, or you cannot step into the service file, you might need to restart the cloud website after you republish it.
Summary
In this chapter, we have hosted the HelloWorld WCF service in several different ways and explored different scenarios to debug a WCF service. Now that we have the basic skills for WCF service development, in the next chapter, we will start developing a three-layered WCF service following the best practices of WCF service development.
All materials on the site are licensed Creative Commons Attribution-Sharealike 3.0 Unported CC BY-SA 3.0 & GNU Free Documentation License (GFDL)
If you are the copyright holder of any material contained on our site and intend to remove it, please contact our site administrator for approval.
© 2016-2026 All site design rights belong to S.Y.A.