CCNA Wireless 200-355 Official Cert Guide (2016)
Chapter 18. Managing Cisco Wireless Networks
This chapter covers the following topics:
![]() Cisco Unified Access Overview—This section provides a summary of the major Cisco network management platforms that can be used to manage and monitor a wireless network.
Cisco Unified Access Overview—This section provides a summary of the major Cisco network management platforms that can be used to manage and monitor a wireless network.
![]() Using Prime Infrastructure—This section discusses Cisco Prime Infrastructure and its web-based management interface. It also introduces various ways you can monitor a Cisco wireless network and users. In this section, you will learn more about spatial maps that are available in Prime Infrastructure and how they can be used to provide a graphical representation of a wireless network in a physical space.
Using Prime Infrastructure—This section discusses Cisco Prime Infrastructure and its web-based management interface. It also introduces various ways you can monitor a Cisco wireless network and users. In this section, you will learn more about spatial maps that are available in Prime Infrastructure and how they can be used to provide a graphical representation of a wireless network in a physical space.
This chapter covers the following exam topics:
![]() 4.5—Identify wireless network and client management and configuration platform options
4.5—Identify wireless network and client management and configuration platform options
![]() 4.5b—Prime infrastructure
4.5b—Prime infrastructure
![]() 4.5d—ISE
4.5d—ISE
A Cisco unified wireless network is based on an architecture of wireless LAN controllers, access points (APs), and, of course, many users. You can configure, monitor, and manage the APs through their controller, and the controller through its own management interface. As a network scales, management tasks can become tedious because you have to visit more than one controller to apply the same configuration changes or to monitor wireless events. Even further, you might have thousands of users to manage with some sort of access policies and monitor in case of problems. This chapter provides an overview of the tools and interfaces that Cisco offers that you can leverage to configure, manage, and monitor network devices and clients.
“Do I Know This Already?” Quiz
The “Do I Know This Already?” quiz allows you to assess whether you should read this entire chapter thoroughly or jump to the “Exam Preparation Tasks” section. If you are in doubt about your answers to these questions or your own assessment of your knowledge of the topics, read the entire chapter. Table 18-1 lists the major headings in this chapter and their corresponding “Do I Know This Already?” quiz questions. You can find the answers in Appendix A, “Answers to the ‘Do I Know This Already?’ Quizzes.”
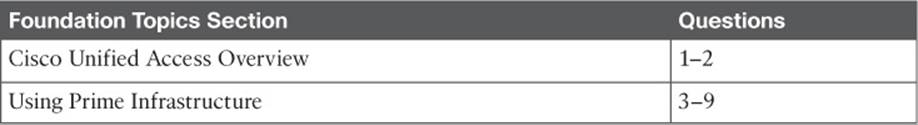
Table 18-1 “Do I Know This Already?” Section-to-Question Mapping
Caution
The goal of self-assessment is to gauge your mastery of the topics in this chapter. If you do not know the answer to a question or are only partially sure of the answer, you should mark that question as wrong for purposes of the self-assessment. Giving yourself credit for an answer you correctly guess skews your self-assessment results and might provide you with a false sense of security.
1. Which one of the following is used as the central management platform for Cisco wired and wireless networks?
a. Master Controller
b. Cisco MSE
c. Prime Infrastructure
d. Cisco ISE
2. Cisco Prime Infrastructure can be integrated with which one of the following platforms to provide location-based services for wireless clients and other devices?
a. ISE
b. LSE
c. MSE
d. WSE
3. What are three benefits of using Cisco Prime Infrastructure?
a. Wireless planning
b. Wireless management
c. Wireless troubleshooting
d. Wireless active site surveys
4. In the Alarm Summary bar at the bottom of the PI screen, what is represented by the orange triangle pointing downward?
a. Helpful cautions about RF parameters
b. Minor alarms from controllers
c. Major alarms from controllers
d. A summary of all alarm types
5. If an alarm goes unacknowledged in PI, what will happen to it?
a. Nothing; the alarm will be active forever until it is acknowledged.
b. After 15 days, the alarm will be automatically acknowledged.
c. After 1 hour, the alarm will be automatically acknowledged.
d. After 1 day, the AP that is the source of the alarm will be disabled.
6. To see a list of specific alarms and their time stamps in Cisco Prime Infrastructure, you should look in which one of the following areas?
a.Reports > Alarms
b.Dashboard > Alarm Viewer
c.Alarm Summary
d.Alarm Browser
7. The Prime Infrastructure user interface is made up of which one of the following components?
a. Servlets
b. Dashlets
c. Panes
d. Apps
8. Which one of the following PI menu selections enables you to find a list of maps?
a.Maps > Wireless Maps > Site Maps
b.Configure > Maps
c.Dashboard > Wireless > Maps
d.Monitor > Site Maps
9. PI maps are organized into which one of the following hierarchies?
a. Campus > building > floor
b. Enterprise > department > building
c. Building > floor > room
d. Domain > building > floor
Foundation Topics
Cisco Unified Access Overview
In the previous chapters of this book, you have learned about autonomous, cloud-based, and lightweight APs, as well as wireless LAN controllers and wireless controller modules. Each of these devices offers some sort of management interface that you can use for configuration, monitoring, and troubleshooting. It would be nice to have a way to manage everything, all in one place.
Now consider that your enterprise network might also be built on Cisco LAN switches, providing network connectivity for APs and wired devices. It would be even nicer to have one place to manage the wired and wireless networks. Don’t forget about all the people and devices that connect to those networks—you probably have to enforce some sort of policies on them to allow network access or access to resources on the network.
Cisco has developed a strategy that integrates all of these management functions into an overall network architecture. The Cisco Unified Access architecture consists of three main areas:
![]() One Network—A single network infrastructure that converges both wired and wireless networks together. This includes autonomous (IOS), cloud managed (Meraki), centralized (AireOS), FlexConnect (AireOS), and converged (IOS-XE) wireless designs.
One Network—A single network infrastructure that converges both wired and wireless networks together. This includes autonomous (IOS), cloud managed (Meraki), centralized (AireOS), FlexConnect (AireOS), and converged (IOS-XE) wireless designs.
![]() One Policy—All secure access control (wired, wireless, VPN) is created and managed centrally. The same policy management platform provides visibility in all connected users and devices for identity management, posture assessment, and data collection.
One Policy—All secure access control (wired, wireless, VPN) is created and managed centrally. The same policy management platform provides visibility in all connected users and devices for identity management, posture assessment, and data collection.
![]() One Management—All network devices (wireless controllers, APs, and switches) can be configured, managed, and monitored centrally. Best practices and workflow tasks can be deployed to devices.
One Management—All network devices (wireless controllers, APs, and switches) can be configured, managed, and monitored centrally. Best practices and workflow tasks can be deployed to devices.
Figure 18-1 illustrates how the three “One” areas fit into an overall network infrastructure. All of the networking devices normally found in a network diagram are part of the One Network. To effectively manage the network, the following Cisco platforms in the One Management and One Policy areas must work together:
![]() Prime Infrastructure (PI)—Serves as a “single pane of glass” for all management functions. PI offers configuration and monitoring of all wired and wireless network devices, as well as visibility into all wired and wireless clients. From PI, you can deploy features and best practices to manage devices, manage lifecycle tasks, and generate reports.
Prime Infrastructure (PI)—Serves as a “single pane of glass” for all management functions. PI offers configuration and monitoring of all wired and wireless network devices, as well as visibility into all wired and wireless clients. From PI, you can deploy features and best practices to manage devices, manage lifecycle tasks, and generate reports.
PI also maintains spatial maps that show things like AP heatmaps of buildings and areas, as well as device locations. PI can also integrate with autonomous APs and the Meraki cloud management Dashboard.
![]() Mobility Services Engine (MSE)—A platform that integrates with PI and maintains location data for location-based tracking services and interference source visualization. MSE can also integrate Cisco Connected Mobile Experiences (CMX) to deliver location-based services to customers in retail stores, hospitals, hotels, museums, and so on.
Mobility Services Engine (MSE)—A platform that integrates with PI and maintains location data for location-based tracking services and interference source visualization. MSE can also integrate Cisco Connected Mobile Experiences (CMX) to deliver location-based services to customers in retail stores, hospitals, hotels, museums, and so on.
![]()
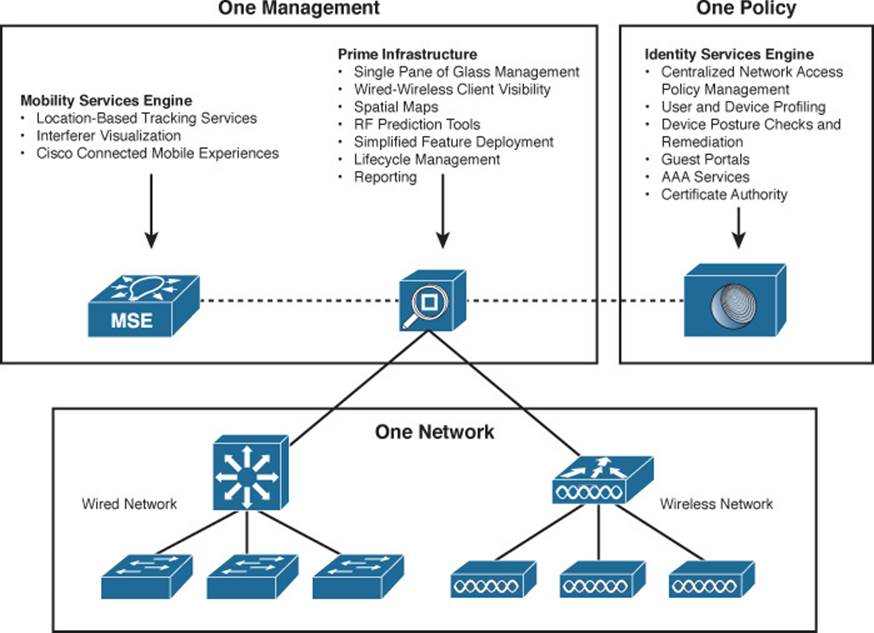
Figure 18-1 Overview of the Cisco ONE Network for Unified Access
![]() Identity Services Engine (ISE)—A central platform for managing network access policies that can be applied to wired or wireless networks and VPNs. ISE can profile users and their devices and perform posture checks and remediation according to defined policies. Guest portals can be built and customized through ISE. The same platform also offers a certificate authority and AAA services for controlling network access.
Identity Services Engine (ISE)—A central platform for managing network access policies that can be applied to wired or wireless networks and VPNs. ISE can profile users and their devices and perform posture checks and remediation according to defined policies. Guest portals can be built and customized through ISE. The same platform also offers a certificate authority and AAA services for controlling network access.
At the CCNA Wireless level, you should have a basic understanding of the components shown in Figure 18-1 and how they interact with each other. For example, you should remember from Chapter 14, “Wireless Security Fundamentals,” that some wireless security methods require a RADIUS server. You should also know that Cisco ISE can be used to provide that AAA service, as well as many other robust policies that can control network access to users. ISE plays an important role in assessing user devices to find useful information about the hardware, software, and user identity, as well as their posture in relation to enterprise requirements.
More importantly, you should have a good working knowledge of Prime Infrastructure and how you can use it for basic day-to-day monitoring and customer support. You should understand how to navigate your way through the PI management console screen and how to use PI maps to visualize conditions in the network. These topics are covered in more detail in the following sections. You should also know how to leverage PI to troubleshoot problems that are reported, as covered in Chapter 20, “Troubleshooting WLAN Connectivity.”
Using Prime Infrastructure
Cisco Prime Infrastructure is a browser-based software application that offers the capability to manage wired and wireless network deployments through a single interface. Benefits of Prime Infrastructure include the following:
![]() Using spatial maps to track devices and show their locations
Using spatial maps to track devices and show their locations
![]() Wireless planning tools for AP placement and radio frequency (RF) parameters
Wireless planning tools for AP placement and radio frequency (RF) parameters
![]() Controller and AP deployment through configuration templates
Controller and AP deployment through configuration templates
![]() Monitoring of controllers, APs, and wireless client devices
Monitoring of controllers, APs, and wireless client devices
![]() Troubleshooting through alerts, events, wireless interference analysis, and a built-in client troubleshooting tool
Troubleshooting through alerts, events, wireless interference analysis, and a built-in client troubleshooting tool
![]() Extensive set of reports that can be automated or run on demand
Extensive set of reports that can be automated or run on demand
![]() Integration with ISE for network access policy management
Integration with ISE for network access policy management
Note
Prime Infrastructure has undergone an evolution over time. You might come across the names of its earlier generations as you read and study: Cisco Wireless Control System (WCS) and Cisco Prime Network Control System (NCS). Keep in mind that the CCNA WIFUND 200-355 exam is limited to Prime Infrastructure version 2.2.
Once PI is installed and configured, you can connect to it with a secure web browser session pointed to the IP address of the PI server. Installing and initially configuring PI is beyond the scope of the CCNA Wireless exam. Enter your username and password and click the Login button, as shown in Figure 18-2.
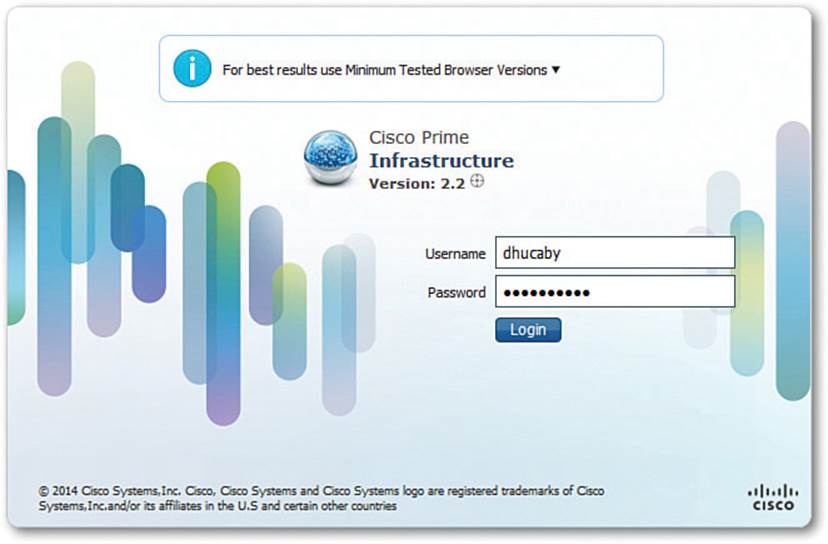
Figure 18-2 PI Login Screen
Once you log in to PI, you see a home page like the one shown in Figure 18-3.
![]()
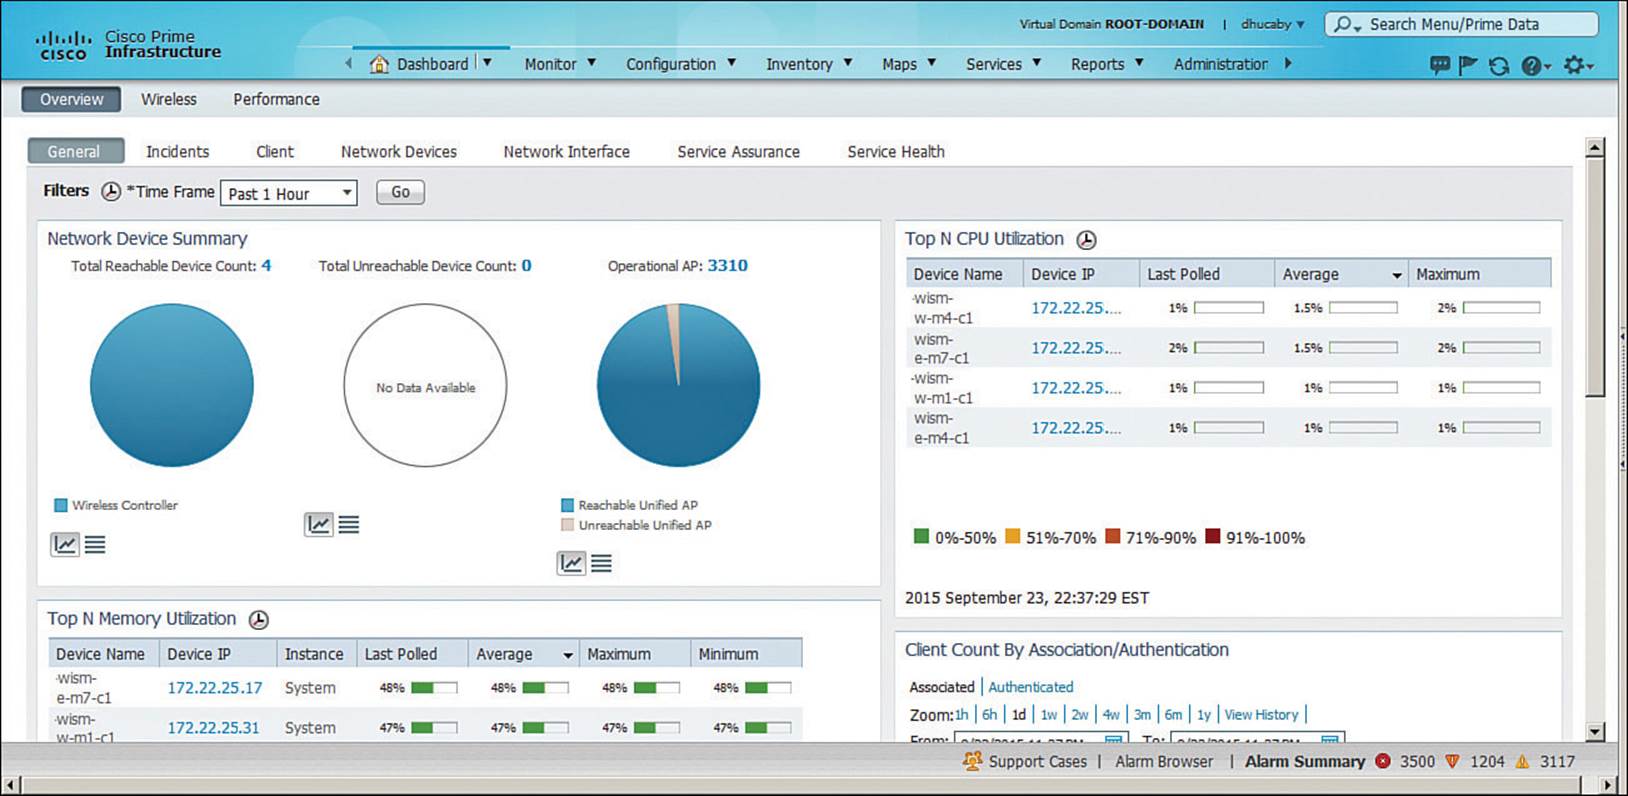
Figure 18-3 Prime Infrastructure Home Page Layout
The home page is organized into several sections or areas. The Task Area is a row of drop-down menus organized into lifecycle tasks, as listed in Table 18-2.
![]()
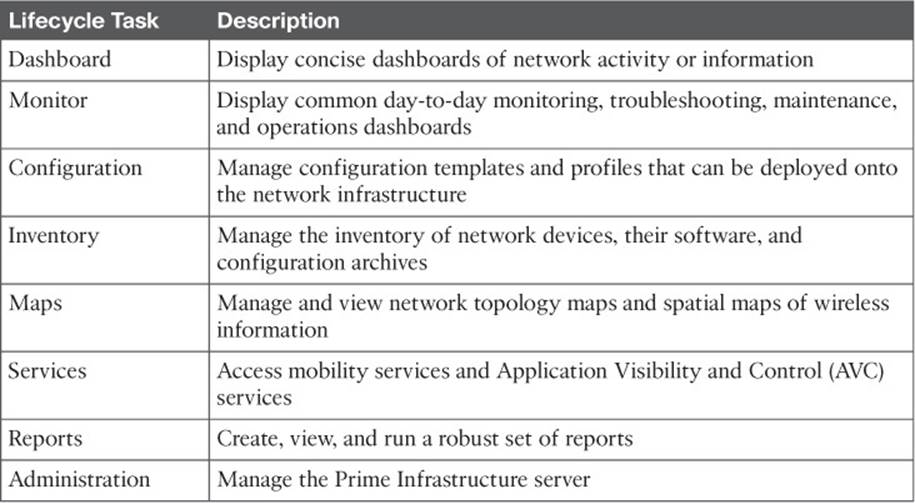
Table 18-2 Menus Displayed in the Main PI Task Area
When you hover the cursor over one of the task menus, PI displays categories and lists of specific parameters that relate to the task. For example, as Figure 18-4 illustrates, hovering over the Monitor task displays a menu of all the resources that you can monitor, organized into three columns.
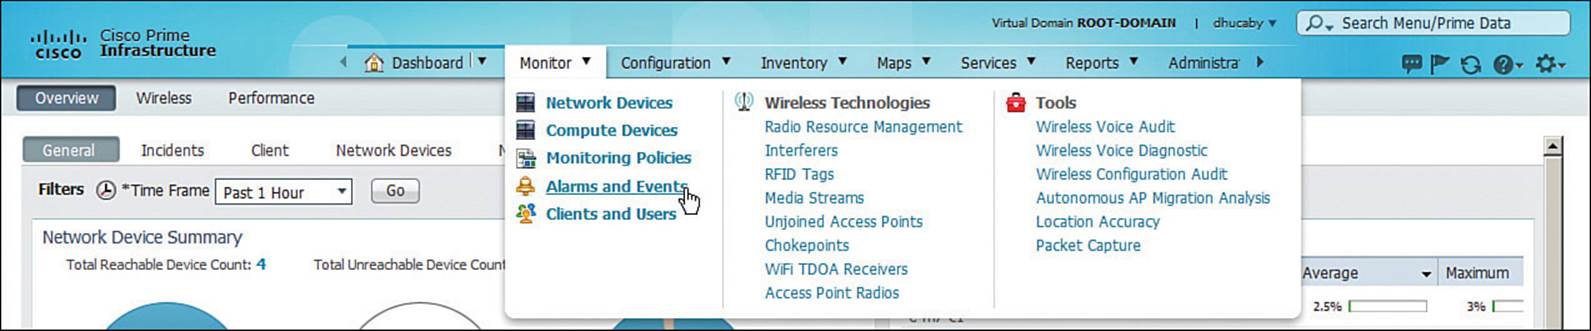
Figure 18-4 Prime Infrastructure Task Area Menu
When you select a menu item, the rest of the screen is updated with relevant information. Most screens are made up of individual “dashlets,” or small parts of a dashboard display. You can customize how each dashlet is displayed by hovering the cursor over the dashlet’s upper-right corner.Figure 18-5 shows the dashlet controls that appear. Selecting the pencil icon lets you change the dashlet title and refresh interval. The question mark displays a brief description of the dashlet. You can also manually refresh the dashlet contents, maximize its size, collapse it out of view, or delete it from the dashboard completely.
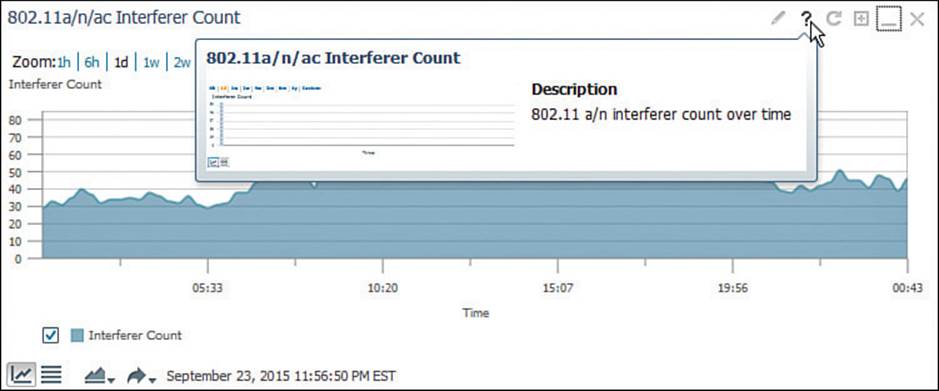
Figure 18-5 Using the Dashlet Controls
You can also add new dashlets to the dashboard. Begin by selecting the gear icon in the upper-right corner of the main PI screen, then select Add Dashlet(s) as shown in Figure 18-6. Click the Add link beside the desired dashlet.
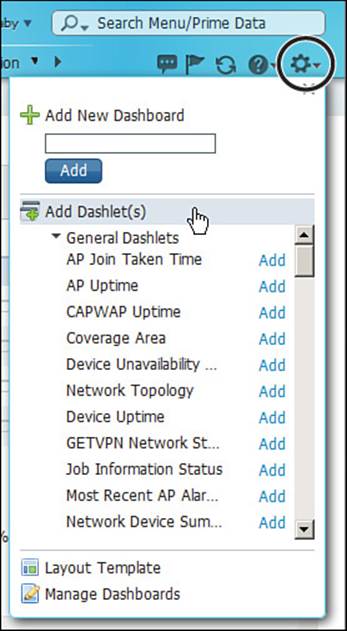
Figure 18-6 Adding New Dashlets to the PI Dashboard
Tip
You can return to the PI home page at any time by clicking the small house-shaped icon located next to the Dashboard menu in the Task Area.
The main PI screen also provides visibility into alarms that are occurring on the network. As you use PI on a day-to-day basis, you should know how to view alarm information and how to deal with it. These topics are discussed in the following section.
Alarms in the Dashboard
As PI receives alarms from controllers and other wireless management devices, it categorizes them by severity level and displays an Alarm Summary count in a narrow bar across the bottom of the screen. There are three severity levels, as follows:
![]() Critical—Denoted by a red circle containing a ×
Critical—Denoted by a red circle containing a ×
![]() Major—Denoted by an orange downward-pointing triangular arrow
Major—Denoted by an orange downward-pointing triangular arrow
![]() Minor—Denoted by a yellow upward-pointing triangular arrow
Minor—Denoted by a yellow upward-pointing triangular arrow
In Figure 18-7, the alarm bar indicates that there are 3558 critical alarms, 1204 major alarms, and 3311 minor alarms. Hovering the cursor over the Alarm Summary area brings up the Alarm Summary window, which lists a more detailed alarm breakdown by severity.
![]()
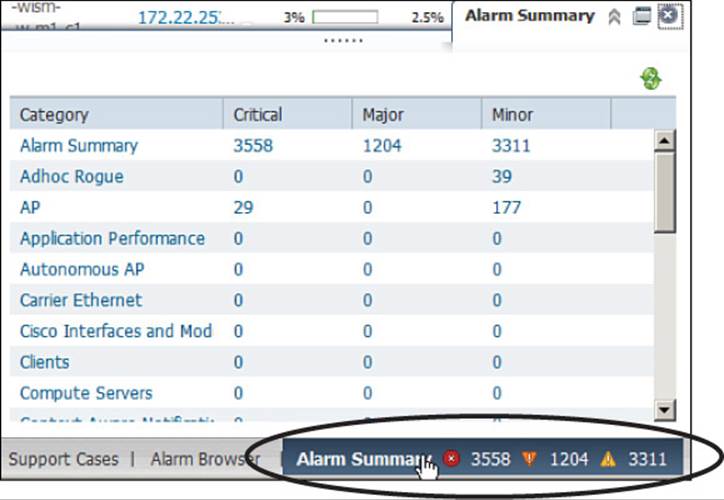
Figure 18-7 Displaying the Alarm Summary
To see a list of the current alarms, you can hover over or click the Alarm Browser in the alarm bar. The Alarm Browser will expand to show a list of alarms and their severity, status, source of the failure, time stamp, category, and condition. You can access this same Alarm Browser by selecting Monitor > Alarms and Events from the main PI navigation menu (as previously shown in Figure 18-4).
The Alarm Browser allows you to see alarms and their status at a glance, as shown in Figure 18-8. You can click the small right-pointing triangle at the left end of an alarm to view more details about it. PI will remember each alarm it receives for a default period of 15 days or until someone takes some action on it. Notice that each alarm has a check box in the far-left column. You can check the box next to one or more alarms and then use the Change Status, Assign, or Annotation menus, or the Delete button to select an action to take. Table 18-3 lists the menus and possible actions you can take on alarms. Figure 18-9 shows an example where Change Status has been selected so that the alarm could be acknowledged.
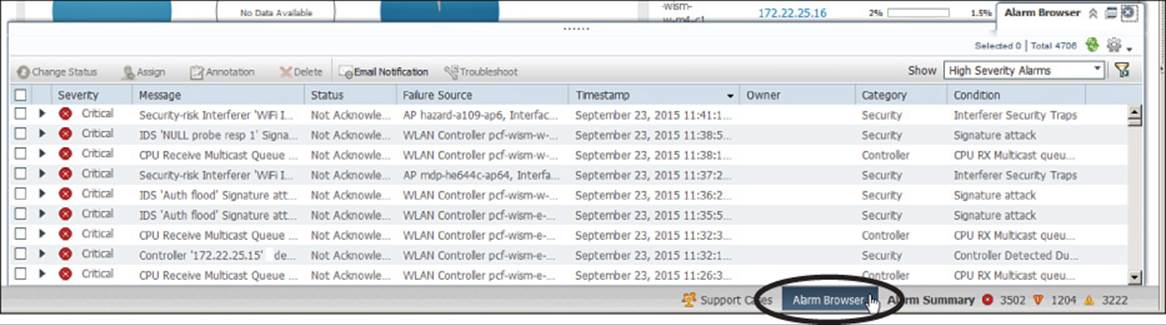
Figure 18-8 Managing Alarms in Prime Infrastructure
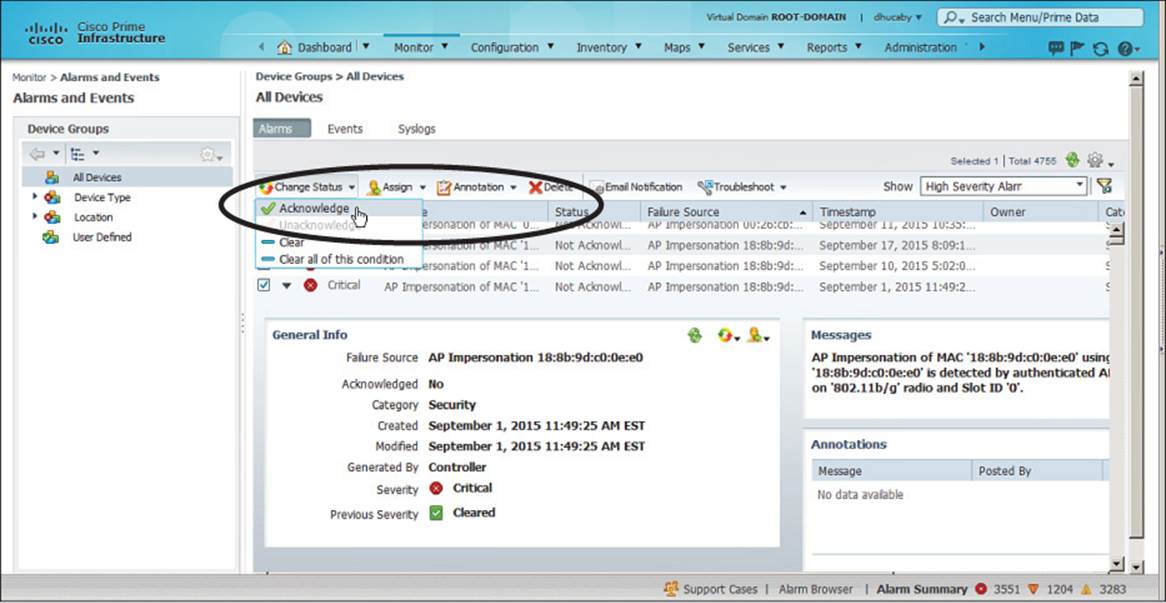
Figure 18-9 Changing the Alarm State to Acknowledge
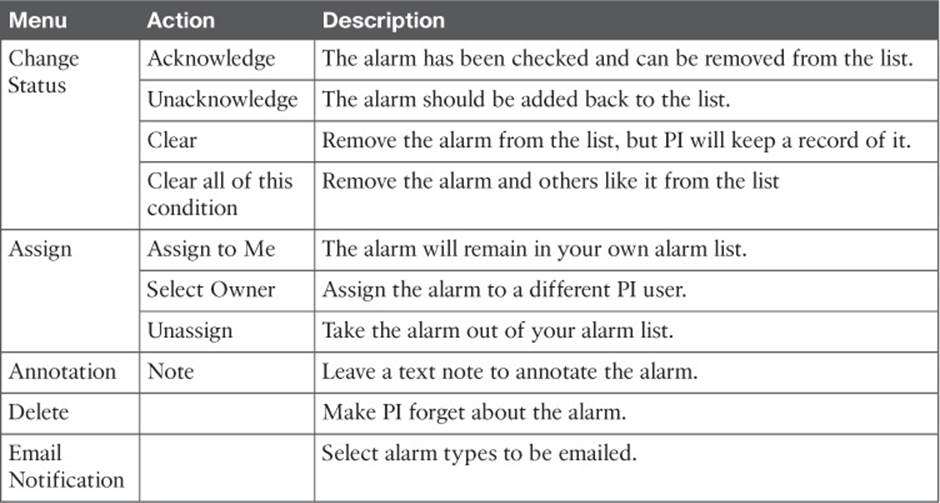
Table 18-3 Alarm Actions
Monitoring a Wireless Network with Prime Infrastructure
Aside from dealing with alarms as they arrive, there are many other aspects of a wireless network that you can monitor with Prime Infrastructure. For example, you might need to know the number of APs and wireless clients that are live on the network. The number of APs can be an important factor in a department’s budget, plans for future network growth, for sizing wireless controller platforms, and for gauging the AP load across your controllers. You can do that through two dashlets that are displayed on the Dashboard > Overview > General menu, as shown inFigure 18-10.
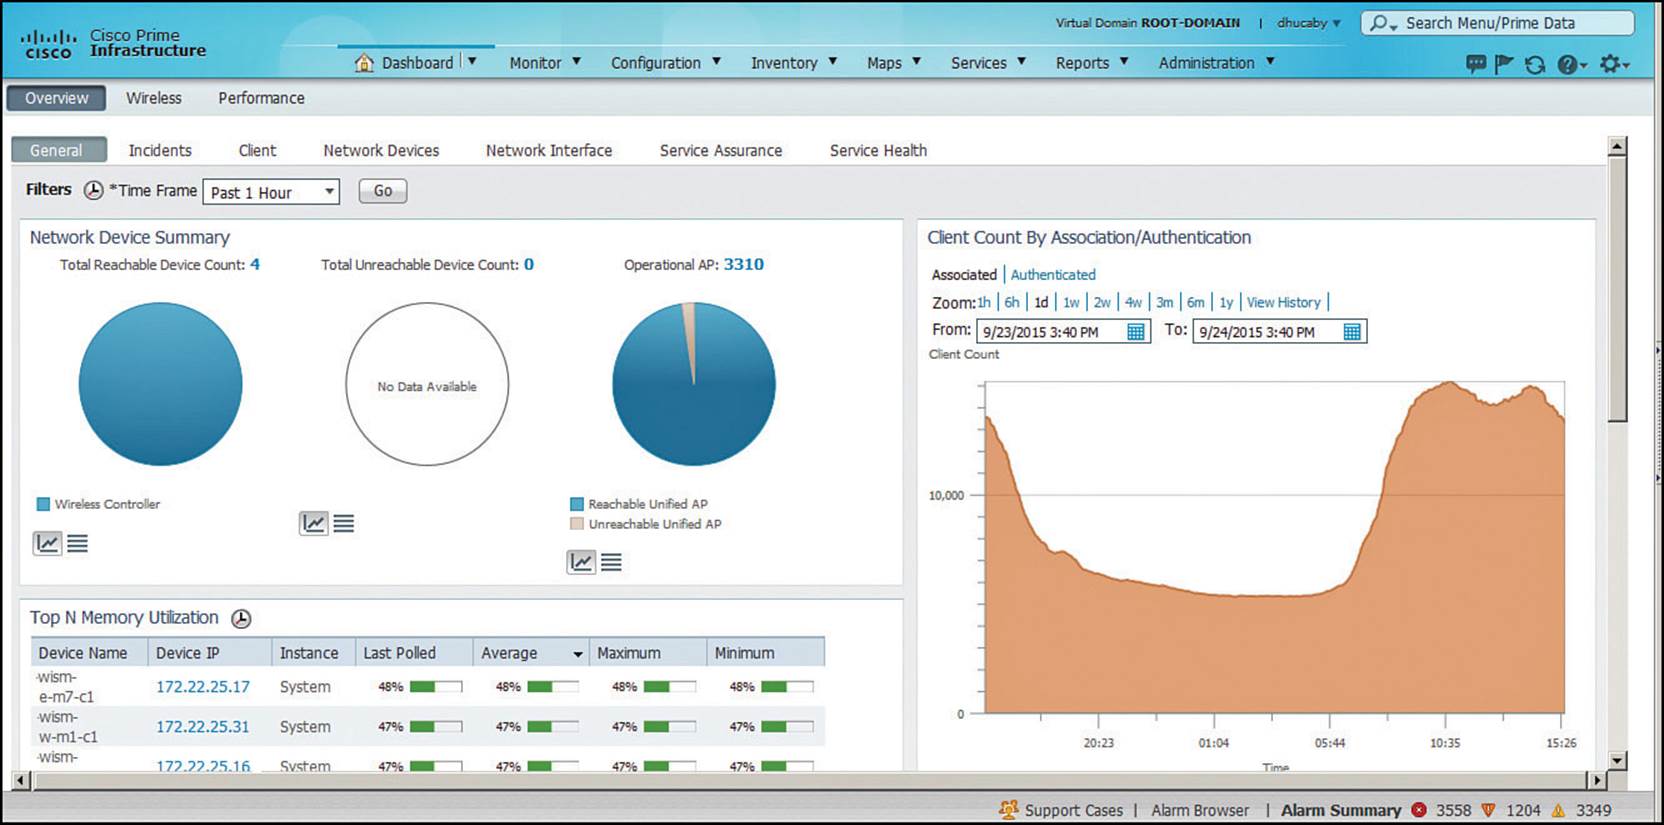
Figure 18-10 Monitoring Wireless AP and Client Counts
Table 18-4 lists some other common statistics and alarms that you should watch on a day-to-day basis, along with the menu locations where you can find them.
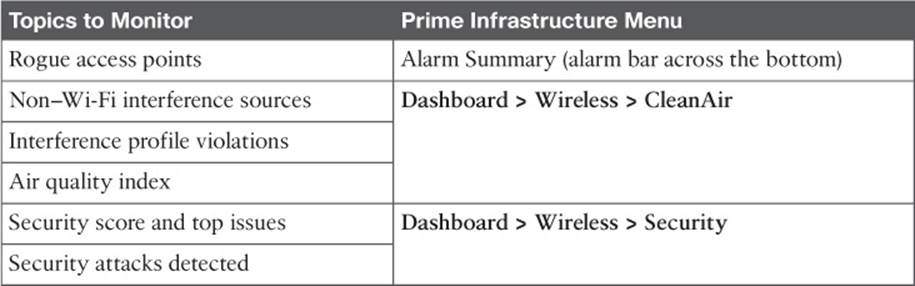
Table 18-4 Common Monitoring Tasks and the Their PI Menu Locations
Using Prime Infrastructure Maps
As you work with wireless controllers and APs, you might find yourself getting lost in the names and numbers without having a visual concept of things like AP location and RF coverage in an area. Fortunately, PI can help! PI can provide a graphical representation of a wireless network, complete with maps, physical locations, predictive RF coverage, and interactive data displays. In other words, PI will help you see your wireless network as it really is—APs and clients, along with sources of interference and rogue devices, distributed throughout a building or outdoor area.
PI can use an image file (PNG, JPG, or GIF format) as the background behind objects and data that it displays. For example, you can upload the floor plan of a building into PI and have the APs and clients that are located on that floor shown in relation to their actual locations.
PI maps are organized in a tree-like structure. A campus contains one or more buildings or outdoor areas. Each building can contain one or more floor maps. By default, maps are placed into a system campus. You can define your own campuses and your own buildings as you add maps into PI.
Tip
The CCNA Wireless exam blueprint focuses on using a PI server that is already configured and ready to use. You should not have to worry about how to create and organize the maps or add APs to them—just have a basic knowledge of how to display various wireless data.
You can access the PI maps by selecting Maps > Wireless Maps > Site Maps. The list in the far-left column contains the map tree structure; the rest of the page contains a single flat list of every campus, building, and floor map. If you click a building name in the tree list, then the rest of the page will contain thumbnail maps of each floor along with the number of APs and radios, as shown in Figure 18-11.
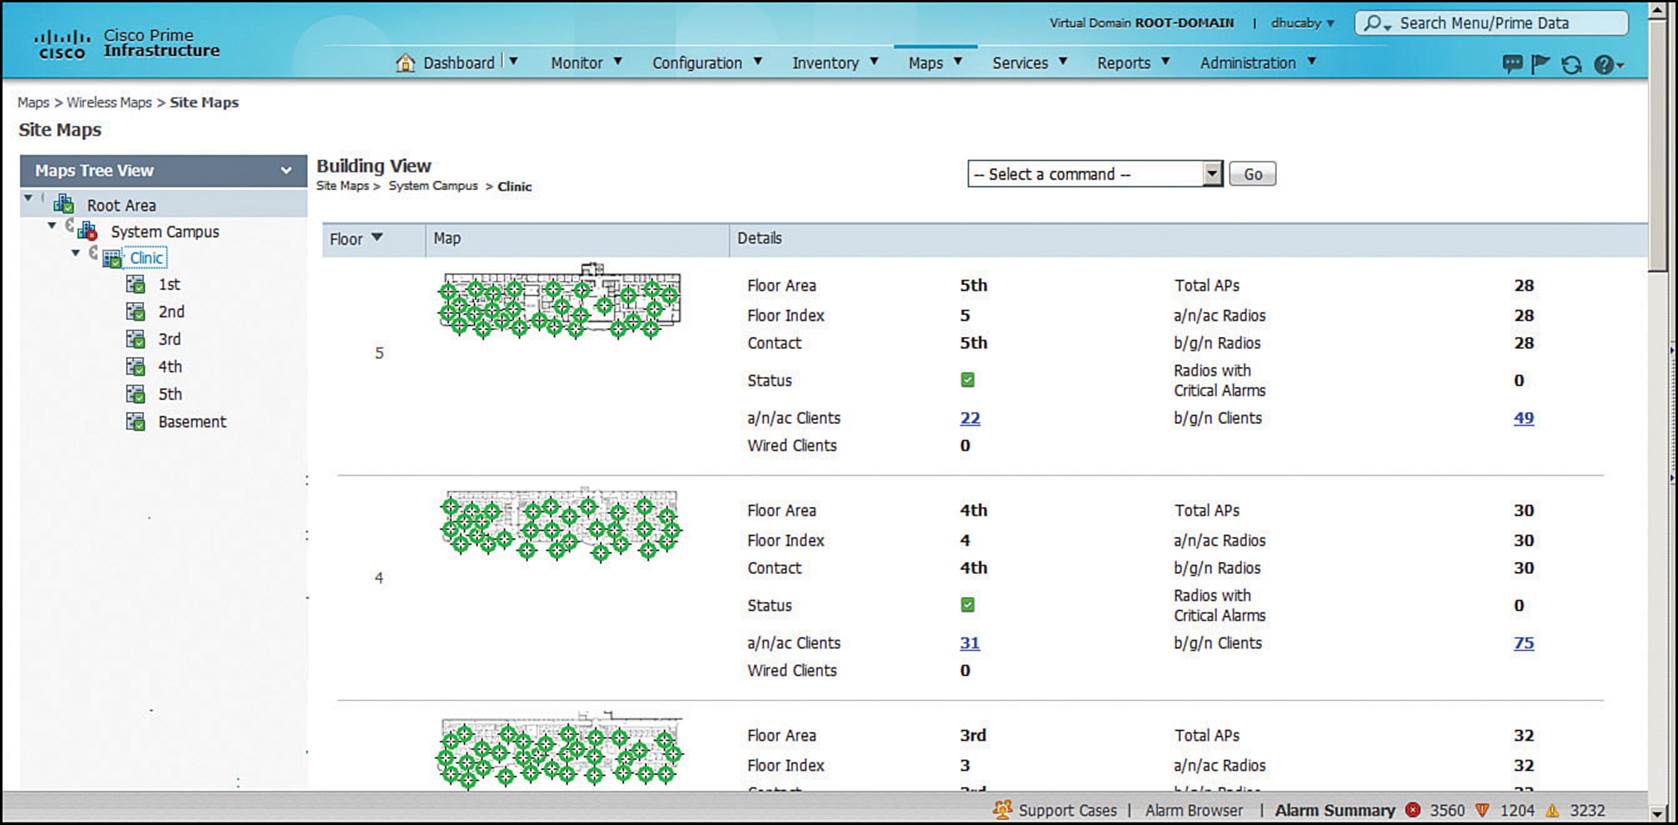
Figure 18-11 Example of PI Building Maps
You can click a map name or a thumbnail image in the list to display it, as shown in Figure 18-12. The map consists of the background image, usually a building floor plan or a drawing of an outdoor area, overlaid with AP icons and data. For example, the AP icons in the figure are shown in their current locations with labels that display the AP names.
![]()
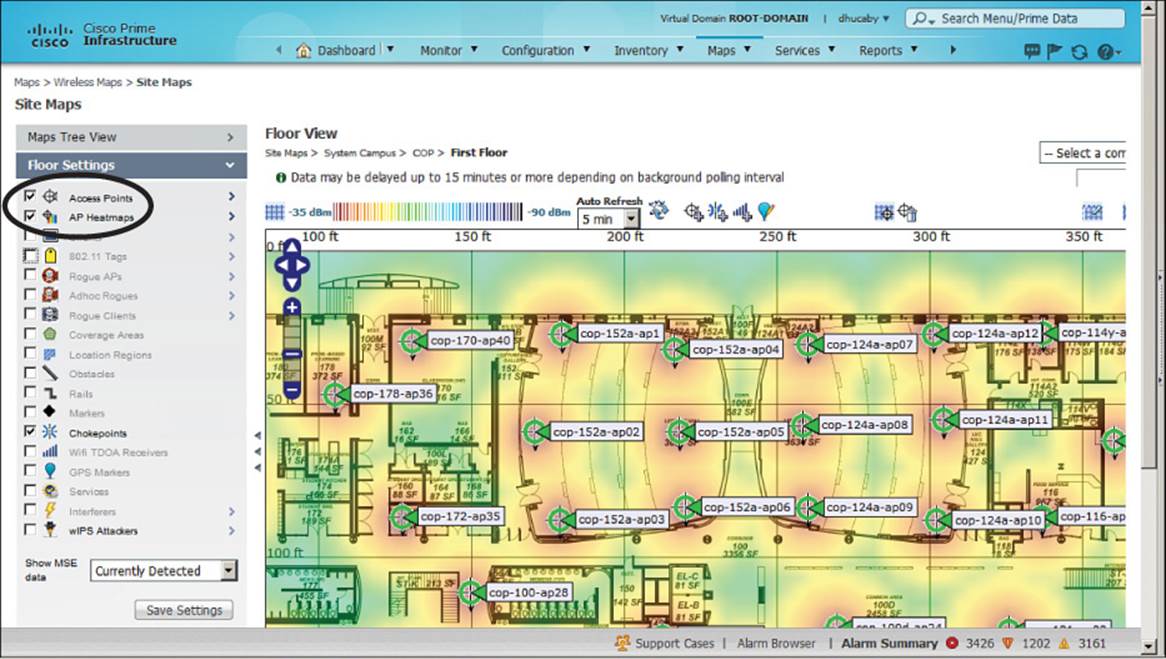
Figure 18-12 PI Map Showing AP Locations
A map can display a variety of things, depending on what you have selected in the list of Floor Settings that is displayed on the left side of the map. Figure 18-13 shows the Floor Settings list, along with other settings that are specific to a displayed object type. In this example, access points, AP heatmaps, clients, 802.11 Tags (devices attached to assets for tracking purposes), and chokepoints have been selected for display. When access points are selected, you can choose what information to show in each AP label on the map by selecting a parameter in the Display drop-down menu, as shown on the right in Figure 18-13. For instance, AP names are displayed by default, but you can choose things like channel numbers, transmit power levels, AP MAC addresses, controller IP address where the AP is joined, channel utilization, air quality, the number of associated clients, and so on.
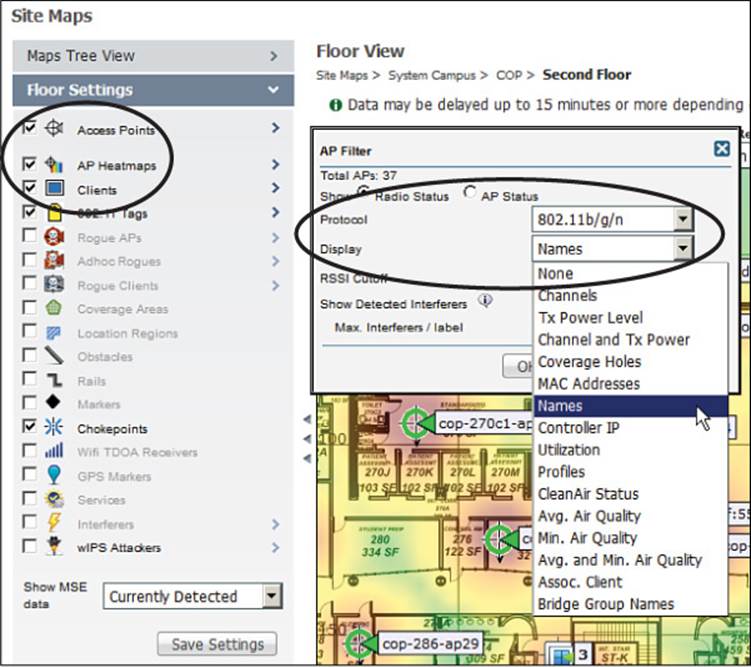
Figure 18-13 Selecting the Devices and Labels to Display on a Map
Table 18-5 lists the possible display choices under Floor Settings. A map can get quite busy with icons and labels, so you might want to check the boxes next to only a few things of interest.
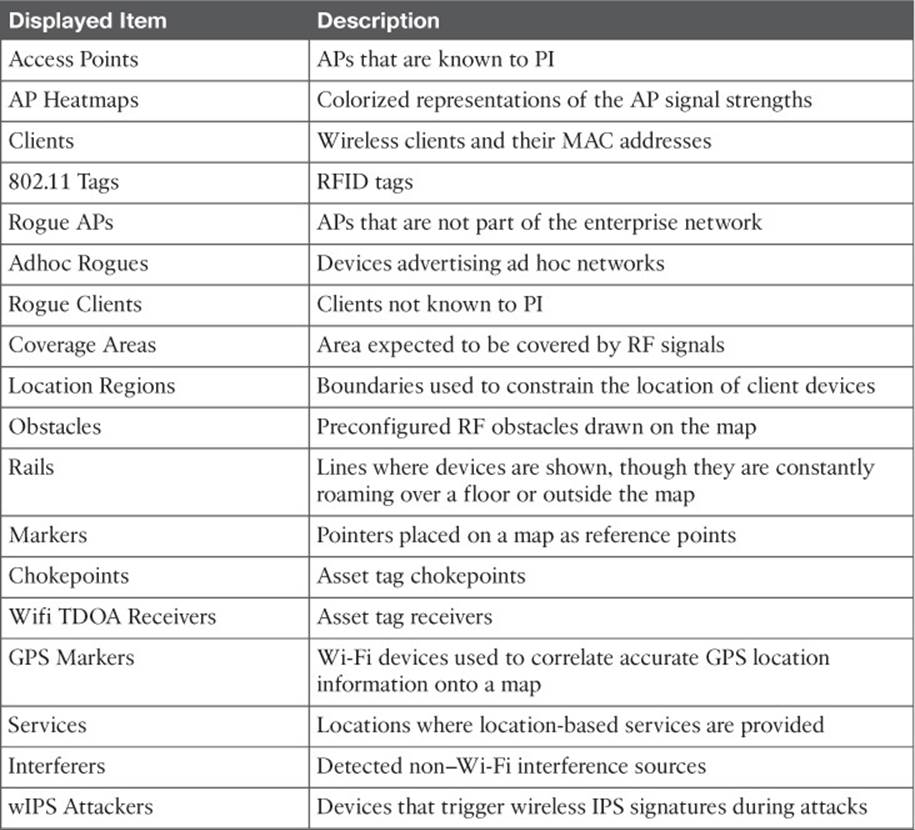
Table 18-5 PI Map Display Settings
By default, a map is shown with dynamic information. PI computes the RF signal strength for each AP and displays the results as a colored heatmap. The colors represent the signal strength that might be received in each location on the map. The color scale is shown above the heatmap. Red represents a strong signal (–35 dBm), progressing through orange, yellow, green, and then blues and purples at the weak end of the scale (–90 dBm). The red color does not mean that being close to the AP is bad; it just represents the “heat” of the signal, or how strong it is in relation to orange, yellow, green, blue, and so on.
You can also control which APs contribute to the heatmap computation. For example, you might want to see what would happen if you were to remove an AP or two. Click the right-pointing arrow next to AP Heatmaps to display a list of contributing APs that are located on the map. Then select or deselect specific APs and observe the effect on the heatmap.
The heatmap that PI computes is based on many of the RF principles you learned about in Chapter 3, “RF Signals in the Real World.” Based on each map location, PI can compute the free-space loss based on the distance from each of the APs. What about things like absorption, where the walls of a building attenuate or reduce RF signal strength? At a minimum, a PI map contains only the AP icons positioned over a floor plan background image. You might be able to see objects such as walls, doors, and elevators on the map, but PI is not able to interpret the drawing at all. Instead, if you want to know about obstacles and compute their influence, you can edit the map to define the physical objects and their dBm attenuation values. The more information that is put into a map, the more accurate PI can be when it produces the RF heatmap.
PI also updates the AP icons based on current conditions. A green icon represents an AP radio that is working properly, with no faults or alarms. A yellow icon represents an AP radio with a minor alarm, while a red icon indicates an AP radio with a major alarm. By default, PI updates a map every 5 minutes.
While a map is displayed, you can click an icon to display more information about it. For example, Figure 18-14 shows a small window that popped up to display information about the AP named cop-250-ap21. From this window, you can find the AP’s MAC address, model number, and the IP address of the controller it has joined. You can select the 802.11a/n/ac or 802.11b/g/n tab to display information about that specific radio, including channel number and transmit power level.
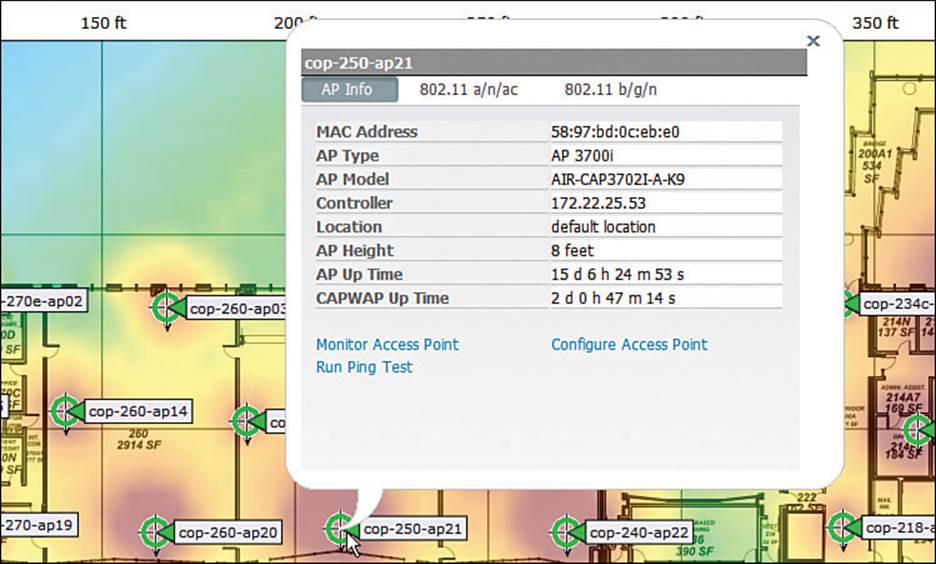
Figure 18-14 Displaying Information About an AP on a Map
Likewise, you can check the box next to Clients to display any clients that are located within the area of the map. Client locations are determined by triangulating their signals as received from nearby APs. Clients can be shown with a MAC address, IP address, username, or an asset label.Figure 18-15 shows an example floor map with clients and APs displayed. Sometimes more than one client will be located in the same place. Rather than try to display multiple MAC address labels cluttered together, multiple clients are shown with a label that indicates the number of clients there. The client icon also gets larger as the number of clients increases. In Figure 18-15, you can see icons where 3, 4, 5, 6, 11, 24, 26, and even 65 clients are located! You can click any client icon to see more-detailed information.
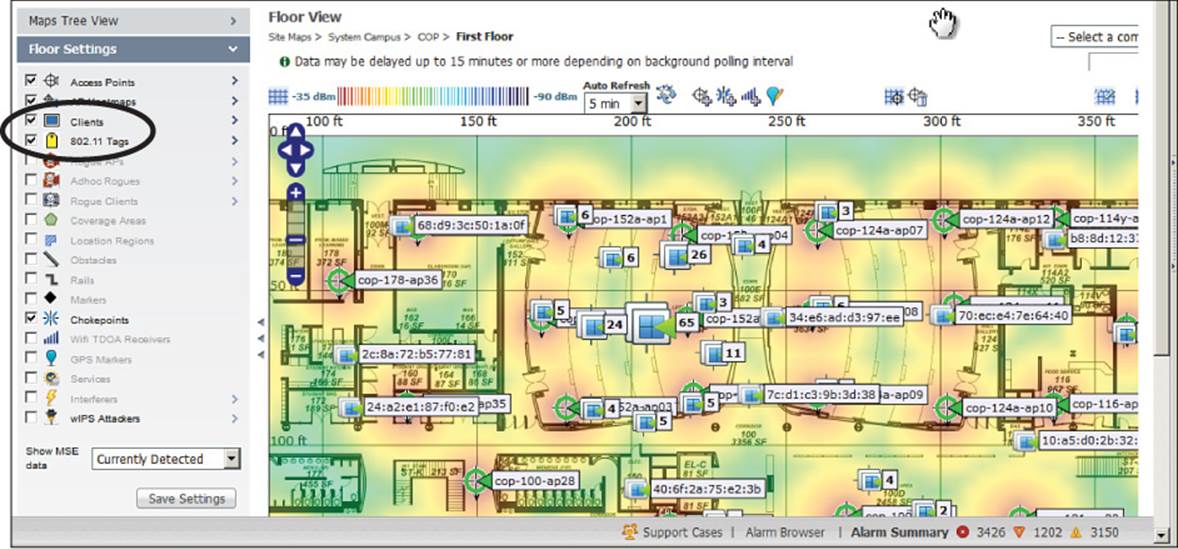
Figure 18-15 Displaying Wireless Client Locations on a Map
PI is also quite adept at displaying sources of interference on maps. You can select the Interferers check box to show interferers in the locations that PI has determined based on CleanAir information gathered from the controllers in the network. Interferer locations are marked with a yellow lightning-bolt icon, along with a label that identifies the type of interference. You can also view an estimated area that an interferer is impacting by opening the Interferers options and checking the Show Zone of Impact check box. In Figure 18-16, several Bluetooth Link interferers are displayed in their locations. The zones of impact are shown as colored circles. Notice how the Bluetooth Link circles are rather small, while the microwave oven in the upper-left corner is affecting quite a large area of the wireless network.
![]()
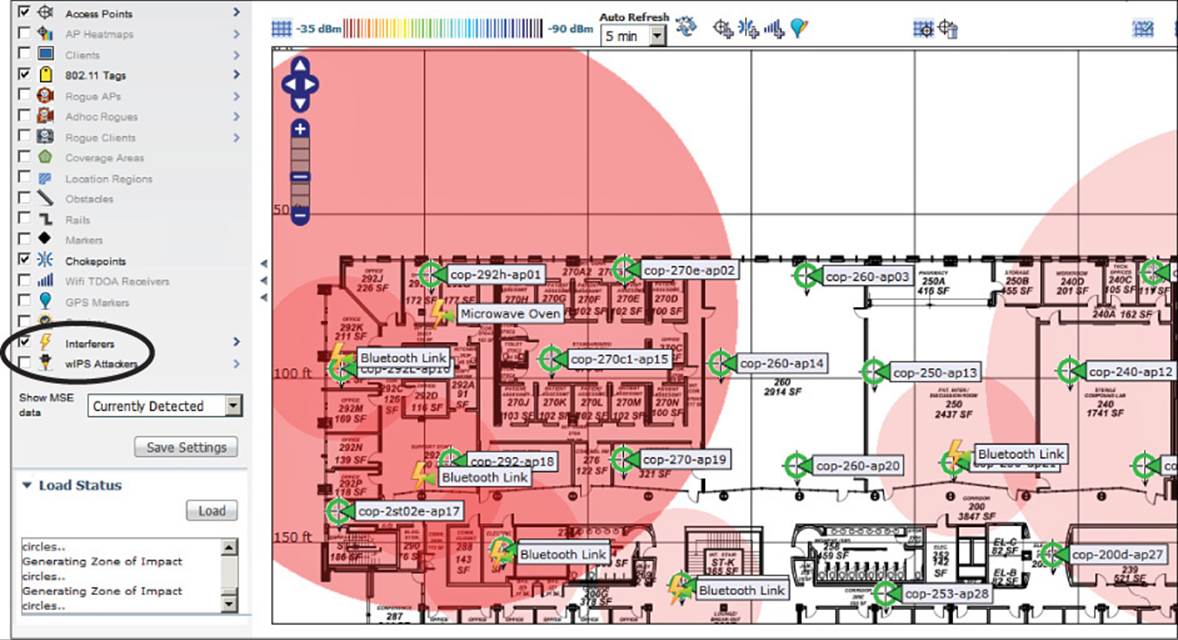
Figure 18-16 Displaying Sources of Interference on a Map
Finally, you will likely want to know where rogue APs and rogue clients are located when they come within range of your network. If you select Rogue APs, Rogue Clients, and Adhoc Rogues, those devices will be displayed with icons depicting a red circle with a skull, a gray circle with skull and crossbones, and red squares with skull and crossbones, respectively. In Figure 18-17, you can see several types of devices on the map. The AP locations are not shown, while client locations are. You can see two Bluetooth Link interferers, along with a WiMAX Fixed station that is affecting a large area. There are also several rogue APs located toward the bottom of the map.
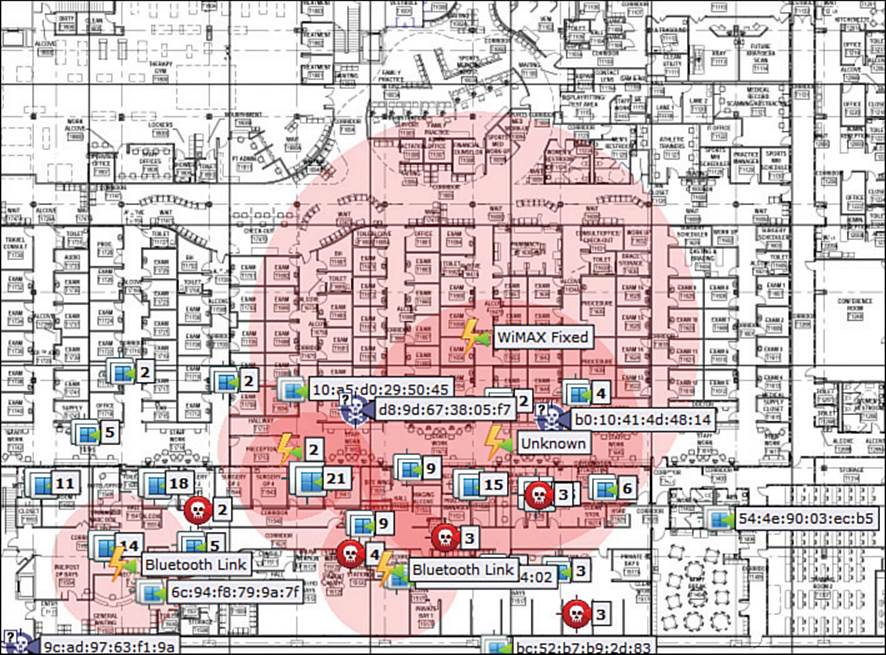
Figure 18-17 Displaying Wireless Client Locations on a Map to Detect Rogue Devices
Configuring Devices with PI
Prime Infrastructure can be used for more than monitoring a wireless network. It can also be used to configure controllers, lightweight APs, and autonomous APs through configuration templates. You can select the Configuration menu in the navigation bar to choose a template type, as shown in Figure 18-18. Select Controller Configuration Groups, Lightweight Access Points, or Autonomous Access Points to define new templates. Templates can be applied to devices by selecting Scheduled Configuration Task.
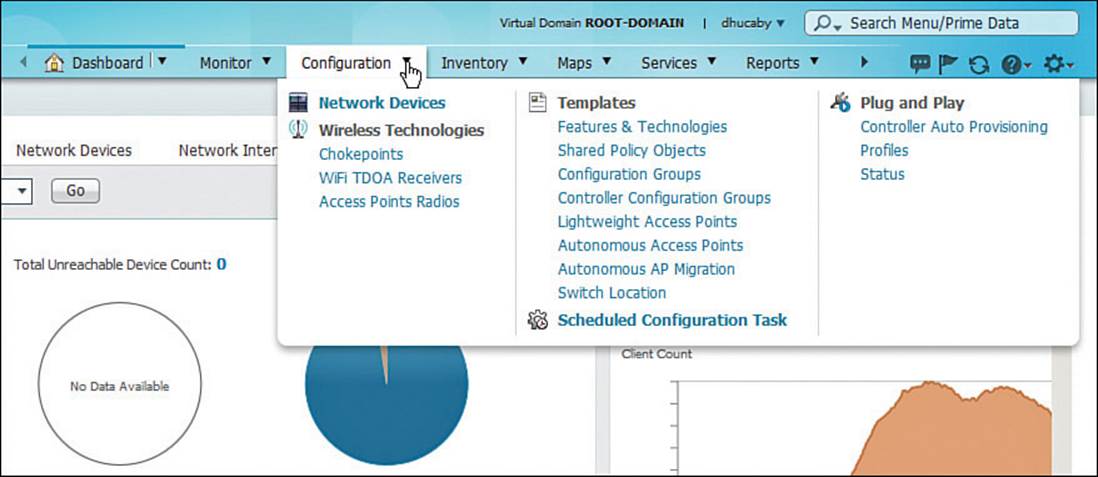
Figure 18-18 Using PI to Configure Wireless Network Devices
Exam Preparation Tasks
As mentioned in the section, “How to Use This Book,” in the Introduction, you have a couple of choices for exam preparation: the exercises here, Chapter 21, “Final Review,” and the exam simulation questions on the DVD.
Review All Key Topics
Review the most important topics in this chapter, noted with the Key Topic icon in the outer margin of the page. Table 18-6 lists a reference of these key topics and the page numbers on which each is found.
![]()
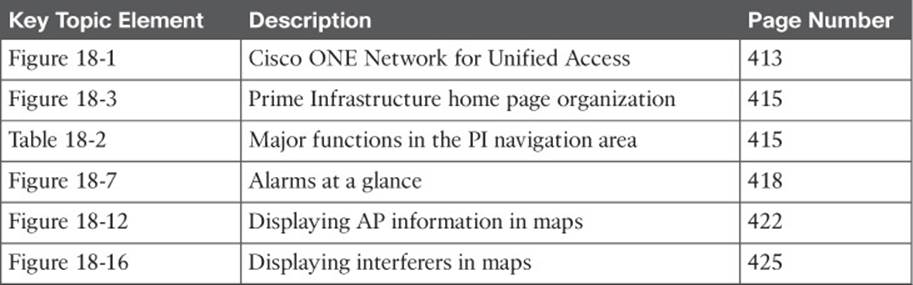
Table 18-6 Key Topics for Chapter 18
All materials on the site are licensed Creative Commons Attribution-Sharealike 3.0 Unported CC BY-SA 3.0 & GNU Free Documentation License (GFDL)
If you are the copyright holder of any material contained on our site and intend to remove it, please contact our site administrator for approval.
© 2016-2026 All site design rights belong to S.Y.A.