CCNA Wireless 200-355 Official Cert Guide (2016)
Chapter 19. Dealing with Wireless Interference
This chapter covers the following topics:
![]() Understanding Types of Interference—This section describes common technologies and devices that can cause wireless interference.
Understanding Types of Interference—This section describes common technologies and devices that can cause wireless interference.
![]() Using Tools to Detect and Manage Interference—This section covers CleanAir operation and explains how you can configure it to deal with interference automatically and efficiently.
Using Tools to Detect and Manage Interference—This section covers CleanAir operation and explains how you can configure it to deal with interference automatically and efficiently.
This chapter covers the following exam topics:
![]() 1.2—Interpret RF signal measurements
1.2—Interpret RF signal measurements
![]() 1.2b—Differentiate interference vs. noise
1.2b—Differentiate interference vs. noise
![]() 6.4—Employ appropriate controller tools to assist troubleshooting
6.4—Employ appropriate controller tools to assist troubleshooting
![]() 6.4c—Monitor pages
6.4c—Monitor pages
![]() 6.4c(i)—CleanAir (controller GUI)
6.4c(i)—CleanAir (controller GUI)
![]() 7.3—Identify proper application of site survey tools
7.3—Identify proper application of site survey tools
![]() 7.3a—Spectrum analyzer
7.3a—Spectrum analyzer
With careful design and planning, 802.11 devices can operate as a fully functional wireless network. However, many readily available products do not use the 802.11 standard. When 802.11 and non-802.11 devices come together, the two can interfere with each other. Wireless interference can make WLAN performance sluggish or completely unusable. This chapter covers some common types of devices that can cause interference and the Cisco CleanAir features that can detect and react to the interference sources.
“Do I Know This Already?” Quiz
The “Do I Know This Already?” quiz allows you to assess whether you should read this entire chapter thoroughly or jump to the “Exam Preparation Tasks” section. If you are in doubt about your answers to these questions or your own assessment of your knowledge of the topics, read the entire chapter. Table 19-1 lists the major headings in this chapter and their corresponding “Do I Know This Already?” quiz questions. You can find the answers in Appendix A, “Answers to the ‘Do I Know This Already?’ Quizzes.”
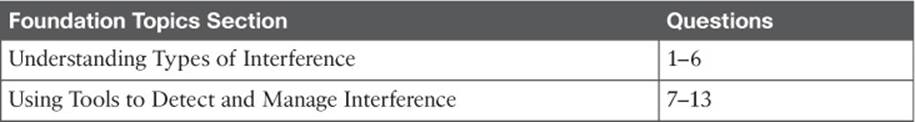
Table 19-1 “Do I Know This Already?” Section-to-Question Mapping
Caution
The goal of self-assessment is to gauge your mastery of the topics in this chapter. If you do not know the answer to a question or are only partially sure of the answer, you should mark that question as wrong for purposes of the self-assessment. Giving yourself credit for an answer you correctly guess skews your self-assessment results and might provide you with a false sense of security.
1. DECT cordless phone devices in the United States use which one of the following designations to differentiate from European DECT devices?
a. DECT 1.0
b. DECT 2.4
c. DECT 5.8
d. DECT 6.0
2. Bluetooth is designed to cover which one of the following areas?
a. Metropolitan
b. Personal area
c. Wide area
d. Local area
3. Bluetooth operates in which one of the following frequency bands?
a. 900 MHz
b. 2.4 GHz
c. 5 GHz
d. 11 GHz
4. ZigBee is used for which two of the following common applications?
a. Building automation
b. GPS location
c. Energy management
d. RFID device location
5. ZigBee belongs to which one of the following families of standards?
a. IEEE 802.11
b. IEEE 802.3
c. IEEE 802.15.4
d. IEEE 802.16
6. The IEEE 802.16 standard defines which one of the following technologies?
a. Token Ring
b. ZigBee
c. Bluetooth
d. WiMAX
7. Suppose you decide to perform spectrum analysis in an area of your network where problems have been reported. Which one of the following tools could you use to connect with a Cisco Aironet 3700 AP to collect and display live spectrum data?
a. Cisco Meraki Dashboard
b. Cisco Mobility Services Engine
c. MetaGeek Chanalyzer
d. Wireless LAN controller
8. A spectrum analyzer should be used to perform which one of the following tasks?
a. Investigate wireless interference
b. Investigate client roaming problems
c. Measure wireless throughput
d. Perform a wireless site survey
9. CleanAir adds which one of the following capabilities to a Cisco lightweight AP?
a. Wireless mesh
b. Rogue filtration
c. Spectral multiplexing
d. Spectrum analysis
10. Cisco CleanAir analyzes which one of the following types of RF signals?
a. Non-802.11
b. 802.3
c. RRM
d. CAPWAP
11. By default, is Cisco CleanAir enabled or disabled on a controller?
a. Enabled
b. Disabled
12. Suppose that an AP has detected an interference source and reported it with RSSI –58, duty cycle 1 percent, and severity 4. Which one of the following statements is most correct?
a. The interfering source is very severe.
b. The interfering source is constantly transmitting.
c. The interfering source is too weak to be detected.
d. The interfering source is not severe.
13. When an interference source is detected and classified, the controller assigns which one of the following to uniquely identify the same source across several reporting APs?
a. BSSID
b. Cluster ID
c. ISSID
d. Actual MAC address
Foundation Topics
Understanding Types of Interference
Recall from Chapter 3, “RF Signals in the Real World,” that APs can interfere with each other. If two APs are configured to use the same channel and are in close proximity to each other, co-channel interference results. If the APs are set to use adjacent or overlapping channels, adjacent channel interference occurs.
While those types of interference can certainly be destructive, they involve devices that are based on the 802.11 standard. For example, each access point (AP) transmits on a specific channel (possibly the wrong one!), uses a standardized channel width, and always transmits frames in the 802.11 format. As well, each AP should also follow the 802.11 rules for clear channel assessment (CCA) to maintain some etiquette to share the airtime.
Rogue APs can be a significant and pesky source of interference because they usually belong to someone else. In other words, someone outside your organization is free to bring up their own APs on channels of their choosing. As long as signals from their APs can be received within your own AP cells, you might have to deal with the interference. To mitigate the problem, you must do one of the following:
![]() Find the rogue AP and its owner, and then convince the owner to remove the AP or change its channel.
Find the rogue AP and its owner, and then convince the owner to remove the AP or change its channel.
![]() Move your own AP to a different channel, which may cause other nearby APs to be moved too.
Move your own AP to a different channel, which may cause other nearby APs to be moved too.
When 802.11 devices interfere with each other, the result is usually poor performance due to frame retransmissions, errors, and the lack of available airtime. In other words, the 802.11 data can still be detected but not always correctly received. In contrast, non-802.11 devices do not have to obey any of the familiar 802.11 rules. When a non-802.11 device transmits, the result is completely incompatible with 802.11. APs and 802.11 clients will view the signal as unintelligible and regard it as noise.
The following sections provide an overview of some common non-802.11 devices that can interfere with a WLAN. As you work through this chapter, keep the following two terms in mind:
![]()
![]() Interference—802.11 signals that come from sources other than expected APs
Interference—802.11 signals that come from sources other than expected APs
![]() Noise—Signals or radio frequency (RF) energy that reduces the signal-to-noise ratio (SNR) and disrupts transmission or reception of an 802.11 signal
Noise—Signals or radio frequency (RF) energy that reduces the signal-to-noise ratio (SNR) and disrupts transmission or reception of an 802.11 signal
Bluetooth
Bluetooth is a technology used to form a personal-area network (PAN), in an effort to unify telephony and computing devices. Today, Bluetooth can be found integrated into cell phones, tablets, laptops, desktops, printers, headsets, cameras, and video game consoles. Bluetooth has low power consumption, making it a good choice for mobile, battery-powered devices.
Bluetooth began as Versions 1.0 and 1.0b, developed by the Bluetooth Special Interest Group (SIG). For a time, several Bluetooth versions were incorporated into the IEEE 802.15.1 standard, but that standard is no longer maintained. The Bluetooth SIG continued to develop its own standard, currently published as core Version 4.
Tip
You can find the Bluetooth SIG at http://www.bluetooth.org.
Bluetooth devices are grouped into three classes according to their radiated power. Classes 1 and 2 are the most common and use a maximum transmit power level of 1 mW and 2.5 mW, respectively. Because Bluetooth operates as a PAN, class 1 and 2 devices use a relatively low transmit power level and have a range of only 35 feet. Less common, “industrial” Bluetooth class 3 devices can operate at up to 100 mW.
Bluetooth Low Energy (BLE) was designed for the Internet of Things (IoT), allowing small devices such as smartphones and tablets to transmit up to 20 dBm over a range of 100 meters. Apple has implemented BLE as its iBeacon technology, commonly used to interface with shoppers’ mobile devices in retail stores. iBeacon can gather location information from devices, detect shoppers’ proximity to items, push notifications such as advertisements and coupons to devices, and collect mobile payments.
Up to eight devices can be paired or linked into a PAN, with one device taking a master role and the others operating as slaves. Such tiny network cells are commonly called piconets. Devices operate in the 2.4-GHz ISM band, but are not compatible with the 802.11 standard. Bluetooth uses a frequency-hopping spread spectrum (FHSS) technique, with devices typically moving through a predefined sequence of 79 channels with a bandwidth of 1 MHz each. BLE uses 40 channels over the same span of frequencies and is based on Bluetooth specification 4.2.
Bluetooth transmitters could potentially interfere with the majority of the 2.4-GHz band because their channels overlap with the three non-overlapping 802.11 channels. Bluetooth devices can interfere at a close range because of their low transmit power. If there are many Bluetooth devices in an 802.11 cell, they can create a saturation effect that tends to starve wireless LAN devices for airtime.
Be aware that people commonly carry Bluetooth phones, headsets, and computer peripherals right into your WLAN. However, you might have a difficult time finding them and convincing their owners to leave them outside your wireless network. People typically hold Bluetooth devices close to themselves, where their phones are also held. The Bluetooth’s short range usually prevents it from impacting APs, but it has the potential to impact client devices close to the users.
ZigBee
ZigBee is wireless LAN technology that is based on relatively low power consumption and low data rates (20 to 250 Kbps). As a result, it offers reliable communication. ZigBee is commonly used for energy management and home and building automation applications.
ZigBee is defined in the IEEE 802.15.4 standard. It allocates the 2.4-GHz ISM band into 16 channels of 5 MHz each. Even though ZigBee uses the same band as 802.11 devices, it has a low duty cycle and does not utilize a channel much of the time. As well, ZigBee devices normally use a low transmit power level, which minimizes interference, but can ramp up to a maximum of 60 mW when necessary.
Tip
You can find the ZigBee Alliance at http://www.zigbee.org.
Cordless Phones
Cordless phones use several wireless technologies to connect remote handsets to a central base station. Phones that are advertised to use the 2.4- and 5.8-GHz bands do just that—and can cause significant interference with nearby WLANs. Cordless phones can use one channel at a time, but can also change channels dynamically. As well, transmit power levels can rise up to 250 mW, overpowering an AP at maximum power.
The Digital Enhanced Cordless Telecommunications (DECT) standard was developed by the European Telecommunications Standards Institute (ETSI) and uses the upper portion of the 1.8 GHz band in Europe, Asia, Australia, and South America. In the United States, cordless phones are based on DECT 6.0, which uses the 1.9-GHz band.
Because DECT and DECT 6.0 phones do not use the 2.4-GHz ISM band, they should not interfere with 802.11 WLANs. However, some similar “DECT-like” phones may operate in the 2.4- and 5.8-GHz bands and interfere.
Microwave Ovens
You might not think of a microwave oven as a communication device. After all, microwave ovens are designed to cook food—not to transmit data. To heat food and liquids and make popcorn, a microwave oven transmits RF energy into a sealed cavity. The energy is meant to stay inside the oven where it can penetrate food items.
In practice, the RF shielding around microwave oven doors is not ideal, allowing some amount of energy to leak out into the surrounding area. Like many other consumer devices, microwave ovens are free to use the 2.4-GHz ISM band. In fact, most microwaves produce a signal that spreads over a large portion of the band. The signal is simply crudely transmitted energy that does not need to follow any standard or frame format. Microwaves are commonly rated to generate around 700 W of power inside the oven. Leaked energy often interferes with nearby APs and 802.11 devices.
To mitigate interference coming from microwave ovens, you can move the oven farther away from WLAN coverage areas. Even better, suggest that the oven be swapped out for a commercial model that has higher-quality RF shielding around the oven and its door.
WiMAX
Worldwide Interoperability for Microwave Access (WiMAX) is a wireless technology designed to provide “last mile” broadband access to consumers within a geographic area. WiMAX does not require line of sight with a base station, so it can offer connectivity to many fixed and mobile users within a 3 to 10-km radius.
WiMAX is defined by the WiMAX Forum and published as the IEEE 802.16 standard. Although WiMAX, with its central base station and a shared wireless medium, sounds similar to 802.11 WLANs, the two are incompatible. WiMAX operates in several bands between 2 and 11 GHz and from 10 to 66 GHz. Depending on the frequency being used, WiMAX can possibly interfere with 802.11 devices, but such interference is highly unlikely. No widely deployed solutions use the ISM bands; the systems that are advertised for ISM are not supported by any major WiMAX players.
Tip
You can find the WiMAX Forum at http://www.wimaxforum.org.
Other Devices
You may encounter other types of non-802.11 devices in and around a WLAN. The following devices can cause varying degrees of interference:
![]() Canopy—A fixed wireless broadband technology developed by Motorola for Internet service providers; uses the 900-MHz, 2.4-GHz, 5.2-GHz, 5.4-GHz, and 5.7-GHz bands.
Canopy—A fixed wireless broadband technology developed by Motorola for Internet service providers; uses the 900-MHz, 2.4-GHz, 5.2-GHz, 5.4-GHz, and 5.7-GHz bands.
![]() Continuous transmitter—A device that transmits a continuous, generic waveform that causes steady interference.
Continuous transmitter—A device that transmits a continuous, generic waveform that causes steady interference.
![]() Jammer—A device that is designed to disrupt radio signals so that channels or bands become completely unusable.
Jammer—A device that is designed to disrupt radio signals so that channels or bands become completely unusable.
![]() SuperAG—A proprietary set of extensions developed by Atheros to make Wi-Fi transmissions more efficient. SuperG (802.11g) and SuperAG (both 802.11a and 802.11g) define schemes to compress frames, send bursts of frames, and bond channels for improved throughput. However, they are incompatible with the 802.11 standard and can cause interference.
SuperAG—A proprietary set of extensions developed by Atheros to make Wi-Fi transmissions more efficient. SuperG (802.11g) and SuperAG (both 802.11a and 802.11g) define schemes to compress frames, send bursts of frames, and bond channels for improved throughput. However, they are incompatible with the 802.11 standard and can cause interference.
![]() Video camera—Wireless security cameras that transmit on the 900-MHz, 2.4-GHz, and 5.8-GHz bands with analog or non-802.11 signals.
Video camera—Wireless security cameras that transmit on the 900-MHz, 2.4-GHz, and 5.8-GHz bands with analog or non-802.11 signals.
![]() Wi-Fi invalid channel—Wireless devices that use a nonstandard channel or one that is slightly offset from the familiar channel numbers and center frequencies in the 2.4- and 5-GHz bands. These devices are proprietary and can be difficult to detect because they sit on unexpected frequencies. They can overlap normal 802.11 channels and cause interference.
Wi-Fi invalid channel—Wireless devices that use a nonstandard channel or one that is slightly offset from the familiar channel numbers and center frequencies in the 2.4- and 5-GHz bands. These devices are proprietary and can be difficult to detect because they sit on unexpected frequencies. They can overlap normal 802.11 channels and cause interference.
![]() Wi-Fi inverted—Devices that invert the components of an RF signal from what is normally expected. The inverted signals appear as noise to 802.11 devices. However, two inverted devices can correctly receive and use each other’s signal and operate as an undetectable wireless bridge.
Wi-Fi inverted—Devices that invert the components of an RF signal from what is normally expected. The inverted signals appear as noise to 802.11 devices. However, two inverted devices can correctly receive and use each other’s signal and operate as an undetectable wireless bridge.
![]() Xbox—A video game console developed by Microsoft. Its wireless controller uses a frequency-hopping technique that can interfere with 802.11 devices in the 2.4-GHz band.
Xbox—A video game console developed by Microsoft. Its wireless controller uses a frequency-hopping technique that can interfere with 802.11 devices in the 2.4-GHz band.
Tip
You might encounter other technologies such as Wi-Fi Direct and Near Field Communication (NFC) in your environment. Neither one is likely to interfere with 802.11. NFC is used for very close range (10 cm) communication between devices. It uses non-802.11 frequencies. Wi-Fi Direct is a means to allow convenient peer-to-peer communication without an AP, while remaining compatible with 802.11 and any nearby APs. Because it is based on 802.11, Wi-Fi Direct does not interfere with Wi-Fi, but it can impact it. Wi-Fi Direct increases the channel utilization; as more devices use it simultaneously, the 802.11 channels may become unusable.
Using Tools to Detect and Manage Interference
As you have learned in this book, WLANs use the same unlicensed bands as many other technologies and devices. If the RF conditions in your environment are superb, such that your 802.11 APs and clients can enjoy clear channels with low noise and no interference, users will be happy and your job will become easier. However, it is all too easy for someone to power up a rogue AP or a non-802.11 device that begins to interfere with your network.
If some portion of your wireless network begins to have degraded performance, wireless interference might be occurring there. How should you approach such a problem? First, you should figure out what type of device is generating the interference. Then you should attempt to locate the device so that you can negotiate with its owner to have it disabled. If that is not possible, you should move your AP onto a different channel that is clear from interference. The following sections discuss two approaches to analyzing the RF spectrum—one manual and one automatic.
Spectrum Analyzers
With no visibility into a Wi-Fi band, it is difficult to know whether anything is interfering with your network. A spectrum analyzer detects and measures the RF energy that is present on a frequency as it sweeps through the band and displays it in a visible format. The display can be quite versatile, showing things like RF signal strength across the band in real time and the RF duty cycle. The information is displayed in color and can be shown by frequency or over time, where snapshots of the frequency graph are cascaded into a moving queue or “waterfall,” giving a visual history of the RF energy. All RF data that is collected can also be recorded, saved, and played back at a later time for further analysis.
A spectrum analyzer can also perform complex analysis of the RF data that is collected. APs and service set identifiers (SSIDs) can be identified, as well as co-channel or neighboring channel interference. Many spectrum analyzers can perform signature analysis to identify the type of device that is interfering with Wi-Fi networks. You can also add a directional antenna and manually walk through an area to track down the source of interference.
Normally, spectrum analyzers are manual tools that require human intervention. You must physically visit a location with the spectrum analysis application and hardware to gather the RF activity that is occurring there. The MetaGeek Chanalyzer is a popular third-party spectrum analysis software tool. It runs on a Windows-based machine and can interface with the MetaGeek Wi-Spy 2.4x (2.4 GHz) and Wi-Spy DBx (2.4 and 5 GHz) USB spectrum adapter. The Chanalyzer software can also connect to a Cisco AP configured in Spectrum Expert Connect (SE-Connect) mode to leverage it as a remote sensor.
Figure 19-1 shows an example Chanalyzer session for the 2.4-GHz band. The upper-right graph displays signal amplitude over the frequency range. The graph underneath shows the “waterfall” history over the same range. Because the waterfall slowly scrolls downward, you can see what has happened on any frequency at a glance. The graph to the left shows the same waterfall, only over a longer history. When using the USB receiver, you must do a bit of your own analysis to identify shapes and signatures in the graphs, with the assistance of a set of overlay templates. In Figure 19-1, however, Chanalyzer has been connected to a Cisco 3702 AP in SE-Connect mode. The remote AP supplies the spectrum data, as well as detects and identifies sources of interference, which are listed at the bottom of the screen.
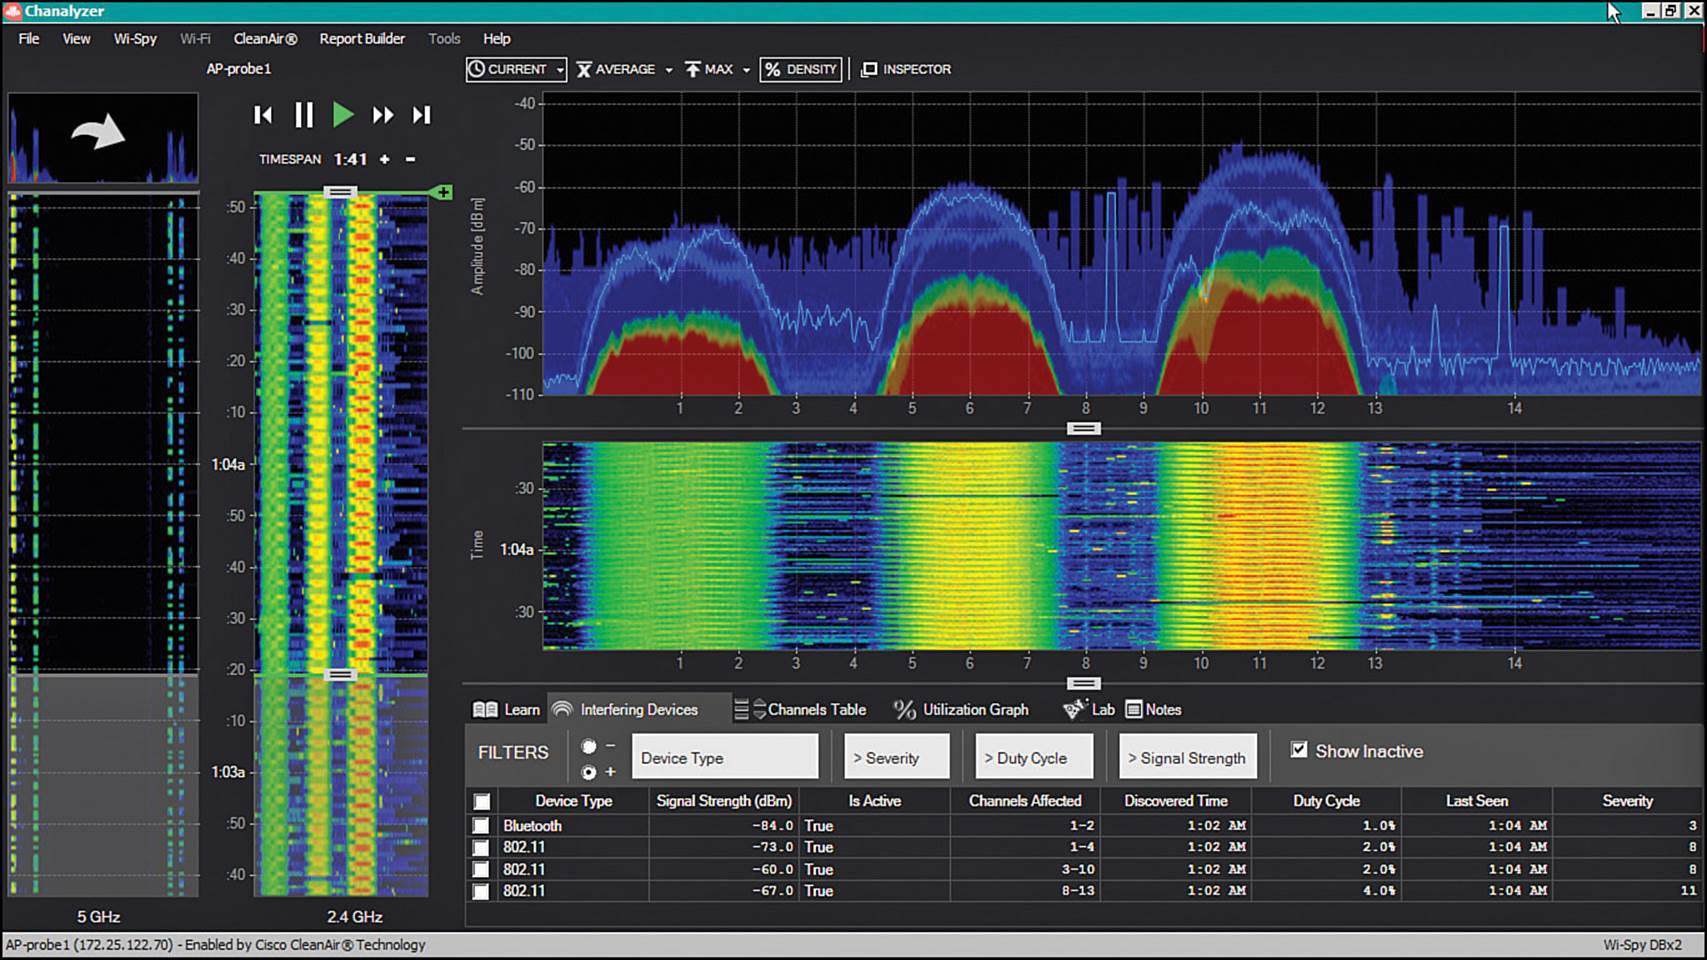
Figure 19-1 Spectrum Analysis with MetaGeek Chanalyzer and a Cisco AP
AirMagnet also offers its Spectrum XT spectrum analyzer, which integrates software with a USB-based spectrum receiver for versatile analysis. While Spectrum XT cannot connect to a Cisco AP for remote spectrum data, it can integrate with other AirMagnet tools so that the spectrum information can be collected over an area during a wireless site survey. Spectrum XT can also detect and classify signatures it finds in the data, as shown in Figure 19-2.
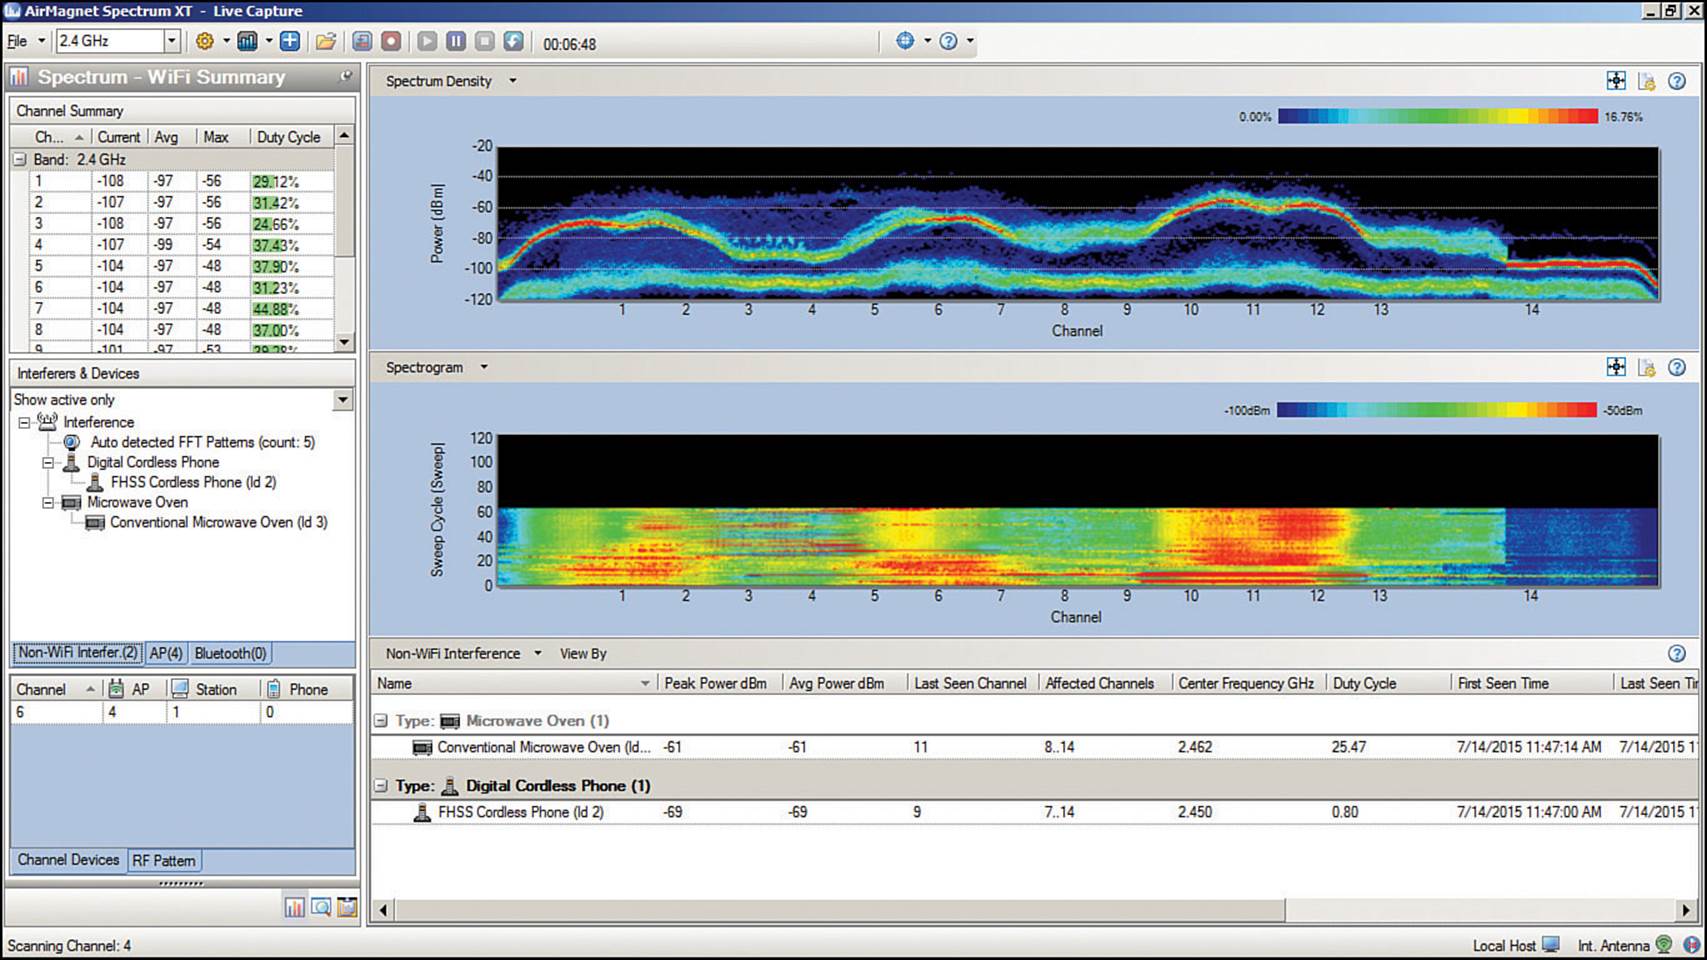
Figure 19-2 Spectrum Analysis with AirMagnet Spectrum XT
Cisco cloud-based wireless networks offer spectrum analysis too, through the Cisco Meraki RF Spectrum feature. From the Cisco Meraki Dashboard, select Wireless > RF Spectrum, then select an AP from the list. You will be able to see a display of signal strength across the frequency range, a waterfall history display, and channel utilization or a list of interfering APs, as shown in Figure 19-3. The spectrum analysis is performed by hardware integrated in the AP, so it is not necessary to carry a spectrum analyzer onsite to where the AP is located. Cisco Meraki spectrum analysis is still a manual process as you must initiate it from the Dashboard.
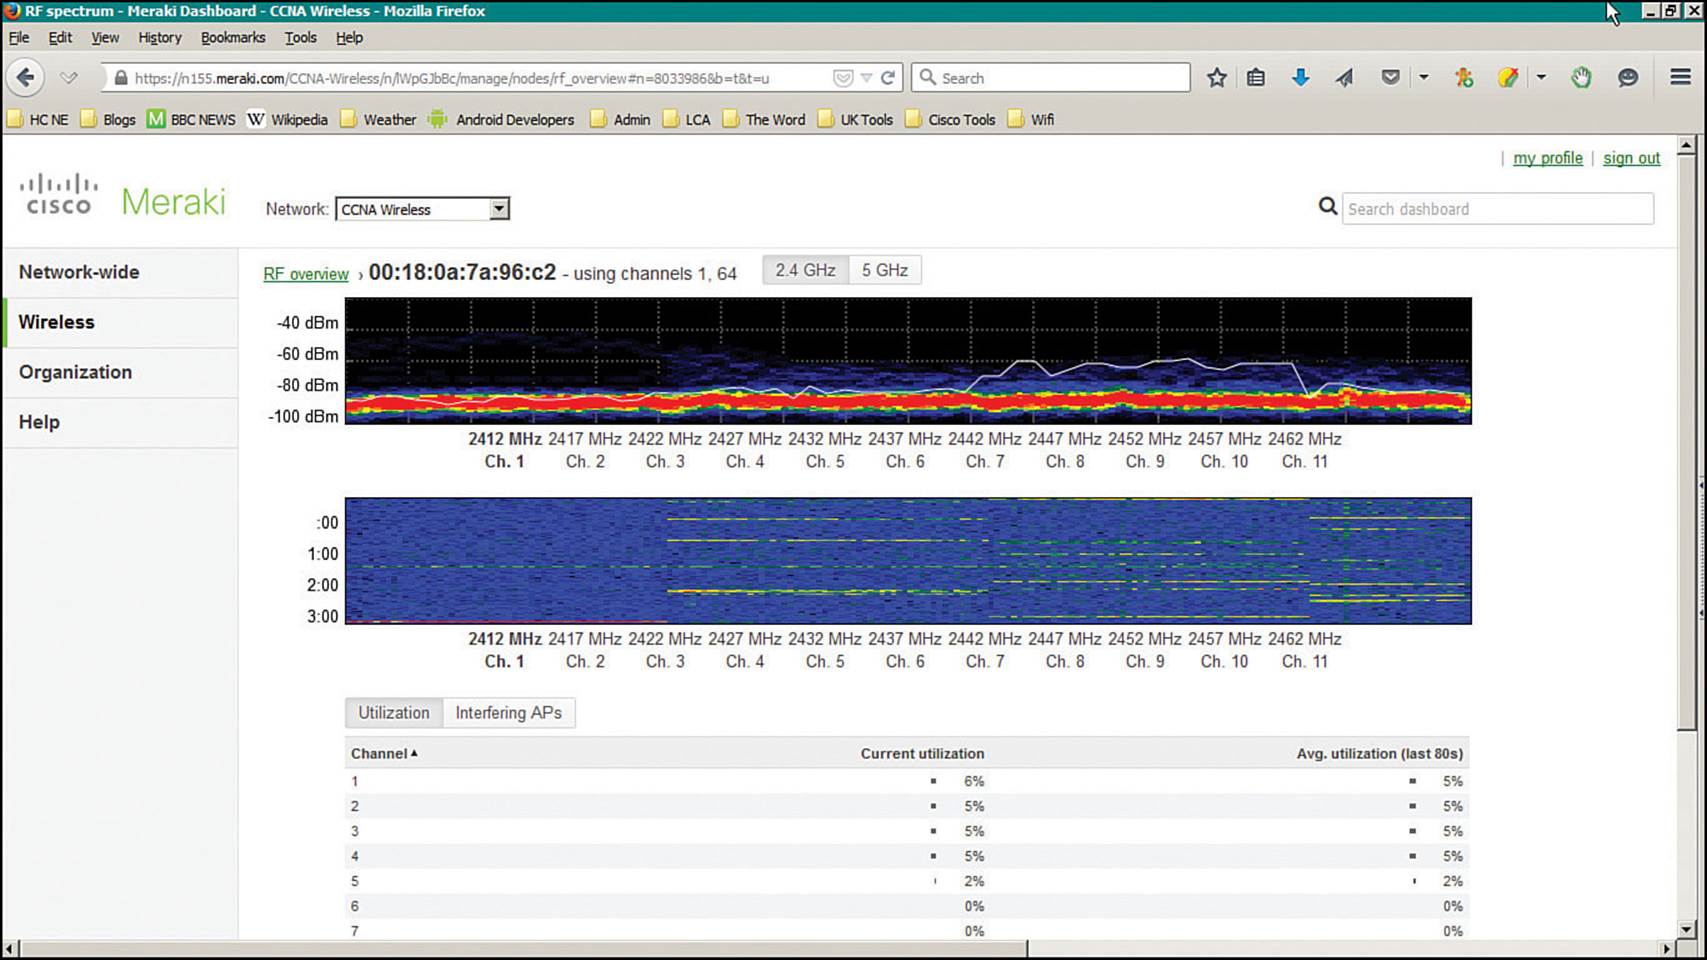
Figure 19-3 Spectrum Analysis with Cisco Meraki
Cisco CleanAir
Any Cisco lightweight AP can measure both noise and interference as it scans the channels in a band, as part of the Radio Resource Management (RRM) process. Figure 19-4 shows an example of the information gathered from the 2.4-GHz radio of an AP. The noise level appears to be very low and acceptable on every channel. The Interference by Channel graph displays the received strength of an interference source in dBm on the left vertical axis (dark blue) and the duty cycle of the interference in percent on the right vertical axis (red). Figure 19-4 shows fairly strong interference on channels 4 through 6, but at a very low duty cycle. Although that is good information to have, can you tell what sort of thing is causing the interference?
Tip
You can display similar results from a wireless LAN controller GUI by selecting Monitor > Access Points > Radios > 802.11a/n/ac or 802.11b/g/n. Find an AP of interest in the list, and then scroll over to the right side of the page. Click the blue drop-down menu and selectDetails.
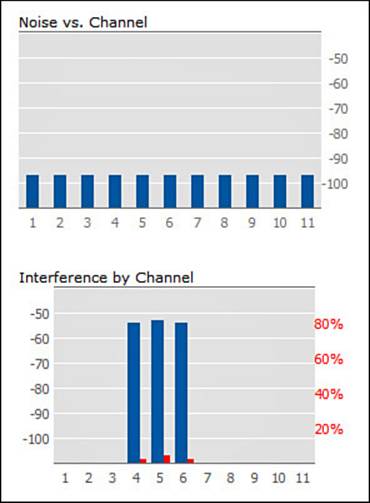
Figure 19-4 Basic Channel Quality Information Gathered by an AP
To accurately detect and identify interference, you should use a spectrum analyzer. Rather than rely on your own ability to recognize interference patterns, rely on one of the many spectrum analyzers that offer their own intelligence. They can recognize and identify specific types of devices that are causing interference based on patterns and signatures in the spectrum data.
Now imagine carrying a spectrum analyzer throughout an entire WLAN to look for wireless interference. You never know where interference might crop up or how long it will last. What if you could have a spectrum analyzer permanently located at each AP?
Cisco CleanAir does just that; APs such as the Cisco Aironet 3700, 2700, and 2600 models have spectrum analysis capability built right in to the radio hardware. While a CleanAir AP is busy operating its normal basic service sets (BSSs) on a channel, it can also monitor RF energy on that channel, analyze the data, and report specific information about any interfering devices—all without interrupting normal WLAN operation. This is all done with the Spectrum Analysis Engine (SAgE) chipset, operating in parallel with the normal 802.11 Wi-Fi chipset in the AP. The SAgE is always on and scans through the frequency range at a high resolution once per second. The high-resolution bandwidth enables the SAgE to identify interference sources with a high degree of accuracy.
![]()
Anything that the AP receives and recognizes as an 802.11 frame is processed normally by the split MAC architecture. Other signals that cannot be demodulated according to any known modulation and coding scheme must be coming from a non-802.11 source. That signal information is processed by the spectrum analysis hardware in the AP, as shown in Figure 19-5.
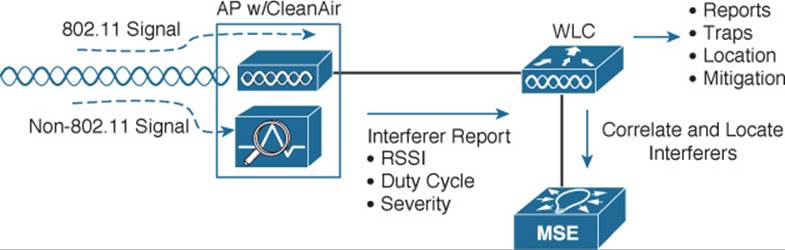
Figure 19-5 Overview of CleanAir Operation
The spectrum information from every AP is sent up to the corresponding wireless LAN controller (WLC), where it can be collected and processed. If an interference source is received by more than one AP, the controller can usually correlate the data and realize that a single source is involved and not several different ones. WLCs can also pass interference reports to a Mobility Services Engine (MSE) to determine an interference source’s location and display it on a Prime Infrastructure map. With CleanAir, interference can be automatically detected and identified, and its source located—which should make your job easier!
Beyond that, a Cisco unified wireless network can even react to wireless interference automatically. Recall that the RRM process is responsible for working out a channel reuse plan and assigning APs to use specific channels in a band—all on a periodic basis. Event-driven RRM can react to interference immediately, without waiting for the next scheduled RRM iteration, so that an AP can be moved to a different channel to escape the interference.
Enabling CleanAir
CleanAir operates on each band independently. You can enable or disable it globally for all APs on a controller by selecting Wireless > 802.11a/n or 802.11b/g/n > CleanAir and using the CleanAir check box, as shown in Figure 19-6. By default, CleanAir is disabled globally on a controller.
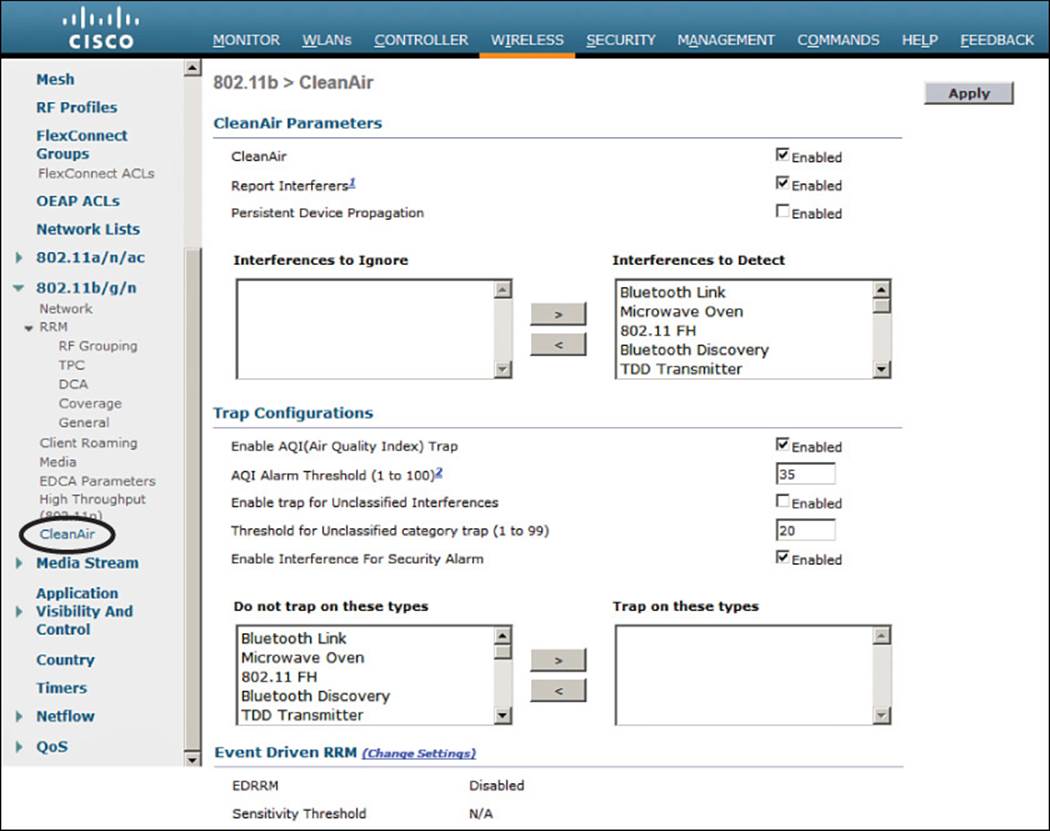
Figure 19-6 Enabling CleanAir Globally on a Controller
By default, APs will report the interference types listed in Table 19-2 to their respective controller. You can change this behavior by selecting a type and moving it to the Interferences to Ignore or Interferences to Detect list. You can also select which types will generate an SNMP trap from the controller when they are detected. Otherwise, any types not selected will not be reported.
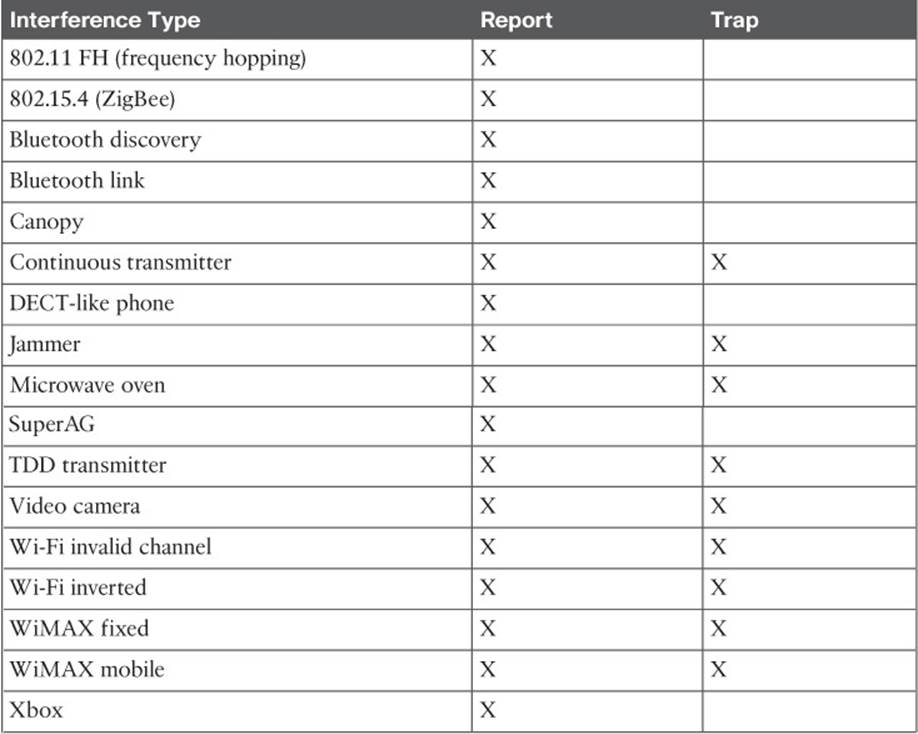
Table 19-2 CleanAir Interference Types and Their Default Actions
Tip
An AP must be configured for either local or monitor mode before it can generate CleanAir interference reports. Reporting is not possible in the Spectrum Expert Connect (SE-Connect) mode.
As interference sources are detected and classified according to interference type, the AP also measures the received signal strength indicator (RSSI) and the duty cycle of the interferer. The duty cycle is the percentage of time the source is transmitting on the channel, which indicates its persistence or how much of the airtime the interferer is consuming. The AP combines the RSSI and duty cycle into a severity index value. Severity ranges from 0 (not severe) to 100 (very severe). Interference with a high severity rating can render a channel unusable.
Interference detection reports sent to a controller include the AP name, interference type, affected channel, time stamp, severity, duty cycle, and RSSI. The controller then tries to determine whether the same interference source is involved in reports coming from multiple APs. If so, the source is uniquely identified by assigning it a cluster ID. A cluster ID is actually a pseudo-MAC address that represents the non-802.11 device with a familiar wireless identifier.
You can display a list of interference detection reports on a controller by selecting Monitor > CleanAir > 802.11a/n/ac or 802.11b/g/n > Interference Devices. Figure 19-7 shows an example list.
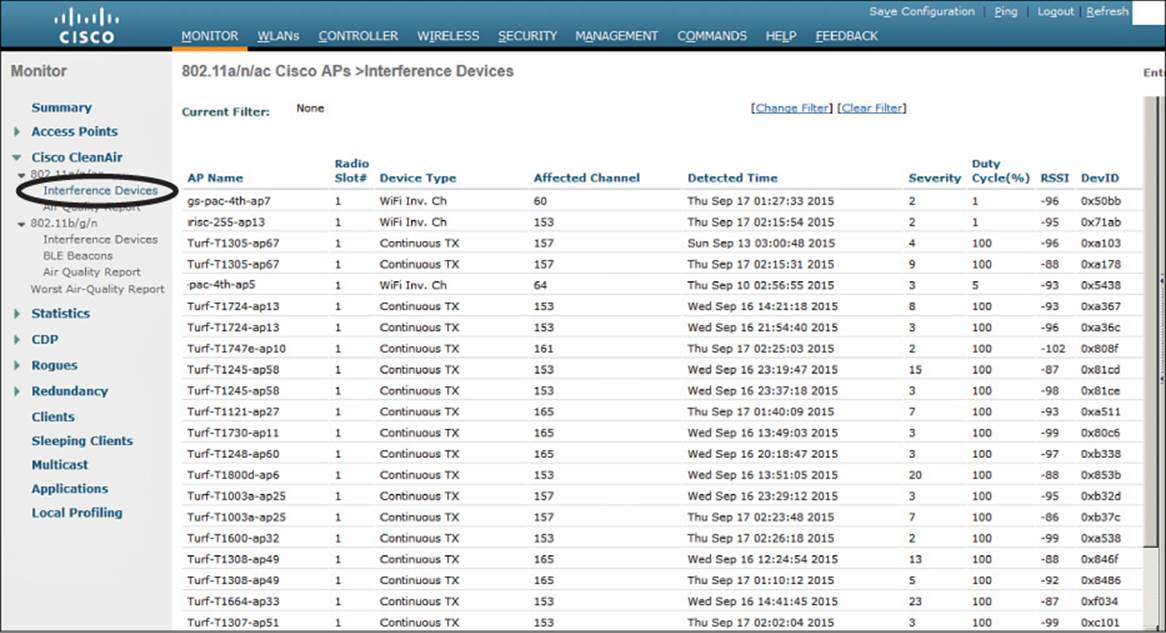
Figure 19-7 Example List of Interference Device Reports
Air-Quality Index
![]()
As APs and controllers work together to generate a list of interference reports, the list can grow quite long. For example, the controller from Figure 19-7 has a list of 25 reports from the 5-GHz 802.11a/n/ac band. In addition, the same controller has 401 reports on the 2.4-GHz 802.11b/g/n band. To get a feel for the RF conditions on any one channel and AP, you would have to read through the list of reports manually and guess the cumulative effect that various interferers were having.
Cisco WLCs can do a better analysis by calculating an air-quality index (AQI) for each AP and its channels. The AQI indicates Wi-Fi health within an AP’s cell, as indicated by a scale from 0 (unusable) to 100 (perfect). You can display the air quality metrics for every AP on a controller by selecting Monitor > CleanAir > 802.11a/n/ac or 802.11b/g/n > CleanAir > Air Quality Report, as shown in Figure 19-8. You can see a summary of the AP with the worst air-quality rating in each band by selecting Worst Air-Quality Report.
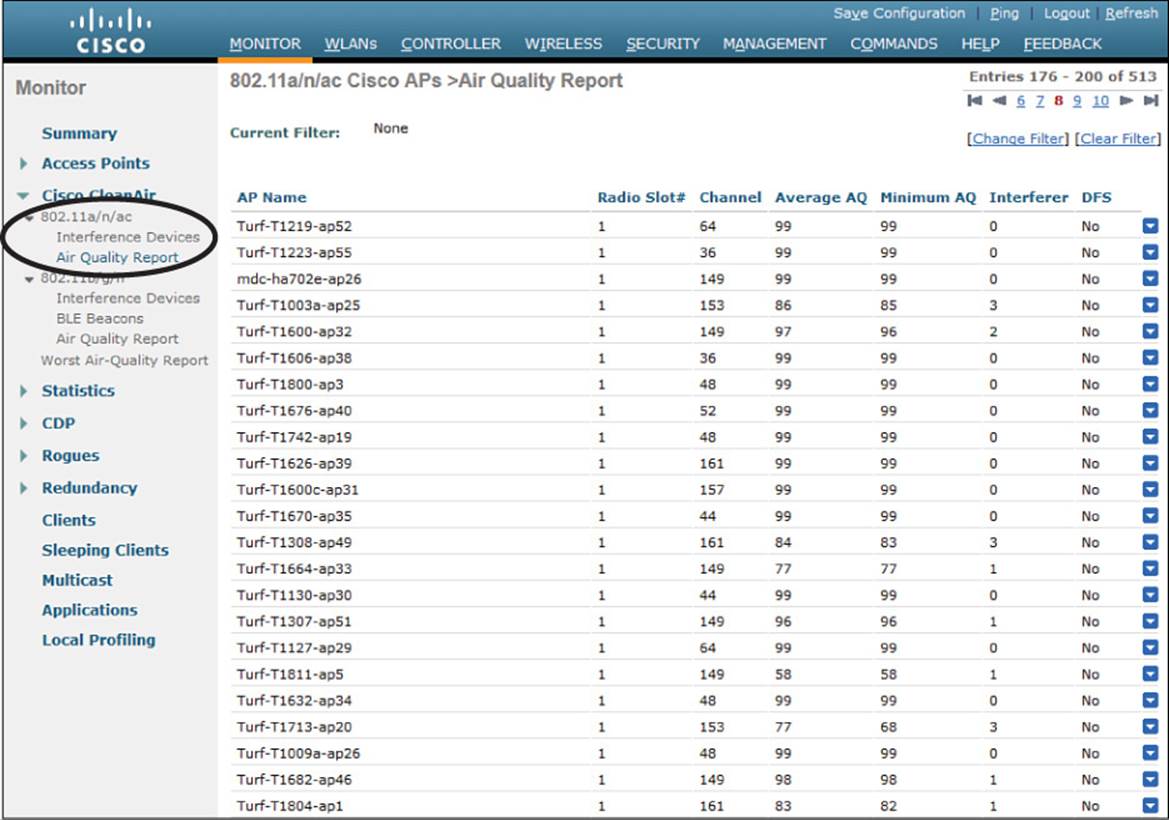
Figure 19-8 Displaying Air-Quality Indices for all APs on a Controller
Air-quality ratings are updated dynamically. Each AP measures RF conditions once a second and then calculates an air quality value every 15 seconds and a summary every 30 seconds. By default, these values are reported to the AP’s controller every 15 minutes.
You can also view an AP’s CleanAir activity more frequently through the rapid update mode. To access this mode, use Monitor > Access Points > 802.11a/n/ac or 802.11b/g/n to display a list of APs. Choose an AP, and then select CleanAir from the blue triangular drop-down menu on the right side of the list. In rapid update mode, the controller automatically refreshes the page every 30 seconds with updated CleanAir data.
Rapid update mode also shows more detailed CleanAir information from an AP. In Figure 19-9, the AP has detected interference from a microwave oven. The air quality is shown as a bar graph. Normally only the one channel used by an AP is shown; if the AP is in monitor mode, all channels are shown. The same page also shows channel utilization and interference power measured by the AP.
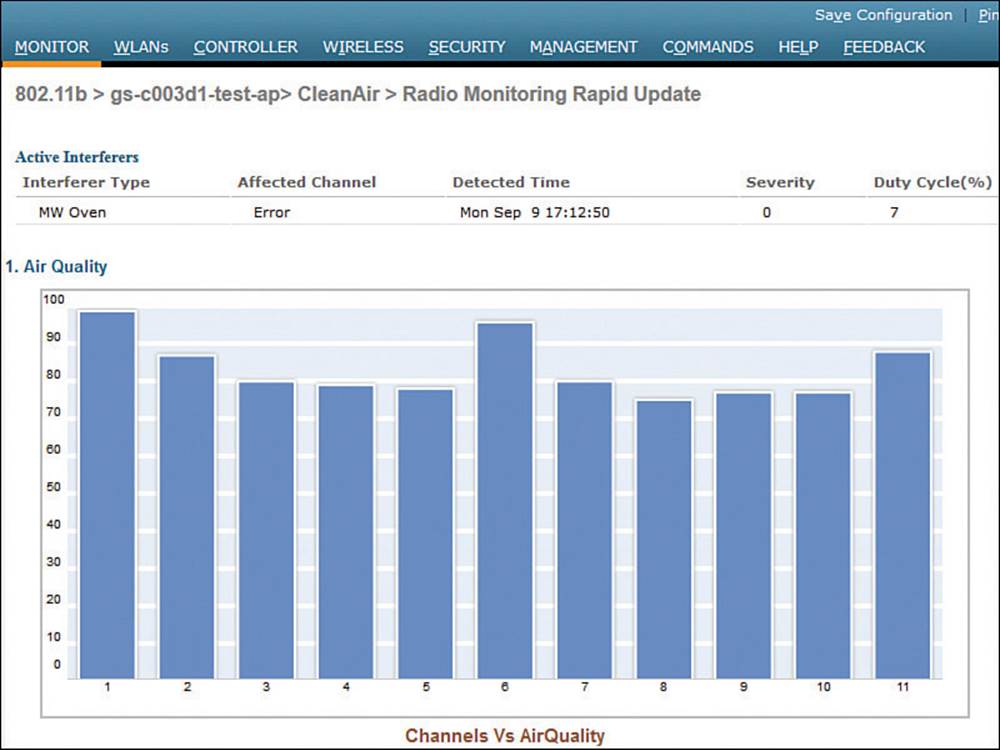
Figure 19-9 Displaying Detailed CleanAir Data in Rapid Update Mode
Controllers display air quality on a per-AP (and channel) basis, and this information is aggregated further by Prime Infrastructure (PI). Air quality is summarized for the entire set of controllers managed in the enterprise.
Using Event-Driven RRM
By default, APs and controllers work together to detect, classify, and report wireless interference from non-802.11 devices. CleanAir and RRM can work together so that controllers actually take some action on interference events at the regular RRM intervals. By default, RRM runs the dynamic channel allocation (DCA) algorithm every 10 minutes, but you can increase the interval up to 24 hours. If non-802.11 interference occurs near an AP, the controller must wait until the next DCA interval before it can move the AP away from the unusable channel.
When Event-Driven RRM (ED-RRM) is enabled, the normal periodic RRM DCA process is triggered immediately in response to interference reported by an AP. ED-RRM must be enabled and then triggered based on an AQI threshold. You can set the threshold to Low (AQI 35), Medium (AQI 50), or High (AQI 60).
First, enable ED-RRM globally on a controller. ED-RRM uses the DCA function to change an AP’s channel and work out any other channel allocation changes that might be needed. Therefore, navigate to the DCA configuration by selecting Wireless > 802.11a/n/ac or 802.11b/g/n > RRM > DCA. Scroll to the bottom of the page to the Event Driven RRM section, as shown in Figure 19-10. Once you check the EDRRM box, you will be able to select a Sensitivity Threshold from the drop-down list. By default, the threshold is set to Medium. You can select Low, Medium, High, or Custom.
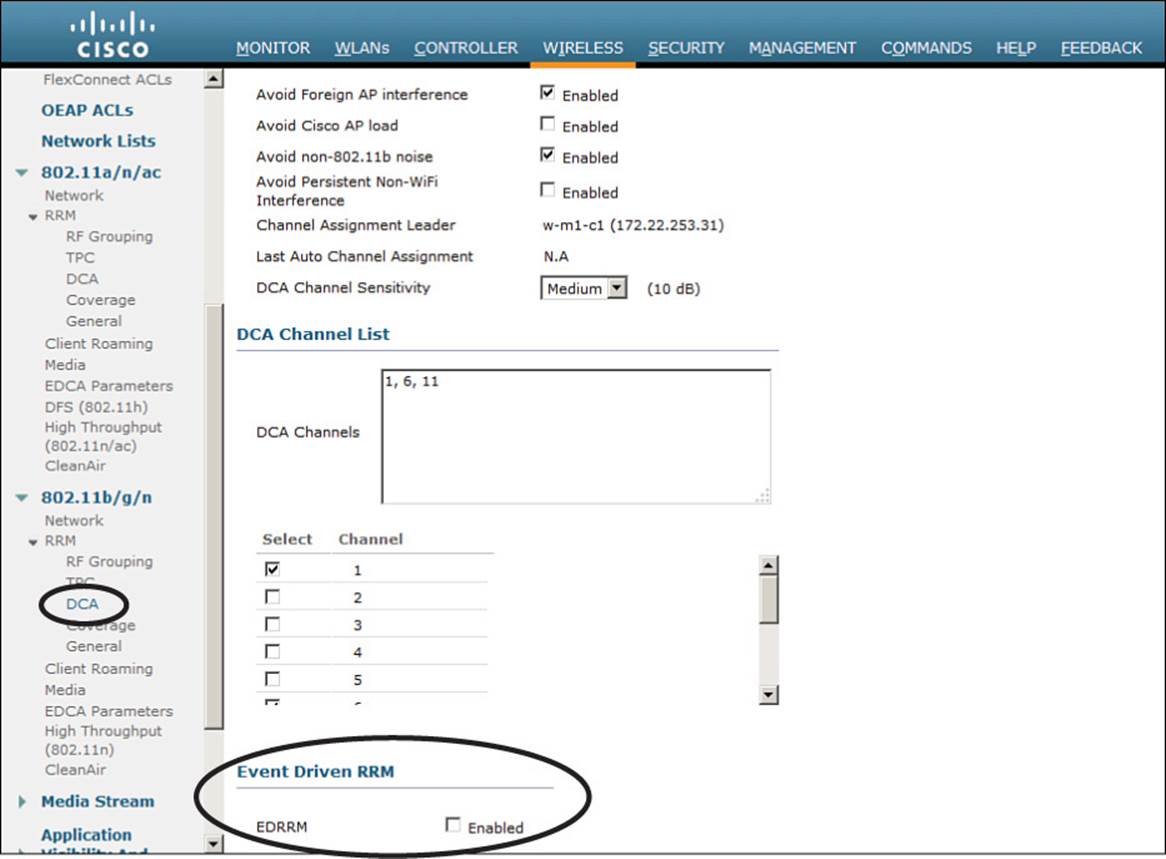
Figure 19-10 Enabling ED-RRM
Exam Preparation Tasks
As mentioned in the section “How to Use This Book” in the Introduction, you have a couple of choices for exam preparation: the exercises here, Chapter 21, “Final Review,” and the exam simulation questions on the DVD.
Review All Key Topics
Review the most important topics in this chapter, noted with the Key Topic icon in the outer margin of the page. Table 19-3 lists a reference of these key topics and the page numbers on which each is found.
![]()
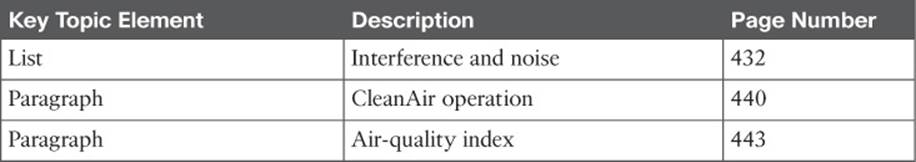
Table 19-3 Key Topics for Chapter 19
Define Key Terms
Define the following key terms from this chapter and check your answers in the glossary:
air-quality index (AQI)
Cisco CleanAir
cluster ID
duty cycle
Event-Driven RRM (ED-RRM)
interference
noise
piconet
pseudo-MAC address
rogue AP
spectrum analyzer
All materials on the site are licensed Creative Commons Attribution-Sharealike 3.0 Unported CC BY-SA 3.0 & GNU Free Documentation License (GFDL)
If you are the copyright holder of any material contained on our site and intend to remove it, please contact our site administrator for approval.
© 2016-2026 All site design rights belong to S.Y.A.