CCNP Routing and Switching TSHOOT 300-135 Official Cert Guide (2015)
Part IV. Troubleshooting Management
Chapter 19. Troubleshooting Management Protocols and Tools
This chapter covers the following topics:
![]() Management Protocols Troubleshooting: This section examines how to recognize and troubleshoot issues related to management protocols such as NTP, syslog, and SNMP.
Management Protocols Troubleshooting: This section examines how to recognize and troubleshoot issues related to management protocols such as NTP, syslog, and SNMP.
![]() Management Tools Troubleshooting: This section examines how to recognize and troubleshoot issues related to management tools such as Cisco IP SLA, object tracking, SPAN, and RSPAN.
Management Tools Troubleshooting: This section examines how to recognize and troubleshoot issues related to management tools such as Cisco IP SLA, object tracking, SPAN, and RSPAN.
![]() Management Protocols and Tools Trouble Tickets: This section provides trouble tickets that demonstrate how you can use a structured troubleshooting process to solve a reported problem.
Management Protocols and Tools Trouble Tickets: This section provides trouble tickets that demonstrate how you can use a structured troubleshooting process to solve a reported problem.
During your troubleshooting endeavors, you will rely on various protocols and tools to help you solve the problems that are being presented. Some tools will be used to notify you of issues, some will be used to gather additional information, and some will even be used to help you monitor and maintain the health of the network.
This chapter covers how to identify and troubleshoot issues related to management protocols such as Network Time Protocol (NTP), which is used to keep accurate time in the network; syslog, which will notify you of changes on a device; and Simple Network Management Protocol (SNMP), which is used to monitor the health of a device.
In addition, this chapter explains how to identify and troubleshoot issues related to management tools such as Cisco IP SLA (service level agreement), which can measure the health of your network; object tracking, which can keep track of the status of an object; and Switched Port Analyzer / Remote Switched Port Analyzer (SPAN/RSPAN), which enables you to copy frames from one switchport on a switch to a port on the same switch or a different switch.
Usually, you will be spending your time troubleshooting issues using these management protocols and tools. However, you might sometimes troubleshoot issues related to the protocols and tools that help you. When that time comes, you need to be ready.
“Do I Know This Already?” Quiz
The “Do I Know This Already?” quiz allows you to assess whether you should read this entire chapter thoroughly or jump to the “Exam Preparation Tasks” section. If you are in doubt about your answers to these questions or your own assessment of your knowledge of the topics, read the entire chapter. Table 19-1 lists the major headings in this chapter and their corresponding “Do I Know This Already?” quiz questions. You can find the answers in Appendix A, “Answers to the ‘Do I Know This Already?’ Quizzes.”
Table 19-1 “Do I Know This Already?” Section-to-Question Mapping
Caution
The goal of self-assessment is to gauge your mastery of the topics in this chapter. If you do not know the answer to a question or are only partially sure of the answer, you should mark that question as wrong for purposes of the self-assessment. Giving yourself credit for an answer that you correctly guess skews your self-assessment results and might provide you with a false sense of security.
1. Which port does NTP use?
a. 22
b. 23
c. 123
d. 514
2. Which stratum level indicates that an NTP server is not reachable?
a. 1
b. 5
c. 10
d. 16
3. Which port is used by syslog?
a. 22
b. 23
c. 110
d. 514
4. You have accessed a router via telnet and issued the debug ntp packets command. No debugs are being displayed in the terminal window even though the logging level to the vty lines is set to debugging. Why?
a. Debugs are not sent to the vty lines.
b. You need to issue the terminal no monitor command.
c. You need to issue the terminal monitor command.
d. Debugs need to be enabled.
5. Which command enables you to verify which SNMP group a user belongs to?
a. show snmp user
b. show snmp group
c. show snmp host
d. show snmp view
6. Which two commands are used to verify the OIDs that a particular group is able to access on the local device?
a. show snmp user
b. show snmp group
c. show snmp host
d. show snmp view
7. Which command enables you to verify the number of successes and failures for an IP SLA instance?
a. show ip sla configuration
b. show ip sla statistics
c. show ip sla responder
d. show ip sla summary
8. Which of the following statements are true? (Choose two answers.)
a. A SPAN session copies packets from a switchport on one device to a switchport on the same device.
b. A SPAN session copies packets from a switchport on one device to a switchport on a different device.
c. An RSPAN session copies packets from a switchport on one device to a switchport on the same device.
d. An RSPAN session copies packets from a switchport on one device to a switchport on a different device.
9. Which two commands can be used to verify that a switchport is a destination SPAN or RSPAN monitoring port?
a. show ip interface brief
b. show ip interfaces
c. show interfaces status
d. show monitor
10. Which three commands enable you to verify that a VLAN is an RSPAN VLAN?
a. show vlan
b. show vlan brief
c. show monitor
d. show vlan remote-span
Foundation Topics
Management Protocols Troubleshooting
Tools such as syslog and SNMP help you monitor the health of your network devices. They are very valuable tools if they are working properly. If they have been misconfigured, you will not be able to gather the information you need while troubleshooting specific events, or be notified that an event has occurred. In addition, it is important that you know what time the events occurred. Therefore, you need accurate time using a protocol such as NTP. However, if there is an issue with NTP, you need to be able to solve it quickly so that log messages have the appropriate time.
This section explains how to identify and troubleshoot issues related to NTP, syslog, and SNMP.
NTP Troubleshooting
Network Time Protocol is used to synchronize clocks among the various network devices. It is a client/server protocol where NTP servers provide time to NTP clients. There are many reasons as to why a device configured as an NTP client might not be able to synchronize with an NTP server. The following list details many of these reasons:

![]() The time server is not reachable: To synchronize with the NTP server, you have to be able to reach it. Use the ping command to verify connectivity from the client to the server. However, be careful to test using the correct destination IP addresses and source IP addresses. For example, if your client is configured to source NTP packets from Loopback 0, you should ping with a source of Loopback 0.
The time server is not reachable: To synchronize with the NTP server, you have to be able to reach it. Use the ping command to verify connectivity from the client to the server. However, be careful to test using the correct destination IP addresses and source IP addresses. For example, if your client is configured to source NTP packets from Loopback 0, you should ping with a source of Loopback 0.
![]() ACL blocking NTP packets: NTP uses UDP port 123. Therefore, it is important that no access control list (ACL) exists between the NTP client and server that is configured to deny NTP packets either on purpose or by accident. You will need to verify whether any ACLs exist on interfaces with the show ip interface interface_type interface_number command and, if you find one, verify the ACL entries with the show access-list command.
ACL blocking NTP packets: NTP uses UDP port 123. Therefore, it is important that no access control list (ACL) exists between the NTP client and server that is configured to deny NTP packets either on purpose or by accident. You will need to verify whether any ACLs exist on interfaces with the show ip interface interface_type interface_number command and, if you find one, verify the ACL entries with the show access-list command.
![]() NTP authentication mismatch: Authentication is not required, but if implemented both the server and the client need to be configured with the correct authentication key and key string. To verify the NTP authentication configuration, use the show run | section ntp command.
NTP authentication mismatch: Authentication is not required, but if implemented both the server and the client need to be configured with the correct authentication key and key string. To verify the NTP authentication configuration, use the show run | section ntp command.
![]() The wrong server is being used: You can configure a client with multiple NTP servers; by default, the protocol will choose the best server. However, this many not be the one you want it to use. Therefore, you can force a preferred NTP server with the ntp server ip_address prefercommand. To verify which server is being used, use the show ntp status command.
The wrong server is being used: You can configure a client with multiple NTP servers; by default, the protocol will choose the best server. However, this many not be the one you want it to use. Therefore, you can force a preferred NTP server with the ntp server ip_address prefercommand. To verify which server is being used, use the show ntp status command.
![]() High CPU utilization: The CPU is responsible for processing NTP packets. If the CPU is under high load it will fail to process packets and synchronization will fail. You can verify CPU load with the show processes cpu command.
High CPU utilization: The CPU is responsible for processing NTP packets. If the CPU is under high load it will fail to process packets and synchronization will fail. You can verify CPU load with the show processes cpu command.
![]() Time offset is too high: If the offset between the clock on the server and the client is extreme, it can take a significant amount of time for the clock to synchronize, or it may not synchronize at all. Therefore, you should manually set the clock with the clock set [hh:mm:ss] [day] [month] [year] command and then allow NTP to fine-tune the clocks. To verify the clock that is set on a device, issue the show clock command.
Time offset is too high: If the offset between the clock on the server and the client is extreme, it can take a significant amount of time for the clock to synchronize, or it may not synchronize at all. Therefore, you should manually set the clock with the clock set [hh:mm:ss] [day] [month] [year] command and then allow NTP to fine-tune the clocks. To verify the clock that is set on a device, issue the show clock command.
![]() Stratum level is too high: The NTP hierarchy is based on stratum levels from 1 to 15. 1 is considered the best (most reliable), and 15 is considered the worst (least reliable). A stratum level of 16 is unreachable. Therefore, if a device is synchronizing with another device that has a stratum of 15, the synchronization will fail.
Stratum level is too high: The NTP hierarchy is based on stratum levels from 1 to 15. 1 is considered the best (most reliable), and 15 is considered the worst (least reliable). A stratum level of 16 is unreachable. Therefore, if a device is synchronizing with another device that has a stratum of 15, the synchronization will fail.
![]() Server is configured to accept NTP packets from specific IP addresses: You can configure an NTP access group on the NTP server to control which NTP packets will be responded to. If the NTP clients are sourcing NTP packets from the wrong IP address, the server will not respond to the packets as the source address of the packet does not match the ACL.
Server is configured to accept NTP packets from specific IP addresses: You can configure an NTP access group on the NTP server to control which NTP packets will be responded to. If the NTP clients are sourcing NTP packets from the wrong IP address, the server will not respond to the packets as the source address of the packet does not match the ACL.
Example 19-1 displays the output of show ntp status. With this command, you can verify whether the clock is synchronized, the stratum level, and the IP address of the time server the local device is synchronized with. You can also verify clock statistics if necessary.
Example 19-1 Verifying the Status of NTP on a Client
SW1#show ntp status
Clock is synchronized, stratum 2, reference is 192.168.1.3
nominal freq is 119.2092 Hz, actual freq is 119.2116 Hz, precision is 2**17
reference time is D77BFCDB.2A77CE72 (21:44:59.165 UTC Thu Jul 24 2014)
clock offset is -85.7435 msec, root delay is 43.18 msec
root dispersion is 105.32 msec, peer dispersion is 3.73 msec
loopfilter state is 'CTRL' (Normal Controlled Loop), drift is -0.000020157 s/s
system poll interval is 64, last update was 215 sec ago.
Example 19-2 displays the output of show ntp associations, which you can use to check the status of the configured NTP servers. You can also verify which server is currently being used for time synchronization and which servers are candidate time servers. Therefore, if there are multiple time servers configured on the device, all of them will be listed here. The * beside 192.168.1.3 indicates that the local device is synchronized with that server. A + beside it means that it is a candidate server for synchronization.
Example 19-2 Verifying NTP Time Server Associations on the Client
SW1#show ntp associations
address ref clock st when poll reach delay offset disp
*~192.168.1.3 .LOCL. 1 55 64 377 44.591 -97.671 4.366
* sys.peer, # selected, + candidate, - outlyer, x falseticker, ~ configured
To obtain detailed output of the NTP server associations (including if the server is authenticated), you can issue the show ntp associations detail command, as shown in Example 19-3.
Example 19-3 Verifying Details of the NTP Time Servers Associated with the Client
SW1#show ntp associations detail
192.168.1.3 configured, authenticated, our_master, sane, valid, stratum 1
ref ID .LOCL., time D77C0219.89D511B9 (22:07:21.538 UTC Thu Jul 24 2014)
our mode client, peer mode server, our poll intvl 64, peer poll intvl 64
root delay 0.00 msec, root disp 0.27, reach 377, sync dist 30.35
delay 30.37 msec, offset -101.7186 msec, dispersion 3.11
precision 2**18, version 4
org time D77C021C.E4F5FC74 (22:07:24.894 UTC Thu Jul 24 2014)
rec time D77C021D.0A706F23 (22:07:25.040 UTC Thu Jul 24 2014)
xmt time D77C021C.FC13B398 (22:07:24.984 UTC Thu Jul 24 2014)
filtdelay = 56.03 34.00 37.55 39.02 30.37 36.97 48.39 63.59
filtoffset = -118.38 -102.96 -98.68 -99.64 -101.71 -125.02 -105.19 -102.24
filterror = 0.01 0.95 1.94 2.89 3.88 4.84 5.80 6.74
minpoll = 6, maxpoll = 10
If your client is not synchronizing with the server, you can use the debug ntp all command, as shown in Example 19-4, which will debug NTP, events, core messages, clock adjustments, reference clocks, and packets. As seen on SW1, the debug output shows that an NTP message is sent to the NTP server at 192.168.1.3. If this message does not get a response, synchronization cannot occur. In this case, an NTP message has been received from the server at 192.168.1.3 and is being processed.
Example 19-4 Using Debugs to Troubleshoot NTP Issues
SW1#debug ntp all
NTP events debugging is on
NTP core messages debugging is on
NTP clock adjustments debugging is on
NTP reference clocks debugging is on
NTP packets debugging is on
SW1#
NTP message sent to 192.168.1.3, from interface 'Loopback0' (192.168.1.10).
NTP message received from 192.168.1.3 on interface 'Loopback0' (192.168.1.10).
NTP Core(DEBUG): ntp_receive: message received
NTP Core(DEBUG): ntp_receive: peer is 0x041657A8, next action is 1.
NTP Core(DEBUG): receive: packet given to process_packet
In Example 19-5 the debug ntp all command is displaying that an NTP message is sent to the server at 192.168.1.3 and that the server has sent a response back. However, the NTP message is being dropped because of a crypto-NAK. This means that the authentication parameters do not match between the client and the server. You will need to compare the configurations between the server and the client and make sure the authentication commands match.
Example 19-5 Using debug to Verify NTP Authentication Issues
SW1#debug ntp all
NTP message sent to 192.168.1.3, from interface 'Loopback0' (192.168.1.10).
NTP message received from 192.168.1.3 on interface 'Loopback0' (192.168.1.10).
NTP Core(DEBUG): ntp_receive: message received
NTP Core(DEBUG): ntp_receive: peer is 0x041657A8, next action is 1.
NTP Core(NOTICE): ntp_receive: dropping message: crypto-NAK.
Syslog Troubleshooting
To verify your syslog configuration, confirm logging is enabled, and view the syslog messages stored in the buffer, you use the command show logging, as shown in Example 19-6. When troubleshooting, you need syslog to generate the right type of messages at the right time. By default, console, monitor, and buffer logging display messages with a severity level of debugging (7) and lower. Logging to a server is disabled by default, but once enabled, all severity levels will be sent to the server. Therefore, in all cases if you are not receiving the syslog messages you expect, verify that the correct level is configured. In this example, console and monitor are configured with a level of informational, buffer is configured with a level of debugging, and the trap logging (server) is configured with a level of warnings.
When logging to a server the correct server IP address needs to be specified and the server needs to be reachable. In addition, because syslog uses UDP port 514, it is important to make sure that no ACLs are blocking traffic destined to UDP port 514.
The buffer will have a default size of 8192 bytes. Once the buffer fills up, the older entries are overwritten. Therefore, if you are using the buffer and experiencing a loss of syslog messages, consider increasing the size of the buffer with the logging buffered size command or sending the messages to a syslog server instead.
Finally, if you have remotely connected to a device via Telnet or SSH, and no syslog messages are appearing, it is because the terminal monitor command has not been issued.
Example 19-6 Verifying Syslog Configuration
R4#show logging
Syslog logging: enabled (0 messages dropped, 0 messages rate-limited, 0 flushes, 0
overruns, xml disabled, filtering disabled)
No Active Message Discriminator.
Inactive Message Discriminator:
OSPF severity group drops 4
Console logging: level informational, 116 messages logged, xml disabled,
filtering disabled
Monitor logging: level informational, 0 messages logged, xml disabled,
filtering disabled
Buffer logging: level debugging, 175 messages logged, xml disabled,
filtering disabled
Exception Logging: size (8192 bytes)
Count and timestamp logging messages: disabled
Persistent logging: disabled
No active filter modules.
Trap logging: level warnings, 108 message lines logged
Logging to 10.1.100.100 (udp port 514, audit disabled,
link up),
2 message lines logged,
0 message lines rate-limited,
0 message lines dropped-by-MD,
xml disabled, sequence number disabled
filtering disabled
Logging Source-Interface: VRF Name:
Log Buffer (8192 bytes):
Jul 24 21:54:50.422: %SYS-5-CONFIG_I: Configured from console by console
Jul 24 21:57:16.070: %OSPFv3-4-ERRRCV: OSPFv3-10-IPv6 Received invalid packet: Bad
Checksum from FE80::C829:FFF:FE50:54, GigabitEthernet2/0
Jul 24 21:58:20.014: NTP message received from 192.168.1.10 on interface
'GigabitEthernet2/0' (10.1.34.4).
Jul 24 21:58:20.018: NTP Core(DEBUG): ntp_receive: message received
Jul 24 21:58:20.022: NTP Core(DEBUG): ntp_receive: peer is 0x00000000, next action
is 3.
Jul 24 21:58:20.030: NTP message sent to 192.168.1.10, from interface
'GigabitEthernet2/0' (10.1.34.4).
Jul 24 21:59:25.014: NTP message received from 192.168.1.10 on interface
'GigabitEthernet2/0' (10.1.34.4).
Jul 24 21:59:25.018: NTP Core(DEBUG): ntp_receive: message received
Jul 24 21:59:25.022: NTP Core(DEBUG): ntp_receive: peer is 0x00000000, next action
is 3.
Jul 24 21:59:25.026: NTP message sent to 192.168.1.10, from interface 'GigabitEther-
net2/0' (10.1.34.4).
Having log messages and debug messages stamped with a time is critical for troubleshooting. If no time stamps are included with either, it is because the no service timestamps command has been executed. To configure time stamps, use the service timestamps [debug | log] [datetime |uptime] command. The datetime option will include the date and time the log or debug message occurred. Therefore, it is important to have an accurate calendar and time set. Use NTP for this. The uptime option provides a time stamp based on the amount of time that has passed since the last reboot.
SNMP Troubleshooting
Regardless of whether you are using SNMPv2c or SNMPv3, you need to be able to ping the server from the agent. If Layer 3 connectivity does not exist, the SNMP Network Management Server cannot access the information in the Management Information Base (MIB) on the agent. In addition, SNMP uses UDP port 161 for general messages and UDP port 162 for traps and informs. Therefore, if an ACL is denying these ports, SNMP communication will not occur between the NMS and the agent.
Keep the following few things in mind as you troubleshoot SNMPv2c. Refer to Example 19-7 when reviewing the following list:
![]() Community strings must match: For the NMS to read from or write to the agent, the read community string or the read/write community string must match between the NMS and the agent. In Example 19-7, the read-only community string specified is CISCO.
Community strings must match: For the NMS to read from or write to the agent, the read community string or the read/write community string must match between the NMS and the agent. In Example 19-7, the read-only community string specified is CISCO.
![]() ACLs classifying servers must be correct: If you are using ACLs to define which NMS (based on IP address) is allowed to retrieve objects from the MIB, the ACL has to accurately define the server addresses. In Example 19-7, ACL 10 is only permitting the NMS server with the IP address 10.1.100.100 to read from the MIB using the read-only community string CISCO.
ACLs classifying servers must be correct: If you are using ACLs to define which NMS (based on IP address) is allowed to retrieve objects from the MIB, the ACL has to accurately define the server addresses. In Example 19-7, ACL 10 is only permitting the NMS server with the IP address 10.1.100.100 to read from the MIB using the read-only community string CISCO.
![]() Correct configuration for notifications: If your agent is configured to send traps or informs, you should verify the following:
Correct configuration for notifications: If your agent is configured to send traps or informs, you should verify the following:
1. That traps are enabled.
2. The correct host (NMS) IP address is specified.
3. The correct SNMP version is specified.
4. The correct community string is specified.
5. You specified traps or informs (default is traps).
6. If you did not want all traps to be sent, it is imperative you specified the correct ones you want to send. In Example 19-7, the snmp-server host command indicates that SNMPv2c informs will be sent to the NMS at 10.1.100.100 with a community string of CISCO.
![]() Indexes keep shuffling: To prevent index shuffling and guarantee index persistence during reboots or minor software upgrades, use the snmp-server ifindex persist command, which shows up as snmp ifmib ifindex persist in the running configuration.
Indexes keep shuffling: To prevent index shuffling and guarantee index persistence during reboots or minor software upgrades, use the snmp-server ifindex persist command, which shows up as snmp ifmib ifindex persist in the running configuration.
Example 19-7 SNMPv2c Configuration Sample
R4#show run | section snmp
snmp-server community CISCO RO 10
snmp-server enable traps cpu threshold
snmp-server host 10.1.100.100 informs version 2c CISCO
snmp ifmib ifindex persist
R4#show ip access-lists
Standard IP access list 10
10 permit 10.1.100.100
SNMPv3 offers major improvements over SNMPv2c when it comes to security. It offers improved authentication and encryption. Keep the following few things in mind as you troubleshoot SNMPv3. Refer to Example 19-8 when reviewing the following list:
![]() Nesting of users, views, and groups: With SNMPv3, you create users with authentication and encryption parameters that are nested into groups that define the servers that are allowed to read from or write to the objects within the MIB on the agent. If you fail to nest the users, views, and groups, SNMPv3 will not function as expected. In Example 19-8, the user NMSERVER is nested into the group NMSREADONLY, which allows read-only access to the object identifiers (OIDs) listed in the view MIBACCESS to the NMS with the IP address 10.1.100.100.
Nesting of users, views, and groups: With SNMPv3, you create users with authentication and encryption parameters that are nested into groups that define the servers that are allowed to read from or write to the objects within the MIB on the agent. If you fail to nest the users, views, and groups, SNMPv3 will not function as expected. In Example 19-8, the user NMSERVER is nested into the group NMSREADONLY, which allows read-only access to the object identifiers (OIDs) listed in the view MIBACCESS to the NMS with the IP address 10.1.100.100.
![]() Wrong security level specified: SNMPv3 supports three security levels: noAuthNoPriv, authNoPriv, and authPriv. The security level specified for the group, the users, and for the sending of traps has to match what is used on the server. In Example 19-8, authPriv is being used extensively (with the priv parameter in the commands), which means that authentication and encryption will be used.
Wrong security level specified: SNMPv3 supports three security levels: noAuthNoPriv, authNoPriv, and authPriv. The security level specified for the group, the users, and for the sending of traps has to match what is used on the server. In Example 19-8, authPriv is being used extensively (with the priv parameter in the commands), which means that authentication and encryption will be used.
![]() Wrong hashing algorithm, encryption algorithm, or passwords defined: When authenticating, the hashing algorithm has to match along with the password; otherwise, authentication will fail. When performing encryption, the encryption algorithm and password have to match; otherwise, the NMS will not be able to decrypt the data it receives. In Example 19-8, SHA is being used as the hashing algorithm, AES256 as the encryption algorithm, and MYPASSWORD is the password.
Wrong hashing algorithm, encryption algorithm, or passwords defined: When authenticating, the hashing algorithm has to match along with the password; otherwise, authentication will fail. When performing encryption, the encryption algorithm and password have to match; otherwise, the NMS will not be able to decrypt the data it receives. In Example 19-8, SHA is being used as the hashing algorithm, AES256 as the encryption algorithm, and MYPASSWORD is the password.
![]() Wrong OIDs specified in the view: The views identify the objects within the MIB that the NMS will be able to access. If the wrong objects are defined, SNMPv3 will not produce the desired results. In Example 19-8, the objects sysUpTime, ifAdminStatus, and ifOperStatus are defined in the MIBACCESS view.
Wrong OIDs specified in the view: The views identify the objects within the MIB that the NMS will be able to access. If the wrong objects are defined, SNMPv3 will not produce the desired results. In Example 19-8, the objects sysUpTime, ifAdminStatus, and ifOperStatus are defined in the MIBACCESS view.
![]() Correct configuration for notifications: If your agent is configured to send traps or informs you should verify that traps are enabled, the correct host (NMS) IP address is specified, the correct SNMP version is specified, the correct security level is specified, and you specified trapsor informs (default is traps). If you do not want all traps to be sent, it is imperative that you specify the correct ones. You also need to specify the correct SNMPv3 username for the authentication/encryption process. In Example 19-8, the snmp-server host command indicates that SNMPv3 will send traps related to the CPU to the NMS at 10.1.100.100, with the authentication and encryption provided by the username NMSERVER.
Correct configuration for notifications: If your agent is configured to send traps or informs you should verify that traps are enabled, the correct host (NMS) IP address is specified, the correct SNMP version is specified, the correct security level is specified, and you specified trapsor informs (default is traps). If you do not want all traps to be sent, it is imperative that you specify the correct ones. You also need to specify the correct SNMPv3 username for the authentication/encryption process. In Example 19-8, the snmp-server host command indicates that SNMPv3 will send traps related to the CPU to the NMS at 10.1.100.100, with the authentication and encryption provided by the username NMSERVER.
![]() Indexes keep shuffling: To prevent index shuffling and guarantee index persistence during reboots or minor software upgrades, use the snmp-server ifindex persist command, which shows up as snmp ifmib ifindex persist in the running configuration.
Indexes keep shuffling: To prevent index shuffling and guarantee index persistence during reboots or minor software upgrades, use the snmp-server ifindex persist command, which shows up as snmp ifmib ifindex persist in the running configuration.
Example 19-8 SNMPv3 Configuration Sample
SW2#show run | section snmp
snmp-server group NMSREADONLY v3 priv read MIBACCESS access 99
snmp-server view MIBACCESS sysUpTime included
snmp-server view MIBACCESS ifAdminStatus included
snmp-server view MIBACCESS ifOperStatus included
snmp-server user NMSERVER NMSREADONLY v3 auth sha MYPASSWORD priv aes 256 MYPASSWORD
snmp-server host 10.1.100.100 version 3 priv NMSERVER cpu
snmp ifmib ifindex persist
SW2#show ip access-lists
Standard IP access list 99
10 permit 10.1.100.100
You can verify the configured snmp groups with the show snmp group command. In Example 19-9 the group is NMSREADONLY, the security model is v3 priv (authPriv), the associated read-only view is MIBACCESS, and only servers in access list 99 will be permitted to read the OIDs in the view..
Example 19-9 Verifying SNMP Groups
SW2#show snmp group
groupname: NMSREADONLY security model:v3 priv
contextname: <no context specified> storage-type: nonvolatile
readview : MIBACCESS writeview: <no writeview specified>
notifyview: *tv.00000000.00000000.10000000.0
row status: active access-list: 99
You can verify the configured SNMP users with the show snmp user command. Example 19-10 shows a user named NMSERVER that is using the SHA authentication protocol and the AES256 privacy (encryption) protocol. The user is also associated with the group NMSREADONLY.
Example 19-10 Verifying SNMP Users
SW2#show snmp user
User name: NMSERVER
Engine ID: 800000090300001C57FEF601
storage-type: nonvolatile active
Authentication Protocol: SHA
Privacy Protocol: AES256
Group-name: NMSREADONLY
To verify where traps or informs (notifications) are being sent, use the show snmp host command. In Example 19-11, the notifications are being sent to the NMS at 10.1.100.100 using UDP port 162. The specific notifications are traps, and the username that will be used for authentication and encryption is NMSERVER using the security model v3 priv.
Example 19-11 Verifying SNMP Hosts
SW2#show snmp host
Notification host: 10.1.100.100 udp-port: 162 type: trap
user: NMSERVER security model: v3 priv
You can use the show snmp view command to view the OIDs that are included in each of the views. In Example 19-12, the MIBACCESS view has the OIDs sysUpTime, ifAdminStatus, and ifOperStatus included.
Example 19-12 Verifying SNMP Views
SW2#show snmp view
...output omitted...
cac_view lifEntry.20 - included read-only active
cac_view cciDescriptionEntry.1 - included read-only active
MIBACCESS sysUpTime - included nonvolatile active
MIBACCESS ifAdminStatus - included nonvolatile active
MIBACCESS ifOperStatus - included nonvolatile active
v1default iso - included permanent active
v1default internet - included permanent active
...output omitted...
Management Tools Troubleshooting
The performance of your network is critical. Being able to accurately measure the performance and have statistics that can be used to identify potential issues is the key to having a healthy network. One of the options that Cisco IOS IP SLA offers is the ability to monitor network performance. You can also use it to test reachability, and when it is attached to a tracking object, it can help maintain network availability. Being able to troubleshoot issues related to IP SLA and object tracking is essential.
Another set of tools at your disposal is SPAN and RSPAN. These tools enable you to capture frames as they traverse a switch and send copies to packet-capturing devices for analysis. These tools are valuable, and being able to troubleshoot issues related to them is important because you will likely be using them to troubleshoot other issues.
This section explains how to troubleshoot issues related to IP SLA, object tracking, SPAN, and RSPAN.
Cisco IOS IPSLA Troubleshooting
Cisco IOS IP SLA enables you to measure network performance and test network availability by generating a continuous, reliable probe (simulated traffic) in a predictable manner. The data you can collect varies greatly depending on how you set up the probe. You can collect information about packet loss, one-way latency, response times, jitter, network resource availability, application performance, server response times, and even voice quality.
IP SLA consists of an IP SLA source (sends the probes) and IP SLA responder (replies to the probes). However, both are not needed in all cases. Only the IP SLA source is required all the time. The IP SLA responder is needed only when gathering highly accurate statistics for services that are not offered by any specific destination device. The responder has the ability to respond back to the source with accurate measurements taking into account its own processing time of the probe. Figure 19-1 shows a scenario with just the IP SLA source sending a ping to test connectivity.Figure 19-2 shows a scenario with an IP SLA source and IP SLA responder that is measuring jitter (interpacket delay variance).
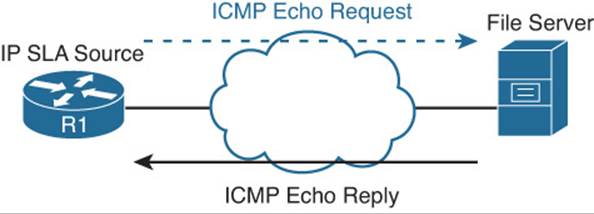
Figure 19-1 IP SLA Source Topology
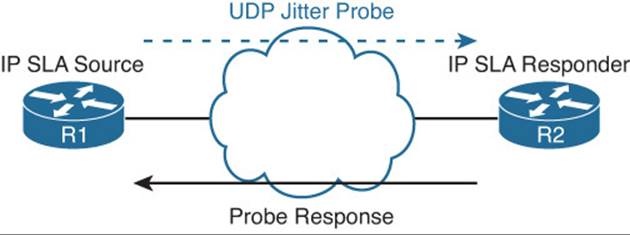
Figure 19-2 IP SLA Source and Responder Topology
Example 19-13 shows a sample configuration based on Figure 19-1. In this example, R1 is configured as an IP SLA source. The probe it is sending is an Internet Control Message Protocol (ICMP) echo (ping) to 10.1.100.100 using the local source address of 192.168.1.11. This probe is being sent every 15 seconds and it will never expire.
Example 19-13 IP SLA ICMP-ECHO Probe Configuration Sample
R1#show run | section sla
ip sla 2
icmp-echo 10.1.100.100 source-ip 192.168.1.11
frequency 15
ip sla schedule 2 life forever start-time now
Example 19-14 shows a sample configuration based on Figure 19-2. In this example, R1 is configured as an IP SLA source. The probe it is sending is testing UDP jitter from the source address 192.168.1.11 to 10.1.34.4 using port 65051. It will send 20 probe packets for each test with a size of 160 bytes each and repeat this every 30 seconds. The probe is started and will never expire. To get measurements related to jitter, you need to have a device that can process the probes and respond accordingly. Therefore, the destination device needs to be able to support Cisco IOS IP SLA and be configured as a responder. R2 is configured as the IP SLA responder.
Example 19-14 IP SLA UDP-JITTER Probe Configuration Sample
R1#show run | section sla
ip sla 1
udp-jitter 10.1.34.4 65051 source-ip 192.168.1.11 num-packets 20
request-data-size 160
frequency 30
ip sla schedule 1 life forever start-time now
R2#show run | section sla
ip sla responder
When troubleshooting Cisco IOS IP SLA, consider the following:
![]() The correct operation needs to be chosen based on the metrics you intend to measure.
The correct operation needs to be chosen based on the metrics you intend to measure.
![]() The destination IP address needs to be reachable and correctly defined.
The destination IP address needs to be reachable and correctly defined.
![]() The source IP address needs to be reachable from the destination and correctly defined.
The source IP address needs to be reachable from the destination and correctly defined.
![]() Any necessary port numbers need to be correctly identified.
Any necessary port numbers need to be correctly identified.
![]() The SLA instance needs to be started for it to work.
The SLA instance needs to be started for it to work.
![]() If the operation needs an IP SLA responder, one has to be configured and reachable.
If the operation needs an IP SLA responder, one has to be configured and reachable.
To verify which operations are supported on the platform in addition to how many operations are configured and how many are currently active, use the show ip sla application command, as shown in Example 19-15.
Example 19-15 Output of show ip sla application
R1#show ip sla application
IP Service Level Agreements
Version: Round Trip Time MIB 2.2.0, Infrastructure Engine-III
Supported Operation Types:
icmpEcho, path-echo, path-jitter, udpEcho, tcpConnect, http
dns, udpJitter, dhcp, ftp, lsp Group, lspPing, lspTrace
802.1agEcho VLAN, EVC, Port, 802.1agJitter VLAN, EVC, Port
pseudowirePing, udpApp, wspApp
Supported Features:
IPSLAs Event Publisher
IP SLAs low memory water mark: 30919230
Estimated system max number of entries: 22645
Estimated number of configurable operations: 22643
Number of Entries configured : 2
Number of active Entries : 2
Number of pending Entries : 0
Number of inactive Entries : 0
Time of last change in whole IP SLAs: 09:29:04.789 UTC Sat Jul 26 2014
To verify the configuration values for each IP SLA instance as well as the default values that you did not modify, use the show ip sla configuration command, as shown in Example 19-16. In this example, there are two entries (instances): number 1 and number 2. You can verify for each entry the type of operation that is being performed, the operation timeout, the source and destination address, the source and destination port, type of service values, packet size, packet interval (if operation supports it), and the schedule that has been configured for the operation. In this case, both entry 1 and 2 are started, and they will never expire.
Example 19-16 Output of show ip sla configuration
R1#show ip sla configuration
IP SLAs Infrastructure Engine-III
Entry number: 1
Owner:
Tag:
Operation timeout (milliseconds): 5000
Type of operation to perform: udp-jitter
Target address/Source address: 10.1.34.4/192.168.1.11
Target port/Source port: 65051/0
Type Of Service parameter: 0x0
Request size (ARR data portion): 160
Packet Interval (milliseconds)/Number of packets: 20/20
Verify data: No
Vrf Name:
Control Packets: enabled
Schedule:
Operation frequency (seconds): 30 (not considered if randomly scheduled)
Next Scheduled Start Time: Start Time already passed
Group Scheduled : FALSE
Randomly Scheduled : FALSE
Life (seconds): Forever
Entry Ageout (seconds): never
Recurring (Starting Everyday): FALSE
Status of entry (SNMP RowStatus): Active
Threshold (milliseconds): 5000
Distribution Statistics:
Number of statistic hours kept: 2
Number of statistic distribution buckets kept: 1
Statistic distribution interval (milliseconds): 20
Enhanced History:
Entry number: 2
Owner:
Tag:
Operation timeout (milliseconds): 5000
Type of operation to perform: icmp-echo
Target address/Source address: 10.1.100.100/192.168.1.11
Type Of Service parameter: 0x0
Request size (ARR data portion): 28
Verify data: No
Vrf Name:
Schedule:
Operation frequency (seconds): 15 (not considered if randomly scheduled)
Next Scheduled Start Time: Start Time already passed
Group Scheduled : FALSE
Randomly Scheduled : FALSE
Life (seconds): Forever
Entry Ageout (seconds): never
Recurring (Starting Everyday): FALSE
Status of entry (SNMP RowStatus): Active
Threshold (milliseconds): 5000
Distribution Statistics:
Number of statistic hours kept: 2
Number of statistic distribution buckets kept: 1
Statistic distribution interval (milliseconds): 20
Enhanced History:
History Statistics:
Number of history Lives kept: 0
Number of history Buckets kept: 15
History Filter Type: None
To display the results of the IP SLA operations and the statistics collected, use the show ip sla statistics command, as shown in Example 19-17. In the output, you can verify the type of operation, when it last started, the latest return code, the values returned (depending on the operation), and the number of successes and failures.
Example 19-17 Output of show ip sla statistics
R1#show ip sla statistics
IPSLAs Latest Operation Statistics
IPSLA operation id: 1
Type of operation: udp-jitter
Latest RTT: 53 milliseconds
Latest operation start time: 09:52:23 UTC Sat Jul 26 2014
Latest operation return code: OK
RTT Values:
Number Of RTT: 17 RTT Min/Avg/Max: 46/53/66 milliseconds
Latency one-way time:
Number of Latency one-way Samples: 0
Source to Destination Latency one way Min/Avg/Max: 0/0/0 milliseconds
Destination to Source Latency one way Min/Avg/Max: 0/0/0 milliseconds
Jitter Time:
Number of SD Jitter Samples: 14
Number of DS Jitter Samples: 14
Source to Destination Jitter Min/Avg/Max: 1/7/13 milliseconds
Destination to Source Jitter Min/Avg/Max: 1/6/13 milliseconds
Packet Loss Values:
Loss Source to Destination: 0
Source to Destination Loss Periods Number: 0
Source to Destination Loss Period Length Min/Max: 0/0
Source to Destination Inter Loss Period Length Min/Max: 0/0
Loss Destination to Source: 3
Destination to Source Loss Periods Number: 2
Destination to Source Loss Period Length Min/Max: 1/2
Destination to Source Inter Loss Period Length Min/Max: 1/9
Out Of Sequence: 0 Tail Drop: 0
Packet Late Arrival: 0 Packet Skipped: 0
Voice Score Values:
Calculated Planning Impairment Factor (ICPIF): 0
Mean Opinion Score (MOS): 0
Number of successes: 61
Number of failures: 0
Operation time to live: Forever
IPSLA operation id: 2
Latest RTT: 1 milliseconds
Latest operation start time: 09:52:49 UTC Sat Jul 26 2014
Latest operation return code: OK
Number of successes: 95
Number of failures: 1
Operation time to live: Forever
To verify the operation of the IP SLA responder, use the command show ip sla responder, as shown in Example 19-18, on the Cisco IOS device acting as the responder. You can verify the general control port number, the total number of probes received, the number of errors, and the recent sources of IP SLA probes.
Example 19-18 Output of show ip sla responder
R2#show ip sla responder
General IP SLA Responder on Control port 1967
General IP SLA Responder is: Enabled
Number of control message received: 2333 Number of errors: 0
Recent sources:
192.168.1.11 [09:53:52.001 UTC Sat Jul 26 2014]
192.168.1.11 [09:53:22.033 UTC Sat Jul 26 2014]
192.168.1.11 [09:52:52.029 UTC Sat Jul 26 2014]
192.168.1.11 [09:52:22.049 UTC Sat Jul 26 2014]
192.168.1.11 [09:51:52.029 UTC Sat Jul 26 2014]
Recent error sources:
Permanent Port IP SLA Responder
Permanent Port IP SLA Responder is: Disabled
udpEcho Responder:
IP Address Port
Example 19-19 shows real-time output of an SLA operation with the debug ip sla trace 2 command. The debug is displaying a successful trace of the IP SLA instance 2. The operation is waking up, starting, sending the probe, receiving a response, and then the statistics are updated accordingly.
Example 19-19 Debug Displaying a Successful IP SLA Operation
R1#debug ip sla trace 2
IPSLA-INFRA_TRACE:OPER:2 slaSchedulerEventWakeup
IPSLA-INFRA_TRACE:OPER:2 Starting an operation
IPSLA-OPER_TRACE:OPER:2 source IP:192.168.1.11
IPSLA-OPER_TRACE:OPER:2 Starting icmpecho operation - destAddr=10.1.100.100,
sAddr=192.168.1.11
IPSLA-OPER_TRACE:OPER:2 Sending ID: 113
IPSLA-OPER_TRACE:OPER:2 ID:113, RTT=1
IPSLA-INFRA_TRACE:OPER:2 Updating result
Example 19-20 shows real-time output of an SLA operation with the debug ip sla trace 2 command. The debug is displaying an unsuccessful trace of the IP SLA instance 2. You can see that the operation timed out between the source IP 192.168.1.11 and the destination IP 10.1.100.100. The results are then updated accordingly in the SLA statistics. This confirms that the IP SLA operation was not successful.
Example 19-20 Debug Displaying an Unsuccessful IP SLA Operation
R1#debug ip sla trace 2
IPSLA-INFRA_TRACE:OPER:2 slaSchedulerEventWakeup
IPSLA-INFRA_TRACE:OPER:2 Starting an operation
IPSLA-OPER_TRACE:OPER:2 source IP:192.168.1.11
IPSLA-OPER_TRACE:OPER:2 Starting icmpecho operation - destAddr=10.1.100.100,
sAddr=192.168.1.11
IPSLA-OPER_TRACE:OPER:2 Sending ID: 205
IPSLA-OPER_TRACE:OPER:2 Timeout - destAddr=10.1.100.100, sAddr=192.168.1.11
IPSLA-INFRA_TRACE:OPER:2 Updating result
Object Tracking Troubleshooting
Object tracking enables you to dynamically control what will occur if the result of the tracking object is up or down. For example, you can attach an object to a static route; if the object is up, the route is installed in the routing table. If the object is down, the route will not be installed in the routing table. With first-hop redundancy protocols (FHRPs), you can decrement or increment the priority based on the status of the object. For example, if the status of the tracking object is down, the FHRP priority is decremented.
With object tracking, you can track IP routes, IP SLA instances, interfaces, and groups of objects. For example, you can track an IP SLA instance that is using ICMP echoes. If the echo fails, the IP SLA instances fails, which brings the tracking object down. If the tracking object is tied to an FHRP, the priority is decremented, if the tracking object is tied to a static route, the static route is removed from the routing table.
To verify the configuration of a tracking object and the status of the tracking object, use the show track command. In Example 19-21 tracking object 1 exists on SW1. It is tracking the reachability of an IP route, 10.1.43.0/24. If the route is in the routing table, the object is up. If the route is not in the routing table, the object is down. The object is attached to (Tracked by:) HSRP Group 10.
Example 19-21 Verifying the Configuration and Status of a Tracking Object (Up)
SW1#show track
Track 1
IP route 10.1.43.0 255.255.255.0 reachability
Reachability is Up (EIGRP)
1 change, last change 00:01:55
First-hop interface is GigabitEthernet1/0/10
Tracked by:
HSRP Vlan10 10
In Example 19-22, the tracking object is down because the route to 10.1.43.0/24 is no longer in the routing table. Because it is attached to HSRP Group 10, an action based on the configuration of HSRP Group 10 would occur, such as decrementing the local HSRP priority.
Example 19-22 Verifying the Configuration and Status of a Tracking Object (Down)
SW1#
%TRACKING-5-STATE: 1 ip route 10.1.43.0/24 reachability Up->Down
SW1#show track
Track 1
IP route 10.1.43.0 255.255.255.0 reachability
Reachability is Down (no route)
2 changes, last change 00:00:04
First-hop interface is unknown
Tracked by:
HSRP Vlan10 10
SPAN and RSPAN Troubleshooting
SPAN and RSPAN enable you to take ingress/egress frames on a switchport, copy them, and send them to another port that has a management station running packet-capturing software attached.
With SPAN, you copy traffic from a source port on one switch to a destination port on the same switch, as shown in Figure 19-3. With RSPAN, you copy traffic from a source port on one switch to the destination port on a different switch, as shown in Figure 19-4.
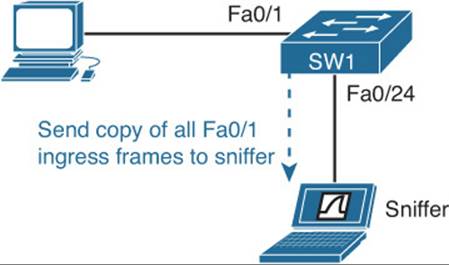
Figure 19-3 SPAN Topology
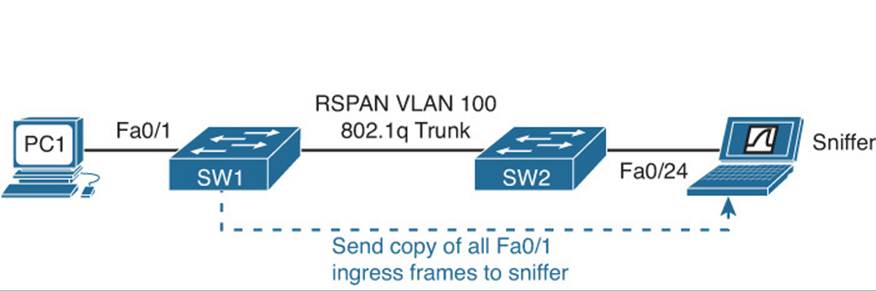
Figure 19-4 RSPAN Topology
Example 19-23 displays the configuration needed to successfully configure SPAN on SW1 in Figure 19-3. Troubleshooting issues will be minor for SPAN. Consider the following while troubleshooting SPAN issues:
![]() The source and destination session numbers must match to be part of the same SPAN session.
The source and destination session numbers must match to be part of the same SPAN session.
![]() The source interface/VLAN and destination interfaces have to be correctly identified.
The source interface/VLAN and destination interfaces have to be correctly identified.
![]() The direction of captured packets has to be correctly defined. (Default is both ingress and egress.)
The direction of captured packets has to be correctly defined. (Default is both ingress and egress.)
![]() The interfaces have to be up/up.
The interfaces have to be up/up.
Example 19-23 Sample SPAN Configuration
SW1#show run | section monitor
monitor session 1 source interface Fa0/1 rx
monitor session 1 destination interface Fa0/24
Example 19-24 displays the configuration needed to successfully configure RSPAN on SW1 and SW2 in Figure 19-4. Troubleshooting issues are more difficult for RSPAN. Consider the following while troubleshooting RSPAN issues:
![]() The source and destination session numbers must match locally to be part of the same RSPAN session. However, they do not have to match with the session numbers used on the remote switch.
The source and destination session numbers must match locally to be part of the same RSPAN session. However, they do not have to match with the session numbers used on the remote switch.
![]() The source interface/VLAN and destination interface/vlan have to be correctly identified.
The source interface/VLAN and destination interface/vlan have to be correctly identified.
![]() The direction of captured packets has to be correctly defined. (Default is both ingress and egress.)
The direction of captured packets has to be correctly defined. (Default is both ingress and egress.)
![]() The interfaces have to be up/up.
The interfaces have to be up/up.
![]() The RSPAN VLAN must be configured and identified as an RSPAN VLAN.
The RSPAN VLAN must be configured and identified as an RSPAN VLAN.
![]() The RSPAN VLAN must be allowed across the trunk link (not pruned).
The RSPAN VLAN must be allowed across the trunk link (not pruned).
![]() STP cannot be blocking the RSPAN VLAN.
STP cannot be blocking the RSPAN VLAN.
Example 19-24 Sample RSPAN Configuration
SW1#show run | section monitor
vlan 100
name REMOTESPAN
remote-span
monitor session 1 source interface fa0/1 rx
monitor session 1 destination remote vlan 100
SW2#show run | section monitor
vlan 100
name REMOTESPAN
remote-span
monitor session 1 source remote vlan 100
monitor session 1 destination interface fa0/24
To verify the SPAN or RSPAN sessions, use the command show monitor, as shown in Example 19-25. In this example, SW1 has an RSPAN session with an ID of 1 capturing frames ingress only on Fa0/1 and copying them to the RSPAN VLAN 100. SW2 has an RSPAN session with an ID of 1 capturing frames on the RSPAN VLAN 100 and sending them out Fa0/24. Using the show monitor detail command will display all the configured and nonconfigured parameters.
Example 19-25 Verifying SPAN and RSPAN Sessions with show monitor Command
SW1#show monitor
Session 1
---------
Type : Remote Source Session
Source Ports :
RX Only : Fa0/1
Dest RSPAN VLAN : 100
SW2#show monitor
Session 1
---------
Type : Remote Destination Session
Source RSPAN VLAN : 100
Destination Ports : Fa0/24
Encapsulation : Native
Ingress : Disabled
To verify RSPAN VLANs, use the command show vlan remote-span, as shown in Example 19-26. In this case, the remote span VLAN is 100.
Example 19-26 Verifying RSPAN VLANs
SW1#show vlan remote-span
Remote SPAN VLANs
------------------------------------------------------------------------------
100
To verify whether an interface is configured as a destination SPAN port, use the command show interfaces status, as shown in Example 19-27. In this output, you can see that interface Fa0/24 on SW2 is in the monitoring status; therefore, it is no longer a normal switchport, and only monitored traffic will pass through it.
Example 19-27 Verifying Destination SPAN/RSPAN Ports
SW2#show interfaces status | i Port|Fa0/24
Port Name Status Vlan Duplex Speed Type
Fa0/24 monitoring 1 a-full a-100 10/100BaseTX
Management Protocols and Tools Trouble Tickets
This section presents various trouble tickets relating to the topics discussed earlier in the chapter. The purpose of these trouble tickets is to give a process that you can follow when troubleshooting in the real world or in an exam environment. All trouble tickets in this section are based on the topology depicted in Figure 19-5.
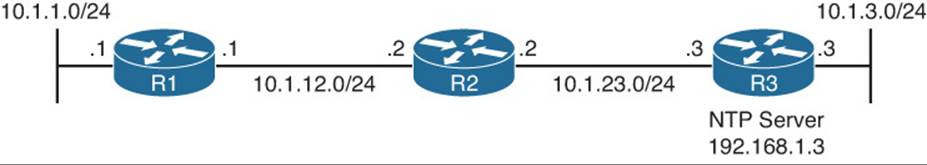
Figure 19-5 Management Protocols and Services Trouble Tickets Topology
Trouble Ticket 19-1
Problem: Router R1 is not synchronizing its local time with the NTP server (R3) at 192.168.1.3.
You begin troubleshooting by verifying the problem with the show ntp status command. Example 19-28 confirms that the clock is not synchronized. The stratum is also 16, which means unreachable.
Example 19-28 Verifying NTP Status on R1
R1#show ntp status
Clock is unsynchronized, stratum 16, reference is 65.85.84.72
nominal freq is 250.0000 Hz, actual freq is 250.0000 Hz, precision is 2**18
ntp uptime is 82600 (1/100 of seconds), resolution is 4000
reference time is D7811765.F28B7F98 (18:39:33.947 UTC Mon Jul 28 2014)
clock offset is 0.0000 msec, root delay is 0.00 msec
root dispersion is 2.44 msec, peer dispersion is 15937.50 msec
loopfilter state is 'CTRL' (Normal Controlled Loop), drift is -0.000000007 s/s
system poll interval is 64, last update was 678 sec ago.
Next you check whether the NTP server is reachable. You use the command ping 192.168.1.3, as shown in Example 19-29. In this example, the ping is successful.
Example 19-29 Testing Connectivity to NTP Server with Ping
R1#ping 192.168.1.3
Type escape sequence to abort.
Sending 5, 100-byte ICMP Echos to 192.168.1.3, timeout is 2 seconds:
!!!!!
Success rate is 100 percent (5/5), round-trip min/avg/max = 36/52/64 ms
You access R3 and issue the show ntp status command to determine whether NTP is running. It is running, as shown in the output of Example 19-30. R3 is synchronized and has a stratum level of 1. It is referencing itself.
Example 19-30 Verifying That NTP Is Operational on R3
R3#show ntp status
Clock is synchronized, stratum 1, reference is .LOCL.
nominal freq is 250.0000 Hz, actual freq is 250.0000 Hz, precision is 2**16
ntp uptime is 1209300 (1/100 of seconds), resolution is 4000
reference time is D7811D8F.7696A1E4 (19:05:51.463 UTC Mon Jul 28 2014)
clock offset is 0.0000 msec, root delay is 0.00 msec
root dispersion is 0.42 msec, peer dispersion is 0.24 msec
loopfilter state is 'CTRL' (Normal Controlled Loop), drift is 0.000000000 s/s
system poll interval is 16, last update was 12 sec ago.
You decide to check whether an ACL is blocking NTP port 123. Back on R1, you use an extended traceroute, as shown in Example 19-31. You source the trace from 10.1.12.1 and specify a destination of 192.168.1.3. You also include the port number 123 for NTP. The result of the trace shows that at the hop 10.1.23.3 the trace is being administratively prohibited. In other words, it is being blocked by an ACL.
Example 19-31 Using a Trace to Determine Where Packets Fail
R1#traceroute
Protocol [ip]: ip
Target IP address: 192.168.1.3
Source address: 10.1.12.1
Numeric display [n]:
Timeout in seconds [3]:
Probe count [3]:
Minimum Time to Live [1]:
Maximum Time to Live [30]:
Port Number [33434]: 123
Loose, Strict, Record, Timestamp, Verbose[none]:
Type escape sequence to abort.
Tracing the route to 192.168.1.3
VRF info: (vrf in name/id, vrf out name/id)
1 10.1.12.2 48 msec * 40 msec
2 10.1.23.3 !A !A !A
The IP address 10.1.23.3 belongs to R3 according to Figure 19-5. Therefore, you access R3 and issue the show ip interface brief command and note that interface Gig1/0 is using that IP address, as shown in Example 19-32.
Example 19-32 Verifying IP Address Assignment
R3#show ip interface brief
Interface IP-Address OK? Method Status Protocol
GigabitEthernet0/0 10.1.3.3 YES NVRAM up up
GigabitEthernet1/0 10.1.23.3 YES NVRAM up up
Loopback0 192.168.1.3 YES NVRAM up up
You issue the command show ip interface gigabitethernet1/0 and notice that ACL 100 is applied inbound on Gig1/0, as shown in Example 19-33.
Example 19-33 Verifying ACLs on Gig1/0
R3#show ip interface gigabitEthernet 1/0
GigabitEthernet1/0 is up, line protocol is up
Internet address is 10.1.23.3/24
...output omitted...
Multicast reserved groups joined: 224.0.0.10
Outgoing access list is not set
Inbound access list is 100
Proxy ARP is enabled
Local Proxy ARP is disabled
...output omitted...
Examining the output of show access-list 100 in Example 19-34 shows that ACL 100 is blocking NTP packets and permitting all other packets.
Example 19-34 Verifying ACL 100 Configuration
R3#show access-lists 100
Extended IP access list 100
10 deny udp any any eq ntp (23 matches)
20 permit ip any any (819 matches)
Because ACL 100 is only blocking NTP packets while permitting all other packets, and you need NTP packets to be permitted, you decide to remove the ACL from the interface with the no ip access-group 100 in command in interface configuration mode on R3, as shown in 19-35.
Example 19-35 Removing ACL from Interface and Verifying That It Is Removed
R3#config t
Enter configuration commands, one per line. End with CNTL/Z.
R3(config)#int gig 1/0
R3(config-if)#no ip access-group 100 in
R3(config-if)#end
R3#show ip interface gig1/0
GigabitEthernet1/0 is up, line protocol is up
Internet address is 10.1.23.3/24
...output omitted...
Multicast reserved groups joined: 224.0.0.10
Outgoing access list is not set
Inbound access list is not set
Proxy ARP is enabled
Local Proxy ARP is disabled
...output omitted...
Now you go back to R1 and issue the traceroute command again, as shown in Example 19-36. In this case, it is successful.
Example 19-36 Using a Trace to Determine Whether Packets Still Fail
R1#traceroute
Protocol [ip]: ip
Target IP address: 192.168.1.3
Source address: 10.1.12.1
Numeric display [n]:
Timeout in seconds [3]:
Probe count [3]:
Minimum Time to Live [1]:
Maximum Time to Live [30]:
Port Number [33434]: 123
Loose, Strict, Record, Timestamp, Verbose[none]:
Type escape sequence to abort.
Tracing the route to 192.168.1.3
VRF info: (vrf in name/id, vrf out name/id)
1 10.1.12.2 48 msec * 40 msec
2 10.1.23.3 48 msec * 40 msec
You issue the show ntp status command again, as shown in Example 19-37, and notice that the problem is not solved. R1 is still not synchronized.
Example 19-37 Verifying NTP Status on R1 After an ACL Is Removed
R1#show ntp status
Clock is unsynchronized, stratum 16, reference is 65.85.84.72
nominal freq is 250.0000 Hz, actual freq is 250.0000 Hz, precision is 2**18
ntp uptime is 379600 (1/100 of seconds), resolution is 4000
reference time is D7811765.F28B7F98 (18:39:33.947 UTC Mon Jul 28 2014)
clock offset is 0.0000 msec, root delay is 0.00 msec
root dispersion is 46.99 msec, peer dispersion is 15937.50 msec
loopfilter state is 'CTRL' (Normal Controlled Loop), drift is -0.000000007 s/s
system poll interval is 64, last update was 3648 sec ago.
You now decide to check the NTP configuration on R1 and R3, as shown in Example 19-38. The first thing you notice is that R1 is configured with the ntp server command and that it is pointing to the correct address but the authentication key is incorrect when compared to the ntp trusted key command or the authentication key that is being used by R3. Therefore, the key should be 13 in this case, not 12. To fix this issue, you use the command no ntp server 192.168.1.3 key 12 and issue the command ntp server 192.168.1.3 key 13, as shown in Example 19-39.
Example 19-38 Verifying NTP Configuration
R1#show run | section ntp
ntp authentication-key 13 md5 030752180500 7
ntp authenticate
ntp trusted-key 13
ntp server 192.168.1.3 key 12
R3#show run | section ntp
ntp authentication-key 13 md5 00071A150754 7
ntp authenticate
ntp trusted-key 13
ntp source Loopback0
ntp access-group serve-only 10
ntp master 1
Example 19-39 Adjusting NTP Configuration
R1#config t
Enter configuration commands, one per line. End with CNTL/Z.
R1(config)#no ntp server 192.168.1.3 key 12
R1(config)#ntp server 192.168.1.3 key 13
R1(config)#end
To verify that the problem is solved you issue the command show ntp status. As shown in Example 19-40, the problem is still not solved. R1 is still not synchronized.
Example 19-40 Verifying That the Problem Is Solved
R1#show ntp status
Clock is unsynchronized, stratum 16, reference is 73.78.73.84
nominal freq is 250.0000 Hz, actual freq is 250.0000 Hz, precision is 2**18
ntp uptime is 447000 (1/100 of seconds), resolution is 4000
reference time is D7811765.F28B7F98 (18:39:33.947 UTC Mon Jul 28 2014)
clock offset is 0.0000 msec, root delay is 0.00 msec
root dispersion is 2.62 msec, peer dispersion is 15937.50 msec
loopfilter state is 'CTRL' (Normal Controlled Loop), drift is -0.000000007 s/s
system poll interval is 64, last update was 4322 sec ago.
You decide to enable debugging with the debug ntp all command on R1. The debug output shows that NTP packets are being sent but not received in Example 19-41. You issue the same command on R3, as shown in Example 19-42. In this case, R3 is receiving them but not responding. It states, dropping message: RES_DONTSERVE restriction. This indicates that there is an NTP access group on R3.
Example 19-41 Debugging NTP Packets on R1
R1#debug ntp all
NTP events debugging is on
NTP core messages debugging is on
NTP clock adjustments debugging is on
NTP reference clocks debugging is on
NTP packets debugging is on
R1#
.Jul 28 20:12:34.960: NTP message sent to 192.168.1.3, from interface
'GigabitEthernet1/0' (10.1.12.1).
Example 19-42 Debugging NTP Packets on R3
R3#debug ntp all
NTP message received from 10.1.12.1 on interface 'Loopback0' (192.168.1.3).
NTP Core(DEBUG): ntp_receive: message received
NTP Core(NOTICE): ntp_receive: dropping message: RES_DONTSERVE restriction.
Reviewing the NTP configuration on R1 and R3 again, as shown in Example 19-43, you notice that there is an NTP access group configured that will only respond to NTP packets sourced from IP addresses listed in ACL 10. You issue the command show access-list 10 and note that only NTP packets sourced with an IP from 192.168.1.0 to 192.168.1.255 are permitted. Reviewing the configuration on R1 indicates that packets will be sourced with the IP address of the interface the packets will be sent from. Therefore, you need to include the ntp source command on R1 to control the source IP address of the packets.
Example 19-43 Reviewing NTP Configuration
R1#show run | section ntp
ntp authentication-key 13 md5 030752180500 7
ntp authenticate
ntp trusted-key 13
ntp server 192.168.1.3 key 13
R3#show run | section ntp
ntp authentication-key 13 md5 00071A150754 7
ntp authenticate
ntp trusted-key 13
ntp source Loopback0
ntp access-group serve-only 10
ntp master 1
R3#show access-lists 10
Standard IP access list 10
10 permit 192.168.1.0, wildcard bits 0.0.0.255 (289 matches)
On R1, you issue the show ip interface brief command, as shown in Example 19-44, and notice that interface Loopback 0 is using the IP address 192.168.1.1. Therefore, on R1, you issue the command ntp source loopback0, as also seen in Example 19-44.
Example 19-44 Adding the NTP Source Command to R1
R1#show ip interface brief
Interface IP-Address OK? Method Status Protocol
FastEthernet0/0 unassigned YES NVRAM administratively down down
GigabitEthernet0/0 10.1.1.0 YES NVRAM up up
GigabitEthernet1/0 10.1.12.1 YES NVRAM up up
Loopback0 192.168.1.1 YES manual up up
R1#config t
Enter configuration commands, one per line. End with CNTL/Z.
R1(config)#ntp source loopback 0
Now you issue the command show ntp status, as shown in Example 19-45, on R1, and the clock is synchronized with the NTP server at 192.168.1.3. Using the command show ntp association detail, you confirm that authentication was successful as well. (Note that the clocks can take some time to synchronize; it is not immediate.)
Example 19-45 Verifying the Issue Is Solved
R1#show ntp status
Clock is synchronized, stratum 2, reference is 192.168.1.3
nominal freq is 250.0000 Hz, actual freq is 249.9966 Hz, precision is 2**18
ntp uptime is 549900 (1/100 of seconds), resolution is 4016
reference time is D7812C43.F6589518 (20:08:35.962 UTC Mon Jul 28 2014)
clock offset is 74.6174 msec, root delay is 19.98 msec
root dispersion is 111.38 msec, peer dispersion is 1.49 msec
loopfilter state is 'CTRL' (Normal Controlled Loop), drift is 0.000013584 s/s
system poll interval is 64, last update was 9 sec ago.
R1#show ntp associations detail
192.168.1.3 configured, ipv4, authenticated, our_master, sane, valid, stratum 1
ref ID .LOCL., time D7812C3F.7685D321 (20:08:31.462 UTC Mon Jul 28 2014)
our mode client, peer mode server, our poll intvl 64, peer poll intvl 64
...output omitted...
Exam Preparation Tasks
As mentioned in the section “How to Use This Book” in the Introduction, you have a couple of choices for exam preparation: the exercises here; Chapter 22, “Final Preparation;” and the exam simulation questions on the CD-ROM.
Review All Key Topics
Review the most important topics in this chapter, noted with the Key Topic icon in the outer margin of the page. Table 19-2 lists a reference of these key topics and the page numbers on which each is found.
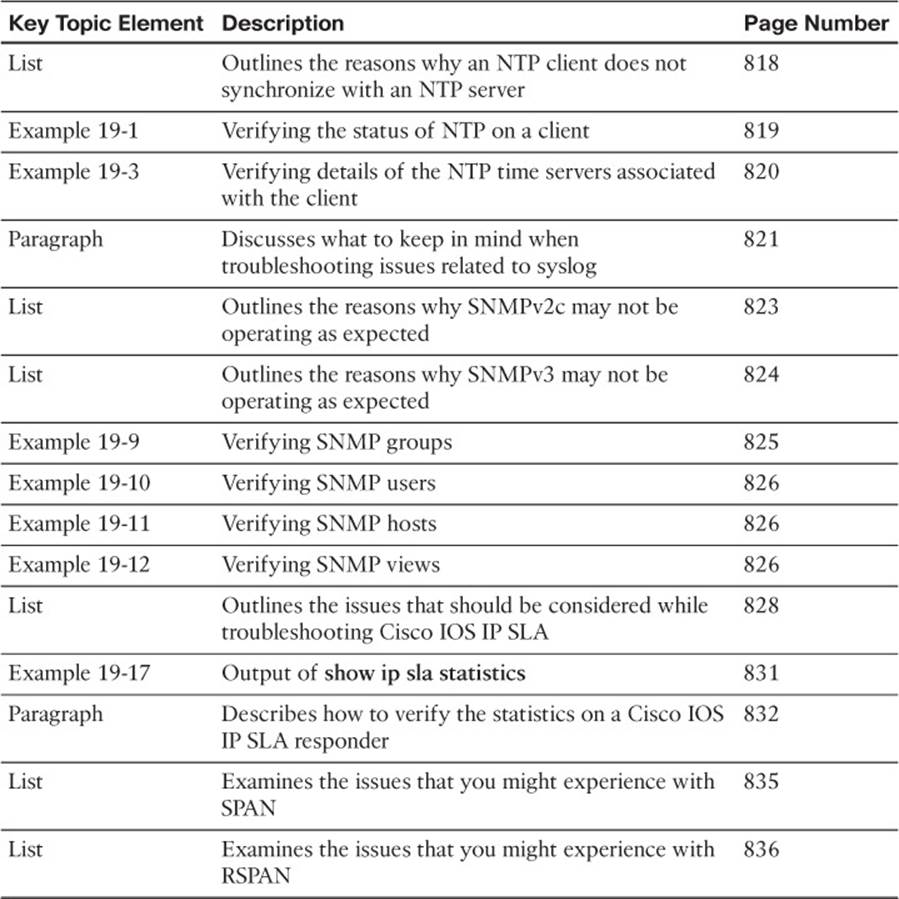
Table 19-2 Key Topics for Chapter 19
Define Key Terms
Define the following key terms from this chapter and check your answers in the glossary:
NTP
NTP server
NTP client
stratum
syslog
SNMPv2c
SNMPv3
community string
traps
informs
NMS
noAuthNoPriv
authNoPriv
authPriv
OID
SNMP view
IP SLA
IP SLA source
IP SLA responder
object tracking
SPAN
RSPAN
sniffer
Command Reference to Check Your Memory
This section includes the most important show and debug commands covered in this chapter. It might not be necessary to memorize the complete syntax of every command, but you should be able to remember the basic keywords that are needed.
To test your memory of the commands, cover the right side of Table 19-3 with a piece of paper, read the description on the left side, and then see how much of the command you can remember.
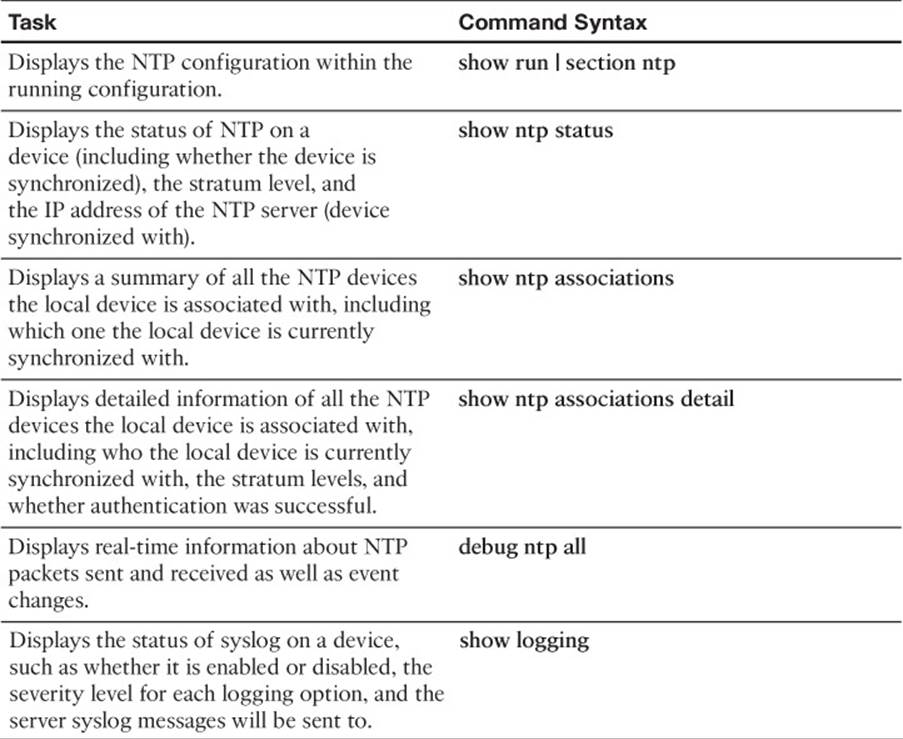
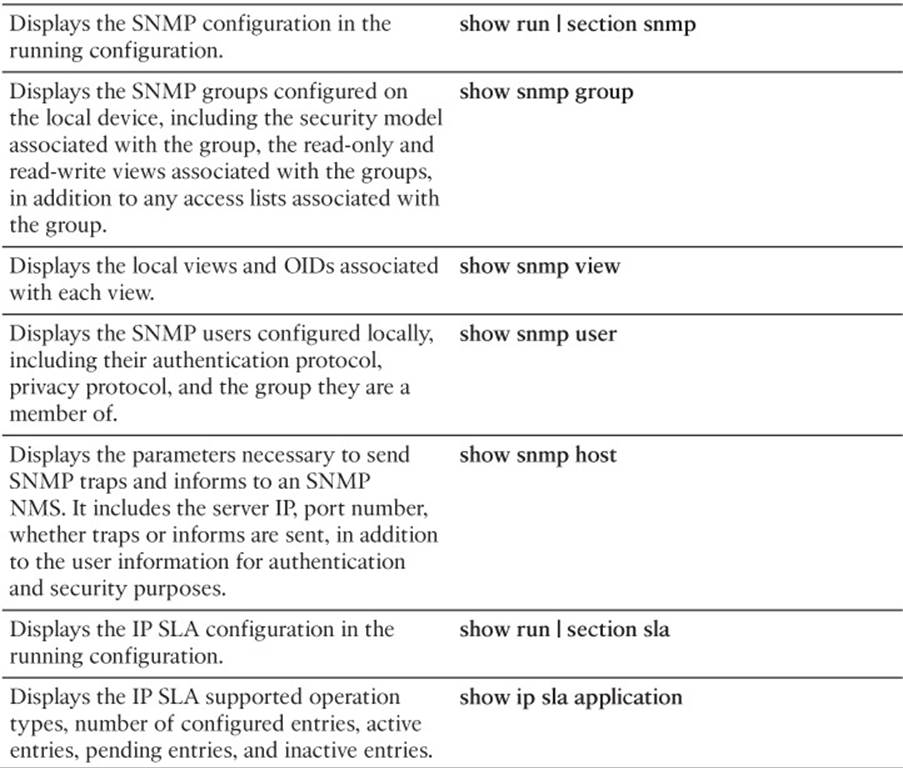
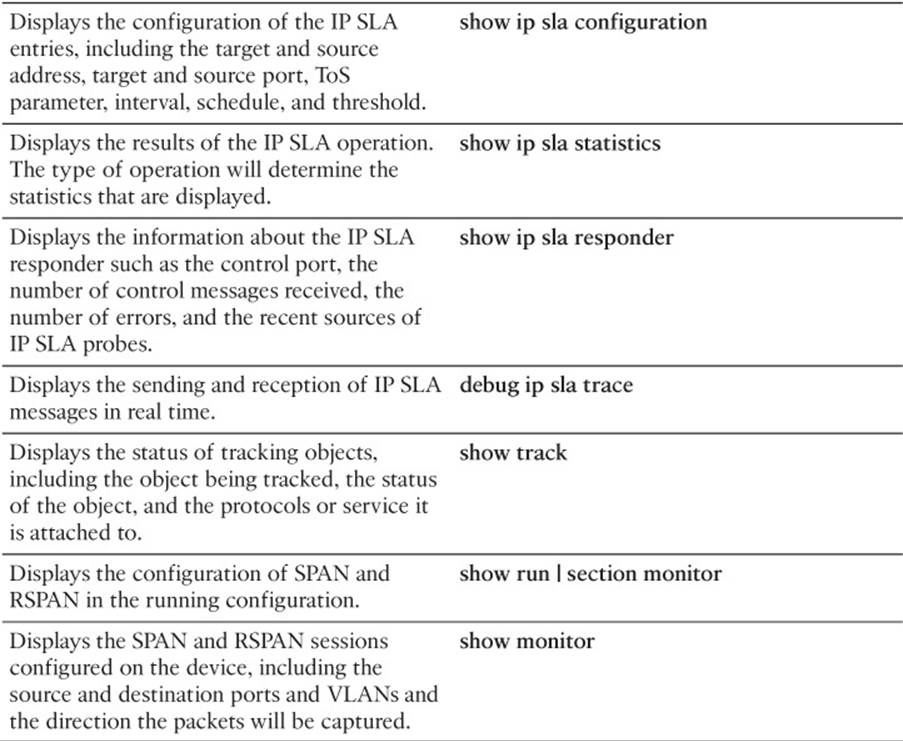
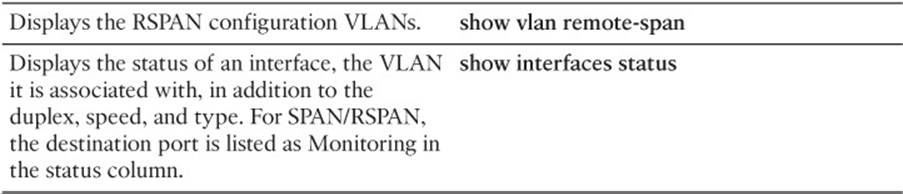
Table 19-3 show and debug Commands
The 300-135 TSHOOT exam focuses on practical, hands-on skills that are used by a networking professional. Therefore, you should be able to identify the commands needed to successfully troubleshoot the topics and concepts covered in this chapter.
All materials on the site are licensed Creative Commons Attribution-Sharealike 3.0 Unported CC BY-SA 3.0 & GNU Free Documentation License (GFDL)
If you are the copyright holder of any material contained on our site and intend to remove it, please contact our site administrator for approval.
© 2016-2026 All site design rights belong to S.Y.A.