CCNP Security SISAS 300-208 Official Cert Guide (2015)
Part VI: Safely Deploying in the Enterprise
Chapter 22. Troubleshooting Tools
This chapter covers the following exam topics:
![]() Identify issues using authentication event details in Cisco ISE
Identify issues using authentication event details in Cisco ISE
![]() Troubleshoot using Cisco ISE diagnostic tools
Troubleshoot using Cisco ISE diagnostic tools
![]() Troubleshoot endpoint issues
Troubleshoot endpoint issues
![]() Use debug commands to troubleshoot RADIUS and 802.1X on IOS switches and wireless controllers
Use debug commands to troubleshoot RADIUS and 802.1X on IOS switches and wireless controllers
Throughout this book, you have been verifying activities using tools that are commonly used for troubleshooting. Tools such as Live Log provide immeasurable value to an ISE administrator when attempting to identify and remediate the cause of an issue.
In this chapter, you will take a deeper look into the troubleshooting of Secure Network Access and examine some of the tooling that has been built in to ISE 1.2 to aid you in your troubleshooting efforts.
Troubleshooting of product can sometimes get fairly complex. Troubleshooting a solution made up of multiple products is bound to get downright difficult. The biggest tip we can provide for you is this: Always stay calm and think through the flows. When you are comfortable with the Secure Access solution and how the parts work together, it really is not bad at all.
“Do I Know This Already?” Quiz
The “Do I Know This Already?” quiz enables you to assess whether you should read this entire chapter thoroughly or jump to the “Exam Preparation Tasks” section. If you are in doubt about your answers to these questions or your own assessment of your knowledge of the topics, read the entire chapter. Table 22-1 lists the major headings in this chapter and their corresponding “Do I Know This Already?” quiz questions. You can find the answers in Appendix A, “Answers to the ‘Do I Know This Already?’ Quizzes.”
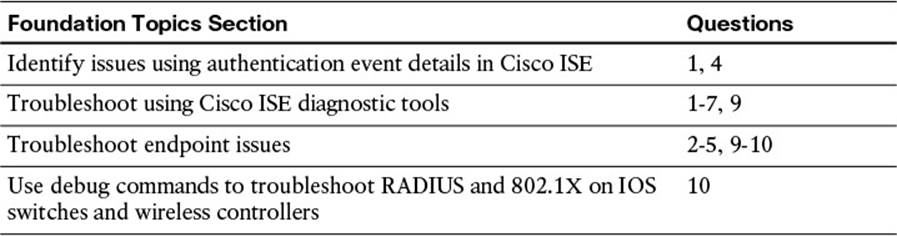
Table 22-1 “Do I Know This Already?” Section-to-Question Mapping
Caution
The goal of self-assessment is to gauge your mastery of the topics in this chapter. If you do not know the answer to a question or are only partially sure of the answer, you should mark that question as wrong for purposes of the self-assessment. Giving yourself credit for an answer you correctly guess skews your self-assessment results and might provide you with a false sense of security.
1. Which ISE diagnostic tool can be used to find misconfigurations in a Cisco NAD?
a. TCP Dump
b. Live Sessions Log
c. RADIUS Authentication Troubleshooting Tool
d. Evaluate Configuration Validator
2. Which ISE diagnostic tool can be used to examine different aspects of a session and provide some additional details that might not have been available in the detailed authentication report?
a. TCP Dump
b. Live Sessions Log
c. RADIUS Authentication Troubleshooting Tool
d. Evaluate Configuration Validator
3. True or False? Logging levels in ISE can be set to debug level only from the command-line interface.
a. True
b. False
4. Which ISE tool displays a correlated view of authentications, change of authorizations, and state changes of an endpoint through its lifecycle on a network?
a. Live Log
b. Live Sessions Log
c. RADIUS Authentication Troubleshooting Tool
d. Evaluate Configuration Validator
5. Which ISE tool displays a near real-time view of passed and failed authentications?
a. Live Log
b. Live Sessions Log
c. RADIUS Authentication Troubleshooting Tool
d. Evaluate Configuration Validator
6. Choose the option that best describes how external syslog servers can receive logs from ISE.
a. Each PSN must be configured locally to send syslog to all sources.
b. It is not possible to configure ISE to log to external logging servers.
c. The MnT node is configured to forward all received syslog to the external recipients.
d. Each PSN sends syslog to the MNT nodes, and the external syslog receivers at the same time.
7. Where does an ISE admin disable all event de-duplication?
a. Administration > System > Logging > Message Catalog
b. Administration > System > Protocols > RADIUS
c. Administration > System > Logging > Remote Logging Targets
d. Administration > System > Protocols > IEEE 802.1X
8. Which tool will gather all the important log files and combine them into a single bundle for TAC?
a. Cisco AnyConnect Network Access Manager (NAM)
b. Cisco AnyConnect Diagnostic and Reporting Tool (DART)
c. Cisco NAC Agent
d. Cisco ISE Agent
9. What are the three main locations to troubleshoot network access authentication?
a. ISE, firewall, NAD
b. ISE, endpoint, firewall
c. ISE, endpoint, NAD
d. Endpoint, firewall, NAD
10. Which debug command will provide the best detail to identify why a URL redirection might not be working?
a. debug authentication
b. debug epm all
c. debug dot1x all
d. debug aaa all
Foundation Topics
Logging
There are numerous ways to examine logs with ISE. You can use the Live Log; Live Sessions Log; and individual log files that can be downloaded from the GUI, viewed from the CLI, or combined in a support bundle.
Live Log
As discussed numerous times throughout this book, ISE has a fantastic tool: The Live Authentications Log (commonly referred to as Live Log). As an administrator, you can select which columns to display and which to hide. Figure 22-1 shows Live Log and attempts to point out some key areas of the screen. Each number is listed with a description of the item to which the number refers. Continually reference the figure as you read the list.
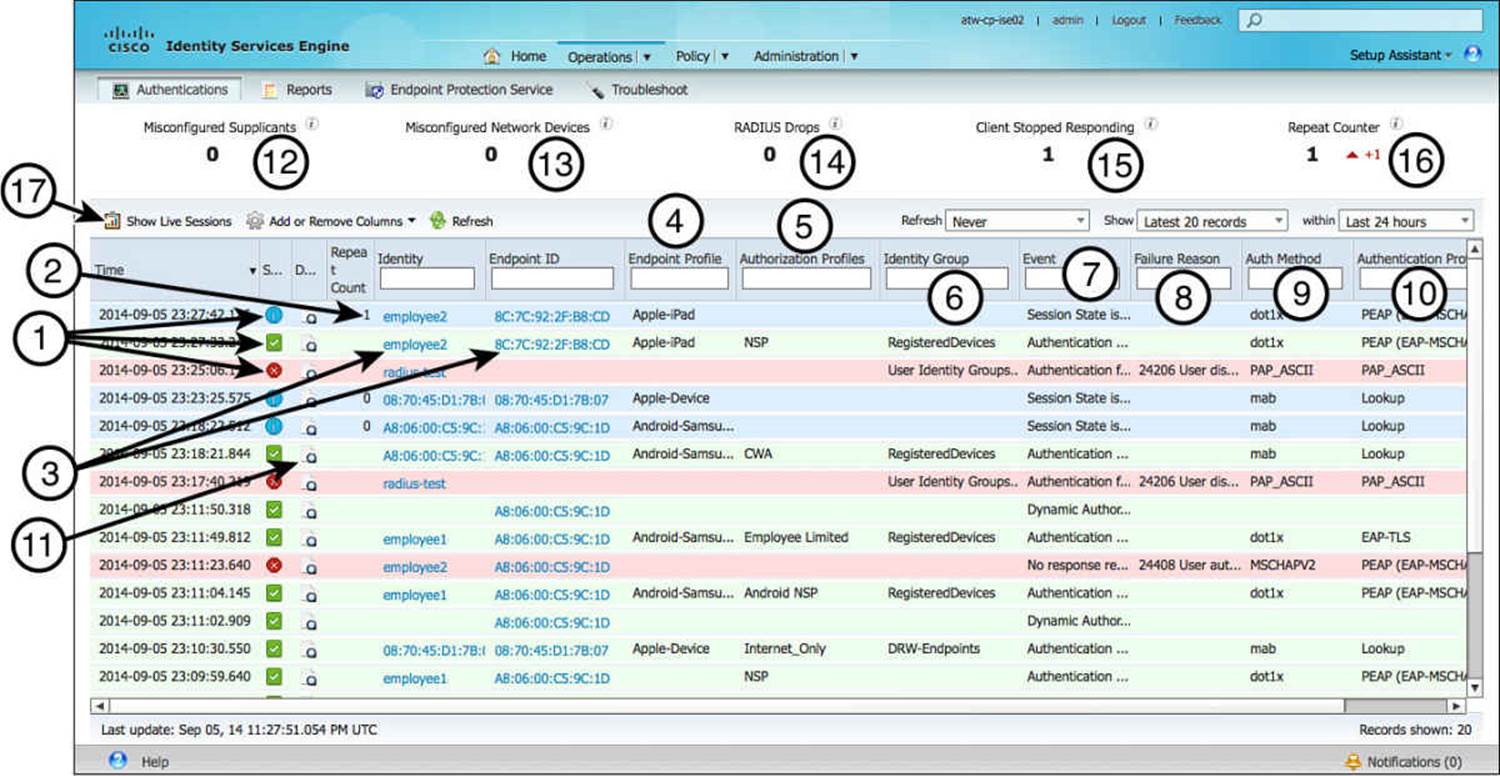
Figure 22-1 Live Log.
#1 - The status—Three status types exist in Live Log: Informational, Pass, and Fail. They are as follows:
![]() Informational—These records are blue in color and show up while client suppression is enabled (which is on by default). These increment a repeat count for each pass/fail record that is suppressed.
Informational—These records are blue in color and show up while client suppression is enabled (which is on by default). These increment a repeat count for each pass/fail record that is suppressed.
![]() Pass—These records are green in color and are the log entries of successful authentications.
Pass—These records are green in color and are the log entries of successful authentications.
![]() Fail—These records are red in color and are the log entries for failed authentications.
Fail—These records are red in color and are the log entries for failed authentications.
#2 - Repeat Count—This number increments only when client suppression is enabled (which is on by default). For each pass/fail record that is suppressed, the counter increments. Only informational record types have a repeat counter. The figure is pointing out that employee2 has successfully authenticated two times because the repeat counter is set to 1.
#3 - Identity and Endpoint ID—These fields show the username from the RADIUS request, WebAuth portal, or even the MAC address in the case of MAB. The endpoint ID is the calling-station-id field from the RADIUS request. Beginning with 1.2.0 patch 5, both the identity and endpoint ID fields are right-clickable, providing an option to copy their value(s) to be used elsewhere.
#4 - Endpoint Profile—This lists the profile assigned to the endpoint involved in the authentication.
#5 - Authorization Profile—This lists the result that was sent during the authentication.
#6 - Identity Group—This lists the user or endpoint identity group, when applicable. For more on identity groups, see Chapter 3, “Identity Management,” and Chapter 9, “Initial Configuration of Cisco ISE.”
#7 - Event—This lists the main event ID and description for the success or failure. More information is available after clicking details (#11).
#8 - Failure Reason—When the record indicates a failed authentication, the main failure reason is listed here. More information is available after clicking details (#11).
#9 - Authentication Method—Lists the method used, such as MAB, dot1x, PAP_ASCII, MSCHAPv2, and so on.
#10 - Authentication Protocol—Displays the actual protocol that was used, which could be the tunneled EAP type, or even the lookup (for MAB endpoint lookups).
#11 - Details Icon—Clicking this icon launches the Authentication Details report, which contains a tremendous amount of information about the authentication.
#12 - Misconfigured Supplicants—This counter is used with event suppression, and each time an event is discarded due to a misconfigured endpoint, this counter increases. Clicking this counter brings up the list of dropped events.
#13 - Misconfigured Network Devices—This counter is used to point out when a network access device (NAD) is configured with a RADIUS accounting update frequency that is considered to be “too often.” Clicking this counter brings up the list of dropped events.
#14 - RADIUS Drops—When the RADIUS packet is dropped before it is even processed, this counter increments. An example of a situation in which the packet will be dropped is when a NAD is configured with an incorrect shared secret. Clicking this counter brings up the list of dropped events.
#15 - Client Stopped Responding—Often an endpoint starts an authentication but does not finish. One such reason is the client doesn’t trust the certificate presented by ISE. Any time that happens, this counter increments. Clicking this counter brings up the list of dropped events.
#16 - Repeat Counter—This counter increments each time an event is suppressed and acts as an overall counter for all the individual repeat counts with the informational entries of the Live Log. Clicking this counter brings up the list of dropped events.
#17 - Show Live Sessions—Click this button to switch from Live Log to the Live Sessions Log, which is described in the next section.
Live Sessions Log

The Live Sessions Log differs from the Live Log in that it correlates activity related to an entire session, whereas the Live Log is focused on the raw entries related to a passed or failed authentication. For example, recall from Chapter 17, “Bring Your Own Device,” that a device can authenticate numerous times within a single session.
The Live Sessions Log correlates all the activities and the various states of the session. Figure 22-2 points out the single session of a device that must have gone through onboarding. It is listed with an authentication using PEAP(EAP-MSCHAPv2) and then another authentication using EAP-TLS. Also notice that the IP address is learned through an accounting message.
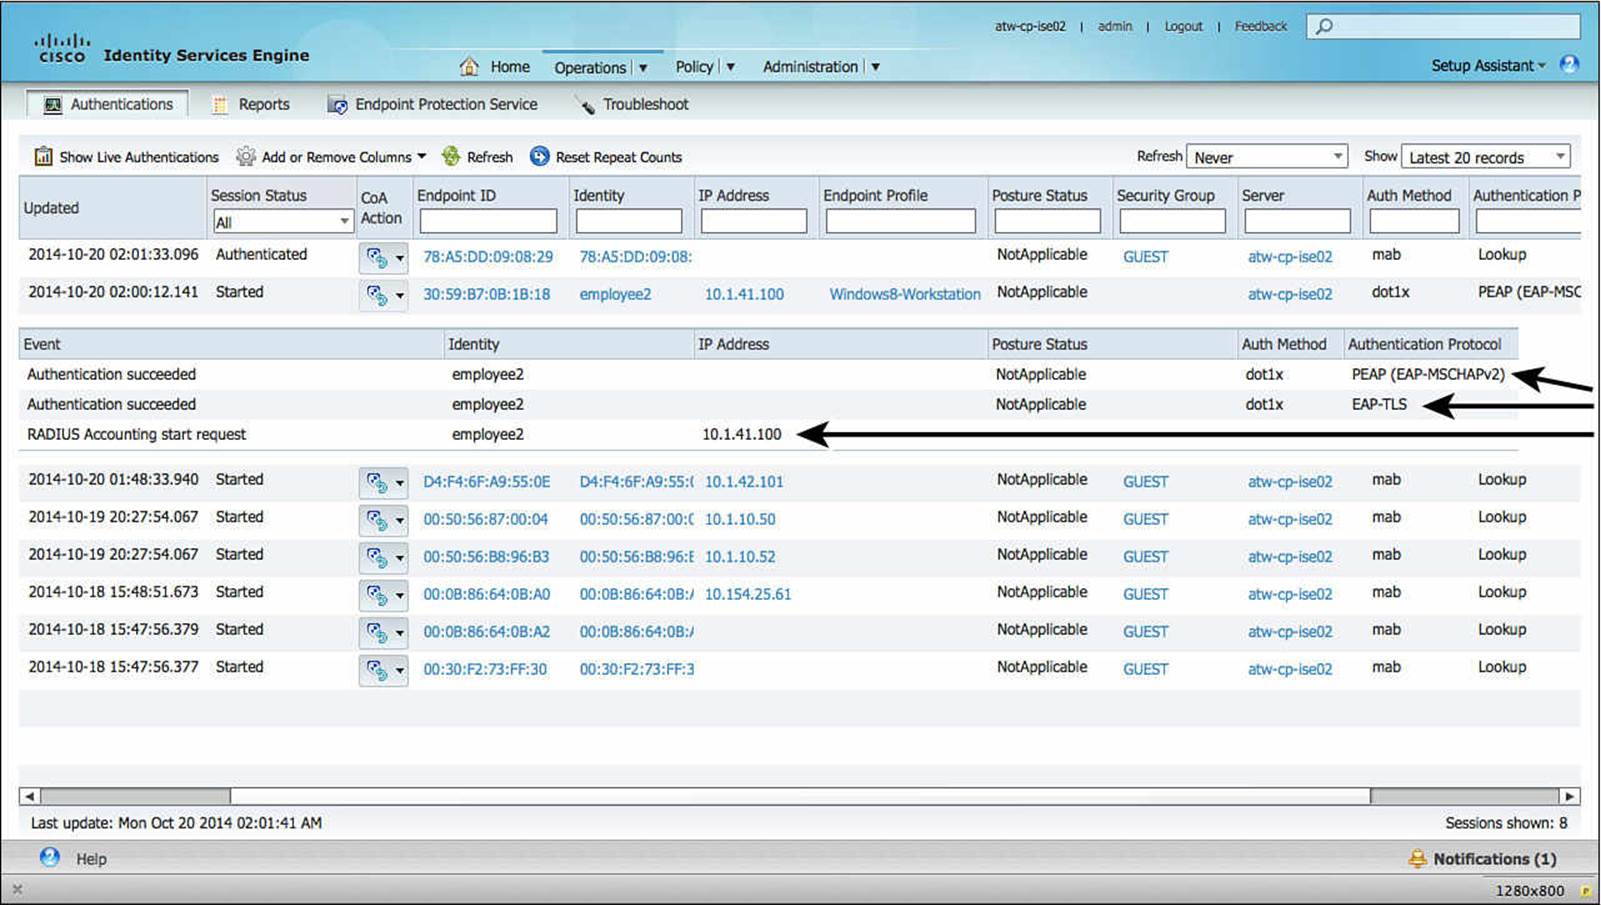
Figure 22-2 Live sessions.
The Live Sessions log has a useful function that enables you to send a change of authorization (CoA) from the session listing, as shown in Figure 22-3.
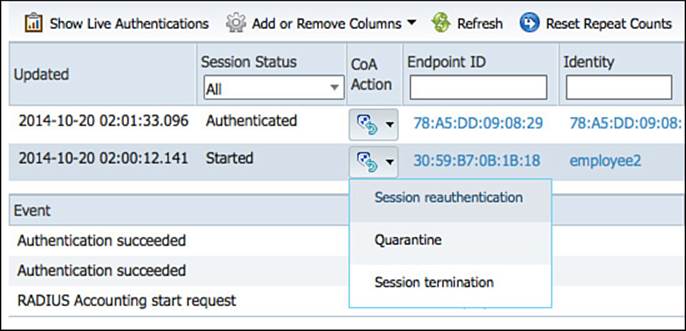
Figure 22-3 CoA from live sessions.
Logging and Remote Logging
All nodes in an ISE deployment send information to the Monitoring and Troubleshooting node(s) using syslog. The information sent includes system health; authentication, authorization, and accounting records; alarms; and any other system message. Traditional syslog transport uses UDP port 514, whereas ISE utilizes UDP port 20514.
Logging Targets
When a node joins an ISE cube, the policy is set for the nodes to send all logs to the defined LogCollector, which is the Primary Monitoring and Troubleshooting (MnT) persona.
To examine the configured LogCollector, navigate to Administration > System > Logging > Remote Logging Targets. Here a friendly name is given to a syslog collector and its definition—in other words, the IP Address, TCP or UDP syslog, and port number for the log collector, as shown in Figure 22-4. TCP syslog is used in certain environments to provide guaranteed log delivery.
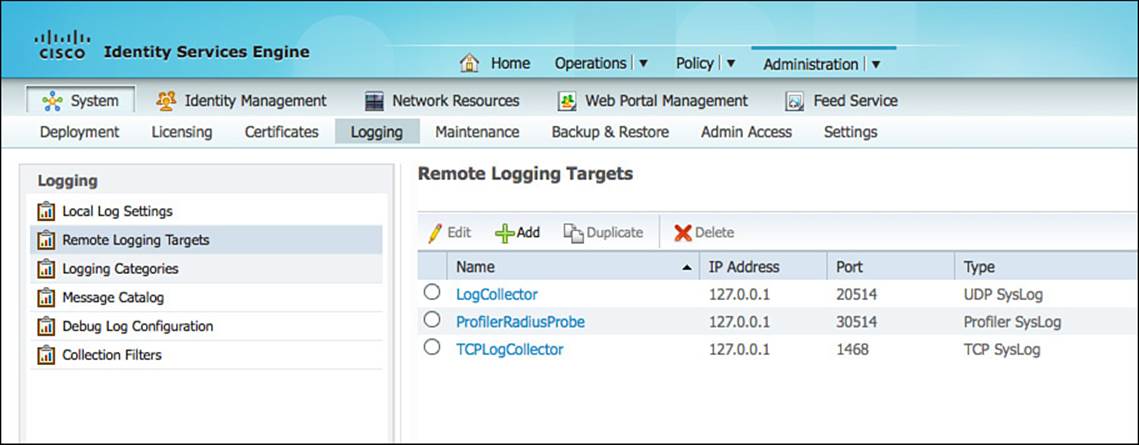
Figure 22-4 Default log collector configuration.
A Security Information and Event Management (SIEM) or other syslog receiver can be added to ISE simply by creating a new logging target, as shown in Figure 22-5.
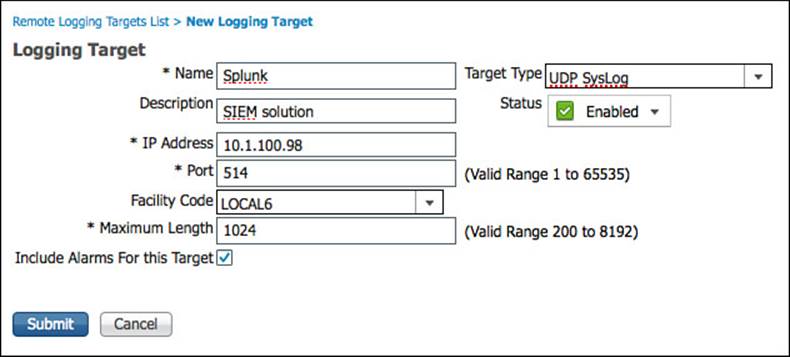
Figure 22-5 Adding a remote logging target.
To send logs to the newly added logging target, the target must be added to the various logging categories.
Logging Categories
There are many types of logs with a solution as in-depth as ISE. The logging categories and the logging targets assigned to each of the categories can be seen and configured by navigating to Administration > System > Logging > Logging Categories, as shown in Figure 22-6.
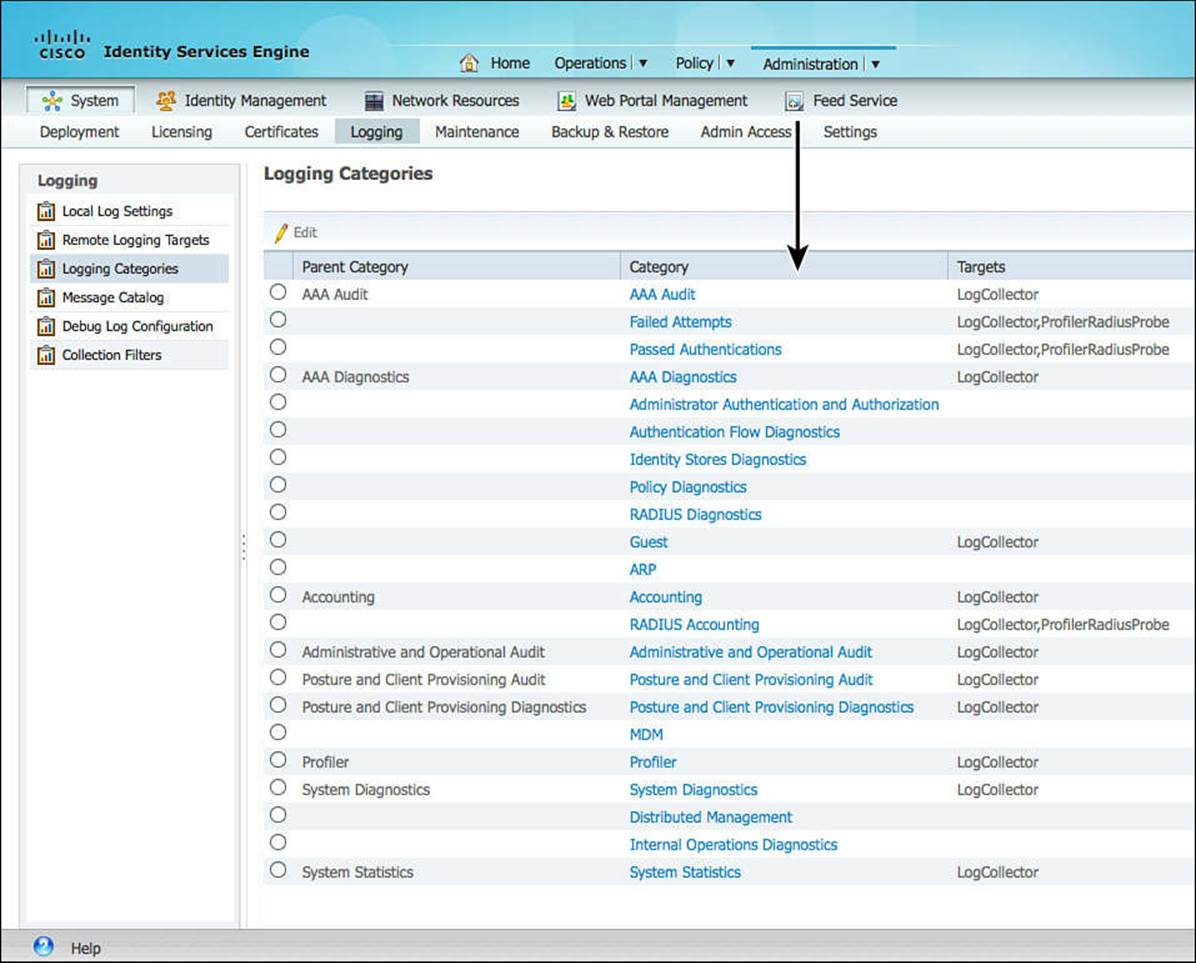
Figure 22-6 Logging categories.
For every category you want an external SIEM or other collector to receive, you must add that log collector to the individual category. The good news is that it takes effect for the entire ISE cube. To add that collector to a category, simply edit the category or click the category link. From there, ensure the desired collectors are in the Selected column, as shown in Figure 22-7.
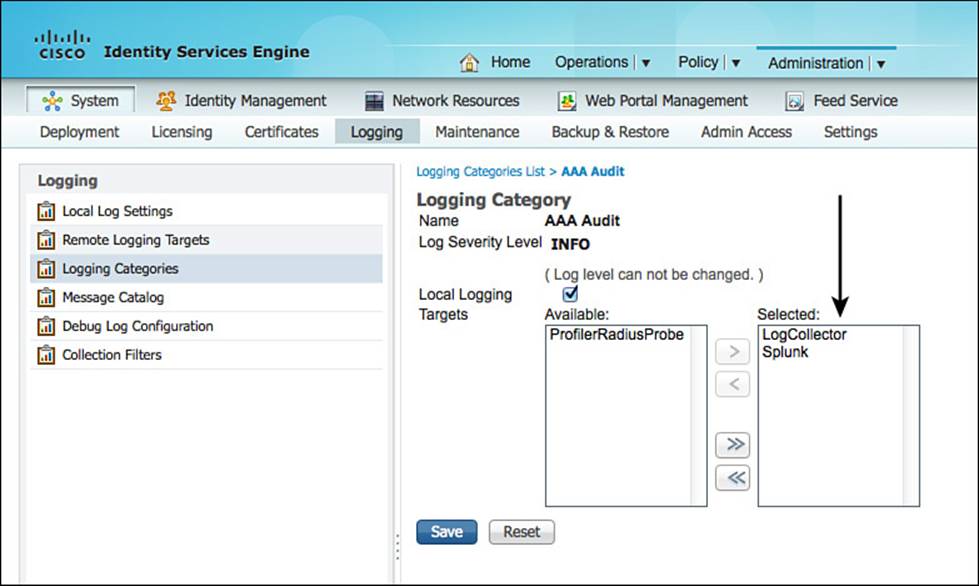
Figure 22-7 Adding a target to a logging category.
Debug Logs
As with most enterprise class solutions, a provision is often made to provide very detailed levels of logging for troubleshooting purposes known as debugging. ISE also provides the ability to set each component to log at different levels, including the debug level.
Note
It is never recommended to change any of these settings unless directed by Cisco TAC. Setting components to debug level will have an impact on system performance.
To change the logging level of a component, navigate to Administration > System > Logging > Debug Log Configuration. Click the name of the ISE node that needs to have the log settings modified; the list of components and the current log level settings are displayed, as shown in Figure 22-8.
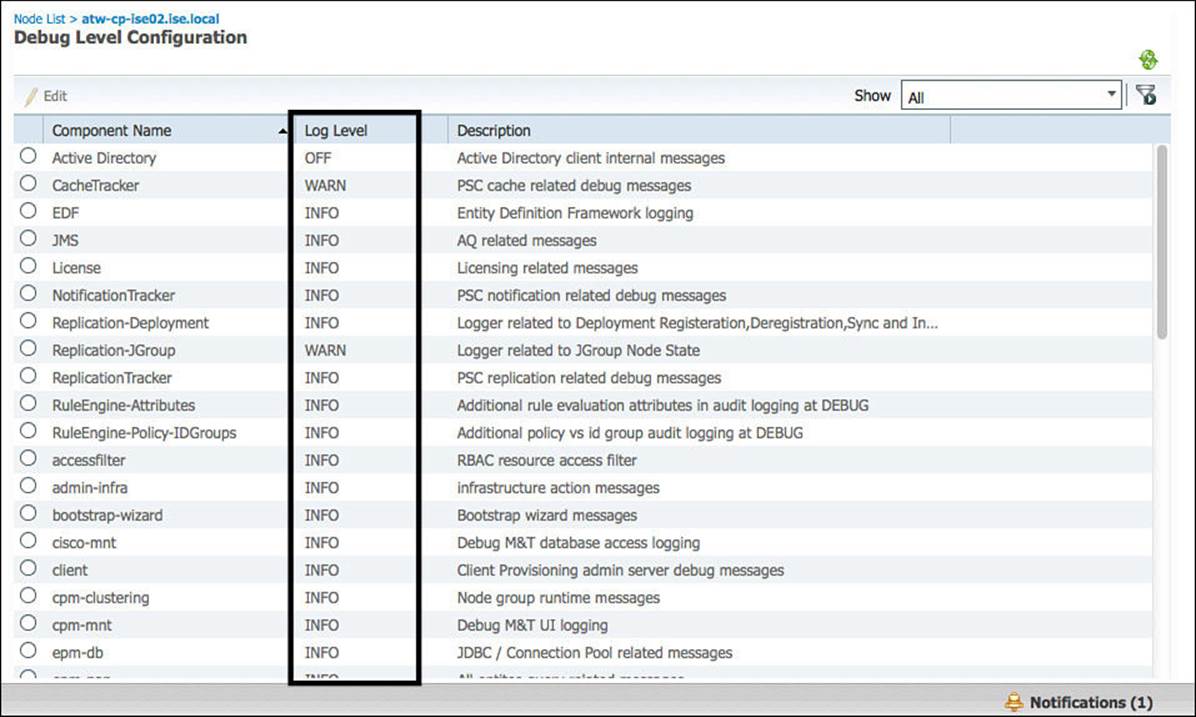
Figure 22-8 Default debug log configuration.
To modify a component’s logging level, edit the component or double-click the logging level. Select the new logging level from the drop-down list, and click Save, as shown in Figure 22-9.
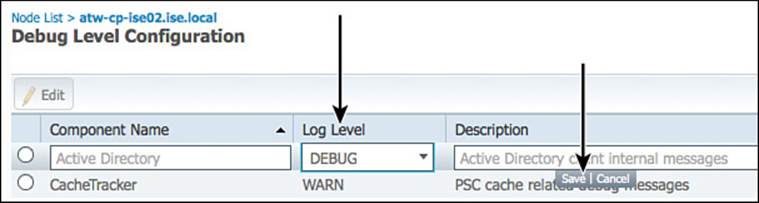
Figure 22-9 Changing the logging level of a category.
The resulting debug log file can be downloaded from the GUI, viewed from the CLI, or be included in a support bundle.
Downloading Debug Logs from the GUI
Debug log files can be downloaded from the GUI. Navigate to Operations > Troubleshoot > Download Logs. Select the ISE node that contains the log files that need to be downloaded, and click the link for the specific log file, as shown in Figure 22-10.
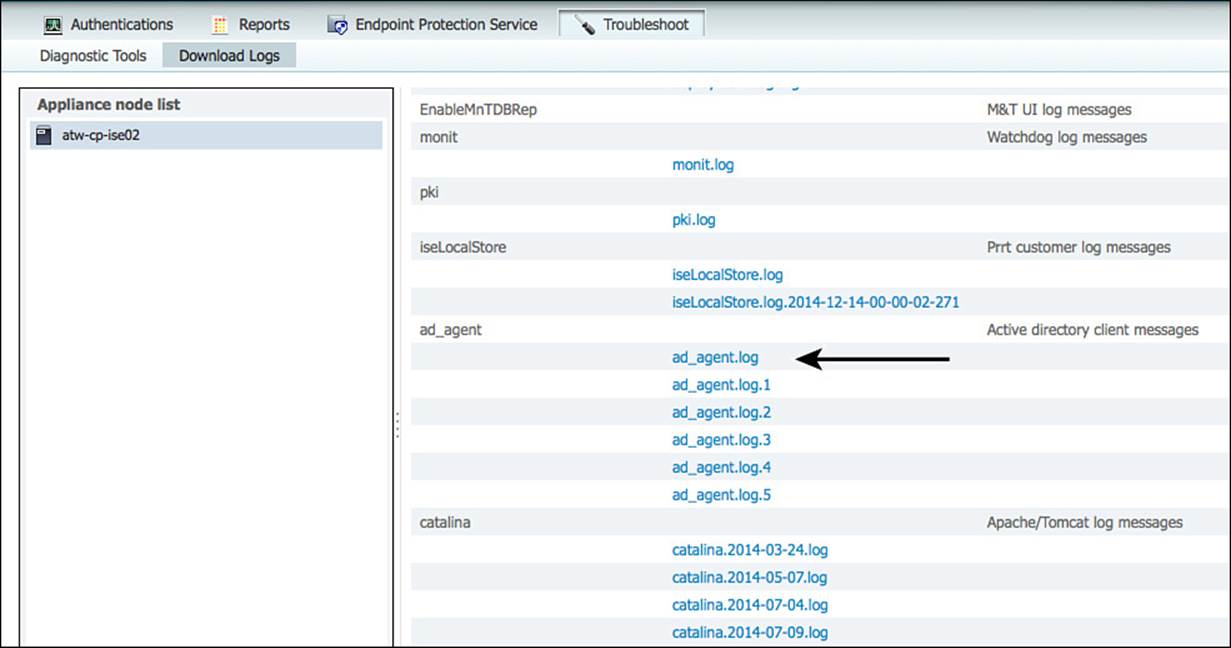
Figure 22-10 Downloading a debug log file from the GUI.
After the file is downloaded, it can be viewed in any standard text editor application.
Viewing Log Files from the CLI
Sometimes you might choose to view the logs on the local system through the command-line interface (CLI). ISE provides the ability to view and tail the log files directly from the CLI using the show logging application and show logging system commands. The application command is used for the ISE application’s logs, and the system command is used for logs related to the underlying operating system (ADE-OS).
To view a list of all the ISE log files, simply type show logging application and press Enter, as shown in Example 22-1.
Example 22-1 show logging application Command
atw-cp-ise02/admin# show logging application
5244288 Nov 03 2014 02:15:01 ad_agent.log.4
5243450 Dec 05 2014 06:30:01 ad_agent.log.1
22742 Dec 16 2014 16:33:31 mnt-report.log
To view the contents of a specific log file, simply type show logging application and the name of the log file, such as ad_agent.log, as shown in Example 22-2.
Example 22-2 show logging application ad_agent.log
atw-cp-ise02/admin# show logging application ad_agent.log
2014-12-05T06:37:51.031851+00:00 atw-cp-ise02 adclient[7795]: WARN <bg:machinep
w> daemon.main computer password change failed: Last error was unexpected discon
nect (GC); deferring reconnect.
2014-12-05T06:38:42.005040+00:00 atw-cp-ise02 adclient[7795]: INFO <bg:krb5.con
f> daemon.main Start trusted domain discovery
2014-12-05T06:38:42.005074+00:00 atw-cp-ise02 adclient[7795]: INFO <bg:krb5.con
f> daemon.main Delay /etc/krb5.conf update, Skipping trusted domains update beca
use the system is in disconnected mode
2014-12-05T06:48:42.004611+00:00 atw-cp-ise02 adclient[7795]: INFO <bg:krb5.con
f> daemon.main Start trusted domain discovery
2014-12-05T06:48:42.004660+00:00 atw-cp-ise02 adclient[7795]: INFO <bg:krb5.con
f> daemon.main Delay /etc/krb5.conf update, Skipping trusted domains update beca
use the system is in disconnected mode
2014-12-05T06:58:42.004231+00:00 atw-cp-ise02 adclient[7795]: INFO <bg:krb5.con
f> daemon.main Start trusted domain discovery
In addition to the ability to view a log file, you can also perform certain standard UNIX operations on the file, such as tail and grep. This is exposed through the CLI by adding a pipe ( | ) after the log name and choosing the output modifier. The options are shown in Example 22-3.
Example 22-3 show logging application ad_agent.log | ?
atw-cp-ise02/admin# show logging application ad_agent.log | ?
Output modifier commands:
begin Begin with line that matches
count Count the number of lines in the output
end End with line that matches
exclude Exclude lines that match
include Include lines that match
last Display last few lines of the output
Support Bundles
Cisco routers, switches, and other IOS-based devices have a very useful command: show tech-support. This command builds the output of nearly every usable show command on the IOS device, so the administrator has to submit only a single file to the TAC case that provided the TAC engineer with nearly every answer to any possible question that could be asked about the device configuration and current state.
Cisco ISE has something similar, called a support bundle. The support bundle is an encrypted archive that contains the output to many CLI show commands, a backup of the databases and ISE configuration, copies of all the log files, and more. These bundles can be quite large in nature but typically provide Cisco TAC with everything needed to re-create an issue for the purposes of troubleshooting and resolving your case.
To create a support bundle, navigate to Operations > Troubleshoot > Download Logs. Select the ISE node to create the support bundle from. On the Support Bundle tab, select which items to include in the bundle and define a password for the encryption and decryption of the data, as shown in Figure 22-11.
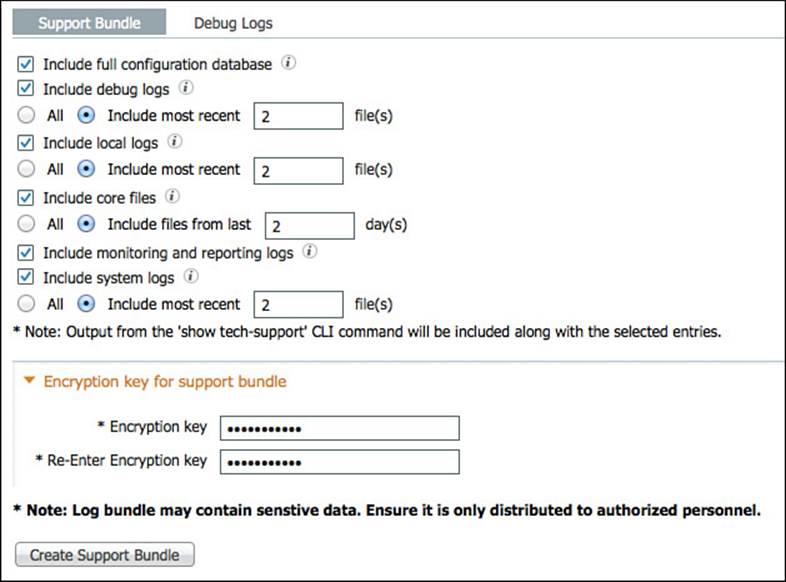
Figure 22-11 Creating a support bundle.
Diagnostics Tools
In addition to all the terrific logging capabilities in ISE, a number of built-in diagnostics tools are found under Operations > Troubleshoot > Diagnostics Tools. In this section, you will get a brief overview of the most commonly used tools.
Evaluate Configuration Validator
A terrific tool with a less-than-terrific name, the Evaluate Configuration Validator tool connects to a switch via telnet or SSH, or even through a console terminal server and examines the configuration. The configuration is then compared to a template configuration built in to ISE, and any differences between the configurations are called out. At the time this book was written, the tool was due for an update, but it still can provide a lot of value. Some administrators of ISE have been known to point this tool to an unconfigured switch and copy/paste the resulting commands to configure the switch.
Until it is updated, the following list displays a few of the common configurations that might be misdiagnosed as missing or incorrect:
![]() Does not currently understand device sensor and will be expecting the use of SNMP for the SNMP probe(s).
Does not currently understand device sensor and will be expecting the use of SNMP for the SNMP probe(s).
![]() Does not recognize the active test options when defining a RADIUS server, and therefore might think the RADIUS server definition is incorrect.
Does not recognize the active test options when defining a RADIUS server, and therefore might think the RADIUS server definition is incorrect.
![]() WebAuth is Local WebAuth only, and the tool does not recognize that MAB is used for Central WebAuth instead.
WebAuth is Local WebAuth only, and the tool does not recognize that MAB is used for Central WebAuth instead.
![]() Does not support the Cisco Common Classification Policy Language (C3PL) commands available in IOS 15.2 and above (C3PL is out of scope for this exam and therefore this book).
Does not support the Cisco Common Classification Policy Language (C3PL) commands available in IOS 15.2 and above (C3PL is out of scope for this exam and therefore this book).
Even with the limitations listed, this tool is still recognized by Cisco TAC as quickly identifying a high number of misconfigurations, and in many cases it would have prevented a customer from opening the TAC case.
To run the Evaluate Configuration Validator tool, do the following:
Step 1. Navigate to Operations > Troubleshoot > Diagnostics Tools > General Tools > Evaluate Configuration Validator.
Step 2. Enter the IP address of the NAD and the options you would like the tool to examine, as shown in Figure 22-12.
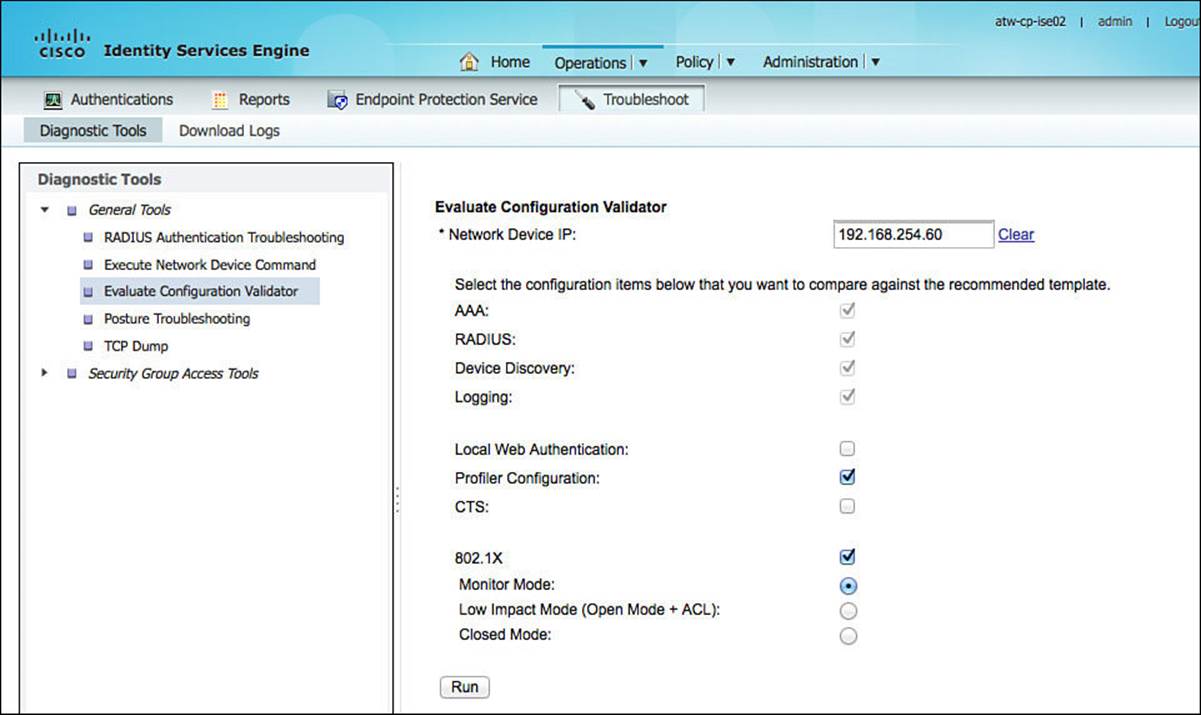
Figure 22-12 Initializing the Evaluate Configuration Validator tool.
Note
In Figure 22-12, Local Web Authentication has been unchecked because we are using Centralized Web Authentication (CWA).
Step 3. Click Run to begin the evaluation.
Step 4. ISE connects to the switch and prompts for your interaction if the switch asks for user authentication or other interactive prompts, as shown in Figures 22-13 and 22-14.
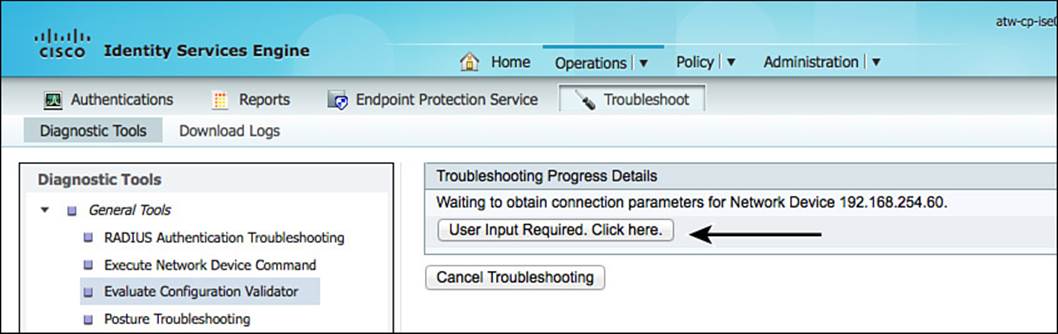
Figure 22-13 User input required.
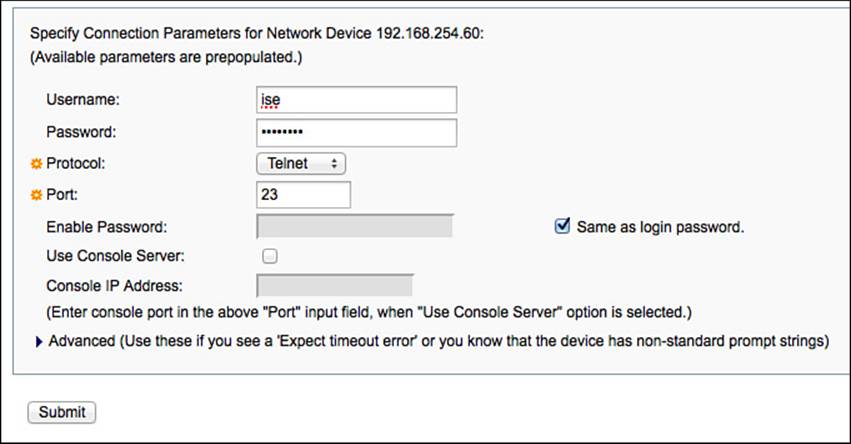
Figure 22-14 Entering credentials.
Step 5. Next, you are prompted to select which interfaces you want to compare (see Figure 22-15). If you are following the guidelines we set in this book, then nearly every interface will have the exact same configuration, and you should select only one interface to compare.
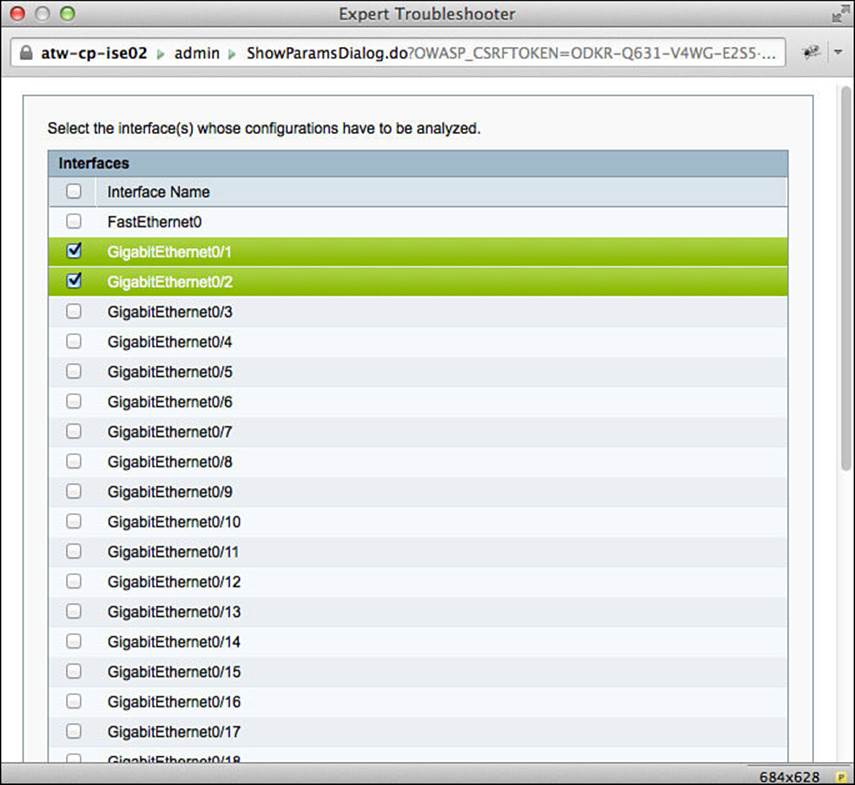
Figure 22-15 Select interface(s).
Step 6. The comparison should be complete, as shown in Figure 22-16. Click Show Results Summary to see the results, which are displayed in Figure 22-17.
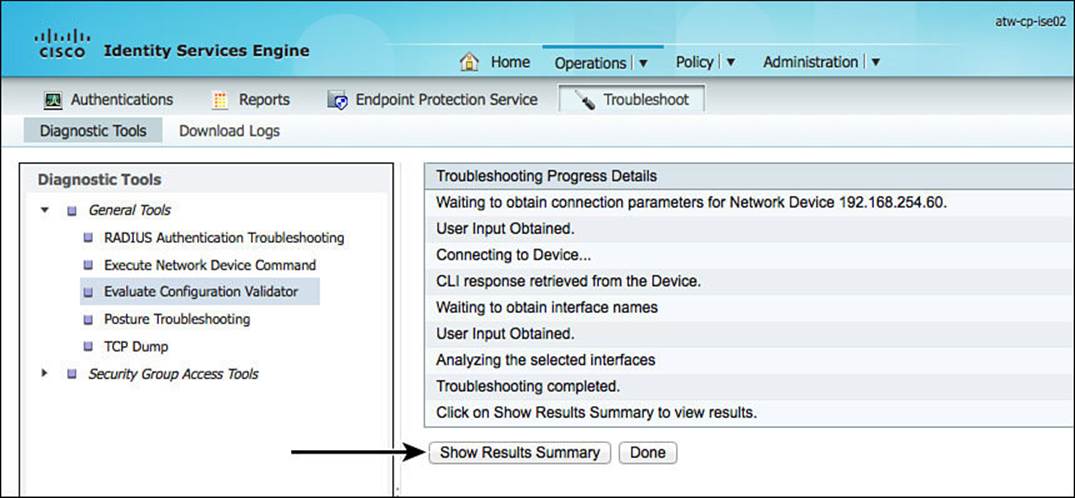
Figure 22-16 Comparison complete.
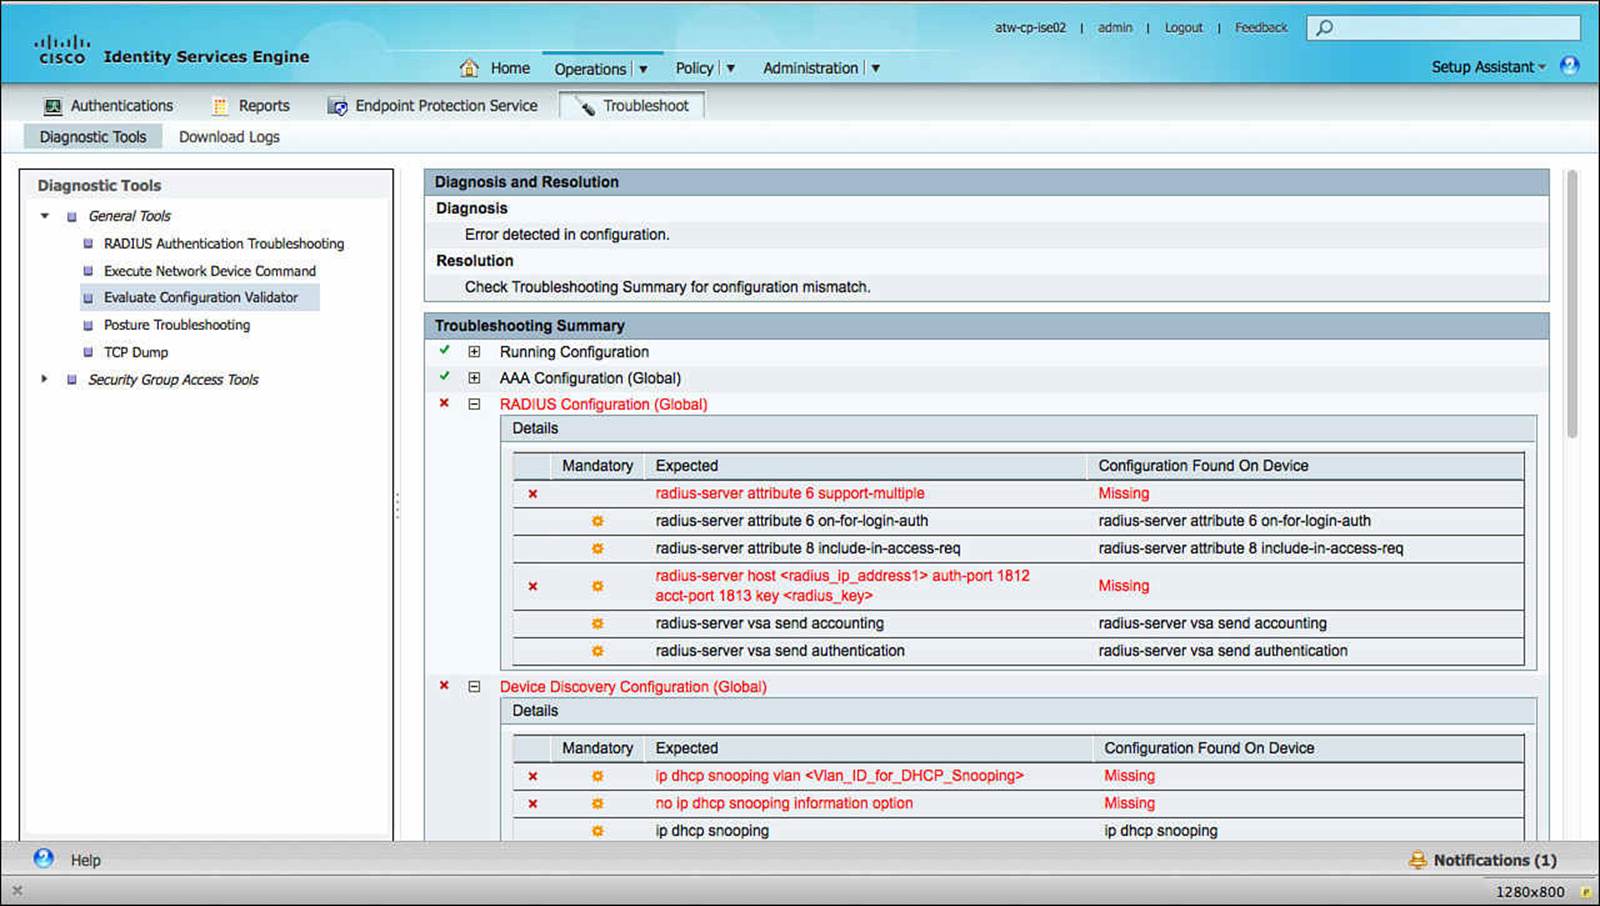
Figure 22-17 Comparison results.
As previously mentioned, the tool does not understand some of the newer commands that supersede the commands in the template it uses for the comparison. A perfect example is in Figure 22-17, where the comparison result states the radius-server host command is missing. The command is in fact on the switch, but it includes additional arguments for the proactive testing of the RADIUS server, as shown in Example 22-4. So it is up to you, the ISE administrator or consultant, to use the tool for the value that it does provide—not take it a face value—and examine the actual switch configuration to ensure the necessary commands are in place.
Example 22-4 radius-server host Command Is Indeed in the Configuration
3560-X#show run | include radius-server host
radius-server host 10.1.100.232 auth-port 1812 acct-port 1813 test username
radius-test key Cisco123
3560-X#
RADIUS Authentication Troubleshooting Tool
The RADIUS Authentication Troubleshooting tool attempts to examine various aspects of a session and provide additional details that might not have been available in the detailed authentication report, as well as provide some suggestions for items to check next. Do the following:
Step 1. Navigate to Operations > Troubleshoot > Diagnostic Tools > General Tools > RADIUS Authentication Troubleshooting.
Step 2. From here you can select any number of specifics to limit your search, such as a specific username, failed or passed authentication status, and more. Click Search.
Step 3. Select one of the resulting authentications and click Troubleshoot, as shown in Figure 22-18.
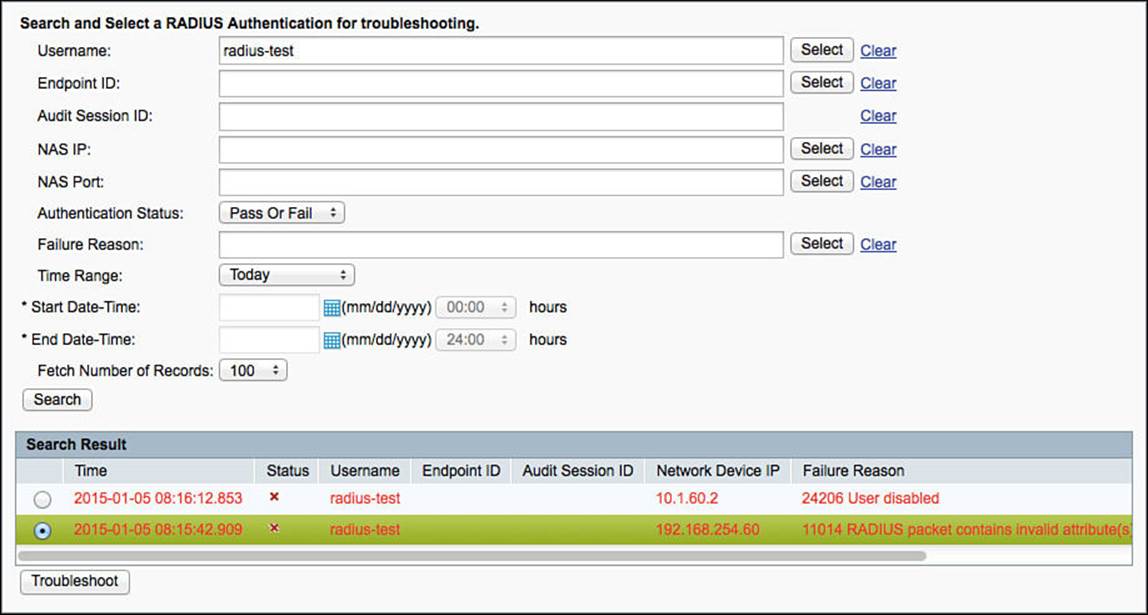
Figure 22-18 Troubleshooting the selected authentication.
Step 4. The troubleshooting progress is displayed, as shown in Figure 22-19.
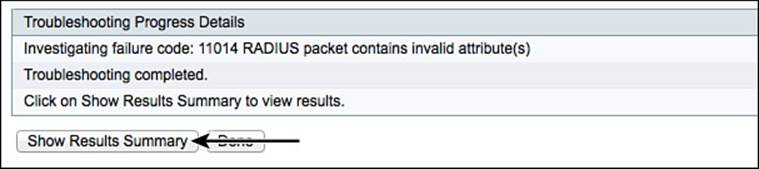
Figure 22-19 Troubleshooting progress.
Step 5. When the troubleshooting is complete, click Show Results Summary to see the diagnosis and suggested resolution, as displayed in Figure 22-20.
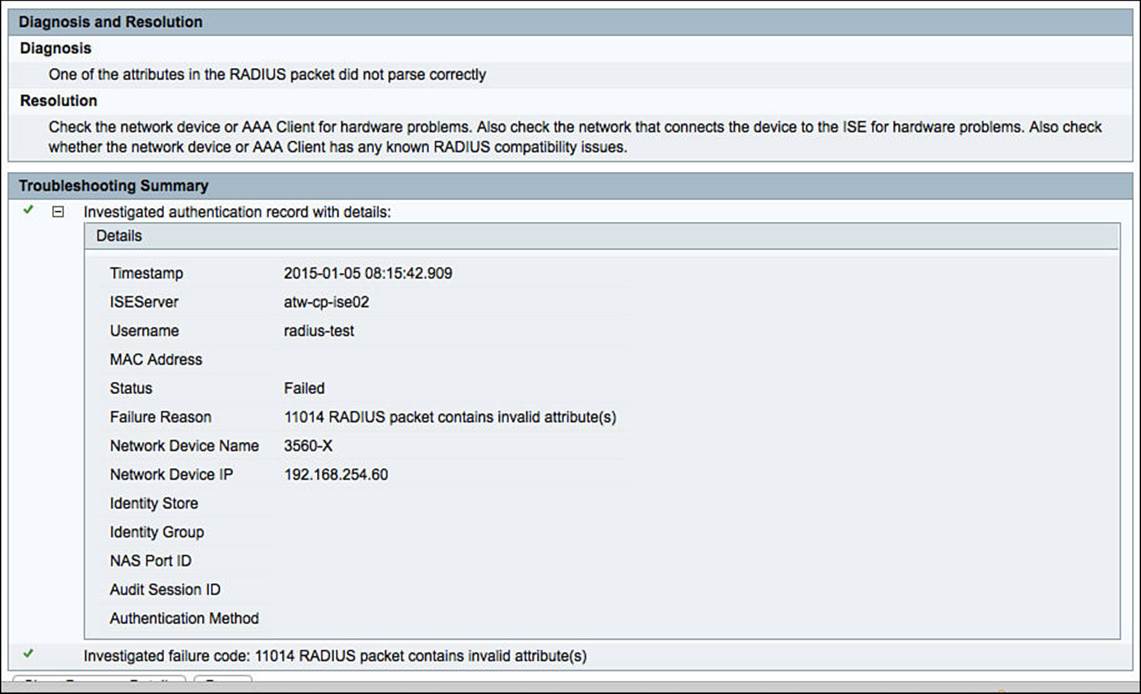
Figure 22-20 Diagnosis and resolution.
TCP Dump
One of the most valuable troubleshooting tools available to an ISE administrator is the ability to perform a packet analysis of the RADIUS packet. The packet analysis provides visibility into the raw RADIUS attributes of an authentication, so you can determine why a specific authentication rule was chosen or not chosen.
Cisco ISE provides the capability to perform a packet capture from any interface of any node in the entire ISE cube, download the resulting PCAP file, and perform that action from the central admin console. The downloaded file can then be viewed using your favorite packet analysis tool, such as Wireshark.
The TCPDump tool is located under Operations > Troubleshoot > Diagnostics Tools > General Tools > TCP Dump, as shown in Figure 22-21.
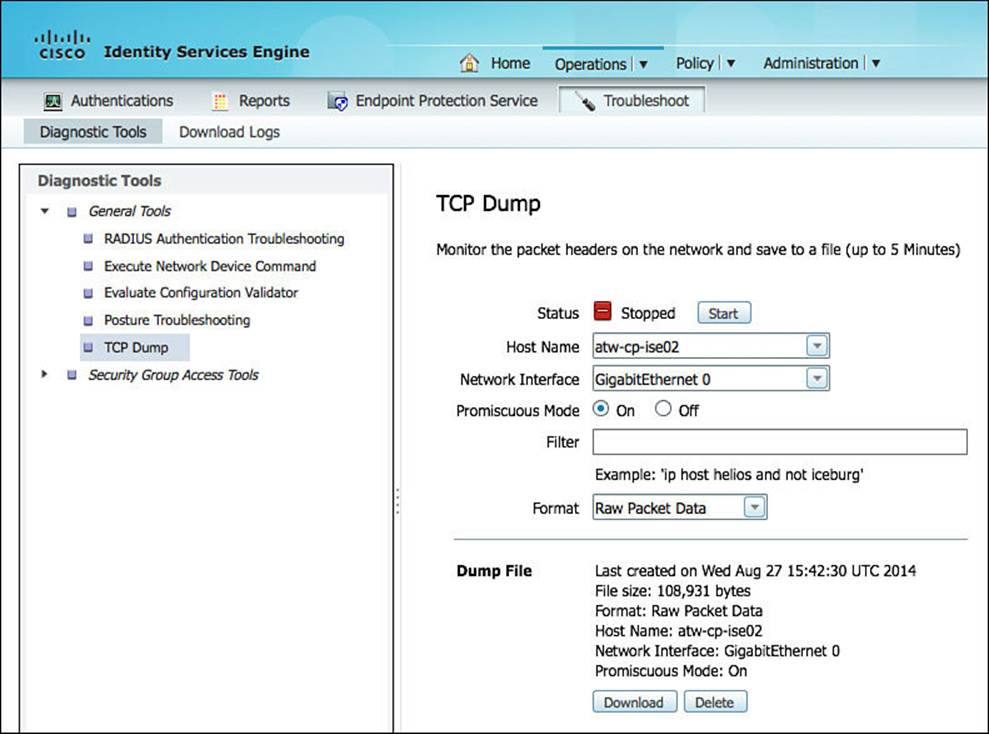
Figure 22-21 TCP Dump.
With the tool, you can select any node of the ISE deployment and any interface of that node. You are also able to select the resulting packet capture format to be either the raw PCAP format or in a human readable format.
To illustrate the value of this tool, this chapter walks through an example of checking an incoming wireless authentication. In Chapter 12, “Implement Wired and Wireless Authentication,” you created an authorization rule that examined the wireless SSID an endpoint connected to, which used the RADIUS attribute Called-Station-ID. This example uses TCPDump to examine the incoming RADIUS packet and look for the Called-Station-ID attribute:
Step 1. Navigate to Operations > Troubleshoot > Diagnostics Tools > General Tools > TCP Dump, as shown previously in Figure 22-21.
Step 2. The correct ISE node (a PSN) and the proper interface are selected (should be GigabitEthernet 0 for most installs).
Step 3. Click Start to begin the TCP Dump. The packet capture begins and the approximate file size updates, as shown in Figure 22-22.
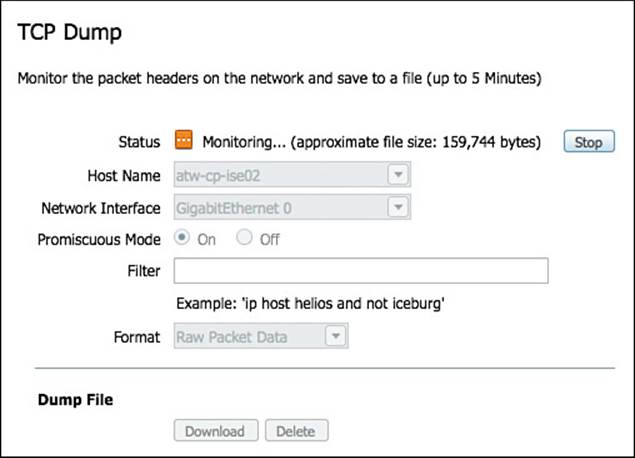
Figure 22-22 TCP Dump in progress.
Step 4. From an endpoint, connect to the wireless network (the CiscoPress SSID is being used in this example).
Step 5. From ISE, click Stop when you are finished. The dump file information will be updated on the screen, and the Download and Delete buttons will be enabled, as shown in Figure 22-23.
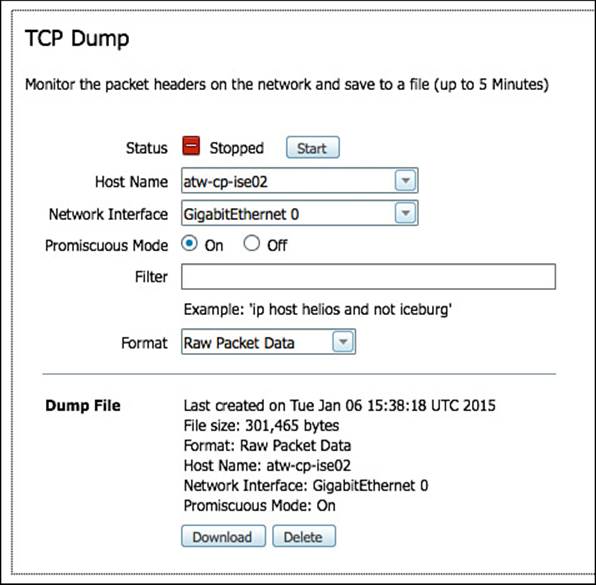
Figure 22-23 TCP Dump finished.
Step 6. Click Download to retrieve the PCAP file.
Step 7. Open the resulting PCAP file with your favorite packet analysis tool. Wireshark is used in this example, and it helps to apply a filter, such as “radius” to only see RADIUS packets, as shown in Figure 22-24.
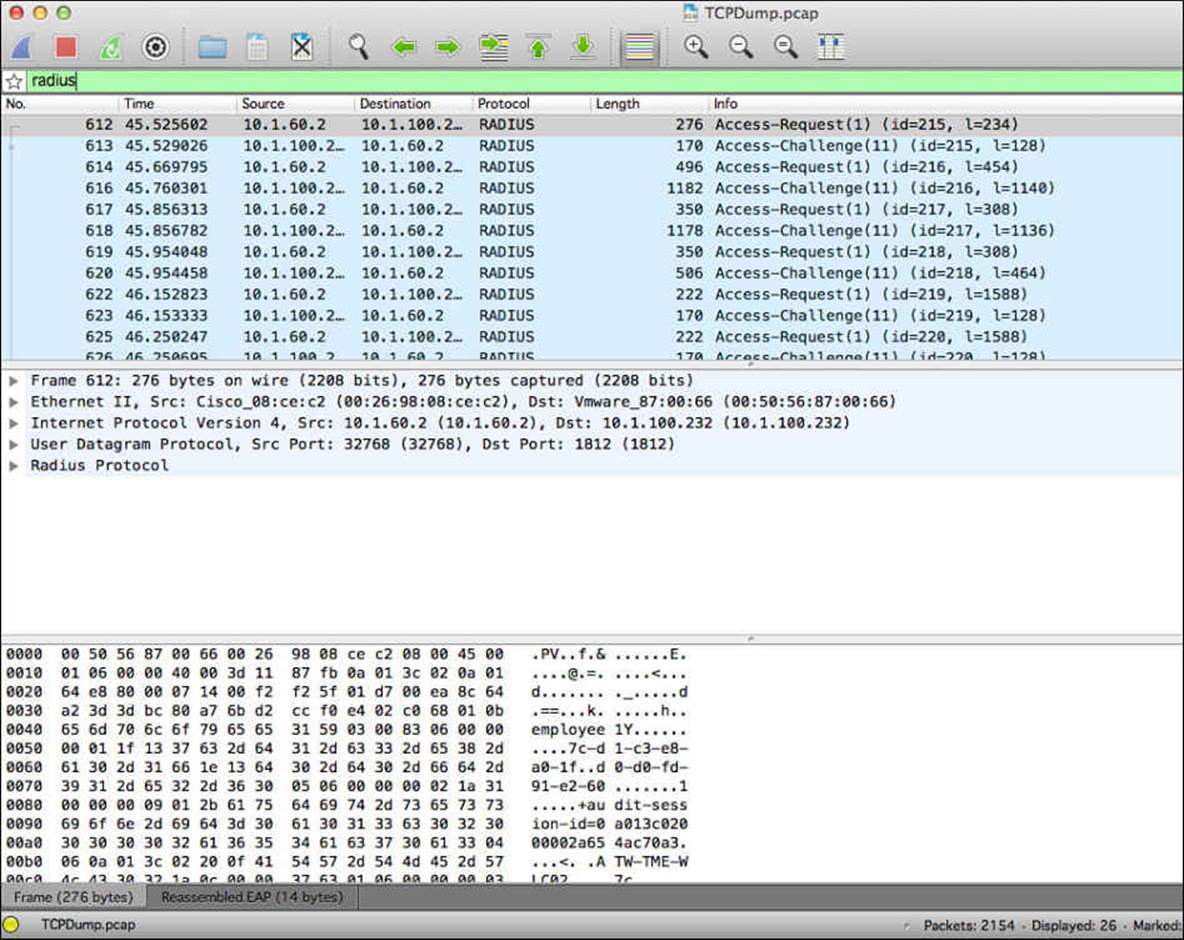
Figure 22-24 Opening the PCAP file in Wireshark.
Examining the RADIUS details in the packet, as shown in Figure 22-25, we see that the called-station-id did not contain the SSID; instead it contains the MAC address of the wireless access point. This is a configurable setting in the Wireless LAN Controller (WLC), and we will now change that setting beginning with Step 8.
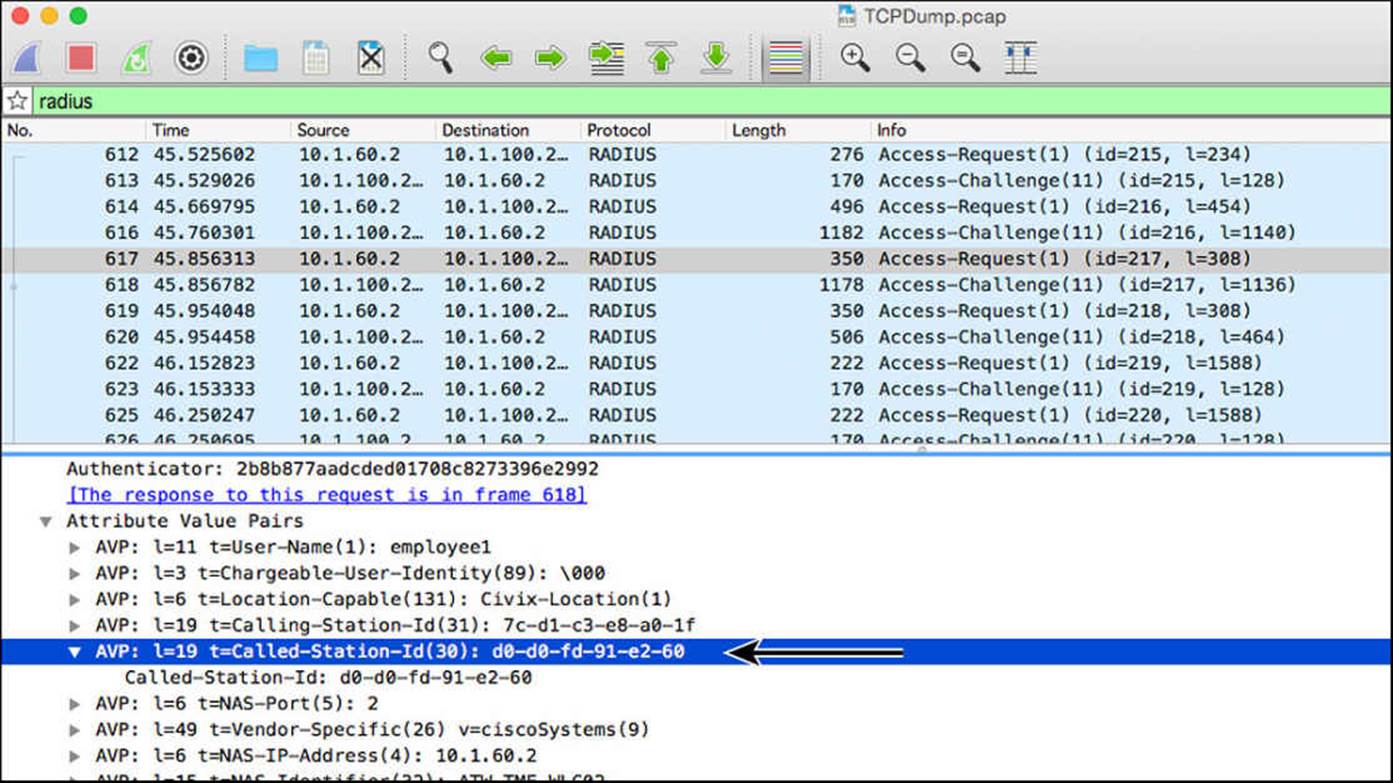
Figure 22-25 Called-Station-ID is AP’s MAC address.
Step 8. Log in to the WLC Administrative GUI.
Step 9. Navigate to Security > AAA > RADIUS > Authentication.
Step 10. Set the Auth Call Station ID Type drop-down to AP MAC Address:SSID, as shown in Figure 22-26. This configures the RADIUS authentication requests to be sent with the SSID appended to the access point’s MAC address.
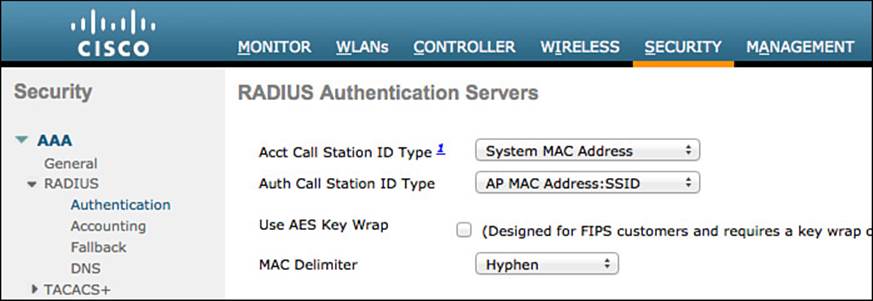
Figure 22-26 Auth call station ID type.
Step 11. Click Apply and Save Configuration.
Step 12. Repeat Steps 1-6 to generate a new packet capture.
Step 13. Open the PCAP file in a packet analyzer, and the called-station-id (RADIUS attribute 30) will be the MAC address of the AP, followed by a colon (:) and then the SSID Name (CiscoPress), as shown in Figure 22-27.
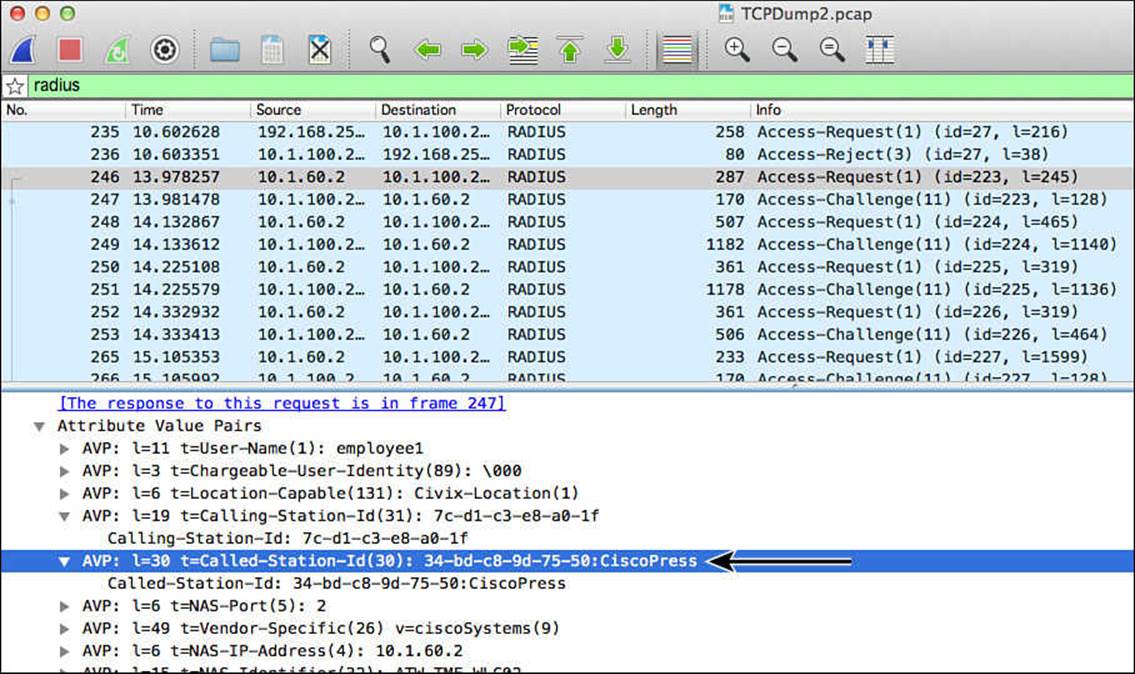
Figure 22-27 Called-Station-ID now contains the wireless SSID.
In the previous example, you have just seen what occurs when you configure a rule on ISE and then troubleshoot when that rule is not being matched by looking at the raw RADIUS packets. The root cause for the rule not being matched is identified as a misconfigured setting on the WLC, and the change was made.
Another common use for the TCP Dump tool is to verify that traffic from a NAD is actually reaching the ISE node and not relying solely on the Live Log.
Ensuring Live Log Displays All Events (Bypassing Suppression)
As networks continued to change and the bring your own device (BYOD) evolution continued to take hold, the number and types of endpoints grew and authentication traffic grew exponentially. Along with that shift in authentication traffic was a shift in the number of anomalous authentications, failures, and more.
To allow ISE to scale to larger environments, ISE 1.2 added new functionality to de-duplicate logs sent from the PSNs to the MNT. By default, repeated authentications with the same code are filtered out (de-duplicated) and not sent to the MnT node. Instead a summary is sent every 15 minutes with a count of the number of de-duplicated log entries.
Although this does wonders for the scalability of the solution, it also makes troubleshooting a tad more difficult because Live Log is not being updated with those suppressed events. There are two common ways to disable the suppression and enable you to troubleshoot more effectively. The first is to use a collection filter to bypass suppression. The last resort is to disable the suppression all together.
Collection Filters
Collection filters were created to prevent certain events from being logged to the MnT. For example, they can be used to prevent the logging of load balancer health probes or the proactive test probes from switches.
For troubleshooting purposes, the filters can be used to bypass suppression. To configure a collection filter, do the following:
Step 1. From the ISE GUI, navigate to Administration > Logging > Collection Filters. Any existing filters will be displayed in the right pane.
Step 2. Click Add to create a new filter.
Step 3. Select an attribute to uniquely identify which traffic should bypass suppression.
The options are User Name, Policy Set Name, NAS IP Address, Device IP Address, and MAC Address, as shown in Figure 22-28. The MAC address is the most common attribute to use when troubleshooting.
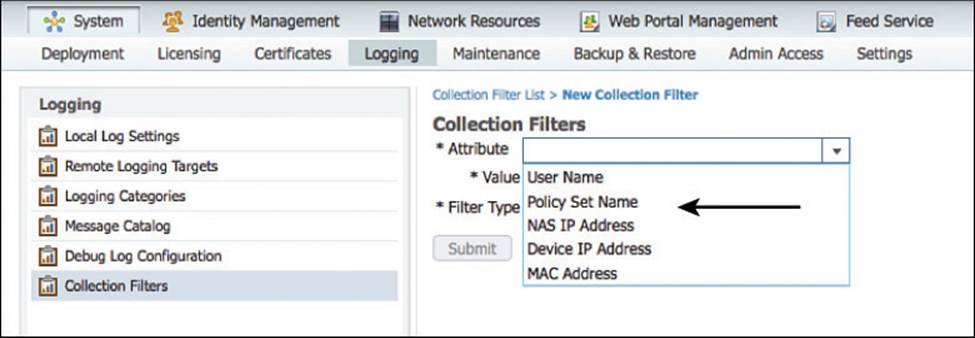
Figure 22-28 Choosing an attribute on which to filter.
Step 4. Enter the attribute value, such as the MAC address, as shown in Figure 22-29.
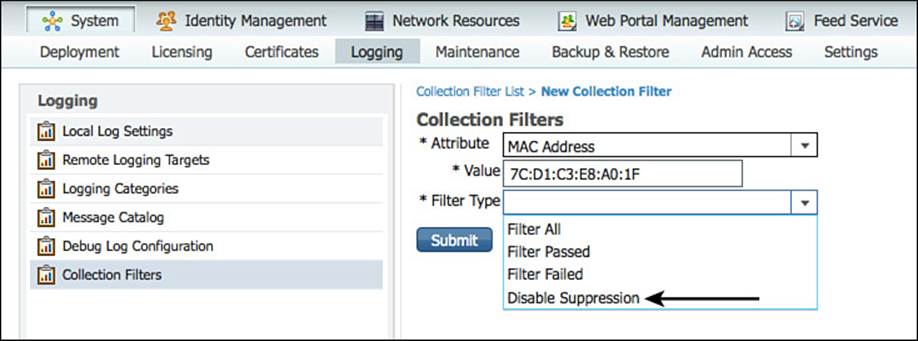
Figure 22-29 Enter an attribute value and select Disable Suppression.
Step 5. Select the Disable Suppression option from the Filter Type drop-down list, as shown in Figure 22-29.
Step 6. Click Submit.
Disabling Suppression
Bypassing suppression for a specific user or endpoint is a useful troubleshooting tool. However, that is not enough sometimes. Sometimes you must disable the suppression all together, like so:
Step 1. From the ISE GUI, navigate to Administration > System > Settings > Protocols > RADIUS, as shown in Figure 22-30.
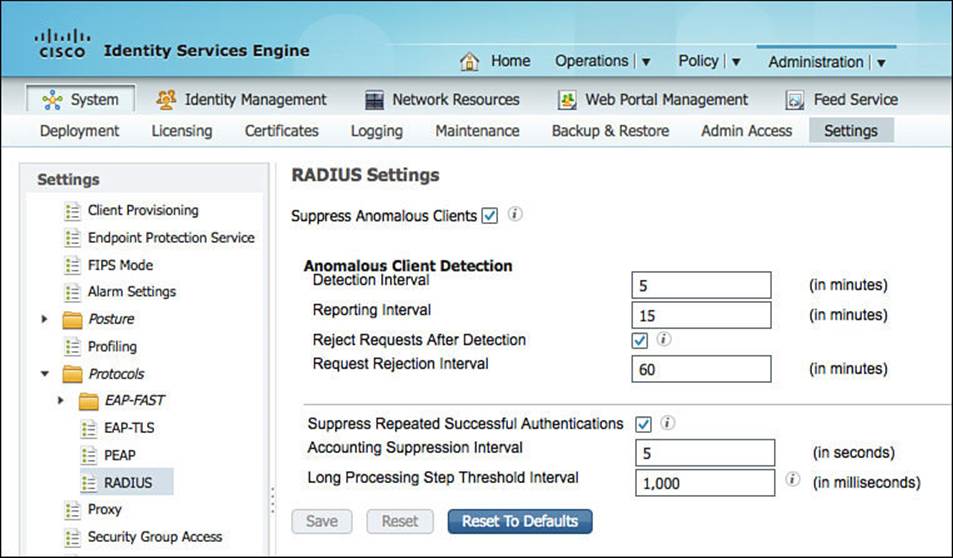
Figure 22-30 RADIUS settings.
Step 2. To disable suppression, uncheck the Suppress Anomalous Clients check box. Be sure to save afterwards.
Troubleshooting Outside of ISE
As described throughout this chapter and this book, ISE provides numerous tools that provide visibility to the authentication as it pertains to ISE’s view of the network. Tools such as Live Log, Live Sessions Log, and TCP Dump very valuable when troubleshooting, but they cannot give a complete picture of all the parts of an authentication.
Think back to the basics of network authentication. There are three “actors” or participants in any authentication scenario: the endpoint, NAD, and authentication server. ISE is the authentication server and is world-class when it comes to providing troubleshooting details. However, there are still the other two participants in the authentication that you might need to look at: the endpoint and network device.
Endpoint Diagnostics
There are multiple aspects to troubleshooting from the endpoint. Naturally, there is the supplicant that is authenticating via 802.1X, but there are also other aspects that require visibility from time to time. DNS resolution is a critical aspect and might need to be validated from the client; however, activities such as BYOD onboarding with the Network Setup Assistant apps or the posture agent (NAC Agent) also require validation.
AnyConnect Diagnostics and Reporting Tool
When troubleshooting 802.1X, it can often come down to seeing exactly what is happening at the client side, not only the server side. Unlike many of the supplicants out in the world, the AnyConnect Network Access Manager (NAM) performs detailed logging and includes an optional module called the Diagnostics and Reporting Tool (DART).
DART creates a support bundle that can be sent to Cisco TAC that includes all relevant system log files, as well as detailed communication from the supplicant. This is incredibly valuable when troubleshooting 802.1X authentications.
To create a DART bundle on a Windows endpoint, do the following:
Step 1. Launch the DART tool from Start > Cisco > Cisco AnyConnect Secure Mobility Client > Cisco AnyConnect Diagnostics and Reporting Tool, as shown in Figure 22-31.
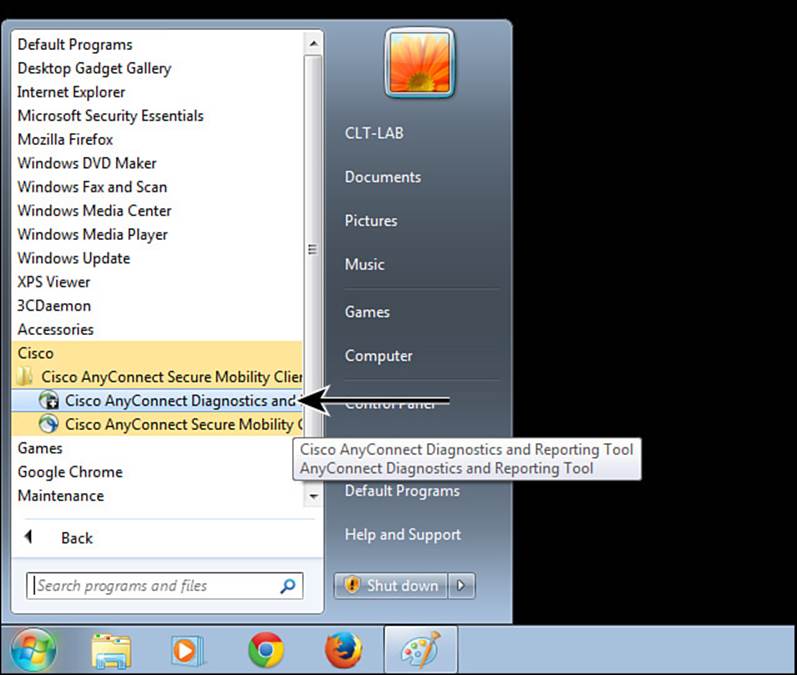
Figure 22-31 Launch DART from the Start menu.
Step 2. Click Next to begin the bundle creation, as shown in Figure 22-32.
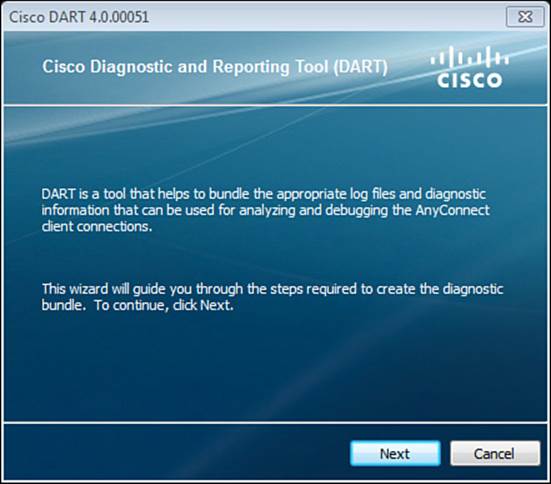
Figure 22-32 Click Next.
Step 3. Select the bundle creation option (default is normally used) and click Next, as shown in Figure 22-33. The DART tool will gather all necessary system and application logs, as shown in Figure 22-34.
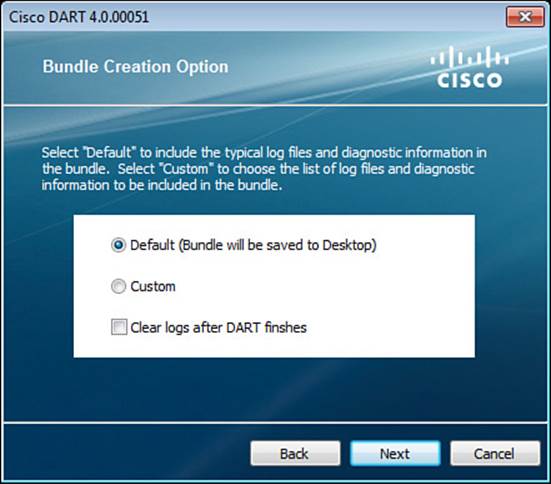
Figure 22-33 The Bundle Creation option.
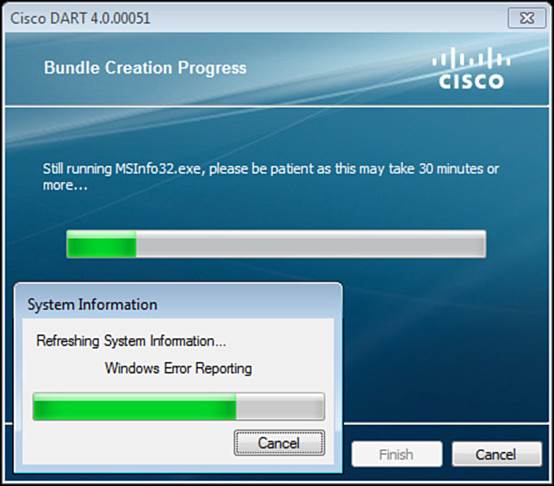
Figure 22-34 The Bundle Creation option.
Step 4. When the bundle creation is complete, the resulting Zip file will be saved on the desktop, as shown in Figure 22-35.
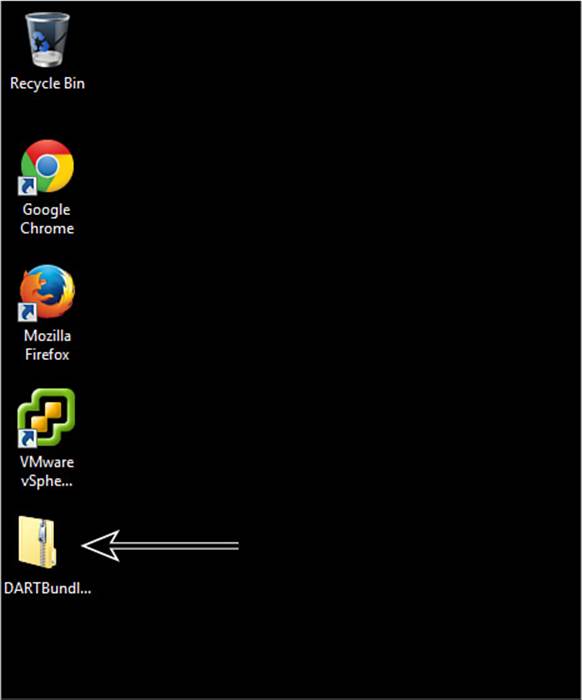
Figure 22-35 Resulting bundle Zip file on the desktop.
AnyConnect NAM Extended Logging
Even though AnyConnect NAM does have detailed logging capabilities enabled by default, it also has a special debug mode as well, known as extended logging. This mode can even provide packet captures from the client side for analysis, with a maximum file size of 10MB.
To enable extended logging, follow these steps:
Step 1. Type ALT + SHIFT + L at the desktop.
Step 2. Then right-click the AnyConnect icon in the system tray.
Step 3. Select Extended Logging from the context menu, as shown in Figure 22-36.
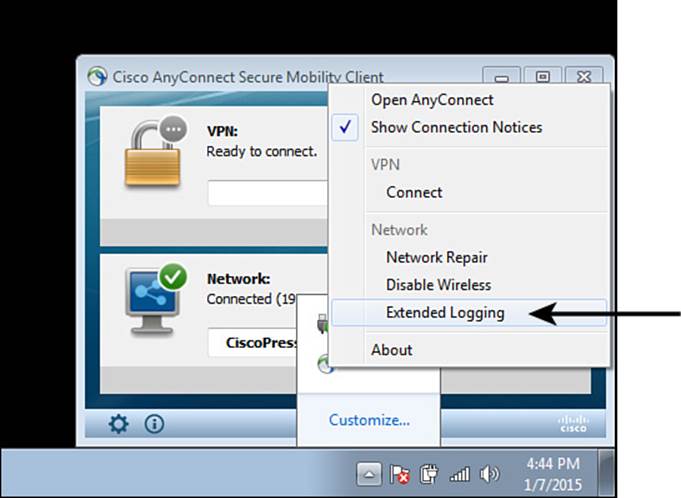
Figure 22-36 Enabling extended logging.
Microsoft Native Supplicant
There are many reasons that an organization might choose to deploy the supplicant that is native to the Windows OS, especially given the terrific centralized control offered by Active Directory. However, Cisco TAC has accumulated a list of eight hotfixes that an organization should ensure are installed if it is going to use the native supplicant:
![]() KB 976373—Windows 7 connected behind IP phones will not authenticate after waking up from sleep or hibernation.
KB 976373—Windows 7 connected behind IP phones will not authenticate after waking up from sleep or hibernation.
![]() KB 980295—Windows 7 stops responding to 802.1X after first authentication fails.
KB 980295—Windows 7 stops responding to 802.1X after first authentication fails.
![]() KB 2481614—Windows 7 selects a protocol different from what the GPO states.
KB 2481614—Windows 7 selects a protocol different from what the GPO states.
![]() KB 2491809—Windows 7 does not prompt for 802.1X credentials to some users on a shared PC.
KB 2491809—Windows 7 does not prompt for 802.1X credentials to some users on a shared PC.
![]() KB 2835595—Windows 7 does not prompt for 802.1X credentials.
KB 2835595—Windows 7 does not prompt for 802.1X credentials.
![]() KB 2494172—Windows 7 cannot authenticate if a valid certificate and an invalid certificate are present.
KB 2494172—Windows 7 cannot authenticate if a valid certificate and an invalid certificate are present.
![]() KB 2769121—Windows 7 selects the wrong certificate for a machine migrated across two forests.
KB 2769121—Windows 7 selects the wrong certificate for a machine migrated across two forests.
![]() KB 2736878—Windows 7 authentication fails intermittently.
KB 2736878—Windows 7 authentication fails intermittently.
Vivek Santuka, CCIE #17621 maintains a blog entry on the Cisco Support Forums with details on the subject. That blog is located at https://supportforums.cisco.com/blog/12256681/getting-past-intermittentunexplained-8021x-problems-windows-7.
Supplicant Provisioning Logs
If an endpoint attempts a BYOD onboarding flow but is not able to complete the native supplicant provisioning (NSP) process, examining the local endpoint logs might be the only way to find the root cause. Each operating system stores the logs in a different location, and some may even require special software to examine the logs.
Here is a list of useful techniques that are used to troubleshoot client-side logging issues:
![]() Microsoft Windows—Enter the Log %temp%\spwProfileLog.txt command to view the client-side logs.
Microsoft Windows—Enter the Log %temp%\spwProfileLog.txt command to view the client-side logs.
![]() Android—Enter the /sdcards/downloads/spw.log command to view the client-side logs.
Android—Enter the /sdcards/downloads/spw.log command to view the client-side logs.
![]() Mac OSX—Use the Console application, and look for the SPW process.
Mac OSX—Use the Console application, and look for the SPW process.
![]() Apple iOS—Use the iPhone Configuration Utility (iPCU) to view messages. It can be downloaded from: http://support.apple.com/downloads/.
Apple iOS—Use the iPhone Configuration Utility (iPCU) to view messages. It can be downloaded from: http://support.apple.com/downloads/.
Network Device Troubleshooting
Seeing the authentication attempts and the authorization results from the point of view of the NAD (the enforcement device) is invaluable when troubleshooting.
The Go-To: show authentication session interface
The command every ISE admin should have in her back pocket is the show authentication interface command. As described in Chapter 12, this command output shows the current state of the authentication and the results sent back from ISE. As shown in the bold text withinExample 22-5, this command is used to show that the WebAuth downloadable ACL (dACL) is applied to the session, the ACL-WEBAUTH-REDIRECT redirection ACL is applied, the session is being redirected to a CWA portal on the ISE node, it was assigned an SGT value of 8, and it is the result of a MAB.
Example 22-5 show authentication session interface
3750-X#show authentication session interface g1/0/2
Interface: GigabitEthernet1/0/2
MAC Address: 0050.5687.0004
IP Address: 10.1.10.50
User-Name: 00-50-56-87-00-04
Status: Authz Success
Domain: DATA
Security Policy: Should Secure
Security Status: Unsecure
Oper host mode: multi-auth
Oper control dir: both
Authorized By: Authentication Server
Vlan Policy: N/A
ACS ACL: xACSACLx-IP-WebAuth-53e3ffc0
URL Redirect ACL: ACL-WEBAUTH-REDIRECT
URL Redirect: https://atw-cp-ise02.ise.local:8443/guestportal/
gateway?sessionId=C0A8FE0100009884CAE356DA&action=cwa
SGT: 0008-0
Session timeout: N/A
Idle timeout: N/A
Common Session ID: C0A8FE0100009884CAE356DA
Acct Session ID: 0x00013D98
Handle: 0x0C0008C4
Runnable methods list:
Method State
mab Authc Success
dot1x Not run
Viewing Client Details on the WLC
The WLC has a similar view, but it is related to the client instead of the interface. You can view the client details by navigating to Monitor > Clients, as shown in Figure 22-37.
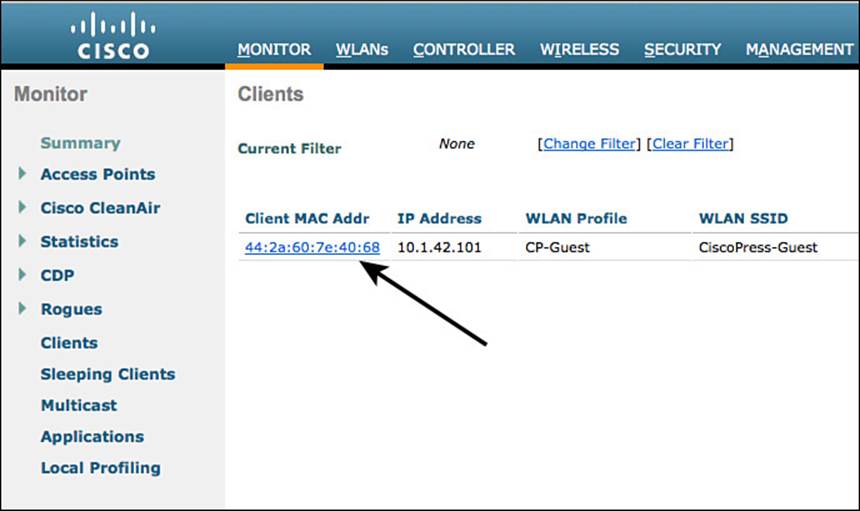
Figure 22-37 Monitor > Clients.
Select the client you are interested in verifying by clicking its MAC address. This brings up the client details screen shown in Figure 22-38. Scrolling down to the Security Information section, you can see RADIUS NAC State is set to CENTRAL_WEB_AUTH, the ACL-WEBAUTH-REDIRECT redirection ACL is applied, it was assigned an SGT value of 8, and the session is being redirected to a CWA portal on the ISE node.
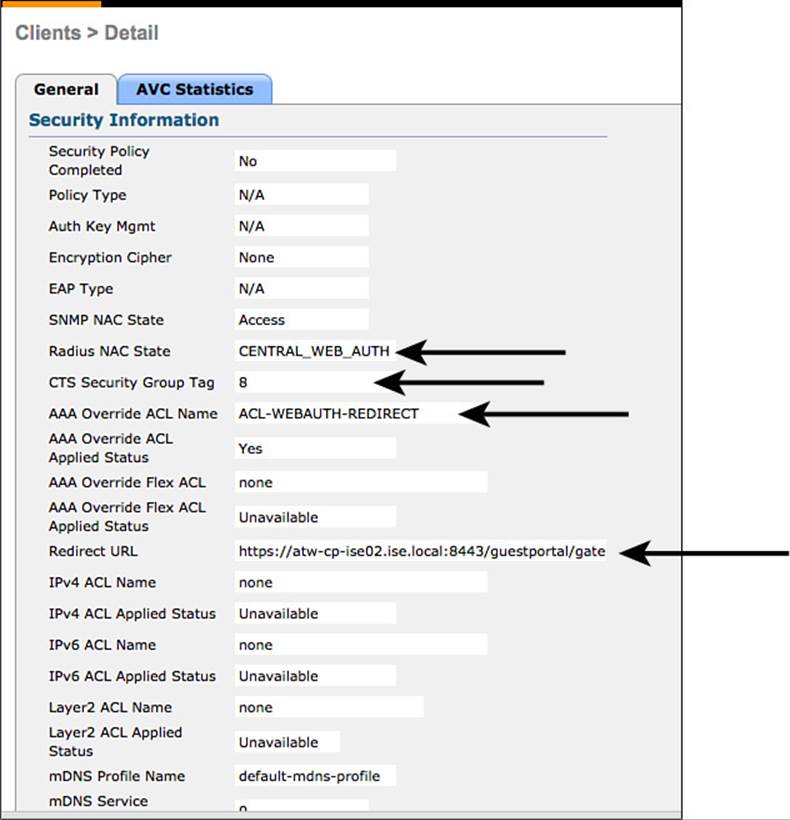
Figure 22-38 Clients > Detail.
Debug Commands
A number of useful debug commands can be used on Cisco switches and WLCs to see the details of an authentication. This type of visibility tends to be taken for granted, until such time as you need to troubleshoot.
The go-to debug command for a Cisco WLC is debug client <mac-address>. When you enter this command, all activity on the WLC related to that client is shown in the debug output, and no other client traffic on the controller is affected.
Cisco switches do not offer a debug client command, but they do have the ability to set the specific interface to constrain the debug command to debug interface <interface name>. Using this command before entering one of the other debug commands ensures that only the specified interface is affected with the debug process.
Other useful debug commands for Cisco switches include the following:
![]() debug authentication [ all | errors | events | feature | sync ]—Use this to see all activity related to the authentication manager that handles 802.1X, MAB, WebAuth, and the related session activity.
debug authentication [ all | errors | events | feature | sync ]—Use this to see all activity related to the authentication manager that handles 802.1X, MAB, WebAuth, and the related session activity.
![]() debug dot1x [ all | errors | events | packets | redundancy | registry | state-machine ]—Use this command to see all activity related to the 802.1X software in the switch.
debug dot1x [ all | errors | events | packets | redundancy | registry | state-machine ]—Use this command to see all activity related to the 802.1X software in the switch.
![]() debug epm [ all | api | error | events | redirect ]—Use this debug command when troubleshooting URL redirection and application of DACLs.
debug epm [ all | api | error | events | redirect ]—Use this debug command when troubleshooting URL redirection and application of DACLs.
Exam Preparation Tasks
Review All Key Topics
Review the most important topics in the chapter, noted with the key topics icon in the outer margin of the page. Table 22-2 lists a reference of these key topics and the page numbers on which each is found.
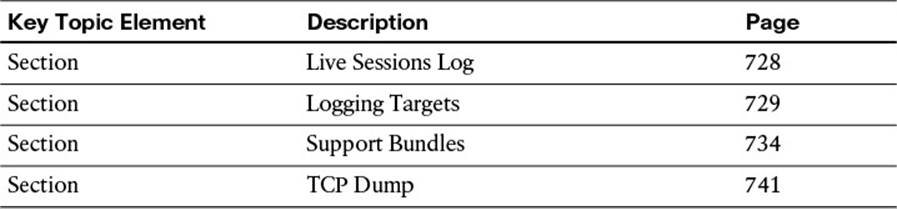
Table 22-2 Key Topics for Chapter 22
All materials on the site are licensed Creative Commons Attribution-Sharealike 3.0 Unported CC BY-SA 3.0 & GNU Free Documentation License (GFDL)
If you are the copyright holder of any material contained on our site and intend to remove it, please contact our site administrator for approval.
© 2016-2026 All site design rights belong to S.Y.A.