Packet Tracer Network Simulator (2014)
Chapter 4. Creating a Network Topology
So far, we have learned a lot about the devices available in Packet Tracer. In this chapter, we will start putting these devices to use. We'll learn what it takes to create a network topology, its connections, and link indications. Then we'll test the connectivity between the topologies and a PDU (Protocol Data Unit), both simple and complex. Once we are done with that, you'll no doubt be curious to see how data moves from one node to another. That will be taken care of by the simulation mode of Packet Tracer. Finally, we'll clean up our workspace a bit by using the clustering feature.
Connecting devices
Choosing the Connections icon from the device-type selection box lists several cables in the device-specific selection box. Packet Tracer provides the following cables that can be used to connect devices:
· Console: This is a console cable that is used to view the network device's console from a PC/laptop. One end of the cable connects to the console port of a network device while the other one connects to the RS-232 port on a PC/laptop.
· Copper straight-through: This is a standard Ethernet cable that is used to connect two devices that operate in different layers of the OSI model (such as hub to router and switch to PC). It can be used with Ethernet, Fast Ethernet and Gigabit Ethernet port types.
· Copper cross-over: This Ethernet cable connects devices operating in the same OSI layer (such as hub to hub, PC to PC, PC to router, and PC to printer). This cable can also be used with Ethernet, Fast Ethernet and Gigabit Ethernet port types.
· Fiber: This cable connects Fast Ethernet and Gigabit Ethernet ports of a fiber port.
· Phone: This RJ11 cable connects the analog phone to a VoIP phone or a PC's modem to a cloud. It also connects the modem interface of routers.
· Coaxial: The coaxial cable connects the cloud with a cable modem and a TV with the cloud.
· Serial DCE and DTE: Serial cables connect routers together and connect routers to the cloud. The DCE (Data Circuit-terminating Equipment) end has a clock symbol on it. Clocking must be enabled on this end using the clock rate <300-4000000> command to bring the line protocol up. If Serial DTE (Data Terminal Equipment) is chosen, the first device connected with this cable will be the DTE end and next device will be the DCE end. For the Serial DCE cable, this is just the opposite.
· Octal: This cable was introduced in PT Version 6. It has a high-density connector on one end and eight RJ45 plugs on the other.
· Automatically choose connection type: If you are confused about the cable to use, choosing this option automatically connects two devices with the best cable. We say best cable because if you have two routers with serial and Fast Ethernet interfaces on both of them and want to connect both of their Fast Ethernet interfaces, choosing this option will connect only their serial interfaces together. Similarly, console ports cannot be connected using this option.
Link status
After connecting devices together, you'll find a light at each end of the cable; this indicates the state of the connection, as follows:
· Bright green: This indicates that the physical link is up, but it doesn't indicate the status of the line protocol.
· Blinking green: This indicates link activity.
· Red: This indicates that the physical link is down. This can be caused by incorrect cables or by a port being administratively shut down.
· Amber: This appears only on switches, and indicates that the port is running the STP (Spanning Tree Protocol) algorithm to detect layer 2 loops.
Let us demonstrate how to connect devices in a topology containing a PC, laptop, switch, and a router. We will be using the following topology for this demo:
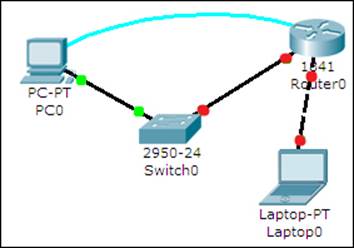
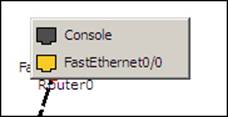
After adding the devices shown in the previous topology, click on a connection type from the device-type selection box and choose a connection. Click on a device and a context menu will list all of the interfaces available for the device. Select the interface and repeat the same steps on the other device to create a link between the two.
If a router is connected to any device, the link status will be red because routers have their ports in "shutdown" status by default. If a device is connected to a switch, the link is initially amber in color, indicating that it is going through the states of STP.
Testing connectivity with PDUs
Once a topology has been created, connectivity can be tested between devices by using either simple or complex PDUs. Although it is possible to do the same by pinging devices from their command-line interface, using the PDU option is quicker for large topologies.
Simple PDU
The Add Simple PDU option uses only ICMP (Internet Control Message Protocol). We will create a topology with a PC and a server to demonstrate how this option works:
1. Add a PC and a server to the workspace and connect them using a copper crossover cable.
2. Assign IP addresses to both of them in the same subnet. Example, PC1: 192.168.0.1/255.255.255.0 and PC2: 192.168.0.2/255.255.255.0.
3. From the common tools bar, click on the closed envelope icon or use the shortcut key P.
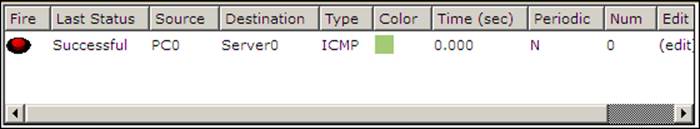
4. The pointer will change to an envelope symbol. Click on the PC first and then on the server. Now look at the User Created Packet box. You'll see the status as Successful and will also see the source, the destination, and the type of packet that was sent.
That was very simple, wasn't it? Now let's see what complex PDUs have to offer.
Complex PDU
We will demonstrate complex PDUs with the same PC-Server topology:
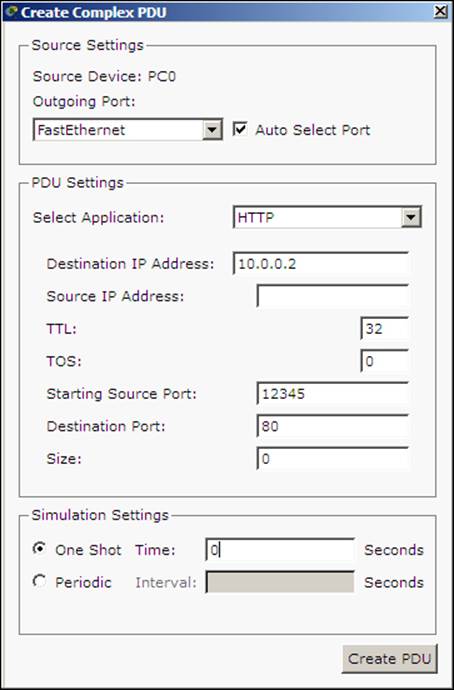
1. Click on the open envelope icon or press C; this is the Add Complex PDU option.
2. Click on the PC and the Create Complex PDU dialog box opens. Select the application and fill the Destination IP address (IP of the server), Starting Source Port, and Time fields, and then click on the Create PDU button.
3. Now click on the server and then look at the user-created packet box. An entry indicates a successful TCP three-way handshake as shown in the following screenshot::
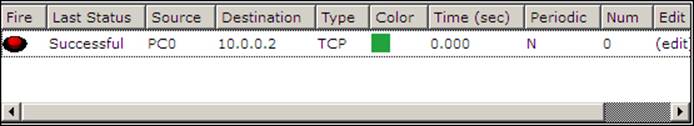
See the red button under the Fire column? Double clicking on it will send the same packet again.
Using the simulation mode
All of this was done while we were working in real-time mode, so the only indication of traffic was the link status blinking green. But, using simulation mode, you can see packets flowing from one node to another and can also click on a packet to see detailed information categorized by OSI layers.
Use the realtime/simulation tab to switch to the simulation mode.
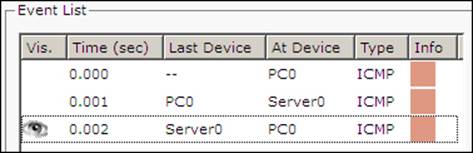
Click on the Auto Capture / Play button to begin packet capture. Try a Simple PDU, as described in the previous section, and the event list will be populated with three entries, indicating the creation of an ICMP packet, ICMP echo sent, and ICMP reply received:
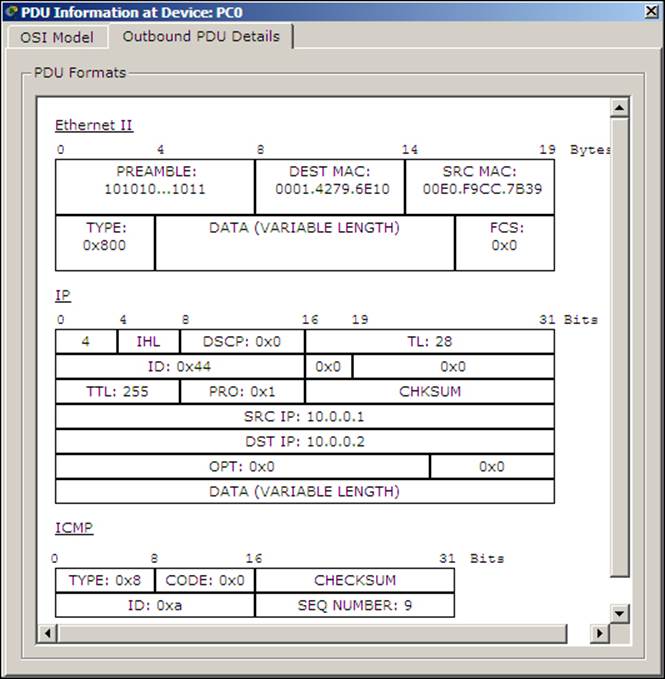
If you click on a packet (the envelope icon), you'll be presented with the packet information categorized according to OSI layers. The Outbound PDU Details tab lists each layer's information in a packet format:
The simulation mode has a Play Controls section that works similar to the controls of a media player and is as follows:
· Back: This button moves the process one step back each time it is clicked on.
· Auto Capture / Play: Pressing this button results in all of the network traffic (chosen under event filters) being continuously captured until this button is pressed again.
· Capture/Forward: This is the manual mode of the previous button. This has to be pressed each time to move the packet from one place to another.
Clustering a topology
When large topologies are created, it becomes difficult to understand them after a while. Clustering comes to the rescue by combining several devices that you choose into a single cloud icon. Then, double-clicking on the cluster expands and displays the devices normally.
Let us see how to create a cluster:
1. We'll be using the following topology containing three switches and nine PCs. While this is not at all cluttered, it will give you an idea when to use this feature.
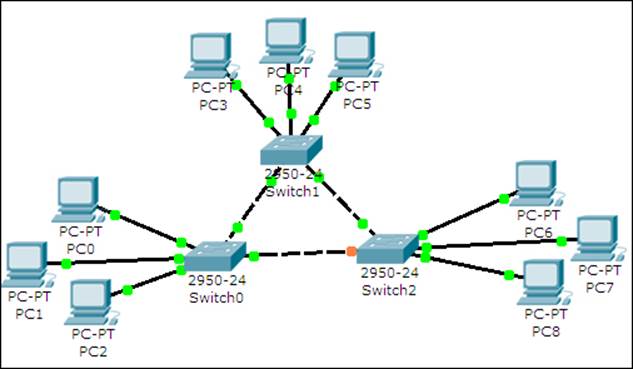
2. Click on the whitespace next to PC3; drag your mouse to select PC3, PC4, PC5, and Switch1; and click on the New Cluster button on the top-right corner. Repeat these steps selecting the other two sets of three PCs and a switch.
3. You'll get a clustered view as follows:
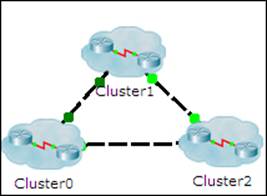
4. Double-clicking on a cluster expands it and displays only the devices within it. To go back, click on the Back button on the top-left corner.
Clusters can also be created inside clusters. A cluster is a feature of the logical workspace and hence does not affect how devices are displayed in the physical workspace.
Summary
In this chapter, we learned the nuances of creating a network topology in Packet Tracer, the types of connections available, and link statuses. We also saw how to test connectivity by using simple and complex PDUs. The test feature will help you a lot as you build complex topologies. Then we saw the simulation mode of Packet Tracer—go ahead and explore this mode using hubs and look at the difference between hubs and switches. Finally, we learned about creating and managing clusters.
In the next chapter, we will move the physical workspace of Packet Tracer and start creating wiring closets, offices, and entire cities! You will learn about the physical limitations of each network technology and the purpose of devices such as repeaters.
All materials on the site are licensed Creative Commons Attribution-Sharealike 3.0 Unported CC BY-SA 3.0 & GNU Free Documentation License (GFDL)
If you are the copyright holder of any material contained on our site and intend to remove it, please contact our site administrator for approval.
© 2016-2025 All site design rights belong to S.Y.A.