Expert MySQL: Second Edition (2012)
Part II. Extending MySQL
Using a hands-on approach, this section provides the tools you need to explore and extend the MySQL system. It introduces you to how the MySQL code can be modified and explains how you can use the system as an embedded database system. Chapter 5 reviews debugging skills and techniques that help make development easy and less prone to failure. It presents several debugging techniques, along with the pros and cons of each. Chapter 6 contains a tutorial on how to embed the MySQL system in enterprise applications. Chapter 7presents the most popular modification to the MySQL code. You’ll learn how to modify SQL commands to add new parameters and functions, and how to add new SQL commands. Chapter 8 is a tour of the high availability components of MySQL. You’ll learn how to extend MySQL for use in your own custom, high-availability solution. Chapter 9 presents a tutorial on building authentication plugins for creating your own authentication mechanism for connecting to MySQL. Chapter 10 examines the MySQL pluggable storage-engine capability, complete with examples and projects that permit you to build a sample storage engine.
Chapter 5. Debugging
This chapter discusses one of the most powerful tools any developer can wield: debugging. Good debugging skills help ensure that your software projects are easy to develop and less prone to failure. I’ll also explore the most common techniques for debugging the MySQL system. If you have already developed solid debugging skills, feel free to skim the following sections and move on to the section “Debugging MySQL.”
Debugging Explained
Anyone who has written anything more substantial than a “Hello world” program has encountered defects (bugs) in his software. Although most defects are easily found, others can be difficult to locate and correct.
If you wanted to explain the concept of debugging to a novice developer, you’d probably tell her that it’s largely a process of troubleshooting in an effort to discover what went wrong. You might also note that developing good debugging skills comes from mastering the appropriate debugging techniques and tools. While this may be an adequate introductory definition, take the time to better understand debugging nuances.
For starters, it’s important to properly frame the sort of defect you’re trying to locate and correct. There are two basic types of defects: syntax errors and logic errors. Syntax errors are naturally found during the code compilation process, and although they, too, may be difficult to correct, we must correct them to build the software. Logic errors are those types of errors not found during compilation, and, thus, they are usually manifested as defects during the execution of the software. Debugging, therefore, is the act of finding and fixing errors in your program.
![]() Note Available tools that you can run at compile time (or earlier) help minimize the risk of logic errors. They range from simple flow-control analyzers that detect dead code to more sophisticated range and type checkers that walk your code to locate possible data mismatches. Other tools check for proper error handling using best practices for code hardening.
Note Available tools that you can run at compile time (or earlier) help minimize the risk of logic errors. They range from simple flow-control analyzers that detect dead code to more sophisticated range and type checkers that walk your code to locate possible data mismatches. Other tools check for proper error handling using best practices for code hardening.
When a logic error is found, the system usually does something odd or produces erroneous data. In the more extreme cases, the system may crash. Well-structured systems that include code hardening best practices tend to be more robust than others, because they are designed to capture and handle errors as they occur. Even then, some errors are so severe that the system crashes (or the operating system terminates it) in order to protect the data and the system state.
The art of debugging software is the ability to quickly locate the error, either by observing the system as its state changes or by direct inspection of the code and its data. We call the tools that we use to debug system debuggers. In the following sections, I’ll examine some common debugging techniques and related debuggers.
The origins of debugging
You have no doubt heard stories about how the term computer bug was coined, and I’d like to tell my favorite one. I have the pleasure of working near the location where Rear Admiral Grace Hopper discovered the first computer bug. Legend has it that Hopper was working with a large computational computer called a Mark II Aiken Relay Calculator in 1945. To call it a large computer today would be a stretch, but it was the size of a semi back then. When a troublesome electronic problem was traced to a failed relay that had a moth trapped in it, Hopper noted that the source of the error was a “bug” and that the system had been “debugged” and was now operational. To this day, we refer to the removal of defective code as debugging.
Debugging Techniques
There are almost as many debugging techniques as there are developers. It seems as if everyone debugs his code in a slightly different way. These approaches, however, can generally be grouped into several categories.
The most basic of these approaches are included in the source code and become part of the executable. These include inline debugging statements (statements that print messages or values of variables during execution (e.g., printf("Code is at line 199. my_var = %d\n", my_var);) and error handlers. Most developers use these techniques either as a last resort (when a defect cannot be found easily) or during the development phase (to test the code as it is being written). While you may think that error handlers have more to do with robustness and hardening than with debugging, they can also be powerful debugging tools. Since this approach embeds the debugging code into the program, you can use conditional compilation directives to omit the code when debugging is complete. Most developers leave the debugging statements in the code, and, thus, they become part of the program. When using this technique, take care to ensure that the added debugging code does not adversely affect the program.
The debugging technique most of you know best is the use of external debuggers. External debuggers are tools designed to either monitor the system in real time or permit you to watch the execution of the code with the ability to stop and start the code at any point. These techniques are described in detail in the following sections. First, though, let’s look at the basic process for debugging.
Basic Process
Every debugging session will be unique, but the process should always follow the same basic steps. Being consistent in your debugging process can help make the experience more effective and more rewarding. There’s no better feeling than crushing a particularly nasty bug after chasing it for hours. While you may have long established a preferred debugging method, chances are it consists of at least these steps:
1. Identify the defect (bug reporting, testing).
2. Reproduce the defect.
3. Create a test to confirm the defect.
4. Isolate the cause of the defect.
5. Create a corrective patch and apply it.
6. Run a test to confirm that the defect was repaired: Yes—continue, No—Go back to 4.
7. Run regression tests to confirm that the patch does not affect other parts of your system.
Identifying the defect can sometimes be hard. When faced with a defect report, be it an official bug report or a failed system test, you may be tempted to dismiss the defect as spurious, especially when the defect is not obvious. Those defects that cause the system to crash or damage data naturally get your attention right away. But what about those that happen once in a while or only under certain conditions? For those, you have to first assume that the defect exists.
If you are fortunate enough to have a complete bug report that contains a description of how to re-create the defect, you can create a test from the defect and run it to confirm the presence of the defect. If you don’t have a complete description of how to reproduce the defect, it can take some effort to get to that point.
Once you are able to re-create the defect, create a test that encompasses all of the steps in reproducing the problem. This test will be important later when you need to confirm that you’ve fixed the problem.
The next step is the one in which the real debugging begins: isolating the defect. This is the point at which you must employ one or more of the techniques discussed in this chapter to isolate and diagnose the cause of the defect. This is the most important and most challenging aspect of debugging software.
Creating a patch (sometimes called a diff or fix) for the defect is usually an iterative process much like coding itself. You should apply your corrections one step at a time. Make one change at a time and test its effects on the defect and the rest of the system. When you think you have a viable patch, rerun your defect test to confirm it. If you have corrected the problem, the test will fail. As a reminder, a test designed to find defects that doesn’t find the defect is considered a failed test—but that’s exactly what you want! If the test passes, return to inspection and repair, repeating the iteration until your defect test fails.
CREATING AND USING A PATCH
A little-known software-development technique is called a patch. A patch is simply a file that contains the differences between an original file and its modified form. When you create a patch, you run a GNU program called diff and save the output to a file. (You can find diff atwww.gnu.org/software/diffutils/diffutils.html. Unfortunately, the code is available only for Linux and Unix, but it can be run on Windows using Cygwin.) For example, if you were modifying the mysqld file and added a line of code to change the version number, you could create a patch for the code change by running the command diff -Naur mysqld.cc.old mysqld.cc > mysqld.patch. This would create a file that looks like:
--- mysqld.cc.old 2006-08-19 15:41:09.000000000 -0400
+++ mysqld.cc 2006-08-19 15:41:30.000000000 -0400
@@ -7906,6 +7906,11 @@
#endif
if (opt_log || opt_update_log || opt_slow_log || opt_bin_log)
strmov(end, "-log"); // This may slow down system
+/* BEGIN DBXP MODIFICATION */
+/* Reason for Modification: */
+/* This section adds the DBXP version number to the MySQL version number. */
+ strmov(end, "-DBXP 1.0");
+/* END DBXP MODIFICATION */
}
You can also use diff when you want to create a difference file for an entire list of files or an entire directory. You can then use the resulting file to patch another installation of the files somewhere else.
When you use the patch, you use the GNU program called patch. (You can find patch at www.gnu.org/software/patch/. Unfortunately, once again the code is available only for Linux and Unix, but can be run on Windows using Cygwin.) The patch program reads the patch file from the diff program and applies it to the file as specified in the top of the patch. For example, to patch a mysqld.cc file that doesn’t have the change you created with diff, you can run the command patch < mysqld.patch. The patch program applies the changes to the mysqld.cc file and merges the changes into the file.
Creating and applying patches is a handy way of distributing small changes to files—such as those encountered when fixing defects. Whenever you fix a bug, you can create a patch and use it to track and apply the same changes to older files.
Many open-source projects use the patch concept to communicate changes. In fact, patches are the primary way in which the global community of developers makes changes to the MySQL source code. Instead of uploading whole files, developers can send a patch to Oracle. From there, Oracle can examine the patch for correctness and either accept the changes (and apply the patch) or reject them. If you have never used the diff and patch programs, feel free to download them and experiment with them as you work through the examples.
Last, when the defect has been repaired, you should perform a regression-testing step to confirm that no other defects have been introduced. If you are fortunate to be working on a system that is built using a component or modular architecture, and the system is documented well, you may be able to easily identify the related components or modules by examining the requirements matrix. A requirements matrix tracks the requirements from use case, class, and sequence diagrams and identifies the tests created for each. Thus, when one part of a class (module) changes, you can easily find the set of tests you need to run for your regression testing. If you do not have a requirements matrix, you can either create one using a simple document or spreadsheet or annotate the source code files with the requirements they satisfy.
Approaches to Debugging
You can take various approaches to debugging. These include simply displaying or printing values of interest or tracing suspect sections of code using interactive debuggers. You can even add special commands to your code ahead of time to facilitate debugging down the road—a practice termed instrumentation.
Inline Debugging Statements
Most novice developers start out placing print statements in their code. It is a common form of testing variables that permits them to learn the art of programming. You may think that any debugging technique that uses inline debugging statements is rudimentary or cumbersome, and you’d be partially correct. Inline debugging statements are cumbersome, but they can be a powerful tool. Inline debugging statements are any code that is used to document or present the data or state of the system at a point in time.
Before I present an example of inline debugging statements, let’s consider the impact of using them. The first thing that comes to mind is that the debugging statements are code! Therefore, if the debugging statement does anything other than writing to the standard error stream (window), it could result in further unintended consequences. It should also be noted that inline debugging statements are usually stripped out or ignored (using conditional compilation) prior to building the system. If you were a tried-and-true validation-and-verification proponent, you’d argue that this process introduces additional unwarranted risk. That is, the system being compiled for use is different than the one used to debug.
Inline debugging statements, however, can be helpful in situations in which either you cannot use an external debugger or the defect seems to occur at random intervals.1 These situations could occur, for example, in real-time systems, multiprocess and multithreaded systems, and large systems operating on large amounts of data.
INSTRUMENTATION
Many developers consider inline debugging statements to be a form of instrumentation. This includes code designed to track performance, data, user, client, and execution metrics. Instrumentation is usually implemented by placing statements in the code to display data values, warnings, errors, and so forth, but it may also be implemented using wrapper code that monitors the execution in a sandbox-like environment. One example of a software instrumentation suite is Pin by Intel. For more information about software instrumentation and Pin, seehttp://www.pintool.org/.
There are two types of inline debugging statements. The first is concerned with inspection. Lines of code are added to present the state of memory or the value of variables. This type of debugging statement is used during development and is typically commented out or ignored using conditional compilation. The second concerns tracing the path of the system as it executes. This type of debugging statement can be used at any time and is usually enabled or disabled by a switch at runtime. Since the first type is familiar to most developers (most of us learned debugging this way), I’ll discuss the second with an example.
Suppose you have a large system that is running in a multithreaded model, and you’re trying to determine what is causing a defect. Using inline debugging statements that present memory and variable values may help, but defects are rarely that easy to find. In this case, you may need to discover the state of the system leading up to the defect. If you had code in your system that simply wrote a log entry whenever it entered a function and another when it left (perhaps with some additional information about the data), you could determine what state the system was in by examining the log. Listing 5-1 depicts an excerpt from the MySQL source code that includes inline debugging statements. I’ve highlighted the debugging code in bold. In this case, each inline debugging statement writes an entry in a trace file that can be examined after the system executes (or crashes).
Listing 5-1. Example of Inline Debugging Statements
/***************************************************************************
** List all Authors.
** If you can update it, you get to be in it :)
***************************************************************************/
bool mysqld_show_authors(THD *thd)
{
List<Item> field_list;
Protocol *protocol= thd->protocol;
DBUG_ENTER("mysqld_show_authors");
field_list.push_back(new Item_empty_string("Name",40));
field_list.push_back(new Item_empty_string("Location",40));
field_list.push_back(new Item_empty_string("Comment",80));
if (protocol->send_result_set_metadata(&field_list,
Protocol::SEND_NUM_ROWS | Protocol::SEND_EOF))
DBUG_RETURN(TRUE);
show_table_authors_st *authors;
for (authors= show_table_authors; authors->name; authors++)
{
protocol->prepare_for_resend();
protocol->store(authors->name, system_charset_info);
protocol->store(authors->location, system_charset_info);
protocol->store(authors->comment, system_charset_info);
if (protocol->write())
DBUG_RETURN(TRUE);
}
my_eof(thd);
DBUG_RETURN(FALSE);
}
Notice in Listing 5-1 that the first inline-debugging-statements code documents the arrival of the system at this function, or its state, by indicating the name of the function. Notice also that each exit point of the function is documented along with the return value of the function. An excerpt from a trace file running the SHOW AUTHORS command is shown in Listing 5-2. I’ve omitted a large section of the listing in order to show you how the trace file works for a successful execution of the SHOW AUTHORS command.
Listing 5-2. Sample Trace File
T@3 : | | | | >mysqld_show_authors
...
T@3 : | | | | | >send_result_set_metadata
T@3 : | | | | | | packet_header: Memory: 0x7f889025c610 Bytes: (4)
01 00 00 01
T@3 : | | | | | | >alloc_root
T@3 : | | | | | | | enter: root: 0x270af88
T@3 : | | | | | | | exit: ptr: 0x287f9c0
T@3 : | | | | | | <alloc_root 247
T@3 : | | | | | | >Protocol::write
T@3 : | | | | | | <Protocol::write 820
T@3 : | | | | | | packet_header: Memory: 0x7f889025c5c0 Bytes: (4)
1A 00 00 02
T@3 : | | | | | | >Protocol::write
T@3 : | | | | | | <Protocol::write 820
T@3 : | | | | | | packet_header: Memory: 0x7f889025c5c0 Bytes: (4)
1E 00 00 03
T@3 : | | | | | | >Protocol::write
T@3 : | | | | | | <Protocol::write 820
T@3 : | | | | | | packet_header: Memory: 0x7f889025c5c0 Bytes: (4)
1D 00 00 04
T@3 : | | | | | | packet_header: Memory: 0x7f889025c5b0 Bytes: (4)
05 00 00 05
T@3 : | | | | | <send_result_set_metadata 807
T@3 : | | | | | info: Protocol_text::store field 0 (3): Brian (Krow) Aker
T@3 : | | | | | info: Protocol_text::store field 1 (3): Seattle, WA, USA
T@3 : | | | | | info: Protocol_text::store field 2 (3): Architecture, archive, federated, bunch of little stuff :)
T@3 : | | | | | >Protocol::write
T@3 : | | | | | <Protocol::write 820
T@3 : | | | | | packet_header: Memory: 0x7f889025ca70 Bytes: (4)
5E 00 00 06
T@3 : | | | | | info: Protocol_text::store field 0 (3): Marc Alff
T@3 : | | | | | info: Protocol_text::store field 1 (3): Denver, CO, USA
T@3 : | | | | | info: Protocol_text::store field 2 (3): Signal, Resignal, Performance schema
T@3 : | | | | | >Protocol::write
...
47 00 00 55
T@3 : | | | | | info: Protocol_text::store field 0 (3): Peter Zaitsev
T@3 : | | | | | info: Protocol_text::store field 1 (3): Tacoma, WA, USA
T@3 : | | | | | info: Protocol_text::store field 2 (3): SHA1(), AES_ENCRYPT(), AES_DECRYPT(), bug fixing
T@3 : | | | | | >Protocol::write
T@3 : | | | | | <Protocol::write 820
T@3 : | | | | | packet_header: Memory: 0x7f889025ca70 Bytes: (4)
4F 00 00 56
T@3 : | | | | | >set_eof_status
T@3 : | | | | | <set_eof_status 483
T@3 : | | | | <mysqld_show_authors 279
![]() Note These inline debug statements are turned off by default. You can turn them on by compiling the server with debug and running the server in debug mode using the --debug command-line switch. This creates a trace file with all of the debug statements. On Linux, the trace file is stored in /tmp/mysqld.trace and on Windows, the file is stored in c:\mysqld.trace. These files can become quite large as all of the functions in MySQL are written using inline debugging statements.
Note These inline debug statements are turned off by default. You can turn them on by compiling the server with debug and running the server in debug mode using the --debug command-line switch. This creates a trace file with all of the debug statements. On Linux, the trace file is stored in /tmp/mysqld.trace and on Windows, the file is stored in c:\mysqld.trace. These files can become quite large as all of the functions in MySQL are written using inline debugging statements.
This technique, while simple, is a versatile tool. When you examine the flow of the system by inspecting the trace file, you can easily discover a starting point for further investigation. Sometimes just knowing where to look can be the greatest challenge.
Error Handlers
Have you ever encountered an error message while using software? Whether you’re using something created in the Pacific Northwest or created by the global community of developers, chances are you’ve seen the end result of an error handler.
You may be wondering why I would include error handlers as a debugging technique. That’s because a good error handler presents the cause of the problem along with any possible corrective options. Good error handlers provide developers with enough information to understand what went wrong and how they might overcome the problem, and in some cases, they include additional information that can help developers diagnose the problem. That last bit can sometimes go too far. Too many of us have seen dialog boxes containing terse error messages with confusing resolution options, such as the one shown in Figure 5-1.
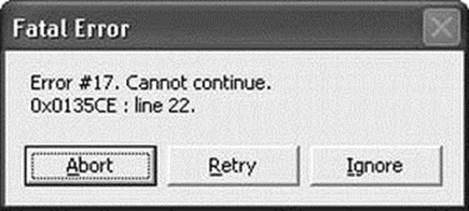
Figure 5-1. Poor error handler example
As humorous as this example may be, users see messages like it every day. Developers who write error messages like this are not making themselves clear. Statements that may be perfectly understandable to developers of a system can be gibberish to its users. The best policy is to create error messages that explain what has gone wrong and offer the user a resolution, if one exists, or at least a means to report the problem. It is also a good idea to provide a way to record the information that a developer needs to diagnose the problem. This could be done via logging, a system state dump, or an auto-generated report. Figure 5-2 depicts a better example of how to present errors to the user.
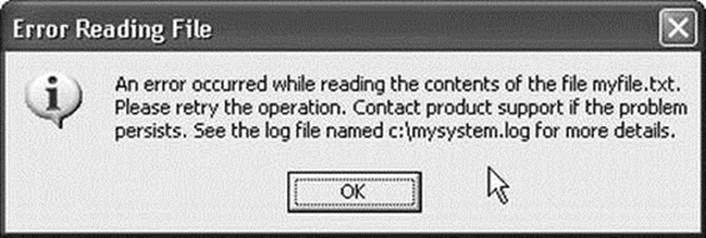
Figure 5-2. Better error handler example
Error handlers aren’t just for reporting errors. There is another construct that is also called an error handler. This construct is simply the code used to trap and process (handle) errors. Perhaps you are familiar with the C++ try...catch block. This is an excellent example of an error handler, as the language has been modified to include the construct in its syntax. Listing 5-3 depicts a typical try...catch block. The example shows the basic syntax for the C++ error handler (also called an exception handler).
Listing 5-3. Example C++ Error Handler try . . . catch Block
try
{
//attempt file operation here
}
catch (CFileException* e)
{
//handle the exception here
}
While Listing 5-3 is less sophisticated than the C++ construct, you can create error handlers in just about any language that supports conditional statements. For example, Listing 5-4 shows an example from the C language. Here, we see that the return code is checked and, depending on the failure, the code handles the problem. Take care when creating error handlers from scratch. You want to be sure to cover all possible conditions so that you can successfully recover or at least process the error in a way that does not affect the performance of the system and (more important) loss or corruption of data.
Listing 5-4. Example C Error Handler
if (!(azopen(&frm_stream, az_file, O_RDONLY|O_BINARY)))
{
if (errno == EROFS || errno == EACCES)
DBUG_RETURN(my_errno= errno);
DBUG_RETURN(HA_ERR_CRASHED_ON_USAGE);
}
Error handlers cover more than simply reporting errors. They are also a front line of defense for debugging. Good error handlers are written to not only trap and process the error but also to store or display diagnostic information.
Take another look at Listing 5-4. This code was taken from the ha_archive.cc file of the MySQL source code. Notice the line of code that is highlighted. This line is one of the numerous inline debugging statements found throughout the code, but its use in this error handler shows how you can record the diagnostic information necessary to troubleshoot a problem with this part of the system. If I were debugging a session about this code, I could run the server in debug mode and look to the trace file to read the diagnostic information recorded by this error handler.
I encourage you to consider writing all of your error-handling code in this manner. You can always display an appropriate error message to the user, but you should also always trap the error codes (return values) and record them and any other pertinent diagnostic information. Using error handlers in this manner will greatly enhance your debugging skills and make your system much easier to diagnose. I have found that sometimes I don’t even need to run a debugger at all. A study of the trace files containing the diagnostic information can be enough to lead me directly to the source of the problem.
External Debuggers
A debugger is a software tool designed to analyze a set of executing code and trace the flow of the system as it executes. Most tools that we consider debuggers are actually executed in conjunction with the software being debugged, hence the name external debugger. For brevity and conformity, I’ll refer to all the tools discussed in this section as simply debuggers.
There are several types of debuggers, but most fit into one of three categories. The debuggers you may be most familiar with are those that run as separate tools that you can attach to a running process and use to control the system. There are also debuggers designed to run as an interactive process, combining control with inspection capabilities. Others include specialized debuggers offering more advanced control of the system. I’ll examine each of these types in the following sections.
Stand-alone Debuggers
The most common debugger is a stand-alone debugger. These run as a separate process and permit you to attach to a system that has been compiled to include the appropriate debug information (for mapping to source code, especially linking to the symbols in the code). Unless you’re debugging code that contains the source files (such as some forms of interpreted languages), you usually must have the source-code files available and use those to complete the connection to the running process.
Once you’ve attached to the system (or process) you want to debug, stand-alone debuggers permit you to stop, start, and step through the execution. Stepping through refers to three basic operations:
1. Execute the current line of code and step into the next line of code.
2. Skip over the next line of code (execute function calls and return to the next line).
3. Execute until a particular line of code comes into focus.
The last operation usually refers to lines of code that have been tagged as the lines to stop on (called breakpoints) or the lines that are currently highlighted (called run to cursor).
Stand-alone debuggers provide tools for inspecting memory, the call stack, and even sometimes the heap. The ability to inspect variables is perhaps the most important diagnostic tool that debuggers can provide. After all, almost everything you will want to inspect is stored somewhere.
![]() Note A heap is a structure that stores available memory addresses in a tree structure for fast allocation and de-allocation of memory blocks. A stack is a structure that allows developers to place items on the stack in a first-in, last-out method (much like a stack of plates at a buffet).
Note A heap is a structure that stores available memory addresses in a tree structure for fast allocation and de-allocation of memory blocks. A stack is a structure that allows developers to place items on the stack in a first-in, last-out method (much like a stack of plates at a buffet).
Stand-alone debuggers are not typically integrated with the development environment. That is, they are not part of the compiler suite of tools. Thus, many operate outside the development environment. The advantage of using stand-alone debuggers is that there are many to choose from, each with a slightly different feature set. This allows you to choose the stand-alone debugger that best meets your needs.
A popular example of this type of debugger is the GNU Debugger (gdb). (For more information, visit www.gnu.org/software/gdb/documentation.) The gdb debugger, which on Linux, provides a way to control and inspect a system that has been compiled in debug mode.Listing 5-5 shows a sample program I wrote to calculate factorials. Those of you with a keen eye will spot the logic error, but let’s assume the program was run as written. When I enter a value of 3, I should get the value 6 returned. Instead, I get 18.
Listing 5-5. Sample Program (sample.c)
#include <stdio.h>
#include <stdlib.h>
static int factorial(int num)
{
int i;
int fact = num;
for (i = 1; i < num; i++)
{
fact += fact * i;
}
return fact;
}
int main(int argc, char *argv[])
{
int num;
int fact = 0;
num = atoi(argv[1]);
fact = factorial(num);
printf("%d! = %d\n", num, fact);
return 0;
}
If I want to debug this program using gdb, I first have to compile the program in debug mode using the command:
gcc -g -o sample sample.c
Once the program is compiled, I launch gdb using the command:
gdb sample
When the gdb debugger issues its command prompt, I issue breakpoints using the break command (supplying the source file and line number for the break) and run the program, providing the necessary data. I can also print out any variables using the print command. If I want to continue the execution, I can issue the continue command. Finally, when done, I can exit gdb with the quit command. Listing 5-6 shows a sample debug session using these commands.
Listing 5-6. Sample gdb Session
cbell@ubuntu:∼/source/sample$ gcc -g -o sample sample.c
cbell@ubuntu:∼/source/sample$ gdb sample
GNU gdb (Ubuntu/Linaro 7.2-1ubuntu11) 7.2
Copyright (C) 2010 Free Software Foundation, Inc.
License GPLv3+: GNU GPL version 3 or later < http://gnu.org/licenses/gpl.html >
This is free software: you are free to change and redistribute it.
There is NO WARRANTY, to the extent permitted by law. Type "show copying"
and "show warranty" for details.
This GDB was configured as "x86_64-linux-gnu".
For bug reporting instructions, please see:
< http://www.gnu.org/software/gdb/bugs/ >...
Reading symbols from /home/cbell/source/sample/sample...done.
(gdb) break sample.c:10
Breakpoint 1 at 0x40055a: file sample.c, line 10.
(gdb) run 3
Starting program: /home/cbell/source/sample/sample 3
Breakpoint 1, factorial (num=3) at sample.c:11
11 fact += fact * i;
(gdb) print i
$1 = 1
(gdb) print num
$2 = 3
(gdb) print fact
$3 = 3
(gdb) continue
Continuing.
Breakpoint 1, factorial (num=3) at sample.c:11
11 fact += fact * i;
(gdb) continue
Continuing.
3! = 18
Program exited normally.
(gdb) quit
cbell@ubuntu:
Do you see the logic error? I’ll give you a hint. What should the first value be for calculating the factorial of the number 3? Take a look at the variable declarations for the factorial method. Something smells with that int fact = num; declaration.
![]() Note Some folks may want to call debuggers such as gdb interactive debuggers, because they interact with the system while it is running, thus allowing the user to observe the execution. While this is true, keep in mind that gdb is controlling the system externally, and you cannot see or interact with the source code other than through very simplistic methods (e.g., the list command, list, lists the source code). If gdb provided a graphical user interface that presented the source code and allowed you to see the data and interact with the source code, it would be an interactive debugger. But wait, that’s what the ddd debugger does.
Note Some folks may want to call debuggers such as gdb interactive debuggers, because they interact with the system while it is running, thus allowing the user to observe the execution. While this is true, keep in mind that gdb is controlling the system externally, and you cannot see or interact with the source code other than through very simplistic methods (e.g., the list command, list, lists the source code). If gdb provided a graphical user interface that presented the source code and allowed you to see the data and interact with the source code, it would be an interactive debugger. But wait, that’s what the ddd debugger does.
Interactive Debuggers
These are debuggers that are part of the development environment, either as part of the compile-link-run tools or as an integrated part of the interactive development environment. Unlike stand-alone debuggers, interactive debuggers use the same or a very similar interface as the development tools. An excellent example of a well-integrated interactive debugger is the debugging facilities in Microsoft Visual Studio .NET. In Visual Studio, the interactive debugger is simply a different mode of the rapid-application-development process. You dress up a form, write a bit of code, and then run it in debug mode.
Figure 5-3 depicts a sample Visual Studio .NET 2005 debug session using a Windows variant of the sample program shown earlier.
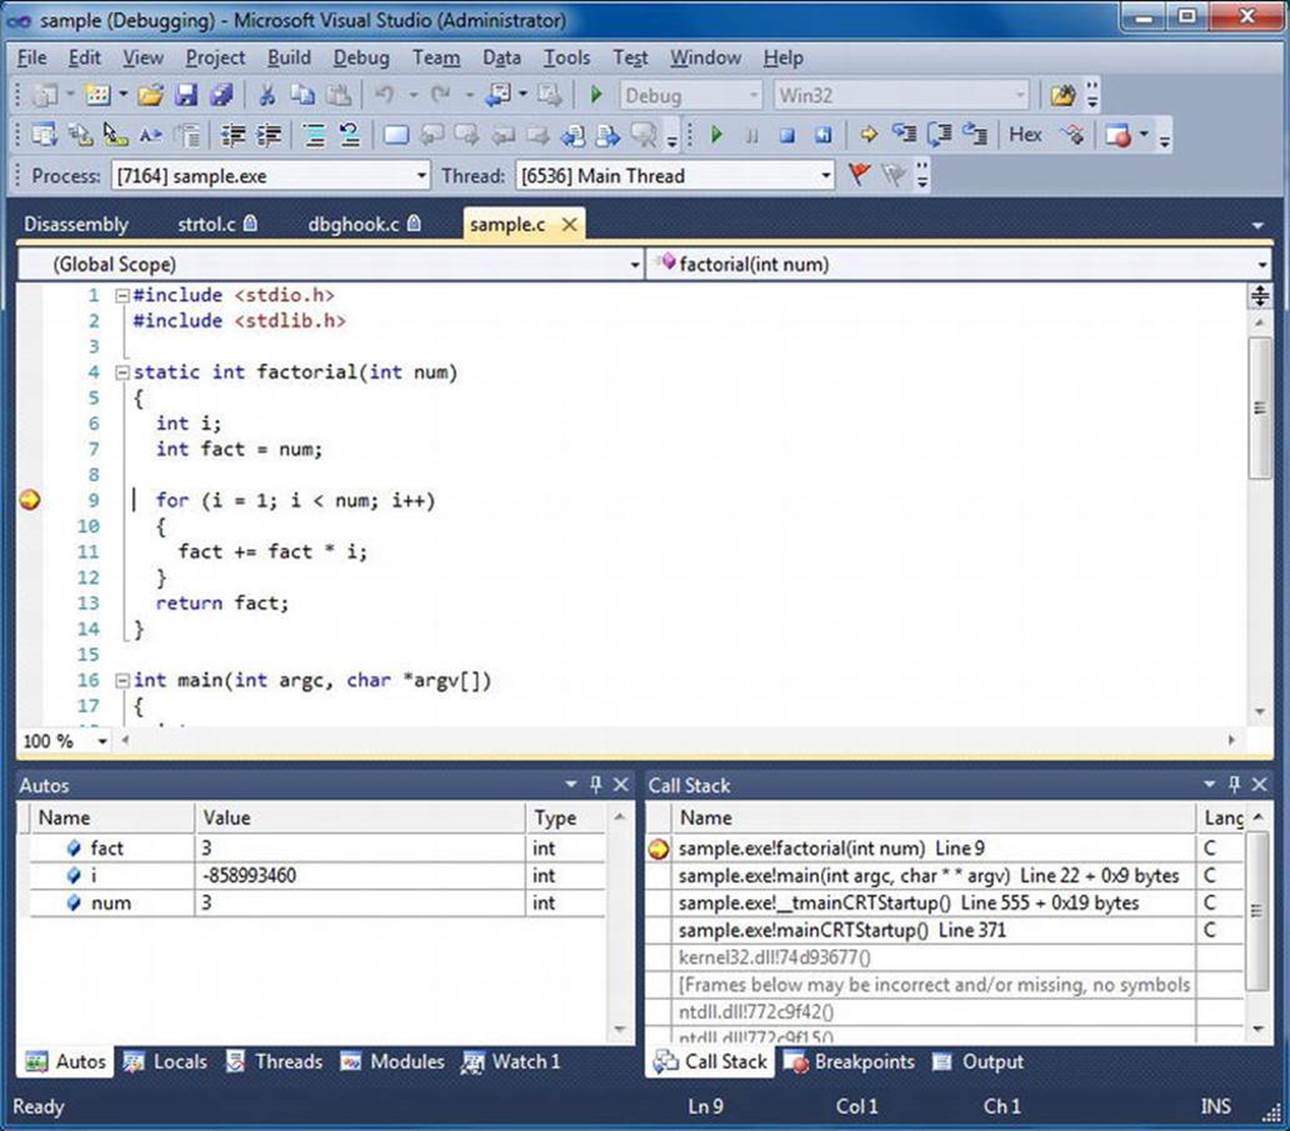
Figure 5-3. Sample Visual Studio debugging (sample.c)
Interactive debuggers have all of the same features as stand-alone debuggers. You can stop, start, step into, step over, and run to breakpoints or cursor. Interactive debugger are most useful when you detect the cause of a defect; you can stop the execution, make any necessary changes, and run the system again. Table 5-1 provides a brief description of these commands. While most debuggers have all of these commands and more, some use different names. Consult the documentation for your debugger for the precise names of the commands.
Table 5-1. Basic Debugger Control Commands
|
Command |
Description |
|
Start (Run) |
Executes the system. |
|
Stop (Break) |
Temporarily halts execution of the code. |
|
Step Into |
Runs the next code statement, changing focus to the following statement. If the statement being executed is a function, this command will change focus to the first executable statement in the function being called. |
|
Step Over |
Runs the next code statement changing focus to the following statement. If the statement being executed is a function, this command will execute the function and change focus to the next executable statement following the function call. |
|
Breakpoint |
The debugger stops when code execution reaches the statement wherethe breakpoint has been issued. Many debuggers allow the use of conditional breakpoints where you can set the breakpoint to occur based on an expression. |
|
Run to Cursor |
The debugger resumes execution but halts the execution when control reaches the code statement where the cursor is placed. This is a form of a one-use breakpoint. |
The compilation and linking in this scenario happens in the background; it often takes no longer than a moment to complete, and you’re back in the debugger. As you can imagine, interactive debuggers are real time savers. If you have never used a stand-alone debugger, you may be dismayed at the apparent lack of integration that stand-alone debuggers have with the source-code projects. What may seem like “old school” is really the state of most development. It is only through the relatively recent development of rapid-application-development tools that interactive debuggers have become the preferred tool for debugging.
GNU Data Display Debugger
Another example of an interactive debugger is the GNU Data Display Debugger (ddd), which is available at http://www.gnu.org/software/ddd. The ddd debugger permits you to run your program and see the code while it is running. It is similar in concept to the rapid-application-development debuggers such as Visual Studio. Figure 5-4 shows our sample program run in ddd.
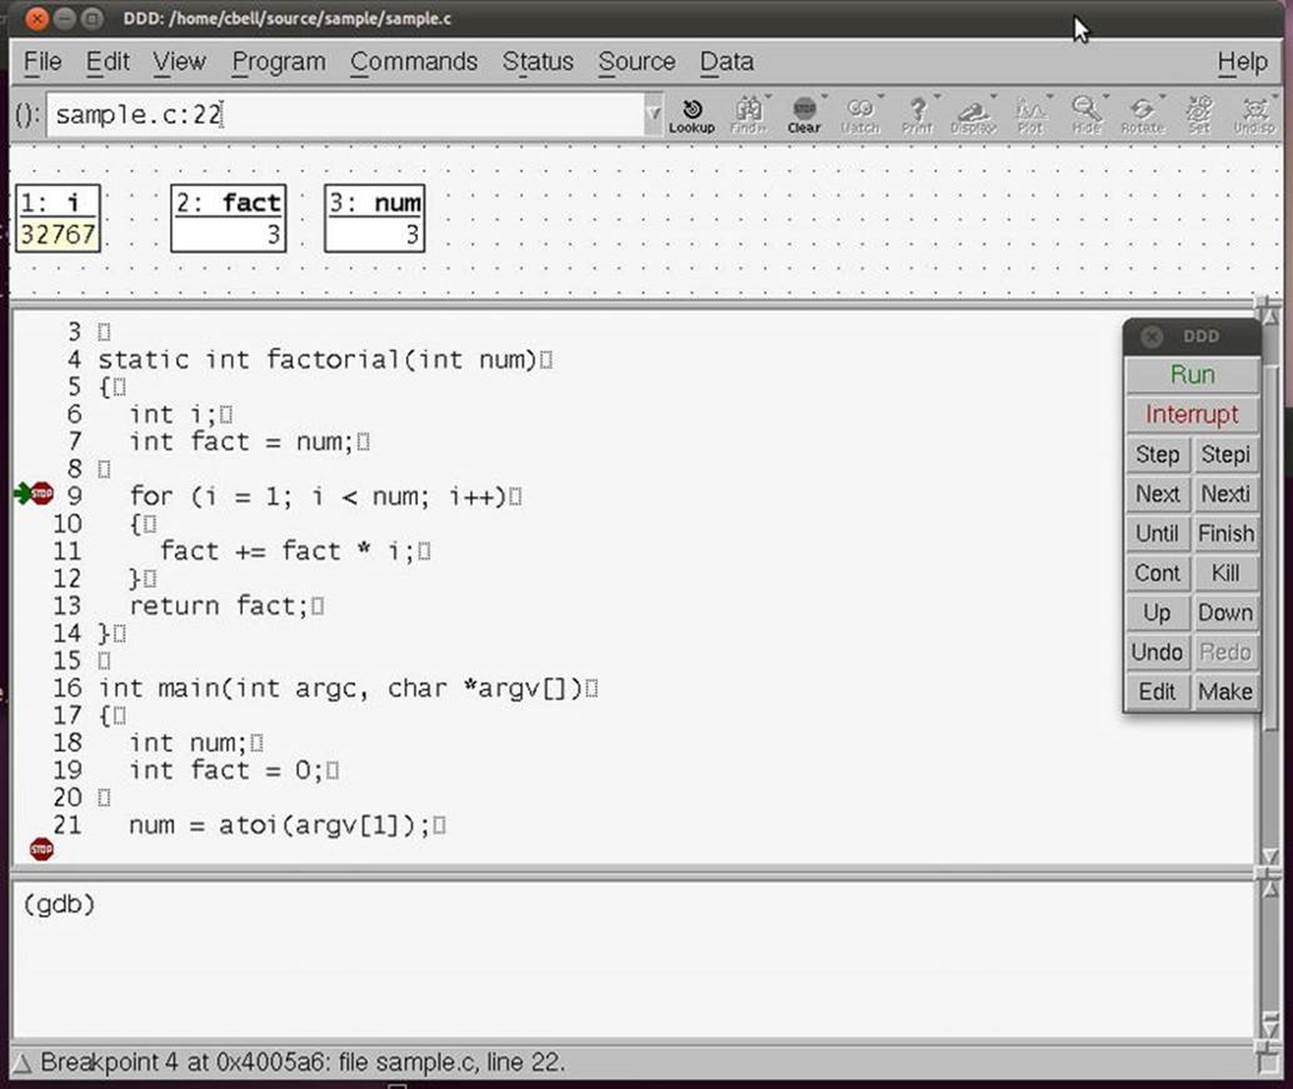
Figure 5-4. Sample ddd session debugging “sample.c”
Notice that the same variables are displayed in the upper portion of the window. With ddd, I can set breakpoints in the code by pointing and clicking on the line of code rather than having to remember the line number in the file I want to break on. I can also view the contents of any variable by double-clicking on the variable. I can even change values in a similar fashion. This allows me to experiment with how the code would perform with different values. This is a powerful feature that can allow the discovery of “off by one” errors (e.g., starting a list iterator index at 1 instead of 0).
![]() Note Some would call the ddd tool a stand-alone debugger, because it essentially operates in a stand-alone mode. Because of its sophisticated user interface and development-like layout, however, I consider the ddd tool a hybrid that matches the interactive type a bit better than most stand-alone debuggers. Besides, it really does kick gdb up a notch!
Note Some would call the ddd tool a stand-alone debugger, because it essentially operates in a stand-alone mode. Because of its sophisticated user interface and development-like layout, however, I consider the ddd tool a hybrid that matches the interactive type a bit better than most stand-alone debuggers. Besides, it really does kick gdb up a notch!
Bidirectional Debuggers
Despite all of the power that today’s debuggers have to offer, work is under way to make debugging even more efficient. Most interesting, researchers are investigating ways to both execute and undo operations in order to observe what each operation affected. This gives the person doing the debugging the ability to roll back the execution to discover the source of the defect. This is called backwards reasoning by the researchers who promote it. They contend that the most efficient way to determine what went wrong is the ability to observe the code executing and to be able to rewind the events when a defect is found and replay them to see what changed. Tools that implement this technique are called bidirectional debuggers.
One commercial product, called UndoDB by Undo Ltd. (http://undo-software.com), is available for the Linux platform for a modest fee. Undo offers an evaluation download that allows you to evaluate its product. UndoDB is a stand-alone debugger that uses gdb information. Unlike gdb, its commands allow you to reverse the execution to go back and undo the last statement. Listing 5-7 shows a sample debugging session using UndoDB with our sample program.
Listing 5-7. Sample UndoDB Session Debugging (sample.c)
cbell@ubuntu:∼/source/sample$ ∼/undodb-3.5.205/undodb-gdb sample
undodb-gdb: Reversible debugging system. Copyright 2006, 2007, 2008, 2009, 2010, 2011, 2012 Undo Ltd.
undodb-gdb: undodb-3.5.205
undodb-gdb: By running this software you agree to the terms in:
undodb-gdb: /home/cbell/undodb-3.5.205/demo_license.html
undodb-gdb: starting gdb
GNU gdb (Ubuntu/Linaro 7.2-1ubuntu11) 7.2
Copyright (C) 2010 Free Software Foundation, Inc.
License GPLv3+: GNU GPL version 3 or later < http://gnu.org/licenses/gpl.html >
This is free software: you are free to change and redistribute it.
There is NO WARRANTY, to the extent permitted by law. Type "show copying"
and "show warranty" for details.
This GDB was configured as "x86_64-linux-gnu".
For bug reporting instructions, please see:
< http://www.gnu.org/software/gdb/bugs/ >...
Reading symbols from /home/cbell/source/sample/sample...done.
(undodb-gdb) break sample.c:9
Breakpoint 1 at 0x400551: file sample.c, line 9.
(undodb-gdb) run 3
undodb-gdb: debug-server pid 2561, port 35605
Starting program: /home/cbell/source/sample/sample 3
undodb: license type: UndoDB version 3.5, demo, user: Charles Bell
Breakpoint 1, factorial (num=3) at sample.c:9
9 for (i = 1; i < num; i++)
(undodb-gdb) next
11 fact += fact * i;
(undodb-gdb) bnext
Breakpoint 1, factorial (num=3) at sample.c:9
9 for (i = 1; i < num; i++)
(undodb-gdb) next
undodb-gdb: Have switched to record mode.
11 fact += fact * i;
(undodb-gdb) break sample.c:13
Breakpoint 2 at 0x400575: file sample.c, line 13.
(undodb-gdb) continue
Continuing.
Breakpoint 2, factorial (num=3) at sample.c:13
13 return fact;
(undodb-gdb) print fact
$1 = 18
(undodb-gdb) bnext
9 for (i = 1; i < num; i++)
(undodb-gdb) print fact
$2 = 18
(undodb-gdb) bnext
11 fact += fact * i;
(undodb-gdb) print fact
$3 = 6
(undodb-gdb) print i
$4 = 2
(undodb-gdb) next
9 for (i = 1; i < num; i++)
(undodb-gdb) print i
$5 = 2
(undodb-gdb) print fact
$6 = 18
(undodb-gdb) print num
$7 = 3
(undodb-gdb) next
undodb-gdb: Have switched to record mode.
Breakpoint 2, factorial (num=3) at sample.c:13
13 return fact;
(undodb-gdb) continue
Continuing.
3! = 18
(undodb-gdb) quit
A debugging session is active.
Inferior 1 [Remote target] will be killed.
Quit anyway? (y or n) y
cbell@ubuntu:∼/source/sample$
Notice the commands bnext in Listing 5-7. The bnext command is one of the unique UndoDB commands that allows for the back trace (bidirectional) of the execution. All the UndoDB back-trace commands are mirrors of the gdb commands. That makes this debugger very friendly to developers who use gdb. Its greatest power is being able to rollback statements to rerun portions of the code without starting over.
THERE IS NO WRONG WAY
You may be wondering why I have included debugging methods that some may suggest are “old school” and not the latest interactive-development trend. I submit that it is possible to argue that one debugging method is better than another in certain circumstances or even in the general case. It is true, however, that any method presented here, and potentially many others, can lead to successful results. Organizations should not force developers into a particular mold of “do it this way” (which applies to more than just debugging), because what works well for one instance or person may not work for others. My recommendation is to adopt whatever debugging tools or methods you feel best meet your needs and project. If that means using a trace-like method or an interactive method, it doesn’t matter, as long as you can efficiently and effectively debug your project. If you develop good troubleshooting skills and can get the information you need to discover the problem, how you get there shouldn’t matter.
Debugging MySQL
You may have excellent debugging skills when debugging your own applications, some of which may indeed be quite large. Few, however, have the opportunity to attempt to debug a large system, such as MySQL. While it isn’t difficult, I have found many challenges during my work with the source code. I hope the following sections give you the knowledge that I gained through my many trials. I encourage you to read through this section at least once and then follow my examples when you have time.
I’ll begin by examining a debugging session with an example of debugging MySQL using inline debugging statements. I’ll then move on to an error handler example, followed by an in-depth look at debugging MySQL on both Linux and Windows. If you have been waiting for a chance to get your hands dirty with the MySQL source code, this section is for you. Roll up those sleeves and grab some of your favorite caffeine-laden beverage, because we’re going in!
Inline Debugging Statements
Oracle has provided their customers with a robust inline-debugging-statements debugging tool based on the debugger originally created by Fred Fish and later modified by one of MySQL’s founders, Michael “Monty” Widenius, for thread safety. This tool is actually a collection of C macros called DBUG.
Using DBUG is easy, because the macros provided allow you to simply place a single code statement where you want to record something. The Oracle developers have many good examples throughout the code. They record a great many aspects of the execution of the server. The individual macros are referred to as debug tags (called DBUG tags in the MySQL documentation). The tags currently used in the MySQL source code include:
· DBUG_ENTER: Identify entry into a function using function specification.
· DBUG_EXIT: Record return results from function.
· DBUG_INFO: Record diagnostic information.
· DBUG_WARNING: Record an unusual event or unexpected event.
· DBUG_ERROR: Record error codes (used in error handlers mainly).
· DBUG_LOOP: Record entry or exit from a loop.
· DBUG_TRANS: Record transaction information.
· DBUG_QUIT: Record a failure resulting in premature system shutdown.
· DBUG_QUERY: Record query statement.
· DBUG_ASSERT: Record the error on a failed test of an expression.
Listing 5-8 shows how some of these tags are used in the mysqld_show_privileges() function. The highlighted code statements are some of the more commonly used DBUG tags.
Listing 5-8. Example DBUG Tags
bool mysqld_show_privileges(THD *thd)
{
List<Item> field_list;
Protocol *protocol= thd->protocol;
DBUG_ENTER("mysqld_show_privileges");
field_list.push_back(new Item_empty_string("Privilege",10));
field_list.push_back(new Item_empty_string("Context",15));
field_list.push_back(new Item_empty_string("Comment",NAME_CHAR_LEN));
if (protocol->send_result_set_metadata(&field_list,
Protocol::SEND_NUM_ROWS | Protocol::SEND_EOF))
DBUG_RETURN(TRUE);
show_privileges_st *privilege= sys_privileges;
for (privilege= sys_privileges; privilege->privilege ; privilege++)
{
protocol->prepare_for_resend();
protocol->store(privilege->privilege, system_charset_info);
protocol->store(privilege->context, system_charset_info);
protocol->store(privilege->comment, system_charset_info);
if (protocol->write())
DBUG_RETURN(TRUE);
}
my_eof(thd);
DBUG_RETURN(FALSE);
}
The list of debug tags is quite comprehensive. The DBUG_ENTER and DBUG_RETURN tags are some of the most useful, because they allow you to record a trace of the execution of the system throughout all of the functions called. It is especially important to point out that all the functions in the MySQL source code include these tags on entry and exit, respectively. Should you add your own functions, do the same, and record the entry and exit(s) of your functions. These tags are written to a trace file stored in /tmp/mysqld.trace on Linux and c:\mysqld.trace on Windows.
The trace file created can become very large. Fortunately, you can control which tags are written to the trace file by supplying them on the command line. For example, to limit the trace file to display the more interesting debug tags, you can use a command like the following. The general format of the switches is a:b:c for turning on switches a, b, and c. Any switches that take parameters are separated by commas.
mysqld-debug --debug=d,info,error,query,general,where:t:L:g:O,
/tmp/mysqd.trace -u root
The previous command runs the MySQL server that is compiled with debug enabled (mysqld-debug). The command line parameter --debug=d,info,error,query,general, where:t:L:g:O,/tmp/mysqd.trace instructs the DBUG system to enable output from the DBUG_INFO, DBUG_ERROR, DBUG_QUERY, and DBUG_WHERE macros, turns on the trace lines for enter/exit of functions, includes the line number of the source code for the debug statement, enables profiling, and writes the file to /tmp/mysqld.trace. The -u root parameter passes the username root to the server for execution. Many more options are available; some common options are shown in Table 5-2.2
Table 5-2. List of Commonly Used DBUG Switches
|
Switch |
Description |
|
d |
Turns on the output for the DBUG tags specified in the parameters. An empty list causes output for all tags. |
|
D |
Performs a delay after each output. The parameter specifies the number of tenths of seconds to delay. For example, D,40 will cause a delay of 4 seconds. |
|
f |
Limits the recording of debugging, tracing, and profiling to the list specified with d. |
|
F |
Outputs the name of the source file for every line of debug or trace recorded. |
|
I |
Outputs the process ID or thread ID for every line of debug or trace recorded. |
|
g |
Turns on profiling. The parameters specify the keywords for those items to be profiled. An empty list implies all keywords are profiled. |
|
L |
Outputs the source code line number for each line recorded. |
|
n |
Sets the nesting depth for each line of output. This can help make the outputmore readable. |
|
N |
Places sequential numbers on each line recorded. |
|
o |
Saves the output to the file specified in the parameter. The default is written to stderr. |
|
O |
Saves the output to the file specified in the parameter. The default is written to stderr. Flushes the file between each write. |
|
P |
Outputs the current process name for each line recorded. |
|
t |
Turns on function call/exit trace lines (represented as a vertical bar). |
Listing 5-9 shows an excerpt of a trace run while executing the show authors; command. You can see the entire trace of the system as it runs the command and returns data (I have omitted many lines as this list was generated with the default debug switches). I’ve highlighted the most interesting lines. Notice also the trace lines that run down the lines of output. This allows you to follow the flow of the execution more easily.
If you write your own functions in MySQL, you can use the DBUG tags to record your own information to the trace file. This file can be helpful in the event that your code causes unpredictable or unexpected behavior.
Listing 5-9. Sample Trace of the Show Privileges Command
T@3 : | | | | >mysqld_show_privileges
T@3 : | | | | | >alloc_root
T@3 : | | | | | | enter: root: 0x2264f88
T@3 : | | | | | | exit: ptr: 0x23d97b0
T@3 : | | | | | <alloc_root 247
T@3 : | | | | | >alloc_root
T@3 : | | | | | | enter: root: 0x2264f88
T@3 : | | | | | | exit: ptr: 0x23d9850
T@3 : | | | | | <alloc_root 247
T@3 : | | | | | >alloc_root
T@3 : | | | | | | enter: root: 0x2264f88
T@3 : | | | | | | exit: ptr: 0x23d9860
T@3 : | | | | | <alloc_root 247
T@3 : | | | | | >alloc_root
T@3 : | | | | | | enter: root: 0x2264f88
T@3 : | | | | | | exit: ptr: 0x23d9900
T@3 : | | | | | <alloc_root 247
T@3 : | | | | | >alloc_root
T@3 : | | | | | | enter: root: 0x2264f88
T@3 : | | | | | | exit: ptr: 0x23d9910
T@3 : | | | | | <alloc_root 247
T@3 : | | | | | >alloc_root
T@3 : | | | | | | enter: root: 0x2264f88
T@3 : | | | | | | exit: ptr: 0x23d99b0
T@3 : | | | | | <alloc_root 247
T@3 : | | | | | >send_result_set_metadata
T@3 : | | | | | | packet_header: Memory: 0x7f61f196f610 Bytes: (4)
01 00 00 01
T@3 : | | | | | | >alloc_root
T@3 : | | | | | | | enter: root: 0x2264f88
T@3 : | | | | | | | exit: ptr: 0x23d99c0
T@3 : | | | | | | <alloc_root 247
T@3 : | | | | | | >Protocol::write
T@3 : | | | | | | <Protocol::write 820
T@3 : | | | | | | packet_header: Memory: 0x7f61f196f5c0 Bytes: (4)
1F 00 00 02
T@3 : | | | | | | >Protocol::write
T@3 : | | | | | | <Protocol::write 820
T@3 : | | | | | | packet_header: Memory: 0x7f61f196f5c0 Bytes: (4)
1D 00 00 03
T@3 : | | | | | | >Protocol::write
T@3 : | | | | | | <Protocol::write 820
T@3 : | | | | | | packet_header: Memory: 0x7f61f196f5c0 Bytes: (4)
1D 00 00 04
T@3 : | | | | | | packet_header: Memory: 0x7f61f196f5b0 Bytes: (4)
05 00 00 05
T@3 : | | | | | <send_result_set_metadata 807
T@3 : | | | | | info: Protocol_text::store field 0 (3): Alter
T@3 : | | | | | info: Protocol_text::store field 1 (3): Tables
T@3 : | | | | | info: Protocol_text::store field 2 (3): To alter the table
T@3 : | | | | | >Protocol::write
T@3 : | | | | | <Protocol::write 820
T@3 : | | | | | packet_header: Memory: 0x7f61f196fa70 Bytes: (4)
20 00 00 06
T@3 : | | | | | info: Protocol_text::store field 0 (3): Alter routine
T@3 : | | | | | info: Protocol_text::store field 1 (3): Functions,Procedures
T@3 : | | | | | info: Protocol_text::store field 2 (3): To alter or drop stored functions/procedures
T@3 : | | | | | >Protocol::write
T@3 : | | | | | <Protocol::write 820
T@3 : | | | | | packet_header: Memory: 0x7f61f196fa70 Bytes: (4)
50 00 00 07
T@3 : | | | | | info: Protocol_text::store field 0 (3): Create
T@3 : | | | | | info: Protocol_text::store field 1 (3): Databases,Tables,Indexes
T@3 : | | | | | info: Protocol_text::store field 2 (3): To create new databases and tables
T@3 : | | | | | >Protocol::write
T@3 : | | | | | <Protocol::write 820
T@3 : | | | | | packet_header: Memory: 0x7f61f196fa70 Bytes: (4)
43 00 00 08
T@3 : | | | | | info: Protocol_text::store field 0 (3): Create routine
T@3 : | | | | | info: Protocol_text::store field 1 (3): Databases
T@3 : | | | | | info: Protocol_text::store field 2 (3): To use CREATE FUNCTION/PROCEDURE
T@3 : | | | | | >Protocol::write
T@3 : | | | | | <Protocol::write 820
T@3 : | | | | | packet_header: Memory: 0x7f61f196fa70 Bytes: (4)
3A 00 00 09
T@3 : | | | | | info: Protocol_text::store field 0 (3): Create temporary tables
T@3 : | | | | | info: Protocol_text::store field 1 (3): Databases
T@3 : | | | | | info: Protocol_text::store field 2 (3): To use CREATE TEMPORARY TABLE
T@3 : | | | | | >Protocol::write
T@3 : | | | | | <Protocol::write 820
T@3 : | | | | | packet_header: Memory: 0x7f61f196fa70 Bytes: (4)
40 00 00 0A
T@3 : | | | | | info: Protocol_text::store field 0 (3): Create view
T@3 : | | | | | info: Protocol_text::store field 1 (3): Tables
T@3 : | | | | | info: Protocol_text::store field 2 (3): To create new views
T@3 : | | | | | >Protocol::write
T@3 : | | | | | <Protocol::write 820
T@3 : | | | | | packet_header: Memory: 0x7f61f196fa70 Bytes: (4)
27 00 00 0B
T@3 : | | | | | info: Protocol_text::store field 0 (3): Create user
T@3 : | | | | | info: Protocol_text::store field 1 (3): Server Admin
T@3 : | | | | | info: Protocol_text::store field 2 (3): To create new users
T@3 : | | | | | >Protocol::write
T@3 : | | | | | <Protocol::write 820
T@3 : | | | | | packet_header: Memory: 0x7f61f196fa70 Bytes: (4)
2D 00 00 0C
T@3 : | | | | | info: Protocol_text::store field 0 (3): Delete
T@3 : | | | | | info: Protocol_text::store field 1 (3): Tables
T@3 : | | | | | info: Protocol_text::store field 2 (3): To delete existing rows
T@3 : | | | | | >Protocol::write
T@3 : | | | | | <Protocol::write 820
T@3 : | | | | | packet_header: Memory: 0x7f61f196fa70 Bytes: (4)
26 00 00 0D
T@3 : | | | | | info: Protocol_text::store field 0 (3): Drop
T@3 : | | | | | info: Protocol_text::store field 1 (3): Databases,Tables
T@3 : | | | | | info: Protocol_text::store field 2 (3): To drop databases, tables, and views
T@3 : | | | | | >Protocol::write
T@3 : | | | | | <Protocol::write 820
T@3 : | | | | | packet_header: Memory: 0x7f61f196fa70 Bytes: (4)
3B 00 00 0E
T@3 : | | | | | info: Protocol_text::store field 0 (3): Event
T@3 : | | | | | info: Protocol_text::store field 1 (3): Server Admin
T@3 : | | | | | info: Protocol_text::store field 2 (3): To create, alter, drop and execute events
T@3 : | | | | | >Protocol::write
T@3 : | | | | | <Protocol::write 820
T@3 : | | | | | packet_header: Memory: 0x7f61f196fa70 Bytes: (4)
3D 00 00 0F
T@3 : | | | | | info: Protocol_text::store field 0 (3): Execute
T@3 : | | | | | info: Protocol_text::store field 1 (3): Functions,Procedures
T@3 : | | | | | info: Protocol_text::store field 2 (3): To execute stored routines
T@3 : | | | | | >Protocol::write
T@3 : | | | | | <Protocol::write 820
T@3 : | | | | | packet_header: Memory: 0x7f61f196fa70 Bytes: (4)
38 00 00 10
T@3 : | | | | | info: Protocol_text::store field 0 (3): File
T@3 : | | | | | info: Protocol_text::store field 1 (3): File access on server
T@3 : | | | | | info: Protocol_text::store field 2 (3): To read and write files on the server
T@3 : | | | | | >Protocol::write
T@3 : | | | | | <Protocol::write 820
T@3 : | | | | | packet_header: Memory: 0x7f61f196fa70 Bytes: (4)
41 00 00 11
T@3 : | | | | | info: Protocol_text::store field 0 (3): Grant option
T@3 : | | | | | info: Protocol_text::store field 1 (3): Databases,Tables,Functions,Procedures
T@3 : | | | | | info: Protocol_text::store field 2 (3): To give to other users those privileges you possess
T@3 : | | | | | >Protocol::write
T@3 : | | | | | <Protocol::write 820
T@3 : | | | | | packet_header: Memory: 0x7f61f196fa70 Bytes: (4)
67 00 00 12
T@3 : | | | | | info: Protocol_text::store field 0 (3): Index
T@3 : | | | | | info: Protocol_text::store field 1 (3): Tables
T@3 : | | | | | info: Protocol_text::store field 2 (3): To create or drop indexes
T@3 : | | | | | >Protocol::write
T@3 : | | | | | <Protocol::write 820
T@3 : | | | | | packet_header: Memory: 0x7f61f196fa70 Bytes: (4)
27 00 00 13
T@3 : | | | | | info: Protocol_text::store field 0 (3): Insert
T@3 : | | | | | info: Protocol_text::store field 1 (3): Tables
T@3 : | | | | | info: Protocol_text::store field 2 (3): To insert data into tables
T@3 : | | | | | >Protocol::write
T@3 : | | | | | <Protocol::write 820
T@3 : | | | | | packet_header: Memory: 0x7f61f196fa70 Bytes: (4)
29 00 00 14
T@3 : | | | | | info: Protocol_text::store field 0 (3): Lock tables
T@3 : | | | | | info: Protocol_text::store field 1 (3): Databases
T@3 : | | | | | info: Protocol_text::store field 2 (3): To use LOCK TABLES (together with SELECT privilege)
T@3 : | | | | | >Protocol::write
T@3 : | | | | | <Protocol::write 820
T@3 : | | | | | packet_header: Memory: 0x7f61f196fa70 Bytes: (4)
4A 00 00 15
T@3 : | | | | | info: Protocol_text::store field 0 (3): Process
T@3 : | | | | | info: Protocol_text::store field 1 (3): Server Admin
T@3 : | | | | | info: Protocol_text::store field 2 (3): To view the plain text of currently executing queries
T@3 : | | | | | >Protocol::write
T@3 : | | | | | <Protocol::write 820
T@3 : | | | | | packet_header: Memory: 0x7f61f196fa70 Bytes: (4)
4B 00 00 16
T@3 : | | | | | info: Protocol_text::store field 0 (3): Proxy
T@3 : | | | | | info: Protocol_text::store field 1 (3): Server Admin
T@3 : | | | | | info: Protocol_text::store field 2 (3): To make proxy user possible
T@3 : | | | | | >Protocol::write
T@3 : | | | | | <Protocol::write 820
T@3 : | | | | | packet_header: Memory: 0x7f61f196fa70 Bytes: (4)
2F 00 00 17
T@3 : | | | | | info: Protocol_text::store field 0 (3): References
T@3 : | | | | | info: Protocol_text::store field 1 (3): Databases,Tables
T@3 : | | | | | info: Protocol_text::store field 2 (3): To have references on tables
T@3 : | | | | | >Protocol::write
T@3 : | | | | | <Protocol::write 820
T@3 : | | | | | packet_header: Memory: 0x7f61f196fa70 Bytes: (4)
39 00 00 18
T@3 : | | | | | info: Protocol_text::store field 0 (3): Reload
T@3 : | | | | | info: Protocol_text::store field 1 (3): Server Admin
T@3 : | | | | | info: Protocol_text::store field 2 (3): To reload or refresh tables, logs and privileges
T@3 : | | | | | >Protocol::write
T@3 : | | | | | <Protocol::write 820
T@3 : | | | | | packet_header: Memory: 0x7f61f196fa70 Bytes: (4)
45 00 00 19
T@3 : | | | | | info: Protocol_text::store field 0 (3): Replication client
T@3 : | | | | | info: Protocol_text::store field 1 (3): Server Admin
T@3 : | | | | | info: Protocol_text::store field 2 (3): To ask where the slave or master servers are
T@3 : | | | | | >Protocol::write
T@3 : | | | | | <Protocol::write 820
T@3 : | | | | | packet_header: Memory: 0x7f61f196fa70 Bytes: (4)
4D 00 00 1A
T@3 : | | | | | info: Protocol_text::store field 0 (3): Replication slave
T@3 : | | | | | info: Protocol_text::store field 1 (3): Server Admin
T@3 : | | | | | info: Protocol_text::store field 2 (3): To read binary log events from the master
T@3 : | | | | | >Protocol::write
T@3 : | | | | | <Protocol::write 820
T@3 : | | | | | packet_header: Memory: 0x7f61f196fa70 Bytes: (4)
49 00 00 1B
T@3 : | | | | | info: Protocol_text::store field 0 (3): Select
T@3 : | | | | | info: Protocol_text::store field 1 (3): Tables
T@3 : | | | | | info: Protocol_text::store field 2 (3): To retrieve rows from table
T@3 : | | | | | >Protocol::write
T@3 : | | | | | <Protocol::write 820
T@3 : | | | | | packet_header: Memory: 0x7f61f196fa70 Bytes: (4)
2A 00 00 1C
T@3 : | | | | | info: Protocol_text::store field 0 (3): Show databases
T@3 : | | | | | info: Protocol_text::store field 1 (3): Server Admin
T@3 : | | | | | info: Protocol_text::store field 2 (3): To see all databases with SHOW DATABASES
T@3 : | | | | | >Protocol::write
T@3 : | | | | | <Protocol::write 820
T@3 : | | | | | packet_header: Memory: 0x7f61f196fa70 Bytes: (4)
45 00 00 1D
T@3 : | | | | | info: Protocol_text::store field 0 (3): Show view
T@3 : | | | | | info: Protocol_text::store field 1 (3): Tables
T@3 : | | | | | info: Protocol_text::store field 2 (3): To see views with SHOW CREATE VIEW
T@3 : | | | | | >Protocol::write
T@3 : | | | | | <Protocol::write 820
T@3 : | | | | | packet_header: Memory: 0x7f61f196fa70 Bytes: (4)
34 00 00 1E
T@3 : | | | | | info: Protocol_text::store field 0 (3): Shutdown
T@3 : | | | | | info: Protocol_text::store field 1 (3): Server Admin
T@3 : | | | | | info: Protocol_text::store field 2 (3): To shut down the server
T@3 : | | | | | >Protocol::write
T@3 : | | | | | <Protocol::write 820
T@3 : | | | | | packet_header: Memory: 0x7f61f196fa70 Bytes: (4)
2E 00 00 1F
T@3 : | | | | | info: Protocol_text::store field 0 (3): Super
T@3 : | | | | | info: Protocol_text::store field 1 (3): Server Admin
T@3 : | | | | | info: Protocol_text::store field 2 (3): To use KILL thread, SET GLOBAL, CHANGE MASTER, etc.
T@3 : | | | | | >Protocol::write
T@3 : | | | | | <Protocol::write 820
T@3 : | | | | | packet_header: Memory: 0x7f61f196fa70 Bytes: (4)
47 00 00 20
T@3 : | | | | | info: Protocol_text::store field 0 (3): Trigger
T@3 : | | | | | info: Protocol_text::store field 1 (3): Tables
T@3 : | | | | | info: Protocol_text::store field 2 (3): To use triggers
T@3 : | | | | | >Protocol::write
T@3 : | | | | | <Protocol::write 820
T@3 : | | | | | packet_header: Memory: 0x7f61f196fa70 Bytes: (4)
1F 00 00 21
T@3 : | | | | | info: Protocol_text::store field 0 (3): Create tablespace
T@3 : | | | | | info: Protocol_text::store field 1 (3): Server Admin
T@3 : | | | | | info: Protocol_text::store field 2 (3): To create/alter/drop tablespaces
T@3 : | | | | | >Protocol::write
T@3 : | | | | | <Protocol::write 820
T@3 : | | | | | packet_header: Memory: 0x7f61f196fa70 Bytes: (4)
40 00 00 22
T@3 : | | | | | info: Protocol_text::store field 0 (3): Update
T@3 : | | | | | info: Protocol_text::store field 1 (3): Tables
T@3 : | | | | | info: Protocol_text::store field 2 (3): To update existing rows
T@3 : | | | | | >Protocol::write
T@3 : | | | | | <Protocol::write 820
T@3 : | | | | | packet_header: Memory: 0x7f61f196fa70 Bytes: (4)
26 00 00 23
T@3 : | | | | | info: Protocol_text::store field 0 (3): Usage
T@3 : | | | | | info: Protocol_text::store field 1 (3): Server Admin
T@3 : | | | | | info: Protocol_text::store field 2 (3): No privileges - allow connect only
T@3 : | | | | | >Protocol::write
T@3 : | | | | | <Protocol::write 820
T@3 : | | | | | packet_header: Memory: 0x7f61f196fa70 Bytes: (4)
36 00 00 24
T@3 : | | | | | >set_eof_status
T@3 : | | | | | <set_eof_status 483
T@3 : | | | | <mysqld_show_privileges 390
Error Handlers
There are no specific tools to demonstrate concerning error handlers in MySQL. You should strive to generate code that handles all possible errors. The best way to show you how to do this is with an example of an error handler from an older, unsupported release of MySQL that does not properly manage errors. Listing 5-10 shows an excerpt from the MySQL source code that has an issue with a particular type of error.
Listing 5-10. Sample of Error Handler in MySQL
int my_delete(const char *name, myf MyFlags)
{
int err;
DBUG_ENTER("my_delete");
DBUG_PRINT("my",("name %s MyFlags %d", name, MyFlags));
if ((err = unlink(name)) == −1)
{
my_errno=errno;
if (MyFlags & (MY_FAE+MY_WME))
my_error(EE_DELETE,MYF(ME_BELL+ME_WAITTANG+(MyFlags & ME_NOINPUT)),
name,errno);
}
DBUG_RETURN(err);
} /* my_delete */
Can you see the defect? I’ll give you a hint. The return value for the unlink() function in Windows has several important values that need to be checked. One of those is missing from the error handler shown in Listing 5-10. The defect resulted in the optimize() function improperly copying an intermediate file during its operation. Fortunately, this defect was fixed some time ago. Listing 5-11 shows the corrected form of this function.
Listing 5-11. Sample of Error Handler in MySQL
int my_delete(const char *name, myf MyFlags)
{
int err;
DBUG_ENTER("my_delete");
DBUG_PRINT("my",("name %s MyFlags %d", name, MyFlags));
if ((err = unlink(name)) == −1)
{
my_errno=errno;
if (MyFlags & (MY_FAE+MY_WME))
{
char errbuf[MYSYS_STRERROR_SIZE];
my_error(EE_DELETE, MYF(ME_BELL+ME_WAITTANG+(MyFlags & ME_NOINPUT)),
name, errno, my_strerror(errbuf, sizeof(errbuf), errno));
}
}
else if ((MyFlags & MY_SYNC_DIR) &&
my_sync_dir_by_file(name, MyFlags))
err= −1;
DBUG_RETURN(err);
} /* my_delete */
Oracle has provided a well-designed error-message mechanism that can make your error handlers more robust. To add your own error messages, add them to the sql/share/errmsg-utf8.txt file. See the internal documentation on dev.mysql.com for more details on adding your own error messages.
I cannot stress enough the importance of forming error handlers that handle all possible errors and take the appropriate actions to rectify and report the errors. Adding the DBUG macros to trace and record the error messages will ensure that all of your debugging sessions are more efficient.
Debugging in Linux
Linux excels in the quality of its advanced development tools (primarily the GNU tools). These tools include excellent debuggers capable of handling not only single-threaded but also multithreaded systems.
Many debuggers are available for Linux. The most popular are gdb and ddd. The following sections present an example of each tool debugging the MySQL system. The scenario for these examples is to inspect what happens when the SHOW AUTHORS command is issued. I’ll begin with the gdb debugger, and then show you the same scenario using ddd.
Using gdb
Let’s begin by re-examining the show_authors() function. Refer back to Listing 5-1 for the complete code for the function. The first thing I need to do is make sure I have built my server with the debugger turned on. Do this by issuing these commands from the root of the source folder:
cmake . -DWITH_DEBUG=ON
make
These commands will cause the system to be compiled with the appropriate debugging information so that I can use the debugger. I can now launch the server in debug mode using the command mysqld-debug. Listing 5-12 shows the startup statements presented when the server starts.
![]() Caution Ensure all installations of the MySQL server have been shut down prior to launching the server in debug mode. While not strictly necessary, this should allow you to avoid attempting to debug the wrong process.
Caution Ensure all installations of the MySQL server have been shut down prior to launching the server in debug mode. While not strictly necessary, this should allow you to avoid attempting to debug the wrong process.
Listing 5-12. Starting MySQL Server in Debug Mode
cbell@ubuntu:∼/source/mysql-5.6/mysql-test$ ./mysql-test-run.pl --start-and-exit --debug
Logging: ./mysql-test-run.pl --start-and-exit --debug
120707 18:10:11 [Note] Plugin 'FEDERATED' is disabled.
120707 18:10:11 [Note] Binlog end
120707 18:10:11 [Note] Shutting down plugin 'CSV'
120707 18:10:11 [Note] Shutting down plugin 'MyISAM'
MySQL Version 5.6.6
Checking supported features...
- skipping ndbcluster
- SSL connections supported
- binaries are debug compiled
Using suites: main,sys_vars,binlog,federated,rpl,innodb,innodb_fts,perfschema,funcs_1,opt_trace
Collecting tests...
Checking leftover processes...
- found old pid 7375 in 'mysqld.1.pid', killing it...
process did not exist!
Removing old var directory...
Creating var directory '/home/cbell/source/mysql-5.6/mysql-test/var'...
Installing system database...
Using server port 49434
==============================================================================
TEST RESULT TIME (ms) or COMMENT
------------------------------------------------------------------------------
worker[1] Using MTR_BUILD_THREAD 300, with reserved ports 13000..13009
worker[1]
Started [mysqld.1 - pid: 7506, winpid: 7506]
worker[1] Using config for test main.1st
worker[1] Port and socket path for server(s):
worker[1] mysqld.1 13000 /home/cbell/source/mysql-5.6/mysql-test/var/tmp/mysqld.1.sock
worker[1] Server(s) started, not waiting for them to finish
Notice that in this case, I am using the socket specified as /var/lib/mysql/mysql.sock. This allows me to run a copy of the server in debug mode without affecting a running server. I need to tell the client to use the same socket, however. First, though, I need to determine the process ID for my server. I can do this by issuing the ps -A command to list all of the running processes. Alternatively, I could issue the command ps -A| grep mysql and get the process IDs of all of the processes that include mysql in the name. The following demonstrates this command:
7506 pts/2 00:00:00 mysqld
Now that I have my process ID, I can launch gdb and attach to the correct process using the attach 10592 command. I also want to set a breakpoint in the show_authors() function. An examination of the source file shows that the first line that I’m interested in is line 260. I issue the command break /home/cbell/source/bzr/mysql-5.6/sql/sql_show.cc:260. The format of this command is file:line#. Now that I have a breakpoint, I issue the command continue to tell the process to execute, and gdb will halt the program when the breakpoint is encountered.Listing 5-13 shows the complete debugging session.
Listing 5-13. Running gdb
cbell@ubuntu:∼/source/bzr/mysql-5.6/mysql-test$ gdb
GNU gdb (Ubuntu/Linaro 7.2-1ubuntu11) 7.2
Copyright (C) 2010 Free Software Foundation, Inc.
License GPLv3+: GNU GPL version 3 or later < http://gnu.org/licenses/gpl.html >
This is free software: you are free to change and redistribute it.
There is NO WARRANTY, to the extent permitted by law. Type "show copying"
and "show warranty" for details.
This GDB was configured as "x86_64-linux-gnu".
For bug reporting instructions, please see:
< http://www.gnu.org/software/gdb/bugs/ >.
(gdb) attach 7506
Attaching to process 7506
Reading symbols from /home/cbell/source/bzr/mysql-5.6/sql/mysqld...done.
Reading symbols from /lib/x86_64-linux-gnu/libpthread.so.0...(no debugging symbols found)...done.
[Thread debugging using libthread_db enabled]
[New Thread 0x7f7ba8e57700 (LWP 7524)]
[New Thread 0x7f7ba4a26700 (LWP 7523)]
[New Thread 0x7f7ba5227700 (LWP 7522)]
[New Thread 0x7f7ba5a28700 (LWP 7521)]
[New Thread 0x7f7ba6229700 (LWP 7520)]
[New Thread 0x7f7ba6a2a700 (LWP 7519)]
[New Thread 0x7f7ba722b700 (LWP 7518)]
[New Thread 0x7f7ba7a2c700 (LWP 7517)]
[New Thread 0x7f7ba822d700 (LWP 7516)]
[New Thread 0x7f7ba8a2e700 (LWP 7515)]
[New Thread 0x7f7ba9658700 (LWP 7513)]
[New Thread 0x7f7ba9e59700 (LWP 7512)]
[New Thread 0x7f7baa65a700 (LWP 7511)]
[New Thread 0x7f7baae5b700 (LWP 7510)]
[New Thread 0x7f7bab65c700 (LWP 7509)]
[New Thread 0x7f7bb085f700 (LWP 7508)]
Loaded symbols for /lib/x86_64-linux-gnu/libpthread.so.0
Reading symbols from /lib/x86_64-linux-gnu/librt.so.1...(no debugging symbols found)...done.
Loaded symbols for /lib/x86_64-linux-gnu/librt.so.1
Reading symbols from /lib/x86_64-linux-gnu/libcrypt.so.1...(no debugging symbols found)...done.
Loaded symbols for /lib/x86_64-linux-gnu/libcrypt.so.1
Reading symbols from /lib/x86_64-linux-gnu/libdl.so.2...(no debugging symbols found)...done.
Loaded symbols for /lib/x86_64-linux-gnu/libdl.so.2
Reading symbols from /usr/lib/x86_64-linux-gnu/libstdc++.so.6...(no debugging symbols found)...done.
Loaded symbols for /usr/lib/x86_64-linux-gnu/libstdc++.so.6
Reading symbols from /lib/x86_64-linux-gnu/libm.so.6...(no debugging symbols found)...done.
Loaded symbols for /lib/x86_64-linux-gnu/libm.so.6
Reading symbols from /lib/x86_64-linux-gnu/libgcc_s.so.1...(no debugging symbols found)...done.
Loaded symbols for /lib/x86_64-linux-gnu/libgcc_s.so.1
Reading symbols from /lib/x86_64-linux-gnu/libc.so.6...(no debugging symbols found)...done.
Loaded symbols for /lib/x86_64-linux-gnu/libc.so.6
Reading symbols from /lib64/ld-linux-x86-64.so.2...(no debugging symbols found)...done.
Loaded symbols for /lib64/ld-linux-x86-64.so.2
0x00007f7bb0939ae3 in poll () from /lib/x86_64-linux-gnu/libc.so.6
(gdb) break /home/cbell/source/bzr/mysql-5.6/sql/sql_show.cc:260
Breakpoint 1 at 0x7cee94: file /home/cbell/source/bzr/mysql-5.6/sql/sql_show.cc, line 260.
(gdb) continue
Continuing.
Note: Here, you can run the mysql client and issue the SHOW AUTHORS command.
[New Thread 0x7f7ba8e16700 (LWP 7536)]
[Switching to Thread 0x7f7ba8e16700 (LWP 7536)]
Breakpoint 1, mysqld_show_authors (thd=0x3a62ca0) at /home/cbell/source/bzr/mysql-5.6/sql/sql_show.cc:260
260 field_list.push_back(new Item_empty_string("Name",40));
(gdb) next
261 field_list.push_back(new Item_empty_string("Location",40));
(gdb) next
262 field_list.push_back(new Item_empty_string("Comment",80));
(gdb) next
265 Protocol::SEND_NUM_ROWS | Protocol::SEND_EOF))
(gdb) next
264 if (protocol->send_result_set_metadata(&field_list,
(gdb) next
269 for (authors= show_table_authors; authors->name; authors++)
(gdb) next
271 protocol->prepare_for_resend();
(gdb) print authors->name
$1 = 0xec70c2 "Brian (Krow) Aker"
(gdb) quit
A debugging session is active.
Inferior 1 [process 7506] will be detached.
Quit anyway? (y or n) y
Detaching from program: /home/cbell/source/bzr/mysql-5.6/sql/mysqld, process 7506
Listing 5-14 shows the initialization of the client specifying the desired socket on the command line. I then launch the SHOW AUTHORS command.
Listing 5-14. Starting MySQL Client to Attach to Server
cbell@ubuntu:∼$ mysql -uroot -h 127.0.0.1 --port=13000
Welcome to the MySQL monitor. Commands end with ; or \g.
Your MySQL connection id is 1
Server version: 5.6.6-m9-debug-CAB MODIFICATION Source distribution
Copyright (c) 2000, 2011, Oracle and/or its affiliates. All rights reserved.
Oracle is a registered trademark of Oracle Corporation and/or its
affiliates. Other names may be trademarks of their respective
owners.
Type 'help;' or '\h' for help. Type '\c' to clear the current input statement.
mysql> show authors;
The first thing I notice when I enter the command is that the client stops. The reason is that the gdb debugger has encountered the breakpoint and has halted execution. When I switch back to the debugger, I can issue commands to step through the execution using the next command. I can also display the values of variables using the print command. (Listing 5-13 shows these commands in action.) Once I’ve finished my debugging session, I can shut down the server and exit the debugger.
The gdb debugger is a powerful tool, but it lacks the sophistication of debuggers found in most integrated development environments (IDEs). The ddd debugger makes up for this limitation by providing a robust graphical environment.
Using ddd
The GNU ddd debugger is an excellent example of an integrated debugger. Though not exclusively built around an IDE, the ddd debugger provides a similar experience. You can launch the program you wish to debug and view the source code. Using the integrated tools, you can set breakpoints, stop and start the program being debugged, set watches on variables, view the stack trace, and even edit variable values.
Several windows are associated with the debugger. The data window displays all of the data items you have set watches on. The source window (the main display area) displays the current source code for the program being debugged. The debugger console displays the host debugger (gdb) output. This window is handy for developers who use gdb, because it permits you to enter your own gdb commands. Thus, you can use either the menu system to control the program or the debugger console to issue commands to the debugger directly.
The ddd debugger is actually a wrapper around the GNU gdb stand-alone debugger. In typical open-source fashion, the developers of ddd reused what was already built (gdb) and instead of re-inventing the wheel (the symbolic debugger code), they augmented it with a new set of functionality. Furthermore, ddd can support several stand-alone debuggers, making it very versatile. Indeed, it can support any language its host debugger can support. In many ways, ddd exemplifies what an integrated debugger should be. It has all the tools you need to debug just about any program written in a host of languages.
One of the features I find most appealing about the ddd debugger is the ability to save a debugging session and recall it later. This gives you the advantage of not having to re-create a scenario to demonstrate or repeat a defect. I recommend that, to use it most effectively, you debug your program up to the point of defect discovery (say in the start of the function in question), set all of your watches and breakpoints, and then save the session. This will allow you to restart the debugging session again later should you need to retrace your steps. While not as efficient as a bidirectional debugger, saving a debugging session saves you a lot of time.
You can use the ddd debugger to examine core dumps. This allows you to examine the data in the core dump to determine the state of the program and the last few operations prior to the crash. That’s really handy if the defect that caused the crash also causes the debugger to crash.3 There is also support for remote debugging and examining memory directly. This allows you to debug a system running on another computer (typically a server) and to manipulate the debugger on your development workstation. For more information about the ddd debugger, see the excellent documentation available at www.gnu.org/software/ddd/ddd.html#Doc .
Debugging MySQL using ddd can be accomplished using these steps:
1. Stop any running MySQL servers. Use the command mysqladmin -uroot -p shutdown and enter your root password.
2. Change to the directory that contains your source code. If you are debugging the server (mysqld), you want to change to the sql directory.
3. Launch the ddd debugger using the command ddd mysqld-debug.
4. Open the source code file you want to debug. In the following example, I use sql_show.cc.
5. Set any breakpoints you want the code to stop at. In the following example, I set a breakpoint at line 207 in the show_authors() function.
6. Use the Program ![]() Run menu to run the server, specifying the server is to run as the root user by supplying the parameters u root in the dialog box.
Run menu to run the server, specifying the server is to run as the root user by supplying the parameters u root in the dialog box.
7. Launch your MySQL client. In the following example, I use the normal MySQL command-line client.
8. Issue your commands in the client. The debugger will temporarily halt execution and stop on any breakpoints defined. From here, you can begin your debugging.
9. When you have finished debugging, exit the client and shut down the server using the command mysqladmin -uroot -p shutdown and enter your root password.
![]() Tip You might need to extend the timeout duration for your test MySQL client. Debugging can take some time if you are stepping through a series of breakpoints or you are examining a lot of variables. The system is essentially in a zombie state while you are debugging. This may cause the server and the client to cease communication. Some clients are designed to terminate if they cannot communicate with the server after a period of time. If you are using the MySQL command-line client, you will need to extend the timeout. You can do this by specifying the value on the command line using --connection-timeout=600. This gives you about 10 minutes to work with the debugger before the client drops the connection.
Tip You might need to extend the timeout duration for your test MySQL client. Debugging can take some time if you are stepping through a series of breakpoints or you are examining a lot of variables. The system is essentially in a zombie state while you are debugging. This may cause the server and the client to cease communication. Some clients are designed to terminate if they cannot communicate with the server after a period of time. If you are using the MySQL command-line client, you will need to extend the timeout. You can do this by specifying the value on the command line using --connection-timeout=600. This gives you about 10 minutes to work with the debugger before the client drops the connection.
Listing 5-15 shows how you can use the ddd debugger to debug the MySQL server. I chose the same function from earlier, the show_authors() function in the sql_show.cc source file. In this scenario, I was interested in seeing how the server handled sending information to the client. You may recall from Chapter 3 that I mentioned having an example that showed the process of returning data to the client.
Listing 5-15. The show_authors Function with Highlights
/***************************************************************************
** List all Authors.
** If you can update it, you get to be in it :)
***************************************************************************/
bool mysqld_show_authors(THD *thd)
{
List<Item> field_list;
Protocol *protocol= thd->protocol;
DBUG_ENTER("mysqld_show_authors");
field_list.push_back(new Item_empty_string("Name",40));
field_list.push_back(new Item_empty_string("Location",40));
field_list.push_back(new Item_empty_string("Comment",40));
if (protocol->send_result_set_metadata(&field_list,
Protocol::SEND_NUM_ROWS | Protocol::SEND_EOF))
DBUG_RETURN(TRUE);
show_table_authors_st *authors;
for (authors= show_table_authors; authors->name; authors++)
{
protocol->prepare_for_resend();
protocol->store(authors->name, system_charset_info);
protocol->store(authors->location, system_charset_info);
protocol->store(authors->comment, system_charset_info);
if (protocol->write())
DBUG_RETURN(TRUE);
}
my_eof(thd);
DBUG_RETURN(FALSE);
}
The statements in bold are the methods used to send data back to the client. The show_authors() function is perfect for demonstrating the process, because it is the simplest of implementations (no complex operations—just sending data). The first highlighted statement shows the declaration of a pointer to the existing threads protocol class. The protocol class encapsulates all of the lower-level communication methods (such as networking and socket control). The next set of statements builds a field list. You always send a field list to the client first. Once the field list is built, you can send it to the client with the protocol->send_fields() method. In the loop, the code is looping through a list of authors defined in a linked list of show_table_authors_st. Inside the loop are the three principal methods used to send the data to the client. The first is protocol->prepare_for_resend(), which clears the appropriate buffers and variables for sending data. The next is protocol->store(), which places information in the send buffer. You should send each field as a separate call to this method. The protocol->write()method issues the appropriate action to send the data to the client. Finally, the send_eof() method instructs the communication mechanism to send the end-of-file marker to mark the end of the data. At this point, the client displays the data.
Let’s see how this function works using the ddd debugger. I have built my server using the debug switches by issuing the commands:
cmake . -DWITH_DEBUG=ON
make
These commands will cause the system to be compiled with the debugging information so that I can use the debugger. Once I confirm that no other servers are running, I launch the ddd debugger, load my source file (sql_show.cc), set a breakpoint in the show_authors() function at line 207, and then run the program. At that point, I launch my MySQL client program, setting the connection timeout to 10 minutes, and issue the SHOW AUTHORS command. Refer back to Listing 5-13 to see the server startup sequence; Listing 5-16 shows the client startup sequence.
Listing 5-16. Starting the MySQL Client for Use with the ddd Debugger
cbell@ubuntu:∼$ mysql -uroot -h 127.0.0.1 --port=13000
Welcome to the MySQL monitor. Commands end with ; or \g.
Your MySQL connection id is 1
Server version: 5.6.6-m9-debug-CAB MODIFICATION Source distribution
Copyright (c) 2000, 2011, Oracle and/or its affiliates. All rights reserved.
Oracle is a registered trademark of Oracle Corporation and/or its
affiliates. Other names may be trademarks of their respective
owners.
Type 'help;' or '\h' for help. Type '\c' to clear the current input statement.
mysql> show authors;
When execution reaches the breakpoint in the debugger, the server will stop, and the ddd debugger will display the code with an arrow pointing to the breakpoint. You’ll also notice that the client has stopped. If you take too long debugging, the client may time out. This is why I used the connection-timeout override.
Once the debugger has halted execution, you can begin to explore the code and examine the values of any variable, the stack, or memory. I have set the debugger to examine the authors structure to see the data as it is being written to the client. Figure 5-5 depicts the ddd debugger with the authors structure displayed in the data window.
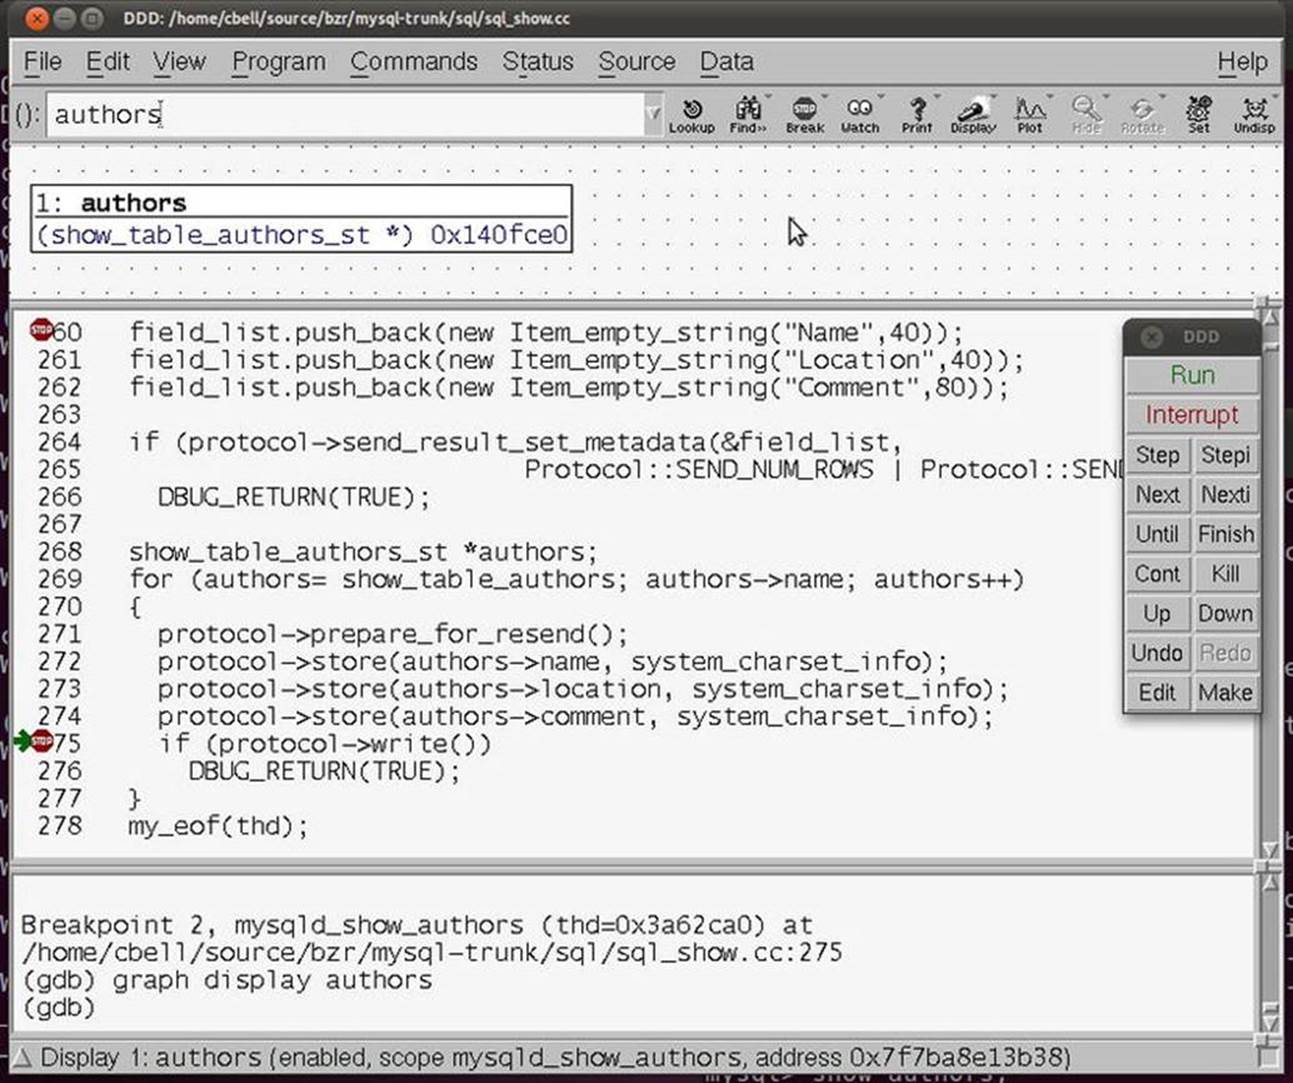
Figure 5-5. ddd debugging the show_authors() function
I can also expand the authors structure and see the current contents. Figure 5-6 shows the contents of the authors structure displayed in the data window.
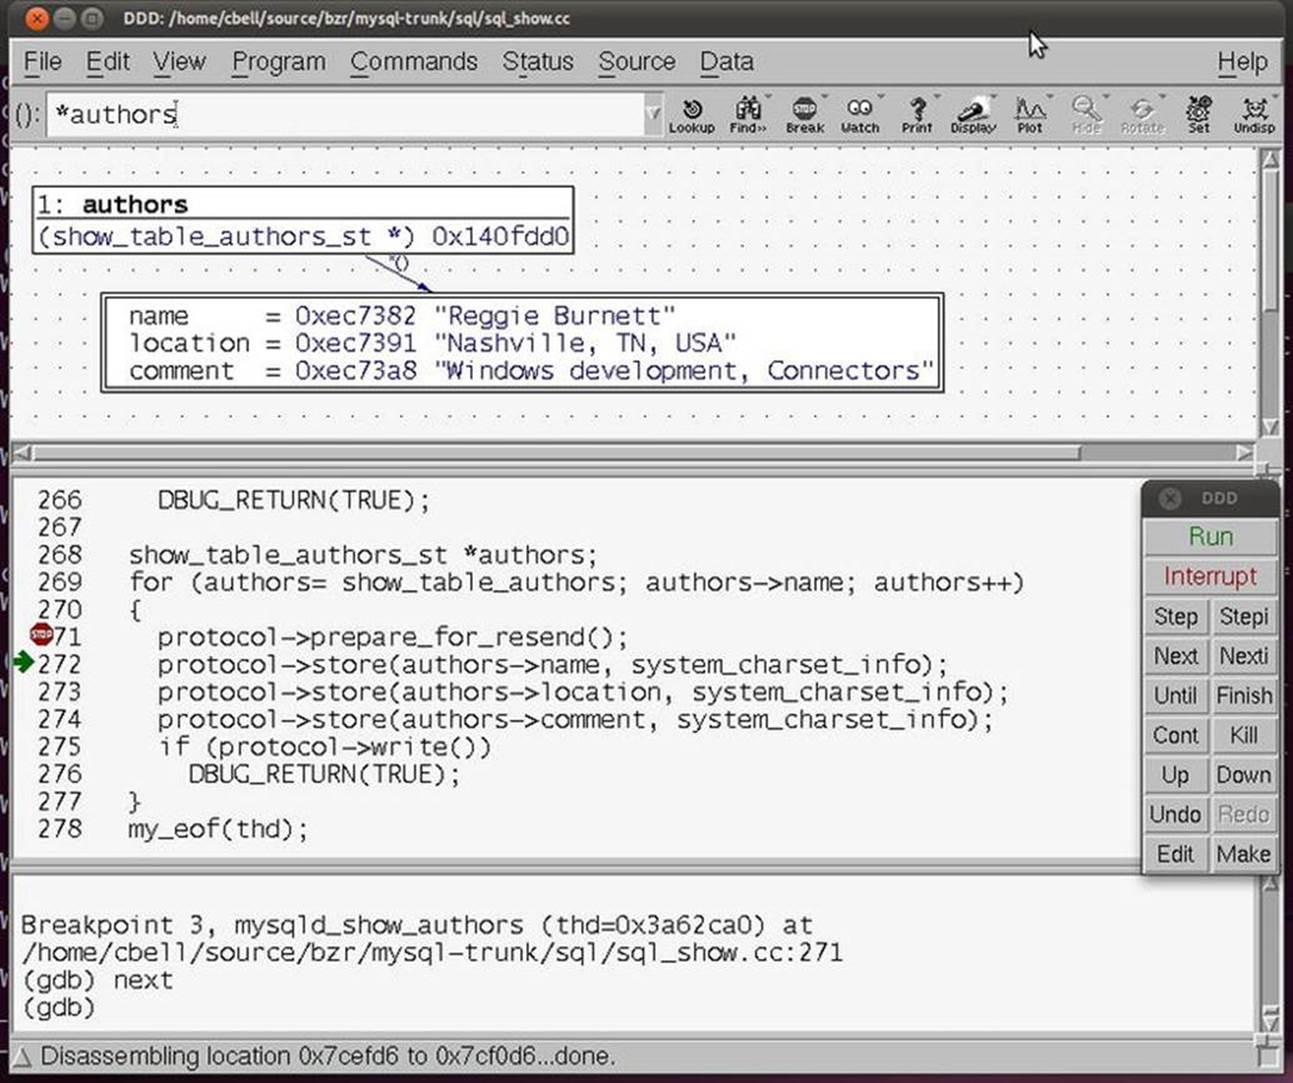
Figure 5-6. The authors structure data in the ddd debugger
Notice that the values and the addresses are displayed in the data window. The ddd debugger also allows you to modify the contents of memory. Let’s say I am debugging this method, and I want to change the values in the authors structure. I could do that simply by right-clicking on each of the items in the authors structure, choosing Set Value from the right-click menu, and then changing the value. Figure 5-7 shows that I’ve changed the contents of the authors structure.
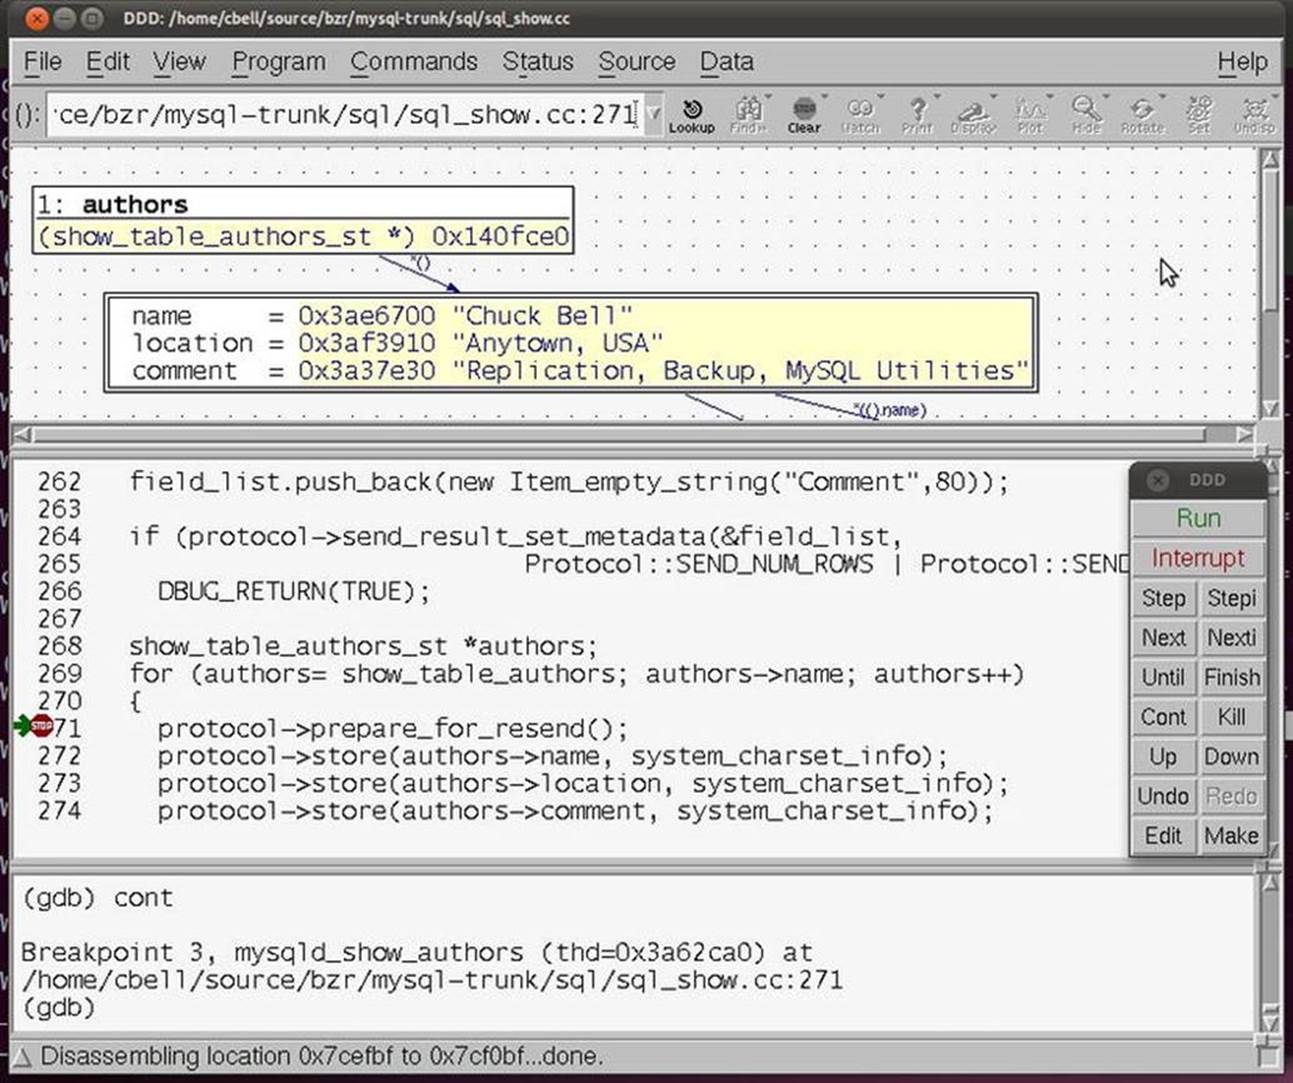
Figure 5-7. The authors structure data changed
You might be wondering if this actually works. Well, it does! Listing 5-17 shows the output from the client (I omitted many lines for clarity). Notice that the data I changed were indeed sent to the client.
Listing 5-17. Resulting Output from Data Modifications
mysql> show authors;
+−−-------------+−−------------+−−-------------------------------------+
| Name | Location | Comment |
+−−-------------+−−------------+−−-------------------------------------+
| Chuck Bell | Anytown, USA | Replication, Backup, MySQL Utilities |
...
+−−-------------+−−------------+−−-------------------------------------+
80 rows in set (48.35 sec)
mysql>
Once I’ve finished my debugging session, I issue the command to shut down the server and then exit ddd:
mysqladmin -uroot -p shutdown
As you can see from this simple example, debugging with ddd can be a useful experience, and it allows you to see the code as it executes. The power of being able to see the data as they are associated with the current execution is an effective means of discovering and correcting defects. I encourage you to try the example and play around with ddd until you are comfortable using it.
Debugging in Windows
The main method of debugging in Windows is using Microsoft Visual Studio .NET. Some developers have had success using other tools, such as external debuggers, but most will use the debugger that is integrated with Visual Studio .NET. Using an integrated debugger is convenient, because you can compile and debug from the same interface.
I will use the same scenario as the ddd example earlier. While the steps are similar, you’ll see some differences. Specifically, I begin my debugging session by launching Visual Studio and opening the mysql.sln solution file in the root of the source-code directory. I make sure my session is set to compile the program in debug for the win32 platform. This will ensure that the proper debug information is compiled into the executable. Once Visual Studio is launched and the correct compilation mode is set, I can set my breakpoint (again, on line 207 in theshow_authors() function). Figure 5-8 shows Visual Studio properly configured with the breakpoint set.
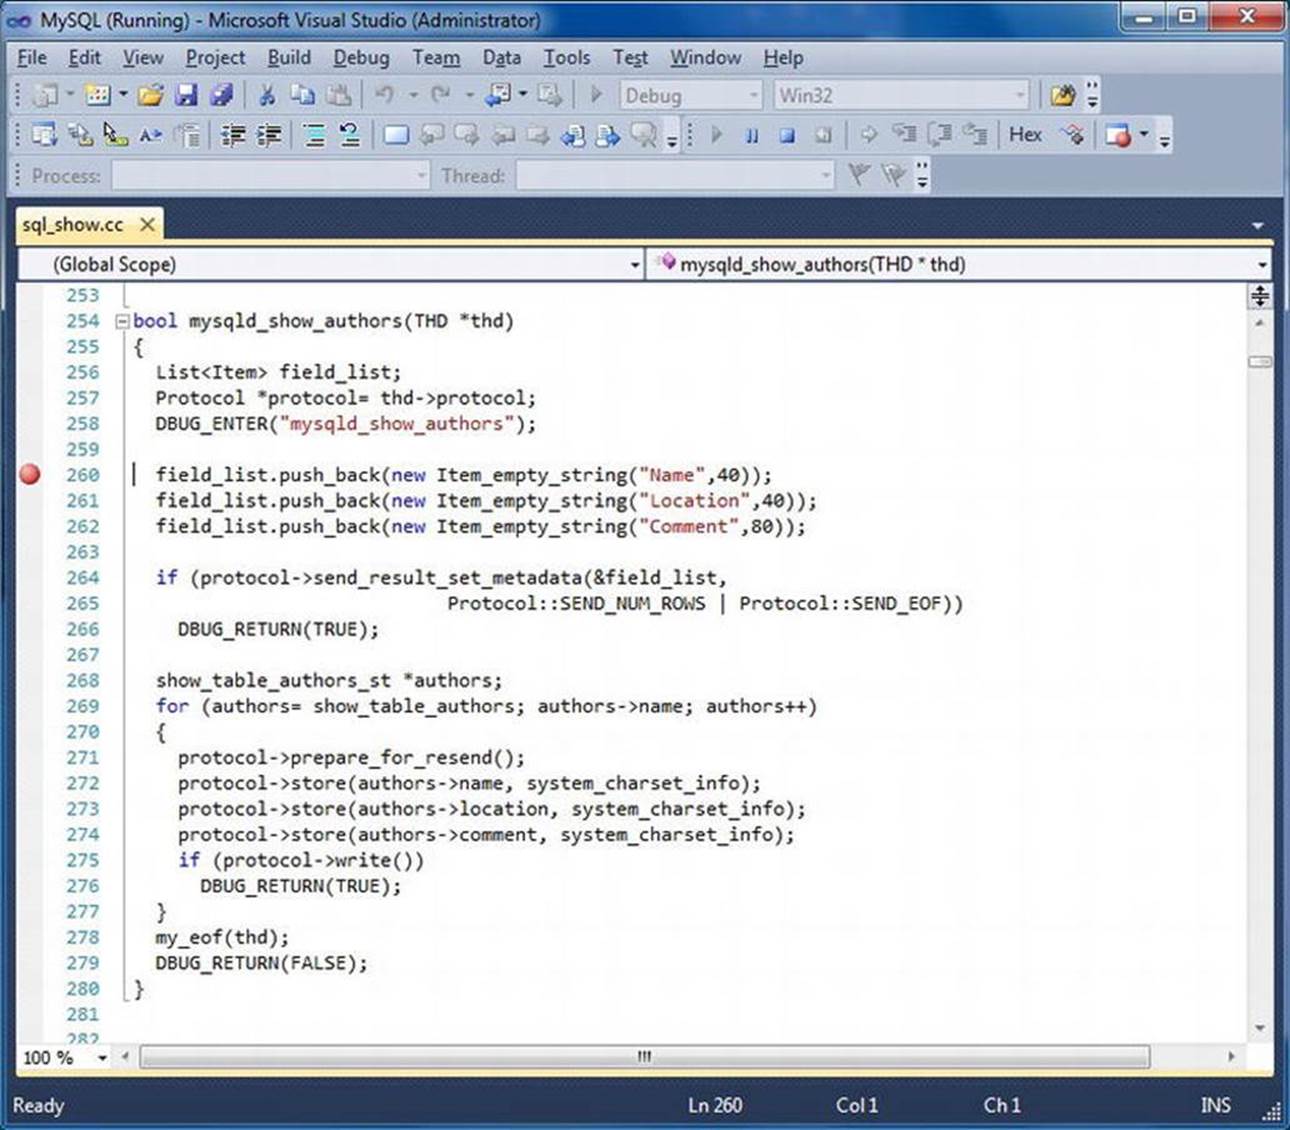
Figure 5-8. Visual Studio debugger setup
To debug the server, I have to launch the server in debug mode. On Windows, use the switch to run the server stand-alone so that it doesn’t run as a service. While this isn’t strictly necessary, it allows you to see any messages from the server in the command window that would otherwise be suppressed. You can issue the following command to accomplish this:
mysqld-debug --debug –standalone
![]() Note I renamed the mysqld.exe server to mysqld-debug.exe to make it easier to find in the Windows task manager.
Note I renamed the mysqld.exe server to mysqld-debug.exe to make it easier to find in the Windows task manager.
Once the server is running, I can attach to the process from Visual Studio using the Debug ![]() Attach to Process menu selection. Figure 5-9 shows the Attach to Process dialog box. I choose to run and attach to the mysqld-debug process so that I can also generate a trace file during the debugging session.
Attach to Process menu selection. Figure 5-9 shows the Attach to Process dialog box. I choose to run and attach to the mysqld-debug process so that I can also generate a trace file during the debugging session.
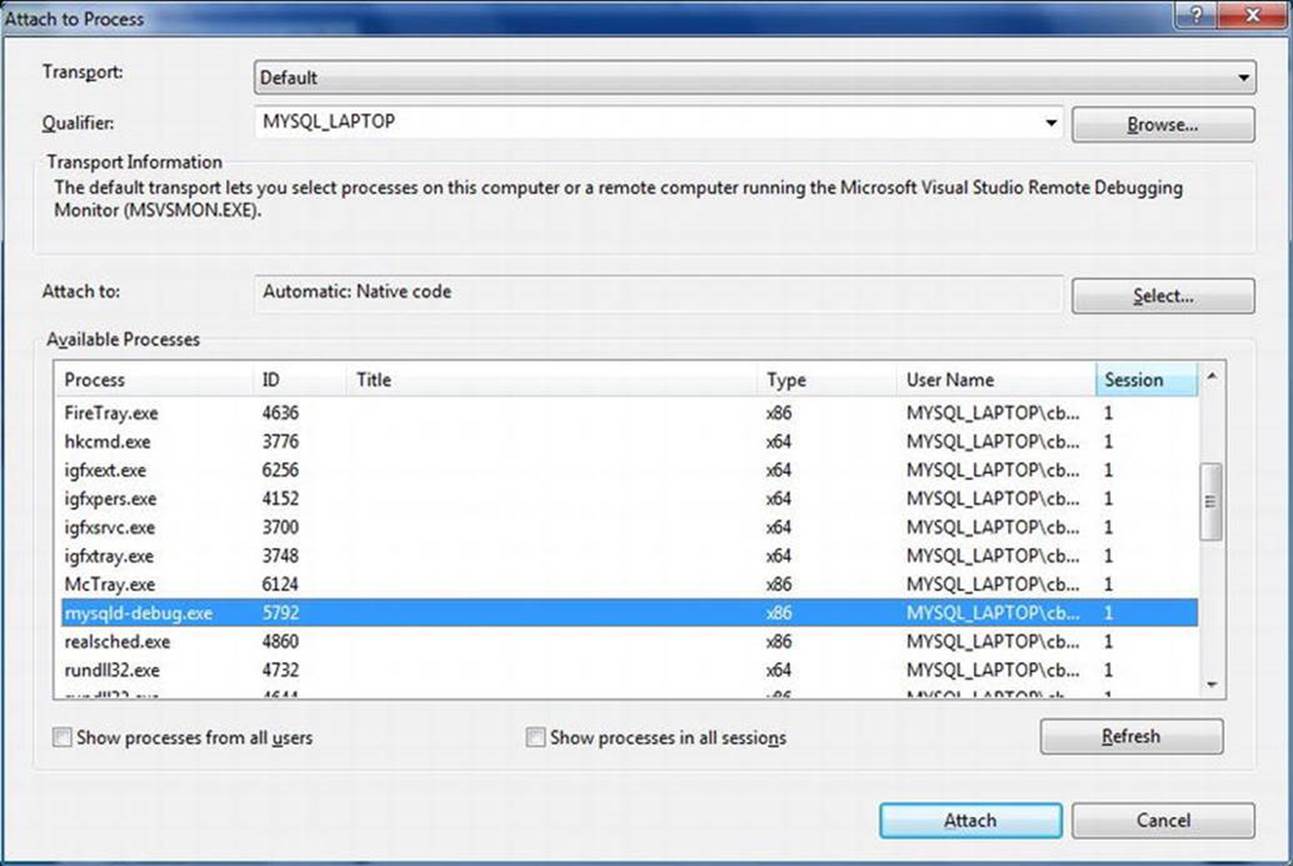
Figure 5-9. Attaching to a process in Visual Studio .NET
The next thing I need to do is launch the client. I once again use the connect-timeout parameter to set the timeout to a longer delay. The command I use to launch the client from a command window is:
mysql -uroot -p --connect-timeout=600
With the client running, I can issue the show authors; command, which Visual Studio will intercept when the breakpoint is encountered. I can then use the step over (F10) and step into (F11) commands to step through the code. I stop the code inside the loop, which sends data, and inspect the authors structure. Figure 5-10 shows the state of the debugger after I have stepped into the loop.
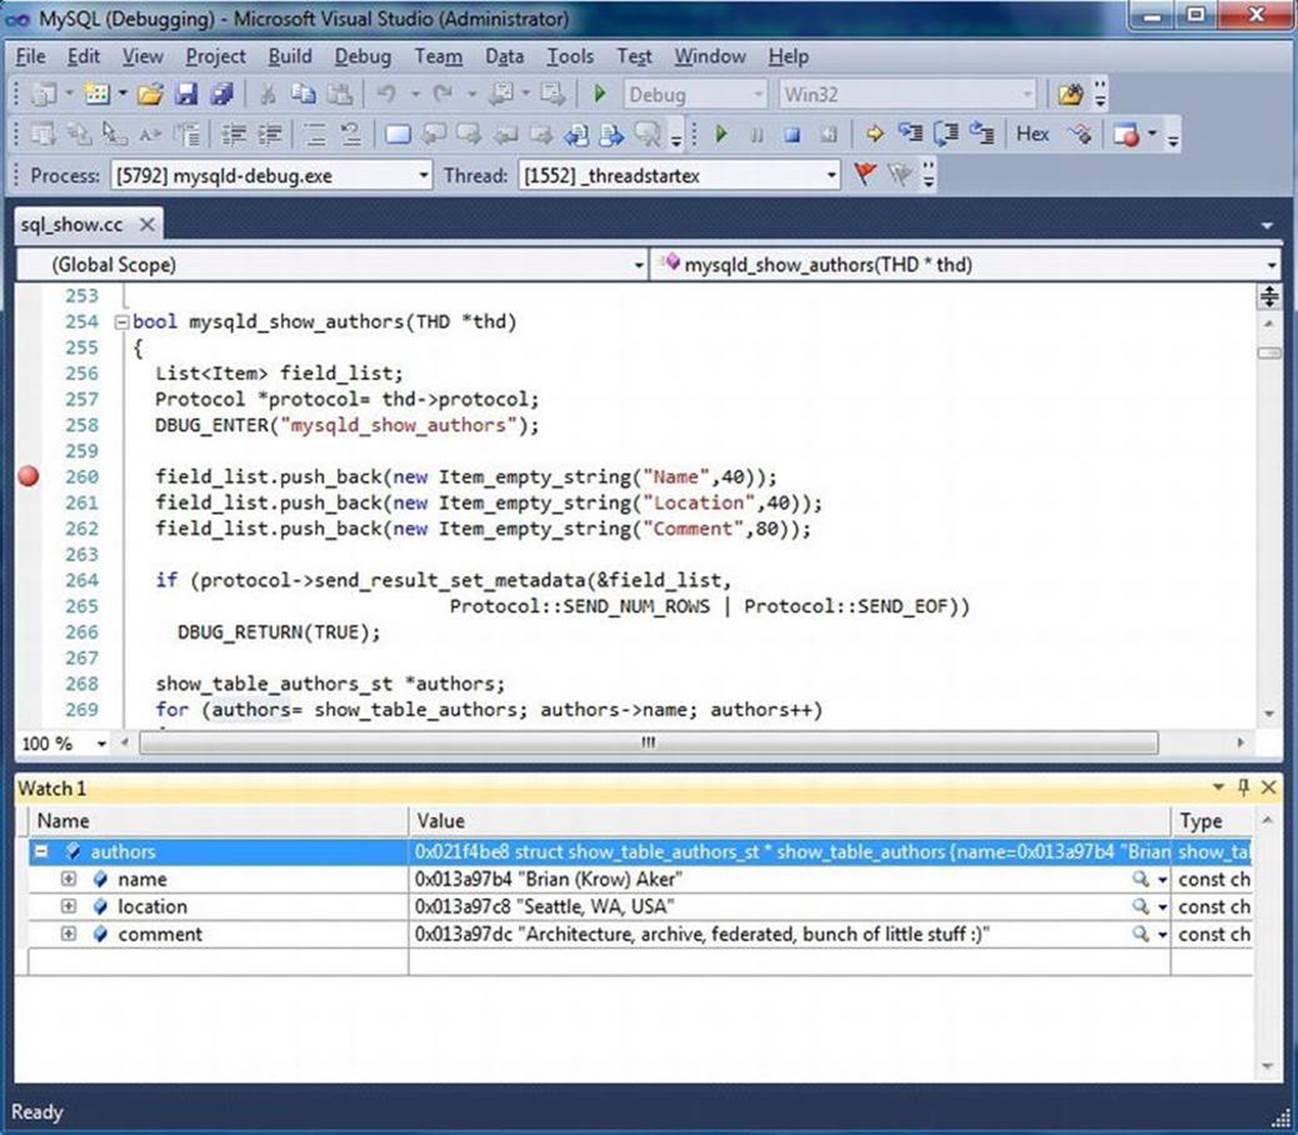
Figure 5-10. Displaying variable values in Visual Studio .NET
As with ddd, you can also change values of variables. Doing so in Visual Studio is a bit more complicated, however. While there may be other options, the best way to change values in Visual Studio is to edit the values in the watch window. If the values in the watch window are pointers to memory locations, however, you have to change the memory location. Do this by opening the memory debug window and use the watch window to locate the memory location and edit it in place. Figure 5-11 shows the memory window open and the values edited.
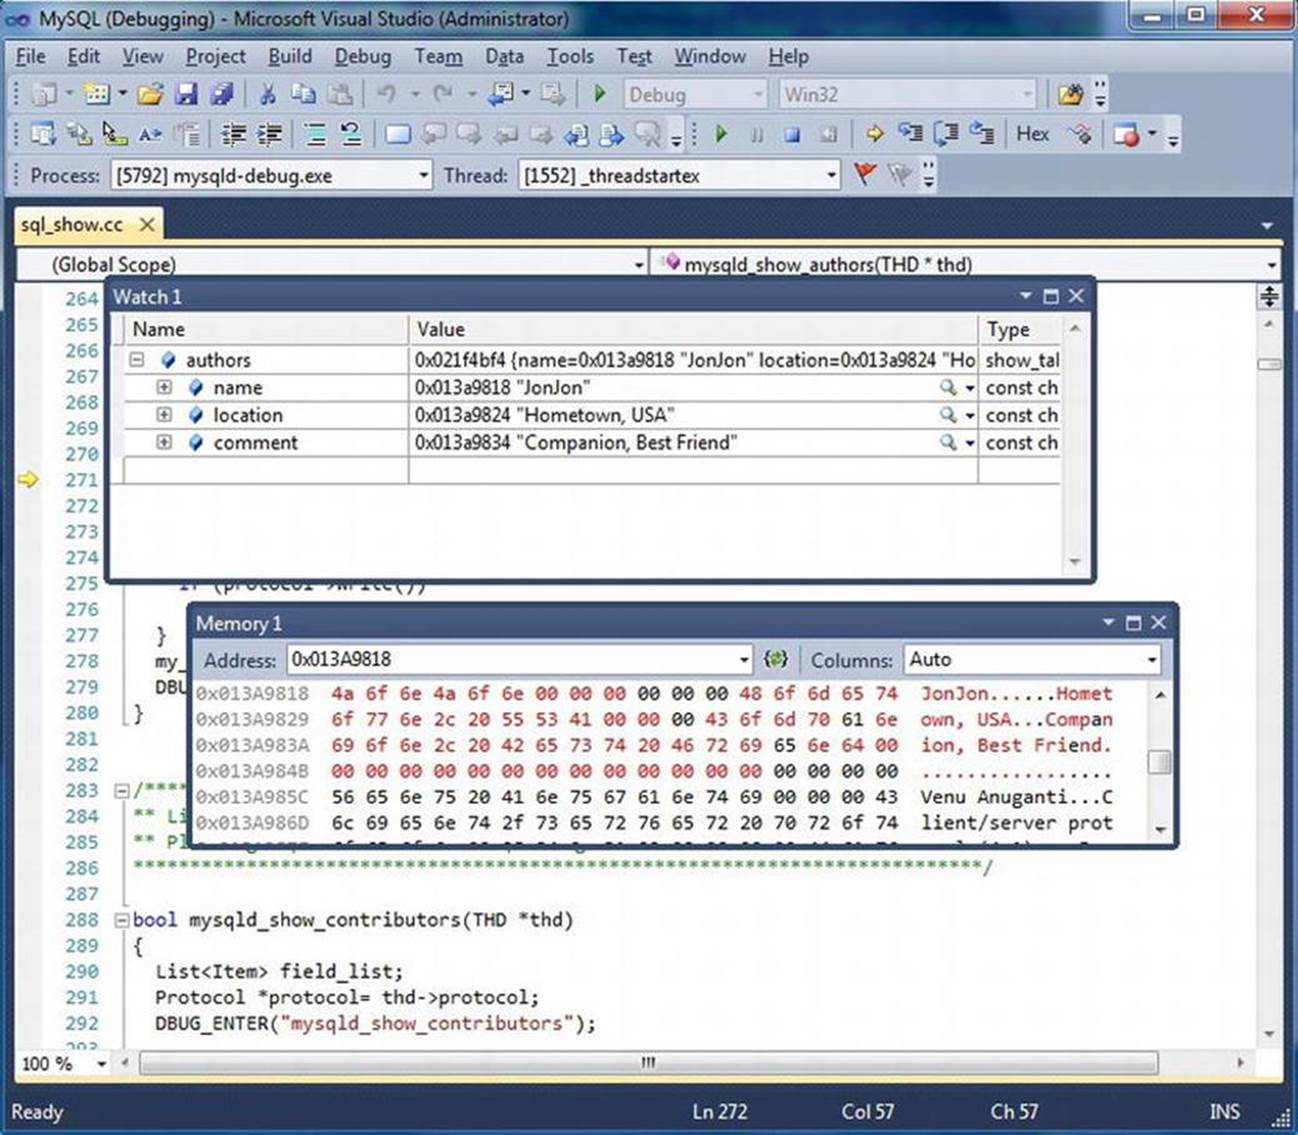
Figure 5-11. Editing values in memory using Visual Studio .NET
After the values in memory are edited, I can continue the execution and see the results in the client window. Listing 5-18 shows an excerpt of the sample output.
Listing 5-18. Output of Debugging Session
mysql> show authors;
+−−-----------+−−----------------+−−-----------------------+
| Name | Location | Comment |
+−−-----------+−−----------------+−−-----------------------+
| Aker, Brian | Seattle, WA, USA | bunch of little stuff :)|
| JonJon | Hometown, USA | Companion, Best Friend |
...
+−−-----------+−−----------------+−−-----------------------+
80 rows in set (1 min 55.64 sec)
mysql>
To stop the debugging session, I issue the shutdown command in a command window and then detach from the process using the Debug ![]() Detach All menu selection in Visual Studio.
Detach All menu selection in Visual Studio.
mysqladmin -uroot -p shutdown
Now that you’ve seen how to debug the MySQL system using Visual Studio on Windows, I encourage you to read through this example again and try it out on your own Windows development machine.
Summary
In this chapter, I explained debugging, showed you some basic debugging techniques, and provided examples of how to use them. These techniques include inline debugging statements, error handling, and external debuggers.
You learned how to use the inline debugging statements DBUG tool provided by Oracle to create trace files of the system execution, write out pertinent data, and record errors and warnings. You also learned about debugging in Linux and Windows using gdb, ddd, and Visual Studio .NET.
Developing good debugging skills is essential to becoming a good software developer. I hope that this chapter has provided you with a foundation for perfecting your own debugging skills.
In the next chapter, I examine one popular uses of the MySQL system by system integrators: embedded MySQL. This permits the MySQL system to become a part of another system. As you can imagine, the process could require some serious debugging to figure out what went wrong at what level of the embedding.
1 Personally, I don’t believe in random intervals. Until computers can think for themselves, they are just machines following the instructions humans gave them.
2 A complete list of the commonly used DBUG switches can be found in the MySQL reference manual in the appendix titled “Porting to Other Systems,” under the subheading “The DBUG Package.”
3 This is a most annoying situation that can be tricky to overcome. In these situations, I usually resort to inline debugging statements and core dumps for debugging.
All materials on the site are licensed Creative Commons Attribution-Sharealike 3.0 Unported CC BY-SA 3.0 & GNU Free Documentation License (GFDL)
If you are the copyright holder of any material contained on our site and intend to remove it, please contact our site administrator for approval.
© 2016-2026 All site design rights belong to S.Y.A.