Apache Hadoop YARN: Moving beyond MapReduce and Batch Processing with Apache Hadoop 2 (2014)
6. Apache Hadoop YARN Administration
Administering a YARN cluster involves many things. Those familiar with Hadoop 1 may know that there are many configuration properties and that their values are listed in the Hadoop documentation. Instead of repeating that information here and coming up with different explanations of each property, what we’ll do here is to give practical examples of how you can use open-source tools to manage and understand a complex environment like a YARN cluster.
To effectively administer YARN, we will use the bash scripts and init system scripts developed in Chapter 5, “Installing Apache Hadoop YARN.” Also, YARN and Hadoop in general comprise a distributed data platform written in Java. Naturally, this means that there will be many Java processes running on your servers, so it’s a good idea to know some of the basics concerning those processes and the process for analyzing them should the need arise.
We will not cover Hadoop File System (HDFS) administration in this chapter. It is assumed that most readers are familiar with HDFS operations and can navigate the file system. For those unfamiliar with HDFS, see Appendix F for a short introduction. In addition, further information on HDFS can be found on the Apache Hadoop website: http://hadoop.apache.org/docs/stable/hdfs_user_guide.html. In this chapter, we cover some basic YARN administration scenarios, introduce both Nagios and Ganglia for cluster monitoring, discuss JVM monitoring, and introduce the Ambari management interface.
Script-based Configuration
In Chapter 5, “Installing Apache Hadoop YARN,” we presented some bash scripts to help us install and configure Hadoop. If you haven’t read that chapter, we suggest you examine it to get an idea of how we’ll reuse the scripts to manage our cluster once it’s up and running. If you’ve already read Chapter 5, you’ll recall that we use a script called hadoop-xml-conf.sh to do XML file processing. We can reuse these commands to create an administration script that assists us in creating and pushing out Hadoop configuration changes to our cluster. This script, calledconfigure-hadoop2.sh, is part of the hadoop2-install-scripts.tgz tar file from the book’s repository (see Appendix A). A listing of the administration script is also available in Appendix C.
The configure-hadoop2.sh script is designed to push (and possibly delete) configuration properties to the cluster and optionally restart various services within the cluster. Since the bulk of our work for these scripts was presented in Chapter 5, we will use these scripts as a starting point. You will need to set your version of Hadoop in the beginning of the script.
HADOOP_VERSION=2.2.0
HADOOP_HOME="/opt/hadoop-${HADOOP_VERSION}"
The script also sources hadoop-xml-conf.sh, which contains the basic file manipulation commands. We also need to decide whether we want to restart and refresh the Hadoop cluster. The default is refresh=false.
We can reuse our scripts to create a function that adds or overwrites a configuration property.
put()
{
put_config --file $file --property $property --value $value
}
The put_config function from hadoop-xml-conf.sh can be used in the same way as was shown in Chapter 5. In a similar fashion, we can add a function to delete a property.
delete()
{
del_config --file $file --property $property
}
Next, we enlist the help of pdcp to push the file out to the cluster in a single command. We’ve kept the all_hosts file on our machine from the installation process, but in the event you deleted this file, just create a new one with the fully qualified domain names of every host on which you want the configuration file to reside.
deploy()
{
echo "Deploying $file to the cluster..."
pdcp -w ^all_hosts "$file" $HADOOP_HOME/etc/hadoop/
}
We’ve gotten good use out of our existing scripts to modify configuration files, so all we need is a way to restart Hadoop. We need to be careful as to how we bring down the services on each node, because the order in which the services are brought down and the order in which they’re brought back up makes a difference. The following code will accomplish this task.
restart_hadoop()
{
echo "Restarting Hadoop 2..."
pdsh -w ^dn_hosts "service hadoop-datanode stop"
pdsh -w ^snn_host "service hadoop-secondarynamenode stop"
pdsh -w ^nn_host "service hadoop-namenode stop"
pdsh -w ^mr_history_host "service hadoop-historyserver stop"
pdsh -w ^yarn_proxy_host "service hadoop-proxyserver stop"
pdsh -w ^nm_hosts "service hadoop-nodemanager stop"
pdsh -w ^rm_host "service hadoop-resourcemanager stop"
pdsh -w ^nn_host "service hadoop-namenode start"
pdsh -w ^snn_host "service hadoop-secondarynamenode start"
pdsh -w ^dn_hosts "service hadoop-datanode start"
pdsh -w ^rm_host "service hadoop-resourcemanager start"
pdsh -w ^nm_hosts "service hadoop-nodemanager start"
pdsh -w ^yarn_proxy_host "service hadoop-proxyserver start"
pdsh -w ^mr_history_host "service hadoop-historyserver start"
}
As you can see, we use the init scripts we introduced in Chapter 5 to make restarting Hadoop easier. While each of the scripts has a restart function, Hadoop must be restarted across the cluster in an orderly fashion. The correct order is given in the restart_hadoop() function shown above.
The complete script is listed in the Appendix C and is available in the book repository. The possible script arguments, shown in the following listing, can be found by using the –h argument.
configure-hadoop2.sh [options]
OPTIONS:
-o, --operation Valid values are 'put' and 'delete'. A 'put'
operation writes the property and value if it
doesn't exist and overwrites it if it does.
exist. A 'delete' operation removes the property
-f, --file The name of the configuration file.
-p, --property The name of the Hadoop configuration property.
-v, --value The value of the Hadoop configuration property.
Required for a 'put' operation; ignored for a
'delete' operation.
-r, --restart Flag to restart Hadoop. Configuration files are
deployed to the cluster automatically to
$HADOOP_HOME/etc/hadoop.
-h, --help Show this message.
As an example, let’s pick a configuration property that would be a good test candidate. Recall that in Chapter 5 we tested the freshly installed Hadoop cluster by running a simple job. If we wanted to navigate in the YARN web user interface (UI) to obtain the test job details, we would be able to view the details of the job through the MapReduce History server we configured in Chapter 5.
In Figure 6.1, we see the summary information for the test in the YARN web UI. We can look at some of the details of this job by clicking on the link for the one successful reduce task, which should result in Figure 6.2.
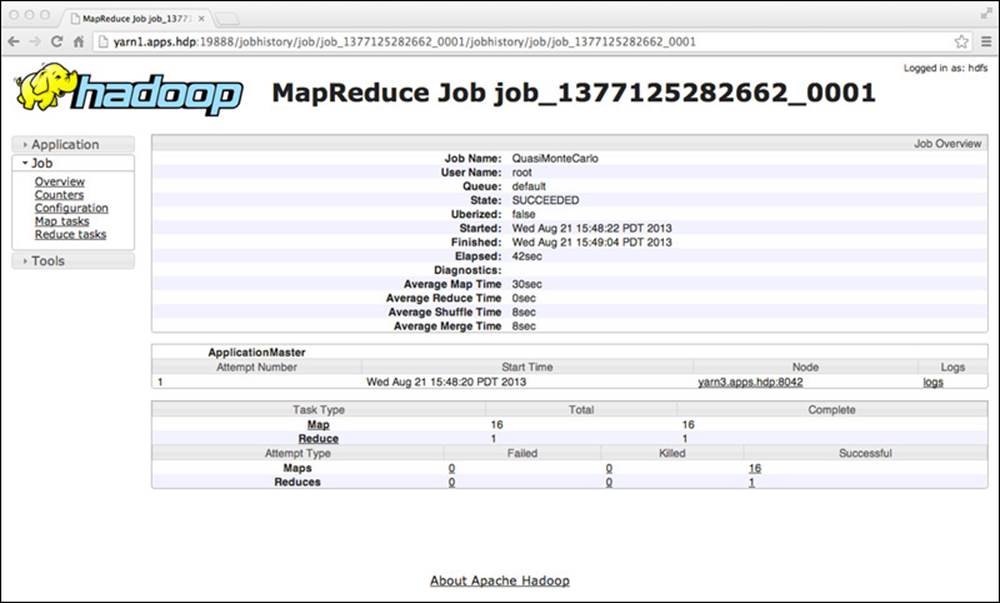
Figure 6.1 MapReduce job history
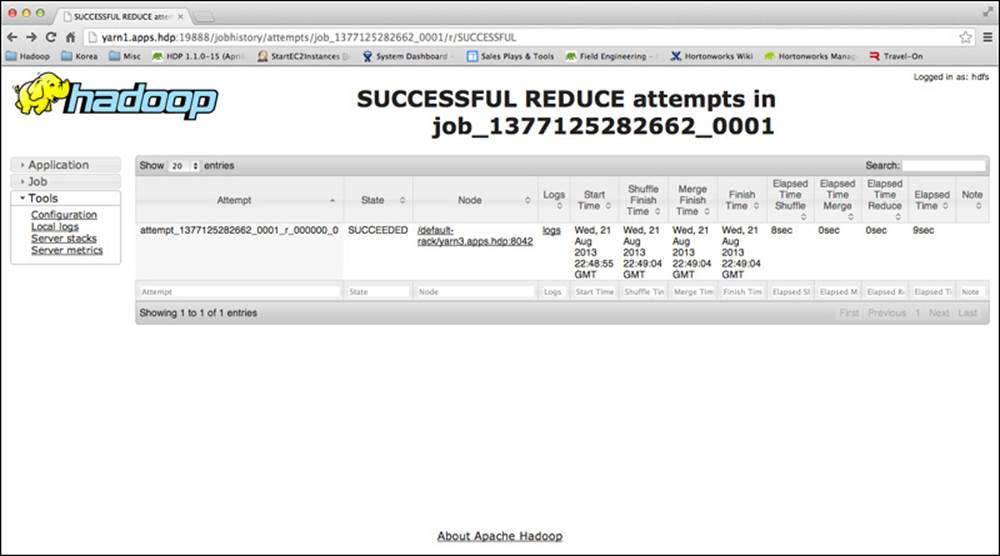
Figure 6.2 MapReduce reduce task information
So far, the information looks normal, but let’s see what happens if we drill down further into the task clicking on the “logs” link in the “Logs” column. The result appears in Figure 6.3.
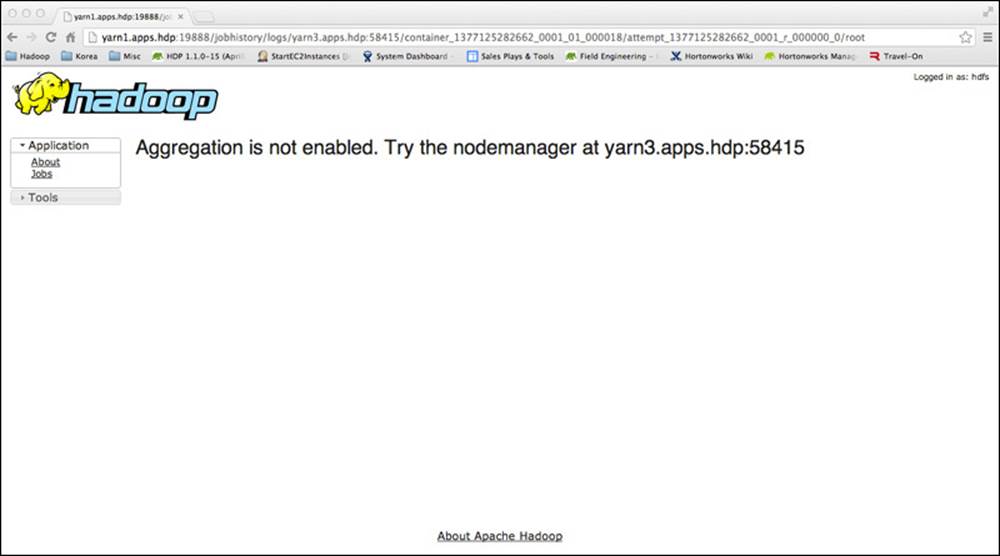
Figure 6.3 Viewing logs without log aggregation enabled
We don’t see the log file contents, but we do see a message that “Aggregation is not enabled.” If we check the Hadoop 2 documentation (see the discussion of user log aggregation later in this chapter), we see a property called yarn.log-aggregation-enable in the yarn-site.xml file, which has a default value of “false.” We also note the property called yarn.nodemanager.remote-app-log-dir, which has a default value of /tmp/logs. Additionally, the directory we designate for log aggregation must reside in HDFS, which is then accessible to all NodeManagers. Depending on the aggregation directory, we need to either check the permissions for that directory if it exists or create a new directory with appropriate permissions. These steps are accomplished as follows:
# su - hdfs -c "hadoop fs -mkdir -p /yarn/logs"
# su - hdfs -c "hadoop fs -chown -R yarn:hadoop /yarn/logs"
# su - hdfs -c "hadoop fs -chmod -R g+rw /yarn/logs
To complete the setting, we will use the configure-hadoop2.sh script described previously. First we set the location of the logs (yarn.nodemanager.remote-app-log-dir) to /yarn/logs; next we enable the log aggregation (yarn.log-aggregation-enable). Also note the –r option, which will restart the Hadoop installation with the new setting.
# ./configure-hadoop2.sh -o put -f yarn-site.xml \
-p yarn.nodemanager.remote-app-log-dir \
-v /yarn/logs –f
# ./configure-hadoop2.sh -o put -f yarn-site.xml \
-p yarn.log-aggregation-enable -v true –r
Once Hadoop has restarted, we can resubmit the test job and consult the web UI to see if the logs are now available. If the setting worked, you should see something similar to Figure 6.4.
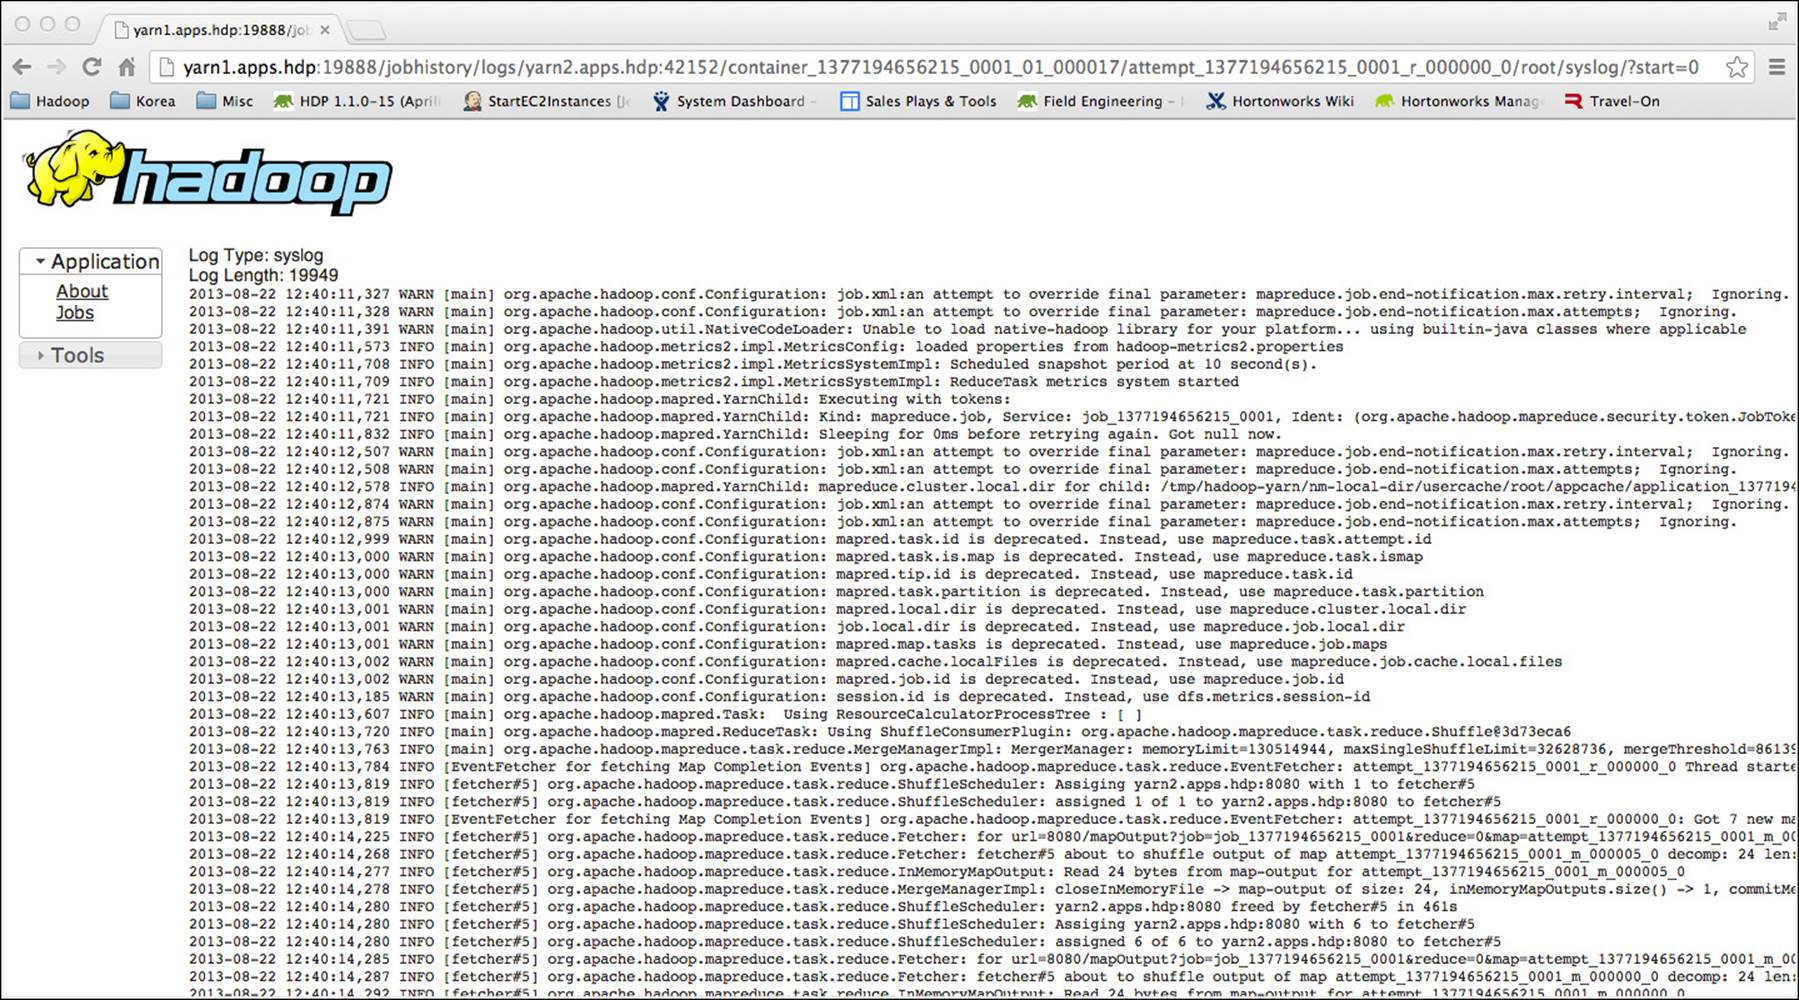
Figure 6.4 Example of aggregated log output
Other Hadoop properties can be changed in a similar fashion. The configure-hadoop2.sh script provides a simple method to change Hadoop XML files across the entire cluster without the repetitive need to log into individual nodes. It also helps with an orderly restart of the whole cluster.
Monitoring Cluster Health: Nagios
A popular open-source monitoring tool is Nagios (http://www.nagios.org). Nagios monitors your infrastructure with a number of built-in and community-developed plug-ins. It is also possible to write your own plug-ins using a number of different methods, in different languages like C, Python, and shell scripts. We’ve been using bash shell scripts to show installation and configuration, so we’ll stick with that method to show you how to begin to monitor your Hadoop cluster using Nagios. In our example, we’ll use a small, three-node cluster.
The first step is to choose a server in your cluster that will be the Nagios server. This server will act as the hub in our monitoring system. On the machine you choose to be the Nagios server, we recommend you install Nagios using your native package management system. For Red Hat–based systems, this would be done as follows. (Note: This step assumes you have enabled the EPEL repository as explained in Chapter 5.)
# yum install nagios
Other distributions may use different tools (e.g., apt for Debian-based systems).
Once the Nagios RPM is installed, there are a few configuration steps. First, you may want to add your email address to the /etc/nagios/objects/contacts.cfg file. If you want to remotely view the Nagios web UI, you may need to modify the “Allow from” line in the/etc/httpd/conf.d/nagios.conf. Also, check your iptables, in case your firewall is blocking access. It is also a good idea to set a Nagios password by issuing the following command:
# htpasswd –c /etc/nagios/passwd nagiosadmin
Finally, make sure that both the httpd and nagios services are running. Use chkconfig to ensure they start on the next reboot. At this point, you should be able to bring up the Nagios web UI by pointing your local browser to http://localhost/nagios.
Once you have the Nagios server installed, you’ll be able to define a large number of objects—such as hosts, host groups, and services—that can be monitored. Although there are other things worth monitoring in the cluster, we will focus on installing and configuring Nagios for monitoring YARN.
Since we will add our own entry for the local host, edit the file /etc/nagios/nagios.cfg and comment out (add # in front of the line) the following line:
cfg_file=/etc/nagios/objects/localhost.cfg
To set up our Hadoop 2 cluster monitoring, we first tell Nagios about our servers by creating a file in /etc/nagios/conf.d called hadoop-cluster.cfg. By default, Nagios is configured to look in this directory for files with the *.cfg extension. Listing 6.1 shows us how to define a host so that it becomes available to Nagios.
Listing 6.1 Nagios host definition
define host{
use linux-server
host_name yarn1.apps.hdp
alias yarn1.apps.hdp
address 192.168.207.231
}
Nagios uses templates that allow the administrator to set up a configuration quickly. One such template is linux-server, as shown in Listing 6.1. It is assigned to the “use” directive and instructs Nagios to use the standard Linux monitoring template. The rest of the directives are obvious and include host_name, alias, and address. The alias is used by the Nagios web UI. We also need a host entry for the other two nodes in our cluster (yarn2.apps.hdp and yarn3.apps.hdp).
Once we have all our hosts defined with a define host block, it is very convenient to define a host group for similar nodes in the hadoop-cluster.cfg file. Our host group will look like the definition in Listing 6.2, where we add all the nodes in our Hadoop cluster.
Listing 6.2 Nagios host group definition
define hostgroup{
hostgroup_name hadoop-cluster
alias Hadoop
members yarn1.apps.hdp,yarn2.apps.hdp,yarn3.apps.hdp
}
Monitoring Basic Hadoop Services
In Chapter 5, we deployed scripts to start and stop all of the Hadoop services on the cluster. Nagios can easily monitor these services and display the results of that monitoring on a convenient web interface. The first step is to create a script that will do the service monitoring. According to the Nagios documentation, the following return codes are expected as the result of each command or script that’s run to determine a service state:
OK = 0
Warning = 1
Critical = 2
Unknown = 3
As an example, we will write a plug-in to monitor the state of the ResourceManager. The full listing for the plug-in appears in Appendix D and can be found in the book repository. For this plug-in, we’ll keep things simple and reuse the init scripts that we created in Chapter 5. First, because the ResourceManager is running or stopped, we will use only two return codes.
# Exit codes
STATE_OK=0
STATE_CRITICAL=2
As with the other scripts we’ve created, we need code to parse the arguments passed to the script as well as the arguments passed to the help and usage output functions. This code can be found in the full script in Appendix D. The heart of the script is as follows:
status=$(/sbin/service hadoop-resourcemanager status)
if echo "$status" | grep --quiet running ; then
echo "ResourceManager OK - $status"
exit $STATE_OK
else
echo "ResourceManager CRITICAL - $status"
exit $STATE_CRITICAL
fi
The script is fairly simple. We are using the init scripts from Chapter 5 that return one of two responses to the “status” requests (running or stopped).
# service hadoop-resourcemanager status
Hadoop YARN ResourceManager daemon (pid 36772) is running...
# service hadoop-resourcemanager status
Hadoop YARN ResourceManager daemon is stopped
We can use grep to confirm the “running” response or assume the service is stopped otherwise. Once we’re satisfied with the script, we name it check_resource_manager.sh and put it in the Nagios plug-in directory (e.g., /usr/lib64/nagios/plugins). We tell Nagios about this plug-in by adding the following lines to our hadoop-cluster.cfg file:
define command{
command_name check_resource_manager
command_line /usr/lib64/nagios/plugins/check_resource_manager.sh
}
Defining the command is pretty simple: We give the fully qualified path and file names for the actual command and give the command a name that will be used elsewhere in our configuration file.
The next step is to define a Nagios service that uses our new command in the hadoop-cluster.cfg file.
define service{
use local-service
host_name yarn1.apps.hdp
service_description ResourceManager
check_command check_resource_manager
}
The service definition uses a template like the block we used earlier to define a host. This template is called local-service and, as the name suggests, it defines a service local to the Nagios server. The host_name and service_description are self-explanatory. We run this service only on the node that runs the ResourceManager. The check_command is where we see the command_name in the define command block created previously (these names must match).
The next step is to define a service and command entry for each of the other services. To save time, these are provided in Appendix D and online.
To use the new configuration, we need to restart Nagios as follows:
# service nagios restart
If everything is working correctly, the new service should be available on the Nagios web UI for yarn1.apps.hdp.
The assumption so far has been that Nagios will monitor local services on the same machine as the Nagios server. Obviously, Hadoop is a distributed system that requires cluster-wide monitoring. Nagios has a few methods available for providing cluster-wide functionality, but the easiest way is with the Nagios Remote Plugin Executor (NRPE). Assuming that the NodeManagers and DataNodes are on remote servers, we need to install the Nagios NRPE on each of these remote servers as follows. (Note: pdsh can be helpful here.)
# yum install nrpe nagios-plug-ins
The default configuration for NRPE is to trust only communication from the local host. Thus the first thing to do in an NRPE installation is to tell it where the Nagios server is by specifying its IP address in the /etc/nagios/nrpe.cfg file on the cluster nodes. (Your IP address may be different.)
allowed_hosts=127.0.0.1,192.168.207.231
We can use the Nagios script plug-ins found in Appendix D to check the NodeManager and DataNode state. These scripts should be placed in the plug-in directories of the remote machines (/usr/lib64/nagios/plug-ins). When this step is complete, we define the command in thenrpe.cfg file.
command[check_node_manager]=/usr/lib64/nagios/plugins/check_node_manager.sh
command[check_data_node]=/usr/lib64/nagios/plugins/check_data_node.sh
Once we’ve set up the remote servers via NRPE, we can go back to our hadoop-cluster.cfg file on the Nagios server and add the following commands and services:
define command{
command_name check_nrpe
command_line /usr/lib64/nagios/plugins/check_nrpe -H $HOSTNAME$ -c $ARG1$
}
define service{
use local-service
host_name yarn2.apps.hdp,yarn3.apps.hdp
service_description NodeManager
check_command check_nrpe!check_node_manager
}
define service{
use local-service
host_name yarn2.apps.hdp,yarn3.apps.hdp
service_description DataNode
check_command check_nrpe!check_data_node
}
The NRPE command uses command variable substitution in Nagios. In the define command block, we see several variables that, in Nagios terms, are called macros. The $HOSTNAME$ macro is expanded by Nagios with the host_name value in the service definition. If more than one host is defined, Nagios executes the command remotely on each host specified. The $ARG1$ macro is expanded with the values delimited by the “!” character in the check_command line, which is also found in the service definition.
You may wish to add other services from the Nagios plug-ins (e.g., check_local_load) for all nodes by using the hostgroup_name. In this case, add the service block to the hadoop-cluster.cfg as follows:
define service {
use generic-service
hostgroup_name hadoop-cluster
service_description Current Load
check_command check_local_load!5.0,4.0,3.0!10.0,6.0,4.0
}
Monitoring the JVM
So far, we have defined some basic services that simply monitor the started/stopped state of the various Hadoop daemons. An example of a slightly more complex service is one that monitors a specific portion of the Java Virtual Machine heap space for the ResourceManager process. To create this monitor, we will utilize the command-line tool that ships with the Java Development Kit we installed in Chapter 5.
To write this service, we will take advantage of a tool called jstat. The jstat tool is found in the JDK’s bin directory and displays a large number of JVM statistics. Almost all JDKs provide the jstat tool as part of their installation; for instance, it is available in both the Linux OpenJDK and the Oracle JDK packages. As an example, we will monitor the JVM’s old space utilization as a percentage of the old space’s capacity. The command to do this and its output are shown here:
# $JAVA_HOME/bin/jstat -gcutil $(cat /var/run/hadoop/yarn/yarn-yarn-resourcemanager.pid)
S0 S1 E O P YGC YGCT FGC FGCT GCT
0.00 100.00 40.85 11.19 99.35 9 0.044 0 0.000 0.044
According to the jstat documentation, the column with the heading “O” identifies the percentage of old space used in the JVM based on the old space’s capacity (in this case, 11.19% of capacity). We use the following lines to create the desired monitor:
pct=$("$JAVA_HOME"/bin/jstat -gcutil $(cat "$PIDFILE") | awk 'FNR == 2 {print $4}')
if [ "$pct" > "$critical" ] ; then
printf "ResourceManager Heap Old Space %% used %s - %g" CRITICAL "$pct"
exit $STATE_CRITICAL
elif [ "$pct" > "$warn" ]; then
printf "ResourceManager Heap Old Space %% used %s - %g" WARN "$pct"
exit $STATE_WARNING
else
printf "ResourceManager Heap Old Space %g%% used is %s" "$pct" OK
exit $STATE_OK
fi
In the previous code snippet, the awk command is used to parse the tabular output of the jstat command. In defining the bash “pct” variable, we simply pipe the output of the jstat command to awk, and then tell awk to get the fourth column in the second row of the output. The script snippet assumes the appropriate files have been included via the “source” function so that we have access to the JAVA_HOME variable. You can find the complete script in Appendix D.
Unlike in the previous examples, we may have situations that can pass with a warning instead of meeting a critical threshold. If the “Old Space Percentage Used” passes these thresholds, then Nagios can send the appropriate message.
To use the service, we need to add the following command and service definitions in our hadoop-cluster.cfg file:
define command{
command_name check_resource_manager_old_space_pct
command_line /usr/lib64/nagios/plugins/check_resource_manager_old_space_pct.sh -w $ARG1$ -c $ARG2$
}
define service{
use local-service
host_name yarn1.apps.hdp
service_description ResourceManager Old Space Pct Used
check_command check_resource_manager_old_space_pct!50!75
}
In the define command section, the option values of –w and –c are used to signify the warning and critical levels and are reserved for use by Nagios. In our example, we’re using 50% as a warning value and 75% as a critical value; these values are appended to thecheck_resource_manager_old_space_pct command we created earlier.
Nagios also has many publicly available plug-ins that are found in /usr/lib64/nagios/plug-ins (assuming a 64-bit server platform). If you are using a Red Hat–based system, you can issue the following command to see which plug-ins are available:
# yum search nagios
One widely used tool is ping. As the name implies, it pings servers in your infrastructure to see if they can respond to a basic ping. If you install the ping plug-in (e.g., #yum install nagios-plug-ins-ping), you’ll find it in the plug-in directory as a command calledcheck_ping.
Putting it all together, when we have our monitoring scripts written, and our Hadoop cluster hosts, commands, and services defined in a configuration file available to Nagios, we are able to monitor our cluster as shown in Figure 6.5.
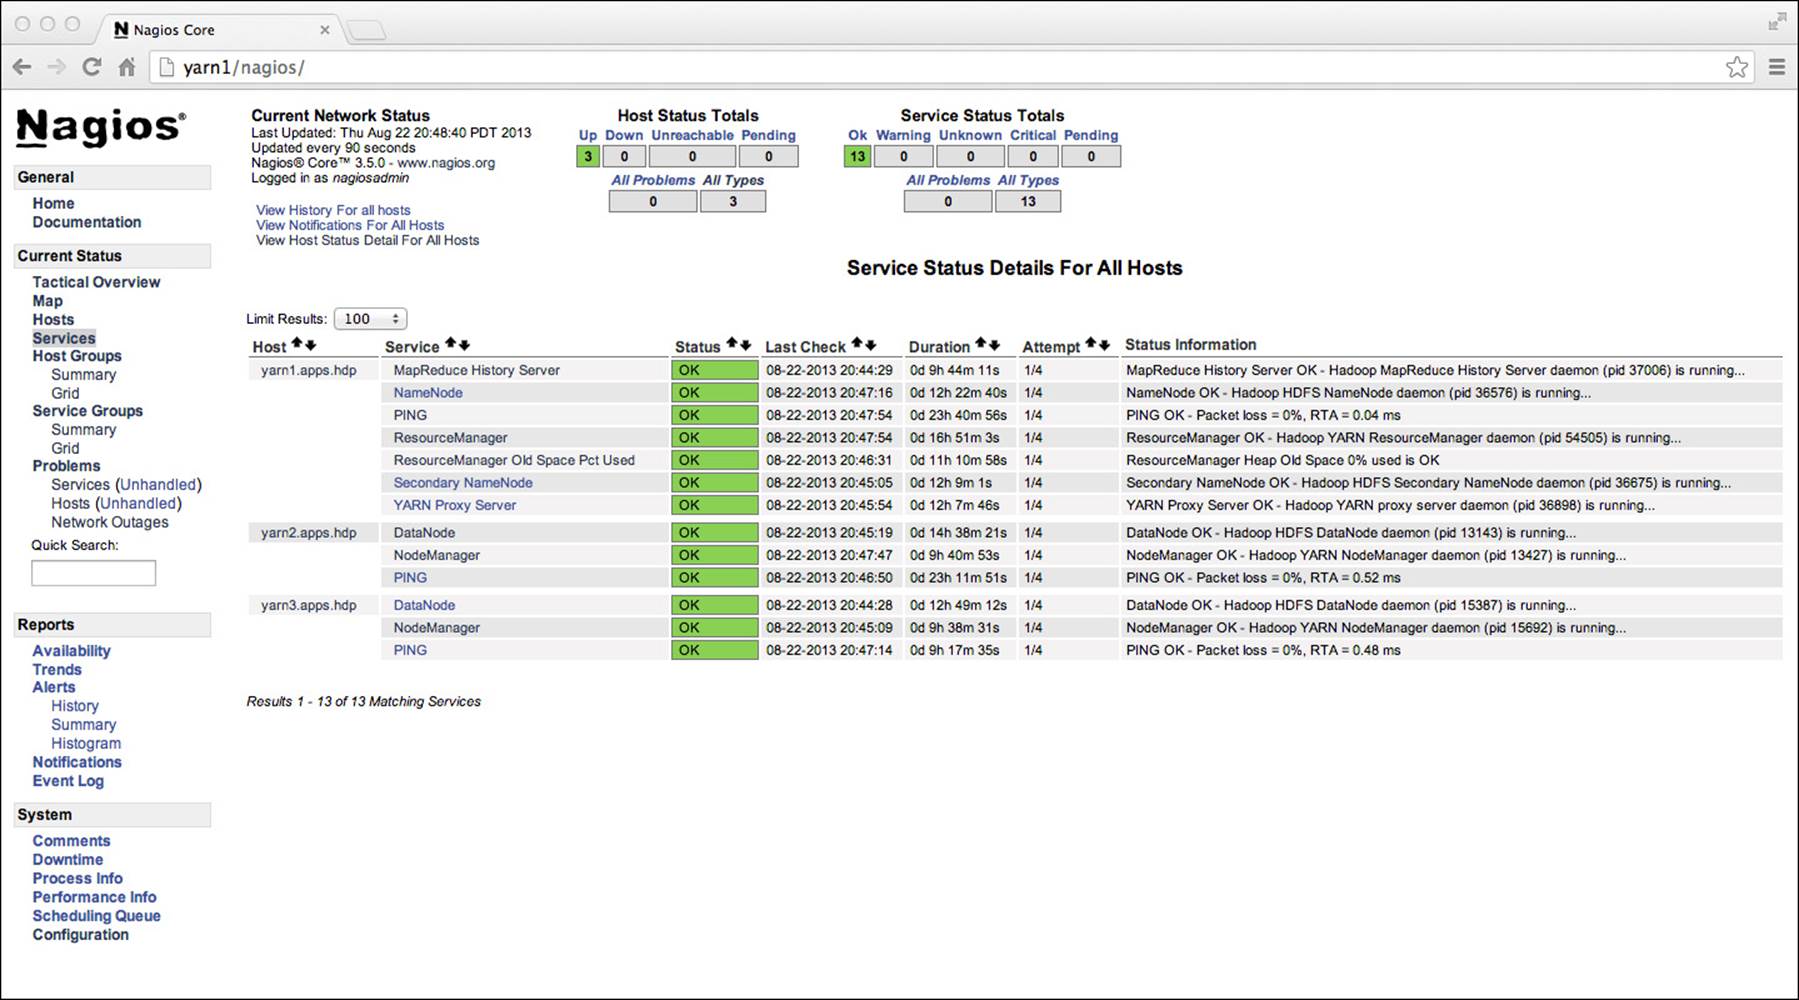
Figure 6.5 Nagios monitoring a Hadoop cluster
Real-time Monitoring: Ganglia
Nagios is great for monitoring and sending out alerts for events, but it does not provide real-time monitoring of the cluster. To get a real-time view of the cluster, the Ganglia monitoring system can be used. Ganglia’s strength is that it ships with a large number of metrics for which it is able to generate real-time graphs. For the more visually inclined system administrator, this is the tool for you.
The Ganglia monitoring daemon is called gmond and must be installed on all servers you wish to monitor. On your main monitoring node, install the following packages:
# yum install ganglia ganglia-web ganglia-gmetad ganglia-gmond
All other nodes need only the monitoring daemon, which can be installed using pdsh.
# pdsh -w ^all_hosts yum install ganglia-gmond
You will need to add the multicast route to the monitoring node as follows:
# route add -host 239.2.11.71 dev eth0
Change eth0 to the cluster-wide Ethernet port (i.e., eth0, eth1, eth2, ...). This command can be made automatic on the next boot by adding it to the /etc/rc.local file on the monitoring node.
On the main monitoring node, edit the /etc/ganglia/gmetad.conf and make sure the following line is present in the file. This line tells the gmetad collection daemon to get all cluster data from the local gmond monitoring daemon.
data_source "my cluster" localhost
On all cluster nodes (including the monitoring node), edit the file /etc/ganglia/gmond.conf and enter a value for the cluster name by replacing the “unspecified” value in the cluster block shown in the following listing. Other values are optional but all values must be the same on all nodes in the cluster.
cluster {
name = "unspecified"
owner = "unspecified"
latlong = "unspecified"
url = "unspecified"
}
On the main monitoring node, start the data collection daemon and all monitoring daemons as follows:
# service gmetad start
# pdsh -w ^all_hosts service gmond start
Both gmond and gmetad can be set to start automatically by using chkconfig. The ganglia webpage can be viewed by opening a web browser on the monitoring node using the local Ganglia URL: http://localhost/ganglia. An example Ganglia page is shown in Figure 6.6.
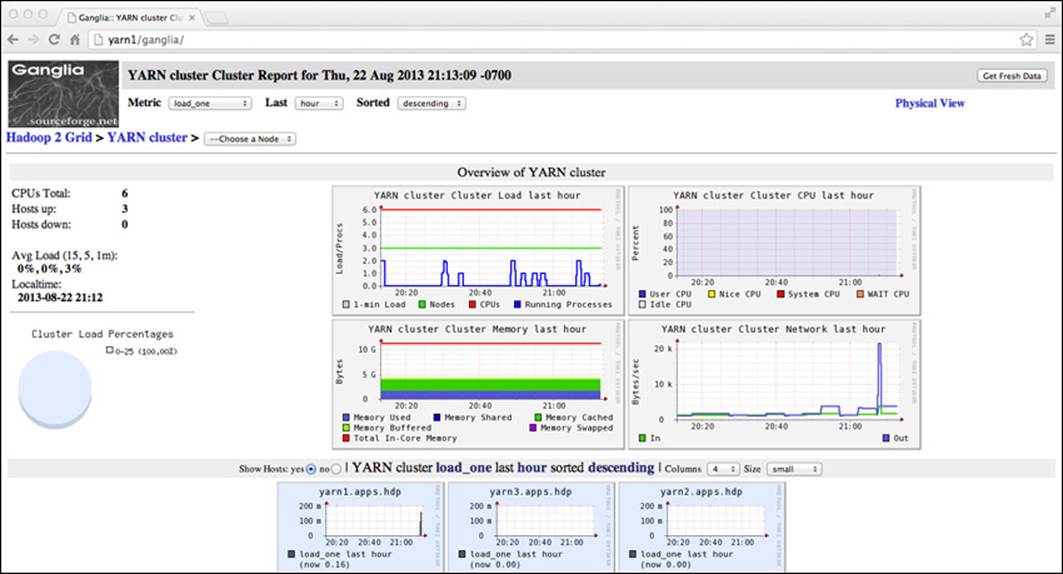
Figure 6.6 Ganglia monitoring a Hadoop cluster
Administration with Ambari
Apache Ambari was used in Chapter 5 to install Hadoop 2 and related packages across a cluster. In addition, Ambari can be used as a centralized point of administration for a Hadoop cluster. Using Ambari, administrators can configure cluster services, monitor the status of nodes or services, visualize hotspots using service metrics, start or stop services, and add new nodes to the cluster. All of these features provide a high level of agility to the processes of managing and monitoring your distributed environment.
After completing the initial installation and logging into Ambari, you will be presented with a dashboard. The dashboard provides a number of high-level metrics around HDFS, YARN, HBase, and the rest of the Hadoop stack components. The top navigation menu, shown in Figure 6.7, provides interfaces to access the Dashboard, Heatmaps, Services, Hosts, and Admin features. The status (up/down) of various Hadoop services is displayed on the left using green/red dots. Note that two of the services managed by Ambari are Nagios and Ganglia; these services are installed by Ambari and there is no need to reinstall them as described previously.
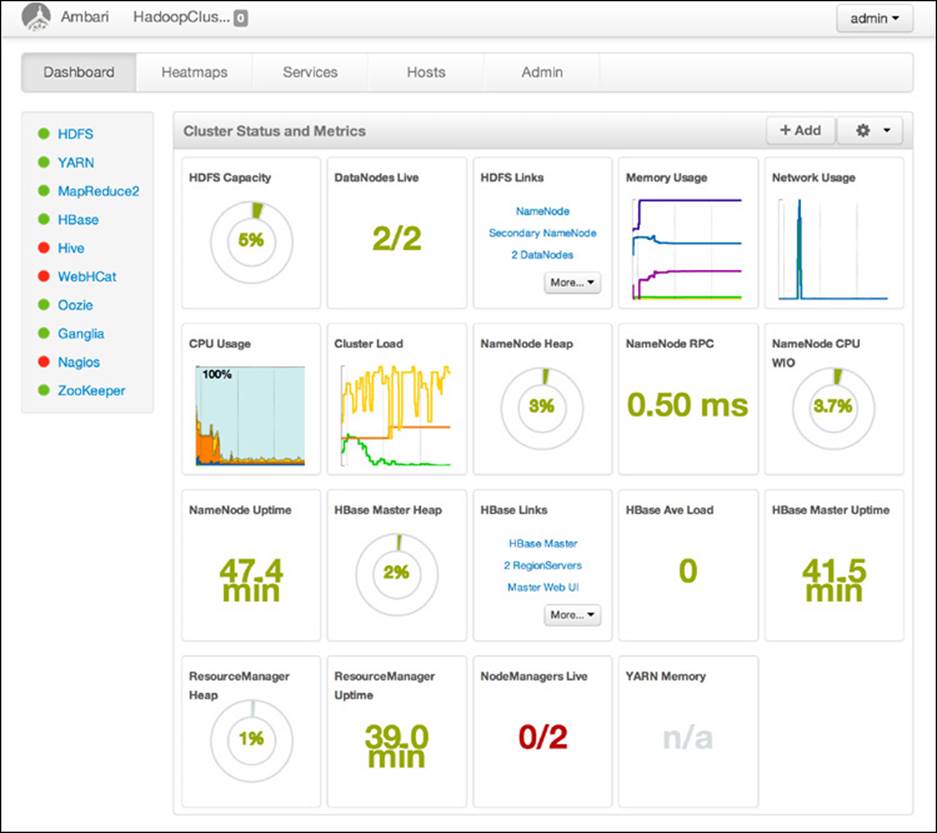
Figure 6.7 Ambari main control panel
The Heatmaps section allows you to visualize all the nodes in the cluster. Visual indicators include Host metrics, YARN metrics, HDFS metrics, and HBase metrics. Host metrics show memory usage, CPU wait on I/O, and storage used. YARN metrics include JVM garbage collection times, JVM heap size, and percentage of container node memory used. HDFS visuals show HDFS bytes read or written, JVM garbage collection, and JVM heap size. HBase metrics show read and write counts, compaction queue size, regions and memory store sizes. Figures 6.8 and 6.9 are examples of these types of heatmaps.
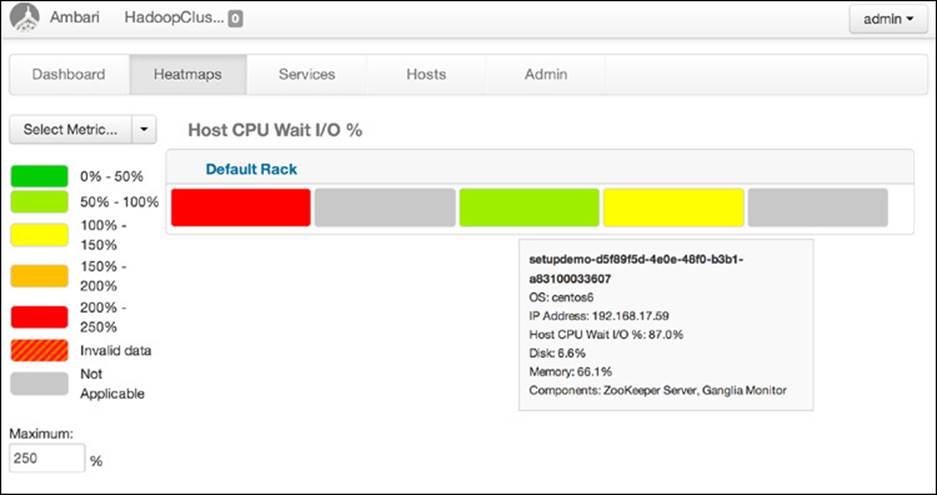
Figure 6.8 Ambari dashboard showing host CPU wait heatmap
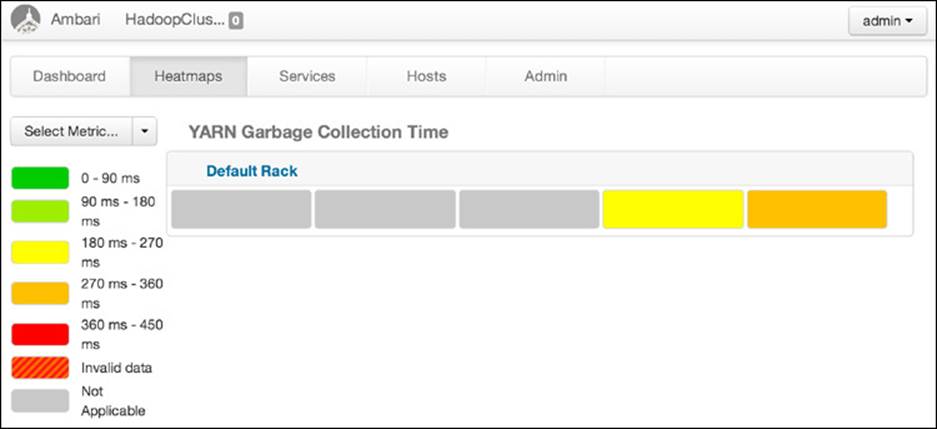
Figure 6.9 Ambari dashboard showing YARN garbage collection time heatmap
The Services page allows users to modify cluster-wide Hadoop configuration files and displays metrics for all the Hadoop services running on the cluster (e.g., HDFS, YARN, Hive, HBase). This window, shown in Figure 6.10, also provides the ability to start and stop some or all services on the cluster. A user can individually stop, start, or test a service, respectively, with the Stop, Start, and Maintenance buttons near the top right of the screen.
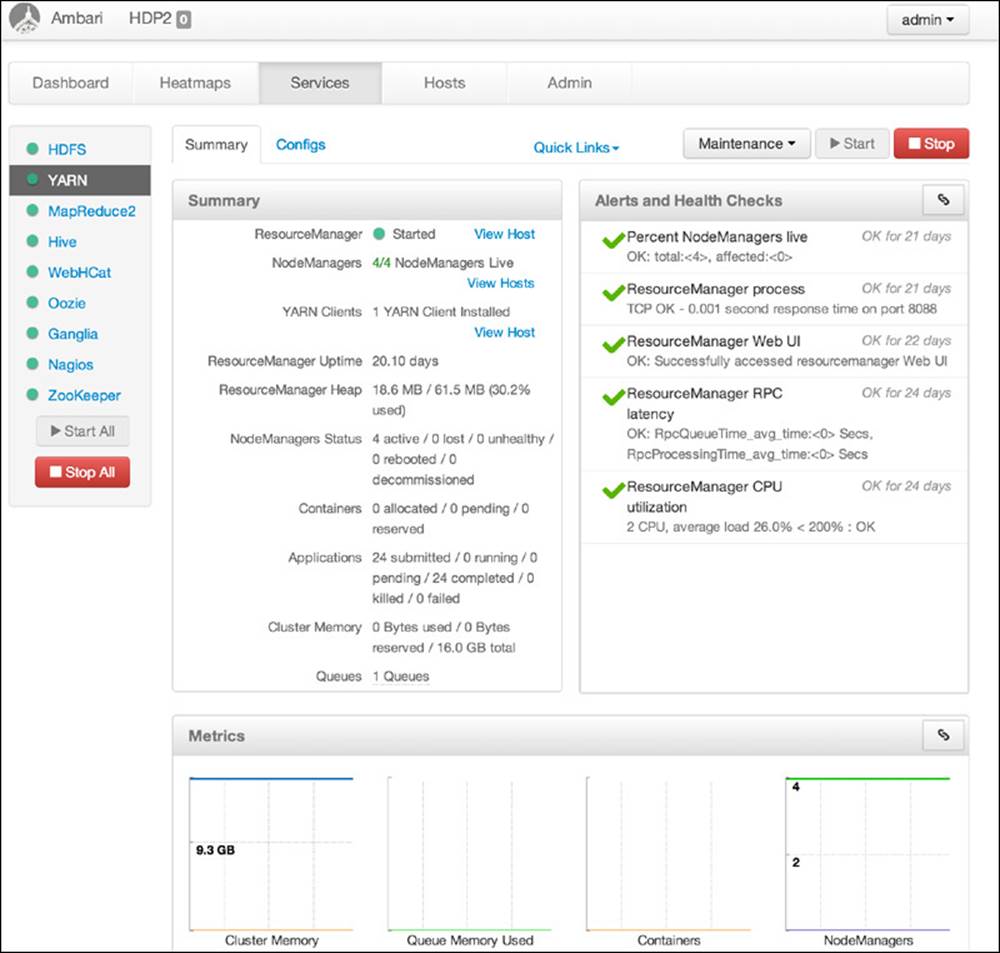
Figure 6.10 Ambari dashboard Services window
Figure 6.11 is an example of the MapReduce2 properties available in the Services window. Administrators can easily change these parameters without the need to change Hadoop configuration files by hand.
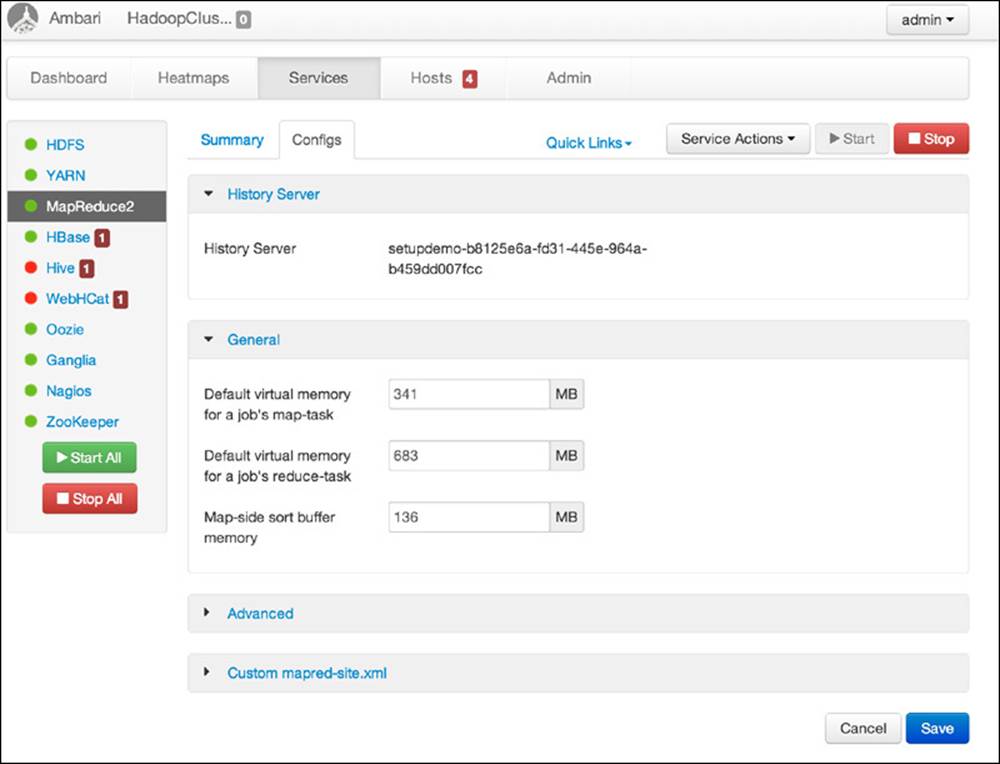
Figure 6.11 Ambari MapReduce2 options window
The Hosts tab provides the status for every node in the cluster. This window, shown in Figure 6.12, will warn users if a master or slave is down. It also shows when a node stops sending heartbeats, in addition to providing alerts about events such as the Hive Metastore MySQL database being down. Clicking the Add New Hosts button on the right allows you to grow your cluster and automatically install required services onto it, such as HDFS, YARN, and client tools. The light blue Components button produces a drop-down selection of installed service components (e.g., DataNodes, NodeManagers); by selecting a component here, you can filter out nodes lacking the selected component.
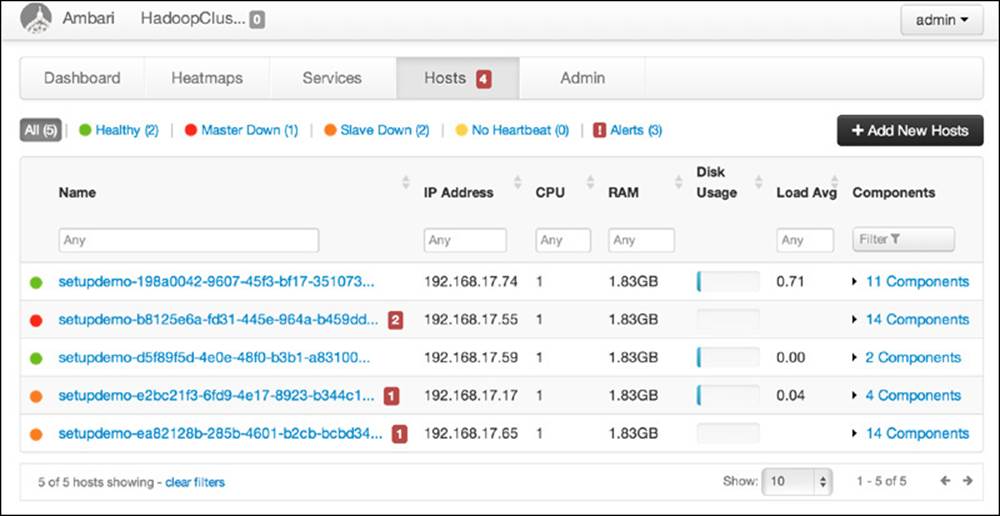
Figure 6.12 Ambari Hosts status window
The Admin tab provides information about users, HA, security, cluster stack versions, and other miscellaneous topics. The “User” section allows an administrator to create new users and grant them permissions ranging from complete control of the cluster to only viewing cluster metrics. NameNode High Availability can be enabled in the “High Availability” section, and Kerberos security can be enabled in the “Security” section. Details on the installed software stack versions can be found in the “Cluster” section, shown in Figure 6.13. Finally, the “Misc” section lists the usernames for specific services and their respective groups.
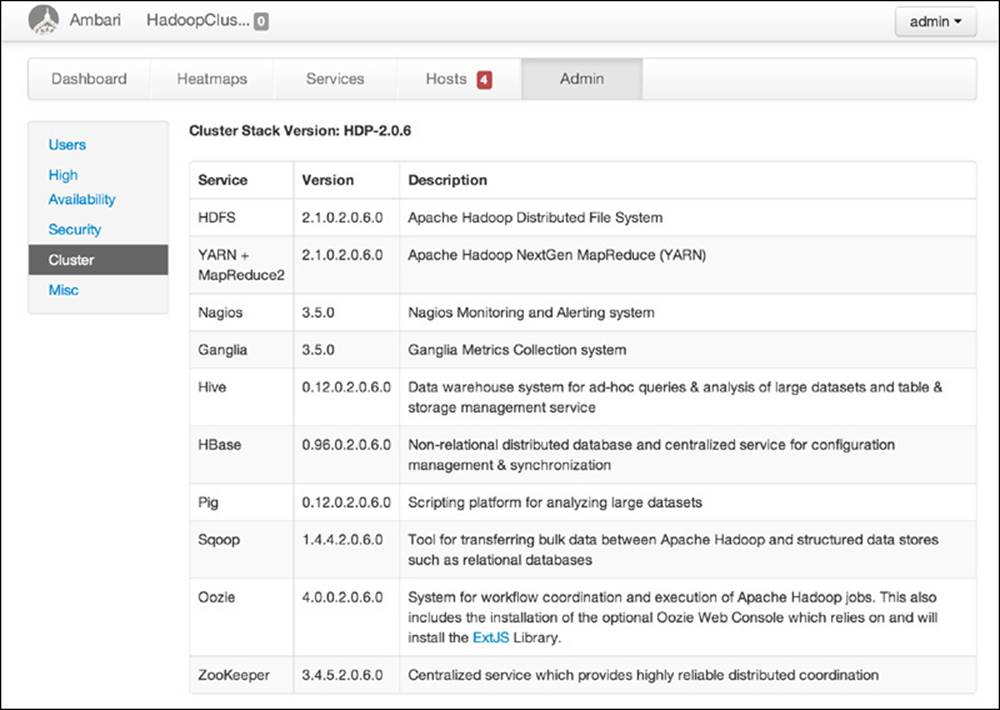
Figure 6.13 Ambari Admin window
Ambari provides a single control panel for the entire Hadoop cluster. This control panel is a project with stable releases with more features planned for future versions. Currently, it is a highly usable and useful tool for installation and administration of Hadoop 2 clusters.
JVM Analysis
Because Hadoop is written almost entirely in Java, it may be helpful to understand some basic Java-related troubleshooting methods available to administrators.
A Java Virtual Machine (JVM) process is separated into three segments called generations—specifically, the young, old, and permanent generations. The young generation is sometimes referred to as the new generation, and the old generation is sometimes referred to as the tenured generation. The young and old generations can be given hints as to how big each is, but the exact size is calculated by the JVM. A young generation size can be initialized with the –XX:NewSize argument and a ratio given to calculate the old generation with –XX:NewRatio. If the –XX:NewRatio was given a value of 2, this means the old generation is twice as large as the new generation. Both the old and young generations are given an initial size by the JVM process with the –Xms option and can grow to the size specified by the –Xmx option.
The new generation is broken down into three subsegments: Eden, Survivor Space I, and Survivor Space II. When an object is created in the JVM, it’s created first in Eden, then moved to Survivor Space I, then moved to Survivor Space II, and finally moved to the old generation. The JVM moves the objects to each subsegment in the young generation during minor garbage collection. When there is no more room in the old generation for objects during a garbage collection process, the JVM triggers a major garbage collection process that can have a negative performance impact on all Java applications, which, in our case, are the YARN applications.
One method to analyze memory usage on a running application is to use the jmap tool provided with most Java installations. The jmap tool can handle a number of different tasks, but one that is highly useful is attaching itself to a running Java process through the process ID. For example, a heap dump from a YARN container (like the container spawned in the Chapter 5 installation tests) can be obtained as follows. Here we tell jmap to dump the heap for process 21341 to file mr-container.hprof.
# jmap -dump:format=b,file=~/mr-container.hprof -F 21341
Attaching to process ID 21341, please wait...
Debugger attached successfully.
Server compiler detected.
JVM version is 20.6-b01
Dumping heap to /opt/rm.hprof ...
Finding object size using Printezis bits and skipping over...
Finding object size using Printezis bits and skipping over...
Heap dump file created
The heap dump can be read with the jhat utility, but a much better visual tool is the Eclipse Memory Analyzer (http://www.eclipse.org/mat/). Once installed, the mr-container.hprof generated with jmap can opened in the Eclipse Memory Analyzer, as shown in Figure 6.14.
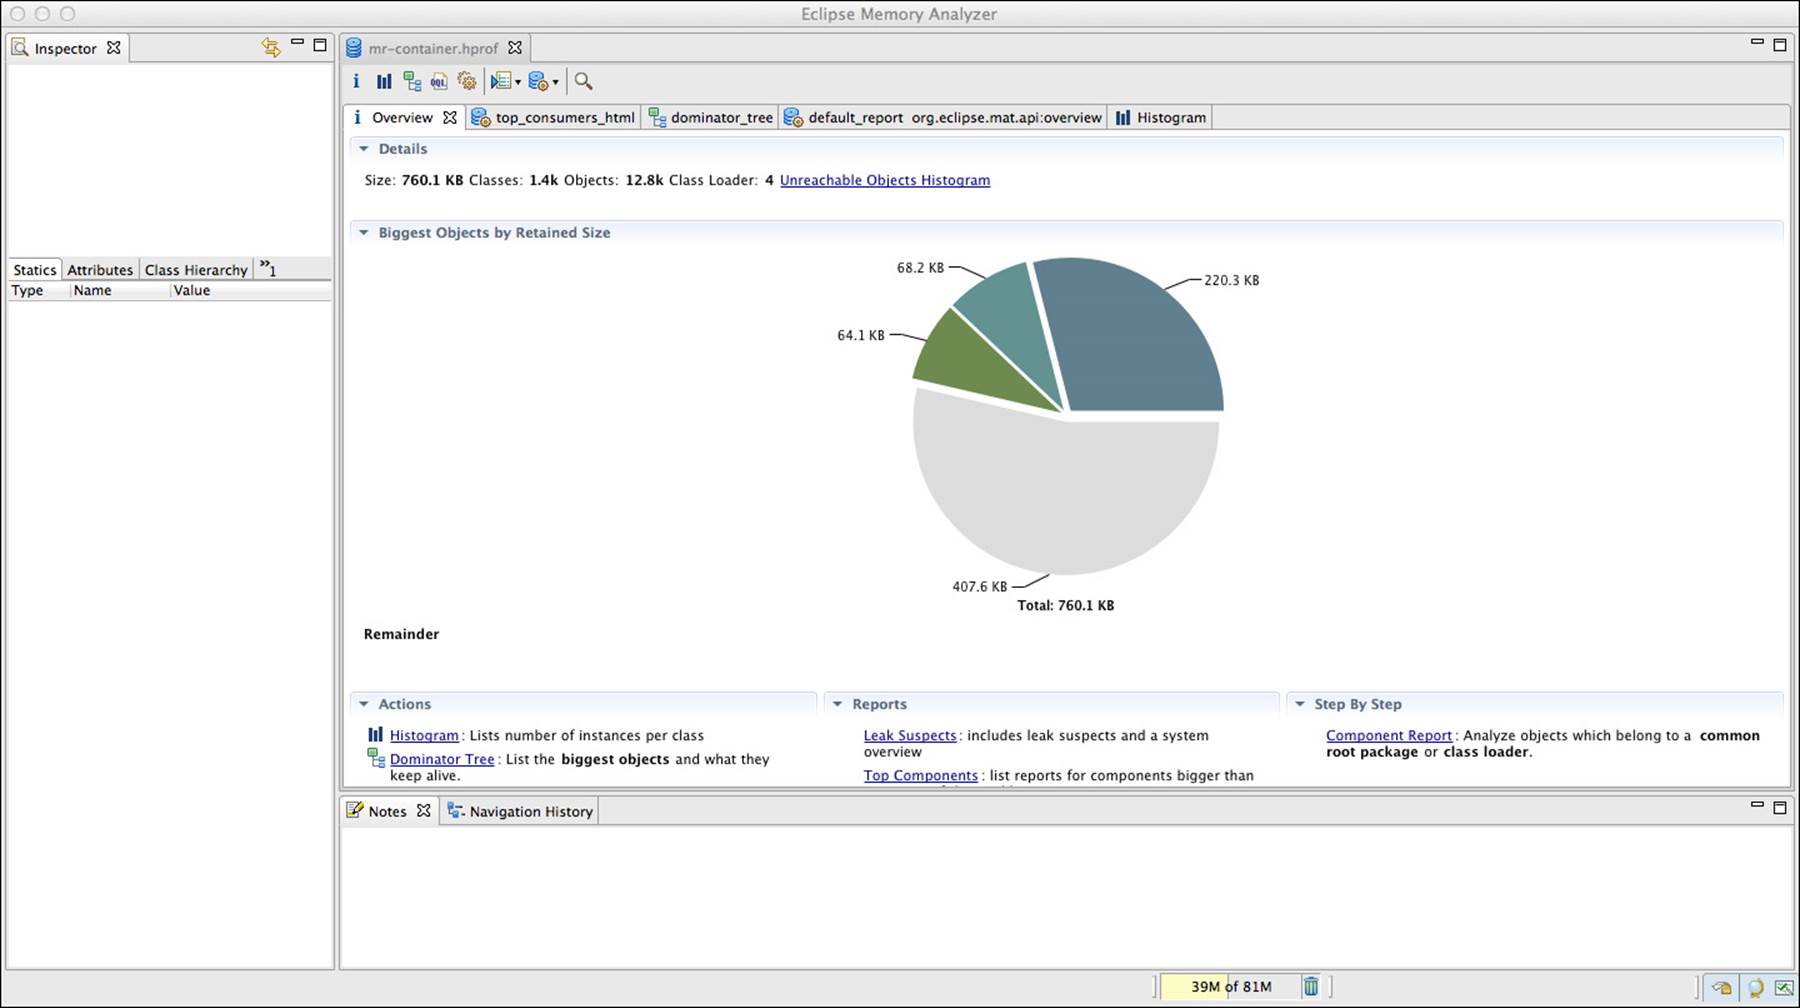
Figure 6.14 JVM heap dump displayed with Eclipse Memory Analyzer
From the main page, a number of reports can be run on the heap dump, showing things like the largest memory objects. For example, Figure 6.15 shows a histogram indicating which objects take up the most heap space in the JVM process.
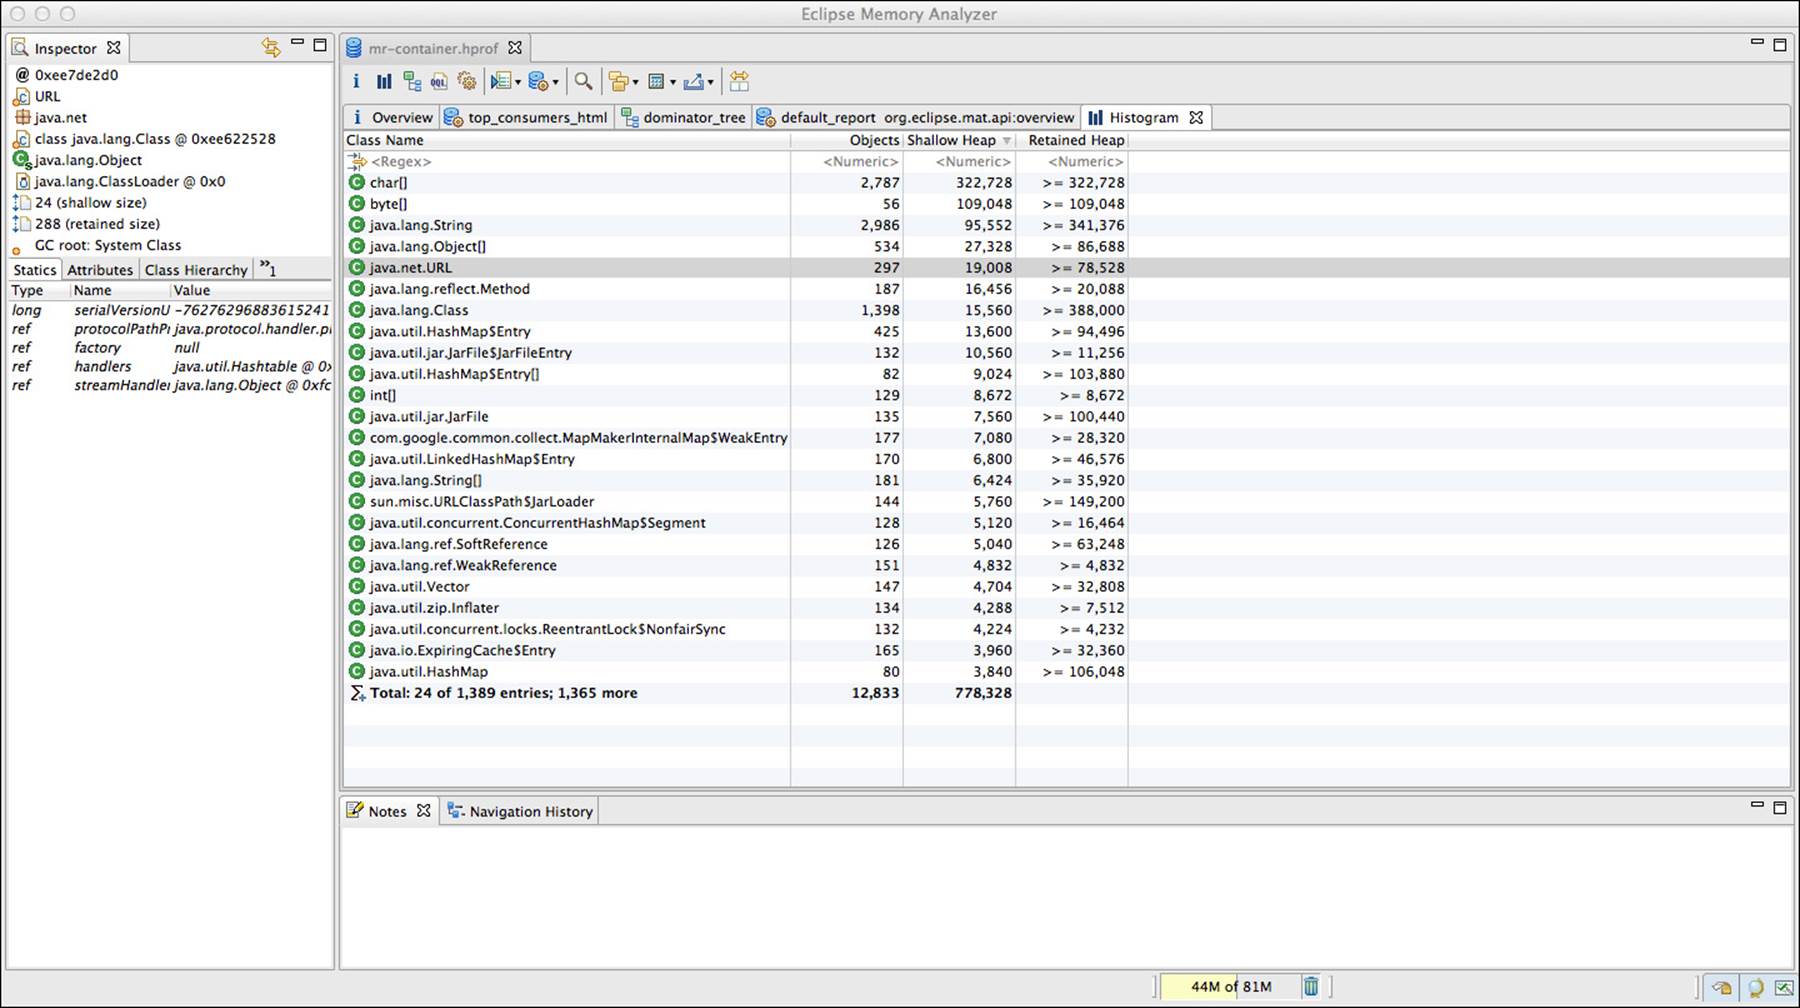
Figure 6.15 Eclipse Memory Analyzer histogram
When the Eclipse Memory Analyzer initially opens a heap dump file, it creates supplemental index files so that the dump file can be opened much more quickly during subsequent sessions. There is also an Object Query Language (OQL) window where we can query the heap dump for specific objects with specific values.
Analyzing JVM heap dumps is usually the last resort when you are trying to troubleshoot problematic Java processes; nevertheless, it’s a valuable skill for the advanced Hadoop and YARN administrator. It’s likely that you will want to monitor YARN container processes through Nagios and Ganglia with advanced scripting or programming, but when those methods fail to find answers, the ability to sift through a JVM heap dump can prove to be an invaluable skill.
Basic YARN Administration
As with Hadoop version 1, there are a multitude of configuration properties available to the administrators in Hadoop version 2. YARN has introduced and changed some configuration properties. The basic files are as follows:
![]() core-default.xml: System-wide properties
core-default.xml: System-wide properties
![]() hdfs-default.xml: Hadoop Distributed File System properties
hdfs-default.xml: Hadoop Distributed File System properties
![]() mapred-default.xml: Properties for the YARN MapReduce framework
mapred-default.xml: Properties for the YARN MapReduce framework
![]() yarn-default.xml: YARN properties.
yarn-default.xml: YARN properties.
You can find a complete list of properties for all these files at http://hadoop.apache.org/docs/current/ (look at the lower-left side of the page under “Configuration”). A full discussion of all options is beyond the scope of this book, but you can find comments and defaults for each of the properties on the Apache Hadoop site. There are, however, some important administrative tasks worth mentioning.
YARN Administrative Tools
YARN has several built-in administrative features. These can be found by examining the yarn rmadmin command-line utility’s description as shown in the following listing. Some of these options will be illustrated later.
# yarn rmadmin -help
rmadmin is the command to execute Map-Reduce administrative commands.
The full syntax is:
hadoop rmadmin [-refreshQueues] [-refreshNodes]
[-refreshSuperUserGroupsConfiguration] [-refreshUserToGroupsMappings]
[-refreshAdminAcls] [-refreshServiceAcl] [-getGroup [username]]
[-help [cmd]]
-refreshQueues: Reload the queues' acls, states, and scheduler-specific
properties. ResourceManager will reload the mapred-queues
configuration file.
-refreshNodes: Refresh the hosts information at the ResourceManager.
-refreshUserToGroupsMappings: Refresh user-to-groups mappings.
-refreshSuperUserGroupsConfiguration: Refresh superuser proxy groups
mappings.
-refreshAdminAcls: Refresh acls for administration of ResourceManager.
-refreshServiceAcl: Reload the service-level authorization policy file.
ResourceManager will reload the authorization
policy file.
-getGroups [username]: Get the groups which given user belongs to
-help [cmd]: Displays help for the given command or all commands
if none is specified.
Generic options supported are
-conf <configuration file> specify an application configuration file
-D <property=value> use value for given property
-fs <local|namenode:port> specify a namenode
-jt <local|jobtracker:port> specify a job tracker
-files <comma separated list of files> specify comma separated files to
be copied to the mapreduce
cluster
-libjars <comma separated list of jars> specify comma separated jar
files to include in the
class path.
-archives <comma separated list of archives> specify comma separated
archives to be unarchived
on the compute machines.
The general commandline syntax is:
bin/hadoop command [genericOptions] [commandOptions]
Adding and Decommissioning YARN Nodes
In typical installations, nodes play the roles of both HDFS data node and YARN worker node. The procedures for adding and decommissioning HDFS nodes can be found in Appendix F. The following discussion is limited to YARN worker nodes, which can be managed by running the ResourceManager admin client.
Adding new nodes requires that all the necessary software and configuration be loaded on the new node. The following technique can be used for both adding and decommissioning nodes. Two files dictate which nodes are to be accepted and which are not to be used:yarn.resourcemanager.nodes.include-path and yarn.resourcemanager.exclude-path. The first property points to a file with a list of nodes that are accepted by the ResourceManager, and the second property points to a file with a list of nodes that are explicitly deemed as either not acceptable by the ResourceManager or possibly running but removed/decommissioned from ResourceManager use. Both properties point to a local file system path on the ResourceManager node. They can have hostnames or IP addresses separated by a newline, space, or tab. Lines that start with the “#” character are treated as comments. Once the files are modified by the administrator (only administrators should have write permission to these files on the ResourceManager local file system for security reasons), the administrator can then run the following command to inform ResourceManager about the change in the nodes list:
# yarn rmadmin -refreshNodes
Only administrators can perform this task. Administrators are defined as users restricted by the admin-acl that is dictated by the configuration property yarn.admin.acl on the ResourceManager.
Capacity Scheduler Configuration
Detailed information on configuration of the Capacity scheduler can be found in Chapter 8, “Capacity Scheduler in YARN.” Queues can be reconfigured and added as described here.
Changing queue properties and adding new queues are very simple processes. You can use the configure-hadoop2.sh script, described previously, for this purpose, or you can directly edit $HADOOP_CONF_DIR/etc/hadoop/capacity-scheduler.xml file.
# yarn rmadmin -refreshQueues
Queues cannot be deleted at this point of time. Only addition of new queues is supported, and the updated queue configuration should be a valid one (i.e., the queue capacity at each level should be equal to 100%).
YARN WebProxy
The Web Application Proxy is a separate proxy server in YARN for managing security with the cluster web interface on ApplicationMasters. By default, the proxy is run as part of the Resource Manager itself, but it can be configured to run in a stand-alone mode by changing the configuration property yarn.web-proxy.address. Also by default, it is set to an empty string, which means it runs in the ResourceMaster. In a stand-alone mode, yarn.web-proxy.principal and yarn.web-proxy.keytab control the Kerberos principal name and the corresponding keytab for use in secure mode.
Using the JobHistoryServer
The removal of the JobTracker and migration of MapReduce from a system to an application-level framework necessitated creation of a place to store MapReduce job history. The JobHistoryServer allows all YARN MapReduce applications with a central location to aggregate completed jobs for historical reference and debugging. The settings for the JobHistoryServer can be found in the mapred-default.xml file.
Refreshing User-to-Groups Mappings
The hadoop.security.group.mapping property determines the user-to-group mappings that the ResourceManager uses. Such a class needs to implement the interface org.apache.hadoop.security.GroupMappingServiceProvider. The default value isorg.apache.hadoop.security.ShellBasedUnixGroupsMapping. This refresh operation needs to happen whenever a user is added to the system and whenever a user’s list of groups changes. Only cluster administrators can invoke this refresh:
# rmadmin -refreshUserToGroupsMapping
Refreshing Superuser Proxy Groups Mappings
The hadoop.proxyuser.<proxy-user-name>.groups property needs to be configured to allow the user $proxy-user-name to be treated as a special privileged user who can impersonate any other users who are members of the value of this property. The value can be a comma-separated list of groups. The value of hadoop.proxyuser.<proxy-user-name>.hosts can be a comma-separated list of hosts from which $proxy-user-name can be restricted to do the previously mentioned user impersonation. Once either of these configurations is changed, administrators will have to refresh the ResourceManager:
# yarn rmadmin -refreshSuperUserGroupsConfiguration
The $proxy-user-name noted previously can, therefore, perform the impersonation only to specific users (who are members of the previous groups) and only from specific hosts. This super-user itself also must be authenticated using Kerberos at the time of such impersonation.
Refreshing ACLs for Administration of ResourceManager
The yarn.admin.acl property specifies the Access Control Lists (ACLs) indicating who can be an administrator of the YARN cluster. A cluster administrator has special privileges to refresh queues, node lists, user-group mappings, the admin list itself, and service-level ACLs. This administrator can also view any user’s applications, access all web interfaces, invoke any web services, and kill any application in any queue. The value of this configuration property is a comma-separated list of users and groups. The user list comes first (comma separated) and is separated by a space, followed by the list of groups—for example, “user1,user2 group1,group2”. Whenever this property changes, administrators must refresh the ResourceManager as follows:
# yarn rmadmin -refreshAdminAcls
Reloading the Service-level Authorization Policy File
The administrator may also have to reload the authorization policy file using the following command:
# yarn rmadmin -refreshServiceAcl
Managing YARN Jobs
YARN jobs can be managed using the “yarn application” command. The following options, including -kill, -list, and -status are available to the administrator with this command. MapReduce jobs can also be controlled with the “mapred job” command.
usage: application
-appTypes <Comma-separated list of application types> Works with
--list to filter applications based on
their type.
-help Displays help for all commands.
-kill <Application ID> Kills the application.
-list Lists applications from the RM. Supports optional
use of –appTypes to filter applications based
on application type.
-status <Application ID> Prints the status of the application.
Setting Container Memory
Controlling container memory takes place through three important values in the yarn-site.xml file:
![]() yarn.nodemanager.resource.memory-mb is the amount of memory the NodeManager can use for containers.
yarn.nodemanager.resource.memory-mb is the amount of memory the NodeManager can use for containers.
![]() yarn.scheduler.minimum-allocation-mb is the smallest container allowed by the ResourceManager. A requested container smaller than this value will result in an allocated container of this size (default 1024 MB).
yarn.scheduler.minimum-allocation-mb is the smallest container allowed by the ResourceManager. A requested container smaller than this value will result in an allocated container of this size (default 1024 MB).
![]() yarn.scheduler.maximum-allocation-mb is the largest container allowed by the ResourceManager (default 8192 MB).
yarn.scheduler.maximum-allocation-mb is the largest container allowed by the ResourceManager (default 8192 MB).
Setting Container Cores
It is possible to set the number of cores for containers using the following properties in the yarn-stie.xml:
![]() yarn.scheduler.minimum-allocation-vcores is the minimum number of cores a container can be requested to have.
yarn.scheduler.minimum-allocation-vcores is the minimum number of cores a container can be requested to have.
![]() yarn.scheduler.maximum-allocation-vcores is the maximum number of cores a container can be requested to have.
yarn.scheduler.maximum-allocation-vcores is the maximum number of cores a container can be requested to have.
![]() yarn.nodemanager.resource.cpu-vcores is the number of cores that containers can request from this node.
yarn.nodemanager.resource.cpu-vcores is the number of cores that containers can request from this node.
Setting MapReduce Properties
Since MapReduce now runs as a YARN application, it may be necessary to adjust some of the mapred-site.xml properties as they relate to the map and reduce containers. The following properties are used to set some Java arguments and memory size for both the map and reduce containers:
![]() mapred.child.java.opts provides a larger or smaller heap size for child JVMs of maps (e.g., --Xmx2048m).
mapred.child.java.opts provides a larger or smaller heap size for child JVMs of maps (e.g., --Xmx2048m).
![]() mapreduce.map.memory.mb provides a larger or smaller resource limit for maps (default = 1536 MB)
mapreduce.map.memory.mb provides a larger or smaller resource limit for maps (default = 1536 MB)
![]() mapreduce.reduce.memory.mb provides a resource-limit for child JVMs of maps (default = 3072 MB)
mapreduce.reduce.memory.mb provides a resource-limit for child JVMs of maps (default = 3072 MB)
![]() mapreduce.reduce.java.opts provides a larger or smaller heap size for child reducers.
mapreduce.reduce.java.opts provides a larger or smaller heap size for child reducers.
User Log Management
User logs of Hadoop jobs serve multiple purposes. First and foremost, they can be used to debug issues that occur while running a MapReduce application, including correctness problems with the application itself, race conditions when running on a cluster, and debugging task/job failures due to hardware or platform bugs. Second, one can do historical analyses of the logs to see how individual tasks in jobs or workflows perform over time. One can even analyze the Hadoop MapReduce user logs with Hadoop MapReduce to determine any performance issues.
Handling of user logs generated by applications has been one of the biggest pain points for Hadoop installations in the past. In Hadoop version 1, user logs are left on individual nodes by the TaskTracker, and the management of the log files on local nodes is both insufficient for longer-term analyses and non-deterministic for user access. YARN tackles this log management issue by having the NodeManagers provide the option of moving these logs securely onto HDFS after the application completes.
Log Aggregation in YARN
With YARN, logs for all the containers that belong to a single application and that ran on a given NodeManager are aggregated and written out to a single (possibly compressed) log file at a configured location in the designated file system. In the current implementation, once an application finishes, one will have an application-level log directory and a per-node log file that consists of logs for all the containers of the application that ran on this node.
With Hadoop version 2, users can gain access to these logs via YARN command-line tools, through the web UI, or directly from the file system. These logs potentially can be stored for much longer times than was possible in Hadoop version 1 because they reside within a large distributed file system. Hadoop version 2 does not need to truncate logs to very small lengths (as long as the log sizes are reasonable) and can afford to store the entire logs for longer periods of time. In addition, while the containers are running, the logs are written to multiple directories on each node for effective load balancing and improved fault tolerance. In addition, an AggregatedLogDeletionService service periodically deletes aggregated logs; currently, it runs only inside the MapReduce JobHistoryServer.
Web User Interface
On the web interfaces, log aggregation is completely hidden from the user. While a MapReduce application is running, users can see the logs from the ApplicationMaster UI, which redirects the user to the NodeManager UI. Once an application finishes, the completed information is owned by the MapReduce JobHistoryServer, which again serves user logs transparently.
Command-Line Access
In addition to the web UI, a command-line utility can be used to interact with logs. The usage option can be listed by running the following:
$ yarn logs
Retrieve logs for completed YARN applications.
usage: yarn logs -applicationId <application ID> [OPTIONS]
general options are:
-appOwner <Application Owner> AppOwner (assumed to be current user if
not specified)
-containerId <Container ID> ContainerId (must be specified if node
address is specified)
-nodeAddress <Node Address> NodeAddress in the format nodename:port
(must be specified if container ID is specified)
For example, to print all the logs for a given application, one can simply enter the following line:
$ yarn logs -applicationId <application ID>
Logs of only one specific container can be printed using the following command:
yarn logs -applicationId <application ID> -containerId <Container ID> \
-nodeAddress <Node Address>
The obvious advantage with the command-line utility is that now you can use the regular shell utilities to help process files.
Log Administration and Configuration
The general log-related configuration properties are yarn.nodemanager.log-dirs and yarn.log-aggregation-enable. The function of each is described next.
The yarn.nodemanager.log-dirs property determines where the container logs are stored on the node when the containers are running. Its default value is ${yarn.log.dir}/userlogs. An application’s localized log directory will be found in{yarn.nodemanager.log-dirs}/application_${appid}. Individual containers’ log directories will be below this level, in subdirectories named container_{$containerId}.
For MapReduce applications, each container directory will contain the files stderr, stdin, and syslog generated by that container. Other frameworks can choose to write more or fewer files—YARN doesn’t dictate the file names and number of files.
The yarn.log-aggregation-enable property specifies whether to enable or disable log aggregation. If this function is disabled, NodeManagers will keep the logs locally (as in Hadoop version 1) and not aggregate them.
The following properties are in force when log aggregation is enabled:
![]() yarn.nodemanager.remote-app-log-dir: This location is found on the default file system (usually HDFS) and indicates where the NodeManagers should aggregate logs. It should not be the local file system, because otherwise serving daemons such as the history server will not able to serve the aggregated logs. The default value is /tmp/logs.
yarn.nodemanager.remote-app-log-dir: This location is found on the default file system (usually HDFS) and indicates where the NodeManagers should aggregate logs. It should not be the local file system, because otherwise serving daemons such as the history server will not able to serve the aggregated logs. The default value is /tmp/logs.
![]() yarn.nodemanager.remote-app-log-dir-suffix: The remote log directory will be created at {yarn.nodemanager.remote-app-log-dir}/${user}/{suffix}. The default suffix value is “logs”.
yarn.nodemanager.remote-app-log-dir-suffix: The remote log directory will be created at {yarn.nodemanager.remote-app-log-dir}/${user}/{suffix}. The default suffix value is “logs”.
![]() yarn.log-aggregation.retain-seconds: This property defines how long to wait before deleting aggregated logs; –1 or another negative number disables the deletion of aggregated logs. Be careful not to set this property to a too-small value so as to not burden the distributed file system.
yarn.log-aggregation.retain-seconds: This property defines how long to wait before deleting aggregated logs; –1 or another negative number disables the deletion of aggregated logs. Be careful not to set this property to a too-small value so as to not burden the distributed file system.
![]() yarn.log-aggregation.retain-check-interval-seconds: This property determines how long to wait between aggregated log retention checks. If its value is set to 0 or a negative value, then the value is computed as one-tenth of the aggregated log retention time. As with the previous configuration property, be careful not to set it to an inordinately low value. The default is –1.
yarn.log-aggregation.retain-check-interval-seconds: This property determines how long to wait between aggregated log retention checks. If its value is set to 0 or a negative value, then the value is computed as one-tenth of the aggregated log retention time. As with the previous configuration property, be careful not to set it to an inordinately low value. The default is –1.
![]() yarn.log.server.url: Once an application is done, NodeManagers redirect the web UI users to this URL, where aggregated logs are served. Today it points to the MapReduce-specific JobHistory.
yarn.log.server.url: Once an application is done, NodeManagers redirect the web UI users to this URL, where aggregated logs are served. Today it points to the MapReduce-specific JobHistory.
The following properties are used when log aggregation is disabled:
![]() yarn.nodemanager.log.retain-seconds: The time in seconds to retain user logs on the individual nodes if log aggregation is disabled. The default is 10800.
yarn.nodemanager.log.retain-seconds: The time in seconds to retain user logs on the individual nodes if log aggregation is disabled. The default is 10800.
![]() yarn.nodemanager.log.deletion-threads-count: The number of threads used by the NodeManagers to clean up logs once the log retention time is hit for local log files when aggregation is disabled.
yarn.nodemanager.log.deletion-threads-count: The number of threads used by the NodeManagers to clean up logs once the log retention time is hit for local log files when aggregation is disabled.
Log Permissions
The remote root log directory is expected to have the permissions 1777 with ${NMUser} as owner and to be directory- and group-owned by ${NMGroup} (i.e., the group to which NMUser belongs).
Each application-level directory will be created with permission 770, but will be user-owned by the application submitter and group-owned by ${NMGroup}. This feature allows application submitters to access aggregated logs for their own use; ${NMUser} can access or modify the files for log management. Also, ${NMGroup}* should be a limited-access group so that there are no access leaks.
Wrap-up
Administering YARN is not that different from administering a Hadoop 1 installation where many of the parameters are set in the system-wide Hadoop XML files. Both bash scripts and the Ambari interface can be used to easily modify and (if necessary) restart the entire Hadoop system.
Cluster-wide monitoring is important, and Nagios alerts and Ganglia real-time metrics can be important tools for the Hadoop administrator. The fully integrated Ambari tool provides a single interface to manage the entire cluster. As it develops further, Ambari should become the standard method for Hadoop administration.
To truly understand YARN cluster administration, it’s helpful to have not only a basic understanding of the configuration properties for YARN itself, but also an understanding of the JVM processes on your servers. Several open-source tools exist that can provide insights into Hadoop Java processes.
All materials on the site are licensed Creative Commons Attribution-Sharealike 3.0 Unported CC BY-SA 3.0 & GNU Free Documentation License (GFDL)
If you are the copyright holder of any material contained on our site and intend to remove it, please contact our site administrator for approval.
© 2016-2026 All site design rights belong to S.Y.A.