Hadoop in Practice, Second Edition (2015)
Part 3. Big data patterns
Chapter 8. Tuning, debugging, and testing
This chapter covers
· Measuring and tuning MapReduce execution times
· Debugging your applications
· Testing tips to improve the quality of your code
Imagine you’ve written a new piece of MapReduce code, and you’re executing it on your shiny new cluster. You’re surprised to learn that despite having a good-sized cluster, your job is running significantly longer than you expected. You’ve obviously hit a performance issue with your job, but how do you figure out where the problem lies?
This chapter starts out by reviewing common performance problems in Map-Reduce, such as the lack of data locality and running with too many mappers. This tuning section also examines some enhancements that you can make to your jobs to increase their efficiency by using binary comparators in the shuffle phase and using a compact data format to minimize parsing and data transfer times.
The second part of this chapter covers some tips that will help you debug your applications, including instructions on how to access YARN container startup scripts, and some suggestions on how to design your MapReduce jobs to aid future debugging efforts.
The final section looks at how to provide adequate unit testing for MapReduce code and examines some defensive coding techniques you can use to minimize badly behaving code. All the preparation and testing in the world can’t guarantee that you won’t encounter any problems, and in case you do, we’ll look at how you can debug your job to figure out what went wrong.
Hadoop 2
The techniques in this chapter work with Hadoop 2. Due to incompatibilities across major Hadoop versions, some of these techniques won’t work with earlier versions.
8.1. Measure, measure, measure
Before you can start performance tuning, you need to have the tools and processes in place to capture system metrics. These tools will help you gather and examine empirical data related to your application and determine whether or not you’re suffering from a performance problem.
In this section we’ll look at the tools and metrics that Hadoop provides, and we’ll also touch on monitoring as an additional tool in your performance-tuning toolkit.
It’s important to capture the CPU, memory, disk, and network utilization of your cluster. If possible, you should also capture MapReduce (or any other YARN application) statistics. Having historical and current metrics for your cluster will allow you to view anomalies in both hardware and software, and to correlate them against any other observations that may point to your work not proceeding at expected rates.
Ultimately, the goal is to ensure that you aren’t over-utilizing or under-utilizing your hardware. If you’re over-utilizing your hardware, your systems are likely spending a considerable amount of time competing for resources, be it CPU context-switching or memory page-swapping. Under-utilization of your cluster means you’re not getting all that you can from your hardware.
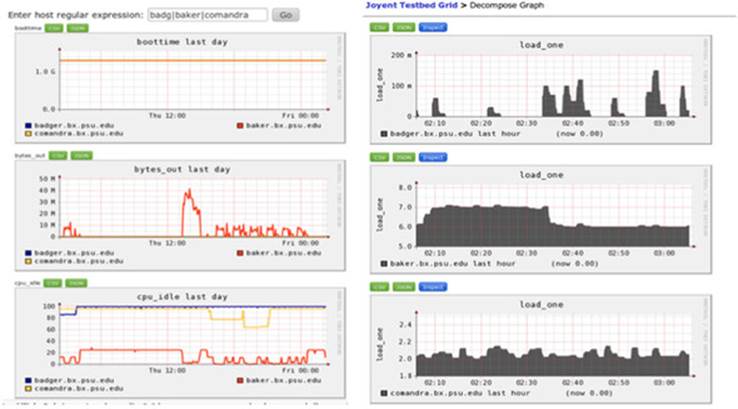
Luckily there are a number of tools available to help you monitor your cluster, ranging from sar, the built-in Linux utility that collects and reports on system activity,[1] to more sophisticated tools such as Nagios and Ganglia. Nagios (http://www.nagios.org/) and Ganglia (http://ganglia.sourceforge.net/) are both open source projects designed to monitor your infrastructure, and Ganglia in particular provides a rich user interface with useful graphs, some of which can be seen in figure 8.1. Ganglia has the added advantage of being able to pull statistics from Hadoop.[2]
1 This IBM article discusses using sar and gnuplot to generate system-activity graphs: David Tansley, “Using gnuplot to display data in your Web pages,” http://www.ibm.com/developerworks/aix/library/au-gnuplot/index.html.
2 The Hadoop wiki has basic instructions on Ganglia and Hadoop integration: GangliaMetrics, http://wiki.apache.org/hadoop/GangliaMetrics.
Figure 8.1. Ganglia screenshots showing CPU utilization for multiple hosts
If you’re using a commercial Hadoop distribution, it was likely bundled with management user interfaces that include monitoring. If you’re using the Apache Hadoop distribution, you should be using Apache Ambari, which simplifies provisioning, management, and monitoring of your cluster. Ambari uses Ganglia and Nagios behind the scenes.
With your monitoring tools in place, it’s time to take a look at how to tune and optimize your MapReduce jobs.
8.2. Tuning MapReduce
In this section we’ll cover common issues that impact the performance of MapReduce jobs and look at how you can address these issues. Along the way, I’ll also point out some best practices to help you optimize your jobs.
We’ll start by looking at some of the more common issues that hamper Map-Reduce job performance.
8.2.1. Common inefficiencies in MapReduce jobs
Before we delve into the techniques, let’s take a high-level look at a MapReduce job and identify the various areas that can impact its performance. Take a look at figure 8.2.
Figure 8.2. Inefficiencies that can occur in various parts of a MapReduce job
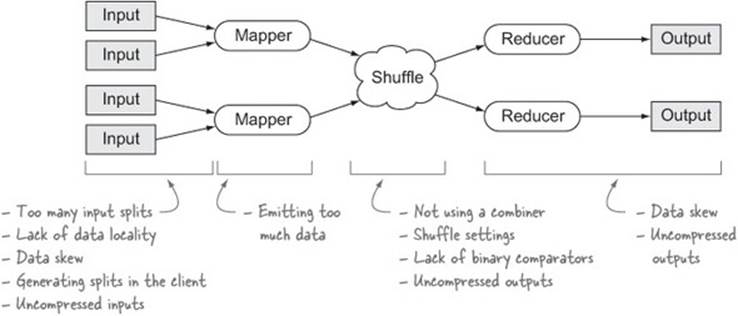
The rest of this section on performance tuning covers the issues identified in figure 8.2. But before we start tuning, we need to look at how you can easily get access to job statistics, which will help you identify areas in need of tuning.
Technique 72 Viewing job statistics
The first port of call when evaluating the performance of a MapReduce job is the metrics that Hadoop measures for your job. In this technique you’ll learn how to access these metrics.
Problem
You want to access the metrics for a MapReduce job.
Solution
Use the JobHistory UI, the Hadoop CLI, or a custom utility.
Discussion
MapReduce collects various system and job counters for each job and persists them in HDFS. You can extract these statistics in two different ways:
· Use the JobHistory UI.
· Use the Hadoop command-line interface (CLI) to view job and task counters and other metrics from the job history.
Job-history retention
The job history is kept around for one week by default. This can be altered by updating mapreduce.jobhistory.max-age-ms.
Let’s examine both of these tools, starting with the JobHistory UI.
JobHistory
In Hadoop 2, JobHistory is a MapReduce-specific service that gathers metrics from completed MapReduce jobs and provides a user interface for viewing them.[3] Figure 8.3 shows how you can access the job statistics in the JobHistory UI.
3 Chapter 2 contains details on how to access the JobHistory user interface.
Figure 8.3. Accessing job counters in the JobHistory UI
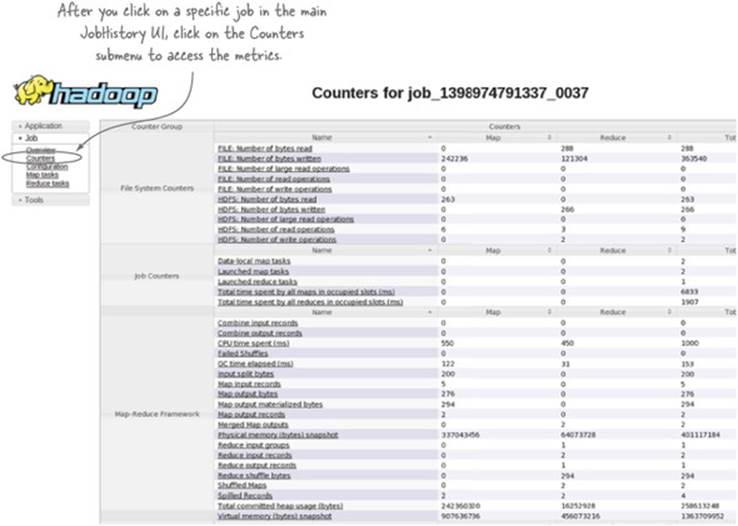
This screen shows you the aggregated metrics for map tasks, reduce tasks, and across all the tasks. In addition, each metric allows you to drill down into all the tasks that reported that metric. Within each metric-specific screen, you can sort by the metric values to quickly identify tasks that exhibit unusually high or low metric values.
Metrics improvements in Hadoop 2
Hadoop 2 improved the job metrics by adding CPU, memory, and garbage collection statistics, so you can get a good sense of the system utilization of each process.
All is not lost if you can’t access the JobHistory UI, as you can also access the data via the Hadoop CLI.
Accessing the job history with the CLI
The job history output is stored in the directory specified by the configurable mapreduce.jobhistory.done-dir, the default location being /tmp/hadoop-yarn/staging/history/done/ for Apache Hadoop.[4] Within this directory, jobs are partitioned by the job submission date. If you know your job ID, you can search for your directory:
4 Non-Apache Hadoop distributions may have a customized value for mapreduce.jobhistory.done-dir—for example, in CDH this directory is /user/history/done.
$ hadoop fs -lsr /tmp/hadoop-yarn/staging/history/done/ \
| grep job_1398974791337_0037
One of the files returned from this command should be a file with a .jhist suffix, which is the job history file. Use the fully qualified path of this file with the Hadoop history command to view your job history details:
$ hadoop job -history <history file>
Hadoop job: job_1398974791337_0037
=====================================
User: aholmes
JobName: hip-2.0.0.jar
JobConf: hdfs://localhost:8020/tmp/hadoop-yarn/...
Submitted At: 11-May-2014 13:06:48
Launched At: 11-May-2014 13:07:07 (19sec)
Finished At: 11-May-2014 13:07:17 (10sec)
Status: SUCCEEDED
Counters:
|Group Name |Counter name |Map Value |Reduce |Total |
-----------------------------------------------------------------------
|File System |FILE: Number of bytes read |0 |288 |288
|File System |FILE: Number of bytes written |242,236 |121,304 |363,540
|File System |FILE: Number of read operations |0 |0 |0
|File System |FILE: Number of write operations|0 |0 |0
...
Task Summary
============================
Kind Total Successful Failed Killed StartTime FinishTime
Setup 0 0 0 0
Map 2 2 0 0 11-May-2014 13:07:09 11-May-2014 13:07:13
Reduce 1 1 0 0 11-May-2014 13:07:15 11-May-2014 13:07:17
============================
Analysis
=========
Time taken by best performing map task task_1398974791337_0037_m_000001:
3sec
Average time taken by map tasks: 3sec
Worse performing map tasks:
TaskId Timetaken
task_1398974791337_0037_m_000000 3sec
task_1398974791337_0037_m_000001 3sec
The last map task task_1398974791337_0037_m_000000 finished at
(relative to the Job launch time): 11-May-2014 13:07:13 (5sec)
Time taken by best performing shuffle task
task_1398974791337_0037_r_000000: 1sec
Average time taken by shuffle tasks: 1sec
Worse performing shuffle tasks:
TaskId Timetaken
task_1398974791337_0037_r_000000 1sec
The last shuffle task task_1398974791337_0037_r_000000 finished at
(relative to the Job launch time): 11-May-2014 13:07:17 (9sec)
Time taken by best performing reduce task
task_1398974791337_0037_r_000000: 0sec
Average time taken by reduce tasks: 0sec
Worse performing reduce tasks:
TaskId Timetaken
task_1398974791337_0037_r_000000 0sec
The last reduce task task_1398974791337_0037_r_000000 finished at
(relative to the Job launch time): 11-May-2014 13:07:17 (10sec)
=========
The previous output is only a small subset of the overall output produced by the command, and it’s worth executing it yourself to see the full metrics it exposes. This output is useful in quickly evaluating metrics such as average- and worst-task execution times.
Both the JobHistory UI and the CLI can be used to identify a number of performance issues in your job. As we go through the techniques in this section, I’ll highlight how the job history counters can be used to help identify issues.
Let’s get things moving by looking at the optimizations that can be made on the map side.
8.2.2. Map optimizations
Optimizations in the map side of a MapReduce job are usually related to the input data and how it’s being processed, or to your application code. Your mappers are responsible for reading the job inputs, so variables such as whether your input files are splittable, data locality, and the number of input splits all can have an impact on the performance of your job. Inefficiencies in your mapper code can also lead to longer-than-expected job execution times.
This section covers some of the data-related issues that your job could encounter. The application-specific issues are covered in section 8.2.6.
Technique 73 Data locality
One of MapReduce’s biggest performance traits is the notion of “pushing compute to the data,” which means that map tasks are scheduled so that they read their inputs from local disk. Data locality isn’t guaranteed, however, and your file formats and cluster utilization can impact data locality. In this technique you’ll learn how to identify indications of lack of locality, and also learn about some solutions.
Problem
You want to detect whether you have map tasks that are reading inputs over the network.
Solution
Examine some key counters in the job history metadata.
Discussion
There are a number of counters in the job history that you should keep an eye on to make sure data locality is in play in your mappers. These are listed in table 8.1.
Table 8.1. Counters that can indicate if nonlocal reads are occurring
|
Counter name |
JobHistory name |
You may have nonlocal reads if ... |
|
HDFS_BYTES_READ |
HDFS: Number of bytes read |
... this number is greater than the block size of the input file. |
|
DATA_LOCAL_MAPS |
Data-local map tasks |
... any map tasks have this value set to 0. |
|
RACK_LOCAL_MAPS |
Rack-local map tasks |
... any map tasks have this value set to 1. |
There could be a number of causes for non-local reads:
· You’re working with large files and a file format that can’t be split, which means that mappers need to stream some of the blocks from other data nodes.
· The file format supports splitting, but you’re using an input format that doesn’t support splitting. An example of this is using LZOP to compress a text file and then using TextInputFormat, which doesn’t know how to split the file.
· The YARN scheduler wasn’t able to schedule the map container to a node. This can happen if your cluster is under load.
There are a few options you can consider to address the problems:
· When using an unsplittable file format, write files at or near the HDFS block size to minimize nonlocal reads.
· If you’re using the capacity scheduler, set yarn.scheduler.capacity.node-locality-delay to introduce more delay in the scheduler and thus increase the chance that a map task is scheduled onto a data-local node.
· If you’re using text files, switch to a compression codec that supports splitting, such as LZO or bzip2.
Next let’s look at another data-related optimization that comes into play when you’re working with large datasets.
Technique 74 Dealing with a large number of input splits
Jobs with a large number of input splits are not optimal, because each input split is executed by a single mapper, and each mapper executes as a single process. The aggregate pressure on the scheduler and the cluster due to forking these processes results in slow job execution times. This technique examines some methods that can be used to reduce the number of input splits and still maintain data locality.
Problem
You want to optimize a job that runs with thousands of mappers.
Solution
Use the CombineFileInputFormat to combine multiple blocks that are run with fewer mappers.
Discussion
There are two primary issues that will cause a job to require a large number of mappers:
· Your input data consists of a large number of small files. The total size of all these files may be small, but MapReduce will spawn a mapper for each small file, so your job will spend more time launching processes than it will actually processing the input data.
· Your files aren’t small (they’re close to, or over, the HDFS block size), but your aggregate data size is large and spans thousands of blocks in HDFS. Each block is assigned to an individual mapper.
If your problem is related to small files, you should consider compacting these files together or using a container format such as Avro to store your files.
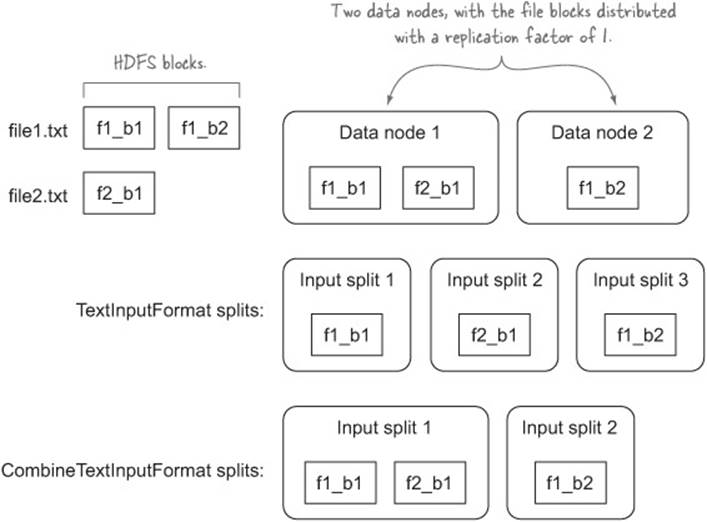
In either of the preceding situations, you can use the CombineFileInputFormat, which will combine multiple blocks into input splits to reduce the overall number of input splits. It does so by examining all the blocks that are occupied by the input files, mapping each block to the set of data nodes that stores it, and then combining blocks that exist on the same data node into a single input split to preserve data locality. There are two concrete implementations of this abstract class:
· CombineTextInputFormat works with text files and uses TextInputFormat as the underlying input format to process and emit records to the mappers.
· CombineSequenceFileInputFormat works with SequenceFiles.
Figure 8.4 compares the splits generated by TextInputFormat with those generated by CombineTextInputFormat.
Figure 8.4. An example of how CombineTextInputFormat works with the default size settings
There are some configurables that allow you to tune how input splits are composed:
· mapreduce.input.fileinputformat.split.minsize.per.node —Specifies the minimum number of bytes that each input split should contain within a data node. The default value is 0, meaning that there is no minimum size.
· mapreduce.input.fileinputformat.split.minsize.per.rack —Specifies the minimum number of bytes that each input split should contain within a single rack. The default value is 0, meaning that there is no minimum size.
· mapreduce.input.fileinputformat.split.maxsize —Specifies the maximum size of an input split. The default value is 0, meaning that there is no maximum size.
With the default settings, you’ll end up with a maximum of one input split for each data node. Depending on the size of your cluster, this may hamper your parallelism, in which case you can play with mapreduce.input.fileinputformat.split.maxsize to allow more than one split for a node.
If the input files for a job are significantly smaller than the HDFS block size, it’s likely that your cluster will spend more effort starting and stopping Java processes than it spends performing work. If you’re suffering from this problem, you should consult chapter 4, where I explained various approaches you can take to working efficiently with small files.
Technique 75 Generating input splits in the cluster with YARN
If the client that submits MapReduce jobs is not in a network that’s local to your Hadoop cluster, then input split calculation can be expensive. In this technique you’ll learn how to push the input split calculation to the MapReduce ApplicationMaster.
Only on YARN
This technique only works with YARN.
Problem
Your client is remote and input split calculation is taking a long time.
Solution
Set yarn.app.mapreduce.am.compute-splits-in-cluster to true.
Discussion
By default, input splits are calculated in the MapReduce driver. When the input source is HDFS, then the input format needs to perform operations such as file listings and file status commands to retrieve block details. When working with a large number of input files, this can be slow, especially when there’s network latency between the driver and the Hadoop cluster.
The solution is to set yarn.app.mapreduce.am.compute-splits-in-cluster to true, pushing the input split calculation to the MapReduce ApplicationMaster, which runs inside the Hadoop cluster. This minimizes the time taken to calculate input splits and thus reduces your overall job execution time.
Emitting too much data from your mappers
Outputting a lot of data from your mappers is to be avoided if possible, because all of that emitted data results in a lot of disk and network I/O as a result of the shuffle. You can use filters and projections in your mappers to cut down on the amount of data that you’re working with, and spilling, in MapReduce. Pushdowns can further improve your data pipeline. Technique 55 contains examples of filters and pushdowns.
8.2.3. Shuffle optimizations
The shuffle in MapReduce is responsible for organizing and delivering your mapper outputs to your reducers. There are two parts to the shuffle: the map side and the reduce side. The map side is responsible for partitioning and sorting data for each reducer. The reduce side fetches data from each mapper and merges it before supplying it to the reducer.
As a result there are optimizations you can perform on both sides of the shuffle, including writing a combiner, which is covered in the first technique.
Technique 76 Using the combiner
The combiner is a powerful mechanism that aggregates data in the map phase to cut down on data sent to the reducer. It’s a map-side optimization, where your code is invoked with a number of map output values for the same output key.
Problem
You’re filtering and projecting your data, but your shuffle and sort are still taking longer than you want. How can you cut down on them even further?
Solution
Define a combiner and use the setCombinerClass method to set it for your job.
Discussion
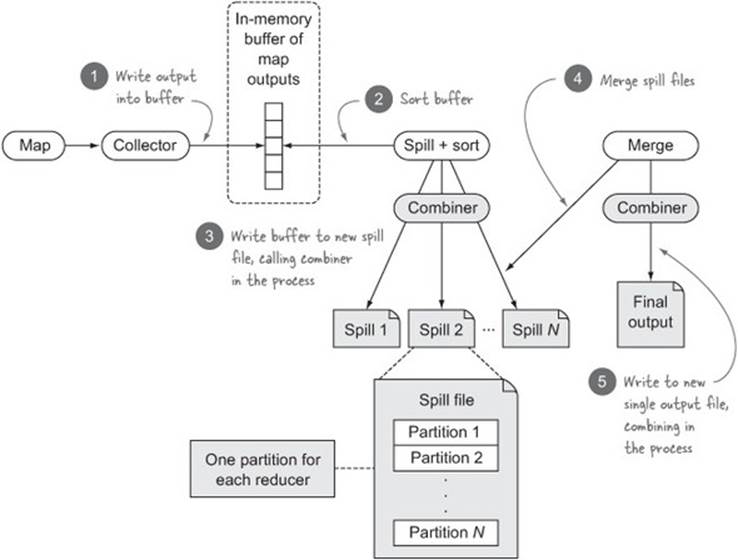
The combiner is invoked on the map side as part of writing map output data to disk in both the spill and merge phases, as shown in figure 8.5. To help with grouping values together to maximize the effectiveness of a combiner, use a sorting step in both phases prior to calling the combiner function.
Figure 8.5. How the combiner is called in the context of the map task
Calling the setCombinerClass sets the combiner for a job, similar to how the map and reduce classes are set:
job.setCombinerClass(Combine.class);
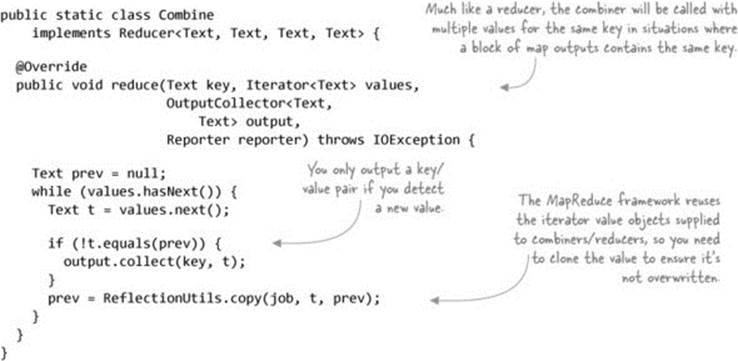
Your combiner implementation must conform to the reducer specification. In this technique you’ll write a simple combiner whose job is to remove duplicate map output records. As you iterate over the map output values, you’ll only emit those that are contiguously unique:[5]
5 GitHub source: https://github.com/alexholmes/hiped2/blob/master/src/main/java/hip/ch8/CombineJob.java.
It’s important that if you have a combiner, the function is distributive. In figure 8.5 you saw that the combiner will be called multiple times for the same input key, and there are no guarantees about how the output values will be organized when they’re sent to the combiner (other than that they were paired with the combiner key). A distributive function is one where the end result is identical regardless of how inputs were combined.
Summary
The combiner is a powerful tool in your MapReduce toolkit, as it helps cut down on the amount of data transmitted over the network between mappers and reducers. Binary comparators are another tool that will improve the execution times of your MapReduce jobs, and we’ll examine them next.
Technique 77 Blazingly fast sorting with binary comparators
When MapReduce is sorting or merging, it uses the RawComparator for the map output key to compare keys. Built-in Writable classes (such as Text and IntWritable) have byte-level implementations that are fast because they don’t require the byte form of the object to be unmarshaled to Object form for the comparison.
When writing your own Writable, it may be tempting to implement the Writable-Comparable interface, but this can lead to longer shuffle and sort phases because it requires Object unmarshaling from byte form for comparisons.
Problem
You have custom Writable implementations and you want to reduce the sort times for your jobs.
Solution
Write a byte-level comparator to ensure optimal comparisons during sorting.
Discussion
In MapReduce there are multiple stages where output keys are compared to each other when data is being sorted. To facilitate key sorting, all map output keys must implement the WritableComparable interface:
public interface WritableComparable<T>
extends Writable, Comparable<T> {
}
In the PersonWritable you created in technique 64 (when implementing a secondary sort), your implementation was as follows: [6]
6 GitHub source: https://github.com/alexholmes/hiped2/blob/master/src/main/java/hip/ch6/sort/secondary/Person.java.
public class Person implements WritableComparable<Person> {
private String firstName;
private String lastName;
@Override
public int compareTo(Person other) {
int cmp = this.lastName.compareTo(other.lastName);
if (cmp != 0) {
return cmp;
}
return this.firstName.compareTo(other.firstName);
}
...
The trouble with this Comparator is that MapReduce stores your intermediary map output data in byte form, and every time it needs to sort your data it has to unmarshal it into Writable form to perform the comparison. This unmarshaling is expensive because it re-creates your objects for comparison purposes.
If you look at the built-in Writables in Hadoop, you’ll see that not only do they extend the WritableComparable interface, but they also provide their own custom Comparator that extends the WritableComparator class. The following code presents a subsection of theWritableComparator class:
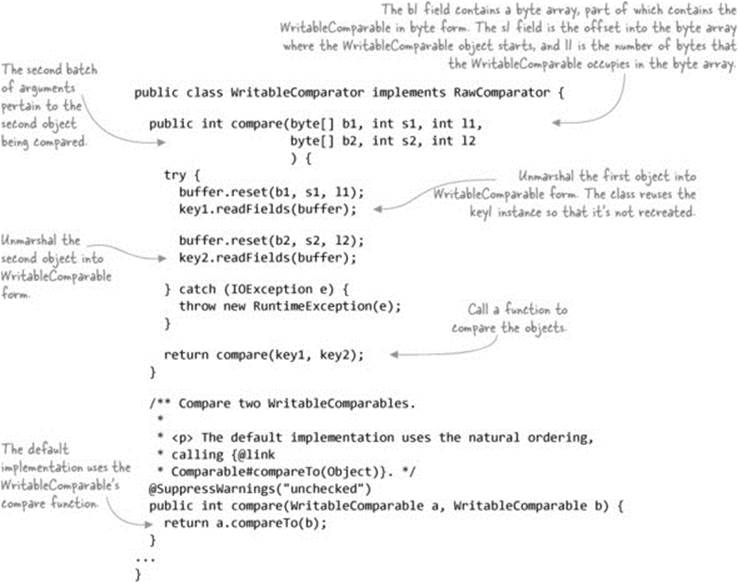
To write a byte-level Comparator, the compare method needs to be overridden. Let’s look at how the IntWritable class implements this method:
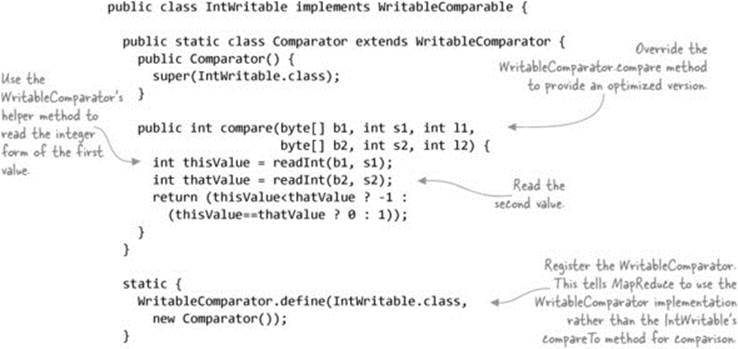
The built-in Writable classes all provide WritableComparator implementations, which means you don’t need to worry about optimizing the Comparators as long as your MapReduce job output keys use these built-in Writables. But if you have a custom Writable that you use as an output key, you’ll ideally provide a WritableComparator. We’ll now revisit your Person class and look at how you can do this.
In your Person class, you had two fields: the first and last names. Your implementation stored them as strings and used the DataOutput’s writeUTF method to write them out:
private String firstName;
private String lastName;
@Override
public void write(DataOutput out) throws IOException {
out.writeUTF(lastName);
out.writeUTF(firstName);
}
The first thing you need to understand is how your Person object is represented in byte form, based on the previous code. The writeUTF method writes two bytes containing the length of the string, followed by the byte form of the string. Figure 8.6 shows how this information is laid out in byte form.
Figure 8.6. Byte layout of Person
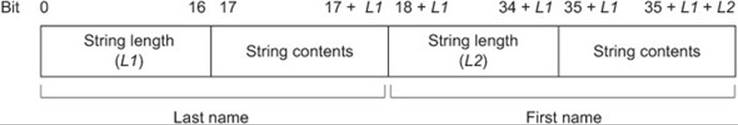
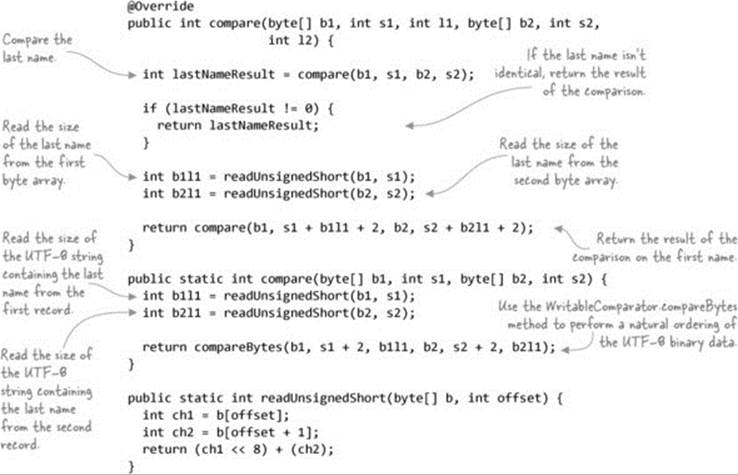
You want natural ordering of your records that include both the last and first names, but you can’t do this directly using the byte array because the string lengths are also encoded in the array. Instead, the Comparator needs to be smart enough to skip over the string lengths. The following code shows how to do this:[7]
7 GitHub source: https://github.com/alexholmes/hiped2/blob/master/src/main/java/hip/ch8/Person-BinaryComparator.java.
Summary
The writeUtf method is limited because it can only support strings that contain less than 65,536 characters. This is probably fine for the scenario where you’re working with people’s names, but if you need to work with a larger string, you should look at using Hadoop’s Text class, which can support much larger strings. If you look at the Comparator inner class in the Text class, you’ll see that its binary string comparator works in a fashion similar to the one discussed here. This approach could easily be extended to work with names represented with Text objects rather than Java String objects.
The next issue in performance tuning is how you can guard against the impact that data skews can have on your MapReduce jobs.
Using a range partitioner to avoid data skew
It’s common for a handful of the reducers to be in the long tail when it comes to task execution time, due to the way that the default hash partitioner works. If this is impacting your job, then take a look at technique 63 on handling skews generated by the hash partitioner.
Technique 78 Tuning the shuffle internals
The shuffle phase involves fetching the map output data from the shuffle service and merging it in the background. The sort phase, which is another merge, will merge the files together into a smaller number of files.
Problem
You want to determine if a job runs slowly due to the shuffle and sort phases.
Solution
Use the JobHistory metadata to extract statistics related to the shuffle and sort execution times.
Discussion
We’re going to look at three areas of the shuffle and for each identify areas that can be tuned for increased performance.
Tuning the map side
When a mapper emits output records, they’re first stored in an in-memory buffer. After the buffer grows to a certain size, the data is spilled to a new file on disk. This process continues until the mapper has completed emitting all its output records. Figure 8.7 shows this process.
Figure 8.7. The map-side shuffle
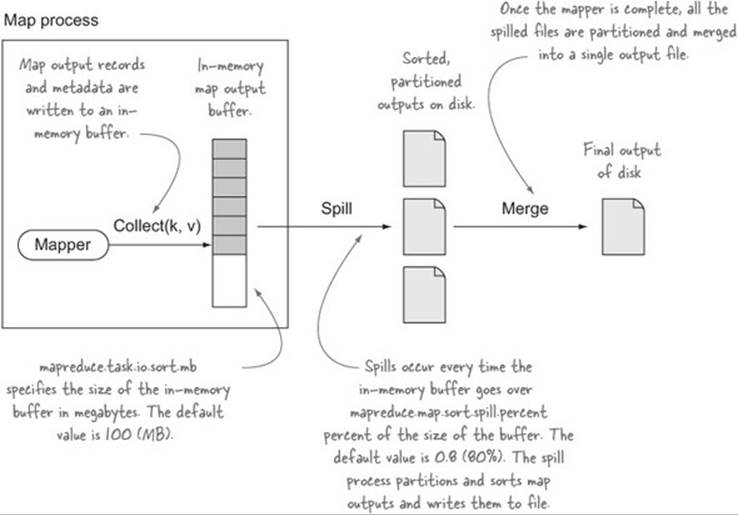
The expensive part of the map-side shuffle is the I/O related to spilling and merging the spill files. The merge is expensive, as all the map outputs need to be read from the spill files and rewritten to the merged spill file.
An ideal mapper is able to fit all its output in the in-memory buffer, which means that only one spill file is required. Doing so negates the need to merge multiple spill files together. This isn’t possible for all jobs, but if your mapper filters or projects the input data so that the input data can fit into memory, then it’s worthwhile tuning mapreduce.task.io.sort.mb to be large enough to store the map outputs.
Examine the job counters shown in table 8.2 to understand and tune the shuffle characteristics of your job.
Table 8.2. Map shuffle counters
|
Counter |
Description |
|
MAP_OUTPUT_BYTES |
Use the MAP_OUTPUT_BYTES counter for your map tasks to determine if it’s possible to increase your mapreduce.task.io.sort.mb so that it can store all the map outputs. |
|
SPILLED_RECORDS MAP_OUTPUT_RECORDS |
Ideally these two values will be the same, which indicates that only one spill occurred. |
|
FILE_BYTES_READ FILE_BYTES_WRITTEN |
Compare these two counters with MAP_OUTPUT_BYTES to understand the additional reads and writes that are occurring as a result of the spilling and merging. |
Tuning the reduce side
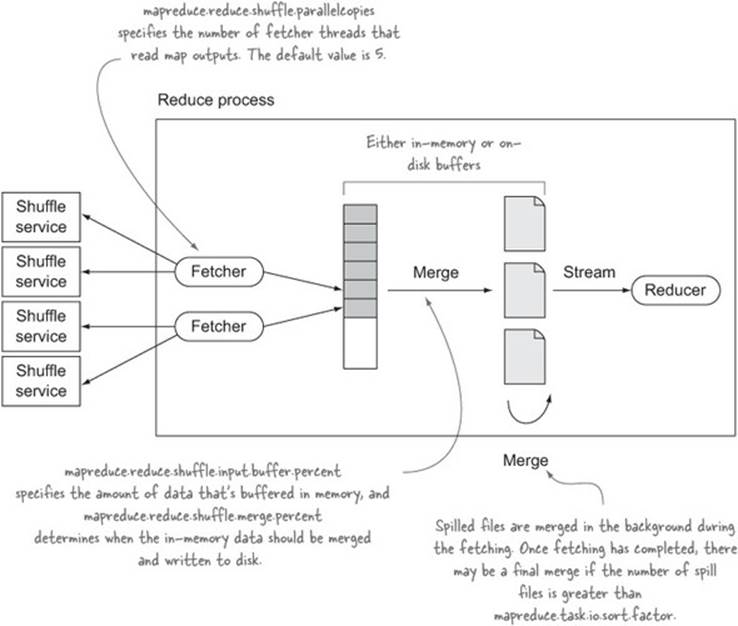
On the reduce side, the map outputs for the reducer are streamed from the auxiliary shuffle service that runs on each slave node. The map outputs are written into an in-memory buffer that is merged and written to disk once the buffer reaches a certain size. In the background, these spilled files are continuously merged into a smaller number of merged files. Once the fetchers have fetched all their outputs, there’s a final round of merging, after which data from the merged files is streamed to the reducer. Figure 8.8 shows this process.
Figure 8.8. The reduce-side shuffle
Much like with the map side, the goal of tuning the reduce-size shuffle is to attempt to fit all the map outputs into memory to avoid spilling to disk and merging spilled files. By default, records are always spilled to disk even if they can all fit in memory, so to enable a memory-to-memory merge that bypasses disk, set mapreduce.reduce.merge.memtomem.enabled to true.
The job counters in table 8.3 can be used to understand and tune the shuffle characteristics of your job.
Table 8.3. Map shuffle counters
|
Counter |
Description |
|
SPILLED_RECORDS |
The number of records that are written to disk. If your goal is for map outputs to never touch disk, this value should be 0. |
|
FILE_BYTES_READ FILE_BYTES_WRITTEN |
These counters will give you an idea of how much data is being spilled and merged to disk. |
Shuffle settings
Table 8.4 shows the properties covered in this technique.
Table 8.4. Configurables to tune the shuffle
|
Name |
Default value |
Map side or reduce side? |
Description |
|
mapreduce.task.io.sort.mb |
100 (MB) |
Map |
The total amount of buffer memory in megabytes to use when buffering map outputs. This should be approximately 70% of the map task’s heap size. |
|
mapreduce.map.sort.spill.percent |
0.8 (80%) |
Map |
The soft limit in the serialization buffer. Once reached, a thread will begin to spill the contents to disk in the background. Note that collection will not block if this threshold is exceeded while a spill is already in progress, so spills may be larger than this threshold when it is set to less than 0.5. |
|
mapreduce.task.io.sort.factor |
10 |
Map and reduce |
The number of streams to merge at once while sorting files. This determines the number of open file handles. Larger clusters with 1,000 or more nodes can bump this up to 100. |
|
mapreduce.reduce.shuffle.parallelcopies |
5 |
Reduce |
The default number of parallel transfers run on the reduce side during the copy (shuffle) phase. Larger clusters with 1,000 or more nodes can bump this up to 20. |
|
mapreduce.reduce.shuffle.input.buffer.percent |
0.70 |
Reduce |
The percentage of memory to be allocated from the maximum heap size to store map outputs during the shuffle. |
|
mapreduce.reduce.shuffle.merge.percent |
0.66 |
Reduce |
The usage threshold at which an in-memory merge will be initiated, expressed as a percentage of the total memory allocated to storing in-memory map outputs, as defined by mapreduce.reduce.shuffle.input.buffer.percent. |
|
mapreduce.reduce.merge.memtomem.enabled |
false |
Reduce |
If all the map outputs for each reducer can be stored in memory, then set this property to true. |
Summary
The simplest way to cut down on shuffle and sort times is to aggressively filter and project your data, use a combiner, and compress your map outputs. These approaches reduce the amount of data flowing between the map and reduce tasks and lessen the network and CPU/disk burden related to the shuffle and sort phases.
If you’ve done all that, you can look at some of the tips outlined in this technique to determine if your job can be tuned so that the data being shuffled touches disk as little as possible.
8.2.4. Reducer optimizations
Much like map tasks, reduce tasks have their own unique problems that can affect performance. In this section we’ll look at how common problems can affect the performance of reducer tasks.
Technique 79 Too few or too many reducers
For the most part, parallelism on the map side is automatically set and is a function of your input files and the input format you’re using. But on the reduce side you have total control over the number of reducers for your job, and if that number is too small or too large, you’re potentially not getting the most value out of your cluster.
Problem
You want to determine if a job runs slowly due to the number of reducers.
Solution
The JobHistory UI can be used to inspect the number of reducers running for your job.
Discussion
Use the JobHistory UI to look at the number of reducers for your job and the number of input records for each reducer. You may be running with too few or too many reducers. Running with too few reducers means that you’re not using the available parallelism of your cluster; running with too many reducers means the scheduler may have to stagger the reducer execution if there aren’t enough resources to execute the reducers in parallel.
There are circumstances where you can’t avoid running with a small number of reducers, such as when you’re writing to an external resource (such as a database) that you don’t want to overwhelm.
Another common anti-pattern in MapReduce is using a single reducer when you want job output to have total order and not be ordered within the scope of a reducer’s output. This anti-pattern can be avoided with the TotalOrderPartitioner, which we looked at in technique 65.
Dealing with data skew
Data skew can be easily identified—it’s manifested by a small percentage of your reduce tasks taking significantly longer to complete than the other tasks. This is usually due to one of two reasons—poor hash partitioning or high join-key cardinality when you’re performing joins. Chapter 6provides solutions to both problems in section 6.1.5.
8.2.5. General tuning tips
In this section we’ll look at problems that can affect both map and reduce tasks.
Compression
Compression is an important part of optimizing Hadoop. You can gain substantial space and time savings by compressing both intermediary map outputs and job outputs. Compression is covered in detail in chapter 4.
Using a compact data format
Much like compression, using space-efficient file formats such as Avro and Parquet results in a more compact representation of your data and yields improved marshaling and unmarshaling times compared to storing data as text. A large part of chapter 3 is dedicated to working with these file formats.
It should also be noted that text is an especially inefficient data format to work with—it’s space-inefficient and computationally expensive to parse, and parsing data at scale can cost a surprising amount of time, especially if regular expressions are involved.
Even when the end result of your work in MapReduce is a nonbinary file format, it’s good practice to store your intermediate data in binary form. For example, if you have a MapReduce pipeline involving a sequence of MapReduce jobs, you should consider using Avro or SequenceFiles to store your individual job outputs. The last job that produces the final results can use whatever output format is required for your use case, but intermediate jobs should use a binary output format to speed up the writing and reading parts of MapReduce.
Technique 80 Using stack dumps to discover unoptimized user code
Imagine you’re running a job and it’s taking longer than you expect. You can often determine if this is due to inefficient code by taking several stack dumps and examining the output to see if the stacks are executing in the same location. This technique walks you through taking stack dumps of a running MapReduce job.
Problem
You want to determine if a job runs slowly due to inefficiencies in your code.
Solution
Determine the host and process ID of currently executing tasks, take a number of stack dumps, and examine them to narrow down bottlenecks in your code.
Discussion
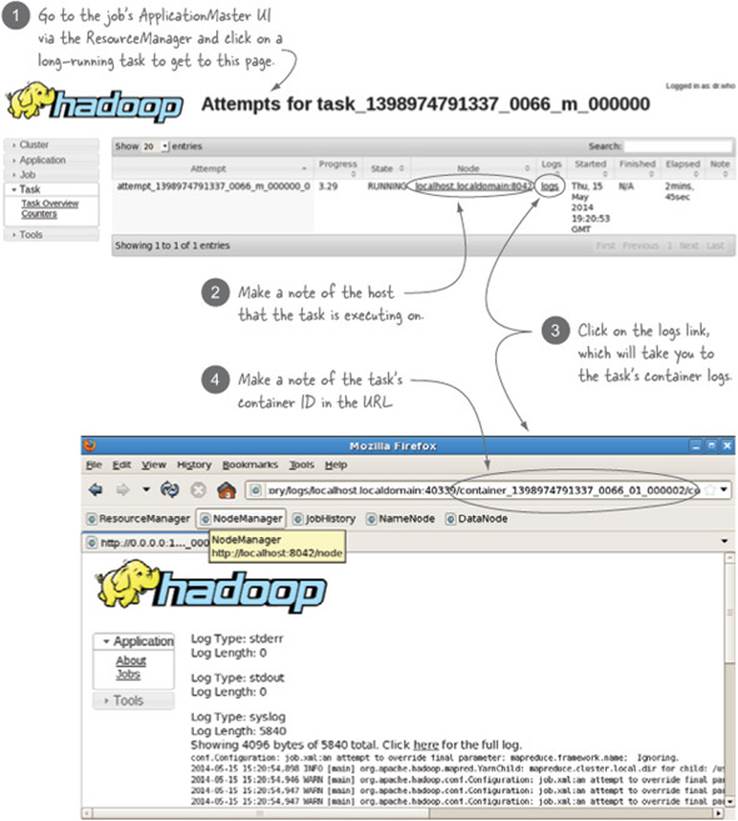
If there’s anything particularly inefficient in your code, chances are that you’ll be able to discover what it is by taking some stack dumps of the task process. Figure 8.9 shows how to identify the task details so that you can take the stack dumps.
Figure 8.9. Determining the container ID and host for a MapReduce task
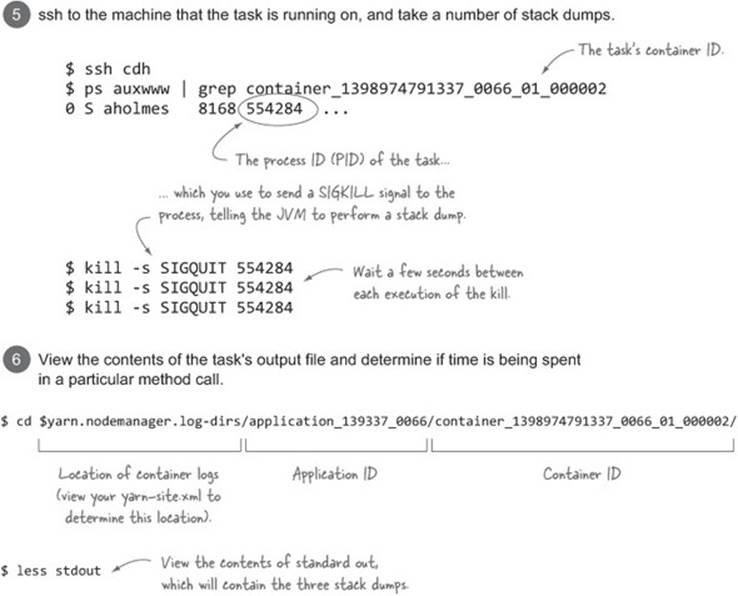
Now that you know the container ID and the host it’s executing on, you can take stack dumps of the task process, as shown in figure 8.10.
Figure 8.10. Taking stack dumps and accessing the output
Summary
The best approach to understanding what your code is spending time doing is to profile your code, or update your code to time how long you spend in each task. But using stack dumps is useful if you want to get a rough sense of whether this is an issue without having to change your code.
Stack dumps are a primitive, yet often effective, means of discovering where a Java process is spending its time, particularly if that process is CPU-bound. Clearly dumps are not as effective as using a profiler, which will more accurately pinpoint where time is being spent, but the advantage of stack dumps is that they can be performed on any running Java process. If you were to use a profiler, you’d need to reexecute the process with the required profiling JVM settings, which is a nuisance in MapReduce.
When taking stack dumps, it’s useful to take multiple dumps with some pauses between successive dumps. This allows you to visually determine if the code execution stacks across multiple dumps are roughly in the same point. If this is the case, there’s a good chance the code in the stack is what’s causing the slowness.
If your code isn’t in the same location across the different stack dumps, this doesn’t necessarily indicate that there aren’t inefficiencies. In this case, the best approach is to profile your code or add some measurements in your code and rerun the job to get a more accurate breakdown of where time is being spent.
Technique 81 Profiling your map and reduce tasks
Profiling standalone Java applications is straightforward and well supported by a large number of tools. In MapReduce, you’re working in a distributed environment running multiple map and reduce tasks, so it’s less clear how you would go about profiling your code.
Problem
You suspect that there are inefficiencies in your map and reduce code, and you need to identify where they exist.
Solution
Use HPROF in combination with a number of MapReduce job methods, such as setProfileEnabled, to profile your tasks.
Discussion
Hadoop has built-in support for the HPROF profiler, Oracle’s Java profiler built into the JVM. To get started, you don’t need to understand any HPROF settings—you can call JobConf.setProfileEnabled(true) and Hadoop will run HPROF with the following settings:
-agentlib:hprof=cpu=samples,heap=sites,force=n,
thread=y,verbose=n,file=%s
This will generate object allocation stack sizes that are too small to be useful, so instead you can programmatically set custom HPROF parameters:
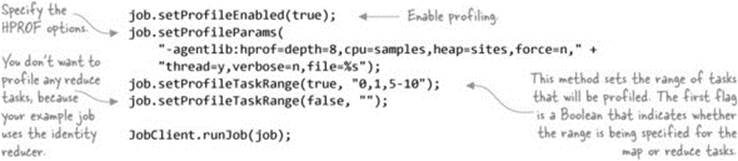
The sample job profiled is quite simple. It parses a file containing IP addresses, extracts the first octet from the address, and emits it as the output value:[8]
8 GitHub source: https://github.com/alexholmes/hiped2/blob/master/src/main/java/hip/ch8/SlowJob.java.
public void map(LongWritable key, Text value,
OutputCollector<LongWritable, Text> output,
Reporter reporter) throws IOException {
String[] parts = value.toString().split("\\.");
Text outputValue = new Text(parts[0]);
output.collect(key, outputValue);
}
You can upload a large(ish) file of IP addresses and run your job against it, with the previous profiling options set:
$ hadoop fs -put test-data/ch8/large-ips.txt .
$ hip hip.ch8.SlowJob \
--input large-ips.txt \
--output output
The HPROF option you specified earlier via the setProfileParams method call will create a text file that can be easily parsed. The file is written to the container’s log directory into a file titled profile.out. There are two ways of accessing this file: either through the JobHistory UI or by using your shell to ssh to the node that ran the task. The previous technique showed you how to determine the host and log directory for a task.
The profile.out file contains a number of stack traces, and at the bottom contains memory and CPU time accumulations, with references to stack traces that accounted for the accumulations. In the example you ran, look at the top two items, which accounted for the most CPU time, and correlate them with the code:
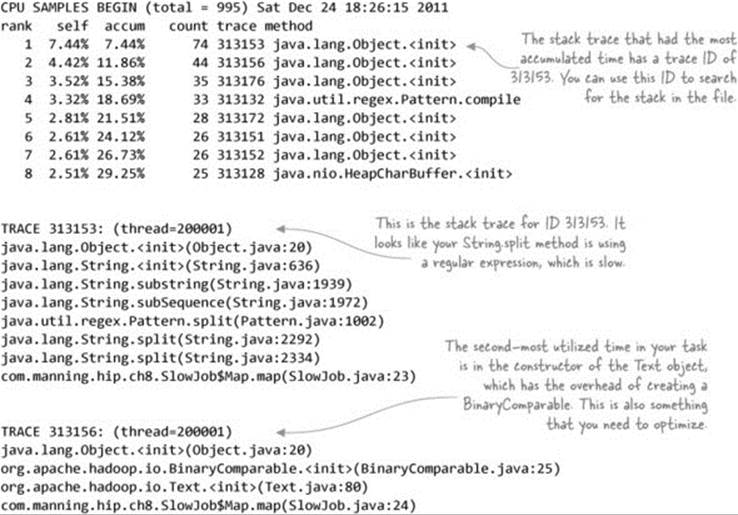
The first issue identified is the use of the String.split method, which uses regular expressions to tokenize strings. Regular expressions are computationally expensive, especially when they’re executed over millions of records, which is normal when working with data volumes typical with MapReduce. One solution is to replace the String.split method with any of the StringUtils.split methods in the Apache Commons Lang library, which doesn’t use regular expressions.
To avoid the overhead associated with the Text class constructor, construct the instance once and call the set method repeatedly, which is much more efficient.
Summary
Running HPROF adds significant overhead to the execution of Java; it instruments Java classes to collect the profiling information as your code is executing. This isn’t something you’ll want to regularly run in production.
There’s a simpler way to profile tasks by adding -Xprof to mapred.child.java.opts as recommended in Todd Lipcon’s excellent presentation.[9]
9 Todd Lipcon, “Optimizing MapReduce Job Performance,” http://www.slideshare.net/cloudera/mr-perf.
In fact, the ideal way to profile your code is to isolate your map or reduce code in such a way that it can be executed outside of Hadoop using a profiler of your choice. Then you can focus on quickly iterating your profiling without worrying about Hadoop getting in your way.
This wraps up our look at some of the methods you can use to tune the performance of your jobs and to make your jobs as efficient as possible. Next up is a look at various mechanisms that can help you debug your applications.
8.3. Debugging
In this section we’ll cover a number of topics that will help with your debugging efforts. We’ll kick things off with a look at the task logs.
8.3.1. Accessing container log output
Accessing your task logs is the first step to figuring out what issues you’re having with your jobs.
Technique 82 Examining task logs
In this technique we’ll look at ways to access task logs in the event that you have a problem job you want to debug.
Problem
Your job is failing or generating unexpected outputs, and you want to determine if the logs can help you figure out the problem.
Solution
Learn how to use the JobHistory or ApplicationMaster UI to view task logs. Alternatively, you can SSH to individual slave nodes and access the logs directly.
Discussion
When a job fails, it’s useful to look at the logs to see if they tell you anything about the failure. For MapReduce applications, each map and reduce task runs in its own container and has its own logs, so you need to identify the tasks that failed. The easiest way to do this is to use the JobHistory or ApplicationMaster UI, which in the task views provide links to the task logs.
You can also use the steps outlined in technique 80 for accessing stack dumps to directly access the logs on the slave node that executed a task.
YARN will automatically delete the log files after yarn.nodemanager.log.retain-seconds seconds if log aggregation isn’t enabled, or yarn.nodemanager.delete.debug-delay-sec seconds if log aggregation is enabled.
If a container fails to start, you’ll need to examine the NodeManager logs that executed the task. To do this, use the JobHistory or ApplicationMaster UI to determine which node executed your task, and then navigate to the NodeManager UI to examine its logs.
Often, when things start going wrong in your jobs, the task logs will contain details on the cause of the failure. Next we’ll look at how you get at the command used to launch a map or reduce task, which is useful when you suspect there’s an issue related to the environment.
8.3.2. Accessing container start scripts
This a useful technique in situations where you suspect there’s an issue with the environment or startup arguments for a container. For example, sometimes the classpath ordering of JARs is significant, and issues with it can cause class-loading problems. Also, if a container has dependencies on native libraries, the JVM arguments can be used to debug issues with java.library.path.
Technique 83 Figuring out the container startup command
The ability to examine the various arguments used to start a container can be helpful in debugging container-launching problems. For example, let’s say you’re trying to use a native Hadoop compression codec, but your MapReduce containers are failing, and the errors complain that the native compression libraries can’t be loaded. In this case, review the JVM startup arguments to determine if all of the required settings exist for native compression to work.
Problem
You suspect that a container is failing due to missing arguments when a task is being launched, and you want to examine the container startup arguments.
Solution
Set the yarn.nodemanager.delete.debug-delay-sec YARN configuration parameter to stop Hadoop from cleaning up container metadata, and use this metadata to view the shell script used to launch the container.
Discussion
As the NodeManager prepares to launch a container, it creates a shell script that’s subsequently executed to run the container. The problem is that YARN, by default, removes these scripts after a job has completed. During the execution of a long-running application, you’ll have access to these scripts, but if the application is short-lived (which it may well be if you’re debugging an issue that causes the containers to fail off the bat), you’ll need to set yarn.nodemanager.delete.debug-delay-sec to true.
Figure 8.11 shows all of the steps required to gain access to the task shell script.
Figure 8.11. How to get to the launch_container.sh script
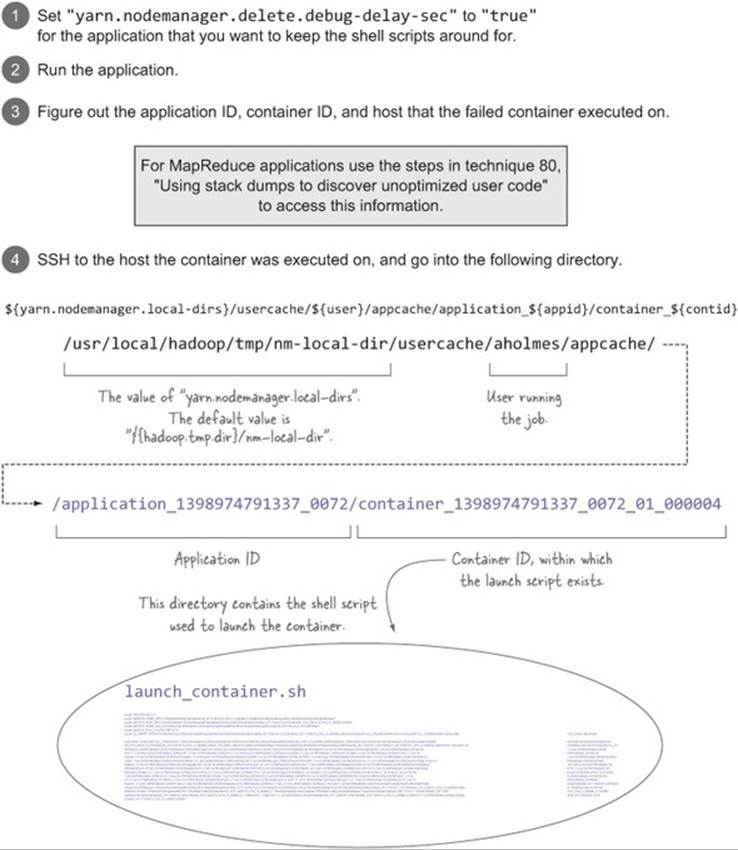
It’s also useful to examine the logs of the NodeManager that attempted to launch the container, as they may contain container startup errors. Also double-check the container logs if they exist.
Summary
This technique is useful in situations where you want to be able to examine the arguments used to launch the container. If the data in the logs suggests that the problem with your job is with the inputs (which can be manifested by a parsing exception), you’ll need to figure out what kind of input is causing the problem.
8.3.3. Debugging OutOfMemory errors
OutOfMemory (OOM) errors are common in Java applications that have memory leaks or are trying to store too much data in memory. These memory errors can be difficult to track down, because often you aren’t provided enough information when a container exits.
Technique 84 Force container JVMs to generate a heap dump
In this technique you’ll see some useful JVM arguments that will cause Java to write a heap dump to disk when OOM errors occur.
Problem
Containers are failing with OutOfMemory errors.
Solution
Update the container JVM arguments to include -XX:+HeapDumpOnOutOfMemoryError -XX:HeapDumpPath=<path>, where <path> is a common directory across all your slave nodes.
Discussion
If you’re running a MapReduce application, you can update mapred.child.java.opts with the preceding JVM arguments. For non-MapReduce applications, you’ll need to figure out how to append these JVM startup arguments for the container exhibiting the OOM errors.
Once a container running with the preceding JVM arguments fails, you can load the generated dump file using jmap or your favorite profiling tool.
8.3.4. MapReduce coding guidelines for effective debugging
Debugging MapReduce code in production can be made a lot easier if you follow a handful of logging and exception-handling best practices.
Technique 85 Augmenting MapReduce code for better debugging
Debugging a poorly written MapReduce job consumes a lot of time and can be challenging in production environments where access to cluster resources is limited.
Problem
You want to know the best practices to follow when writing MapReduce code.
Solution
Look at how counters and logs can be used to enhance your ability to effectively debug and handle problem jobs.
Discussion
Add the following features to your code:
· Include logs that capture data related to inputs and outputs to help isolate where problems exist.
· Catch exceptions and provide meaningful logging output to help track down problem data inputs and logic errors.
· Think about whether you want to rethrow or swallow exceptions in your code.
· Use counters and task statuses that can be utilized by driver code and humans alike to better understand what happened during the job execution.
In the following code, you’ll see a number of the previously described principles applied.
Listing 8.1. A mapper job with some best practices applied to assist debugging
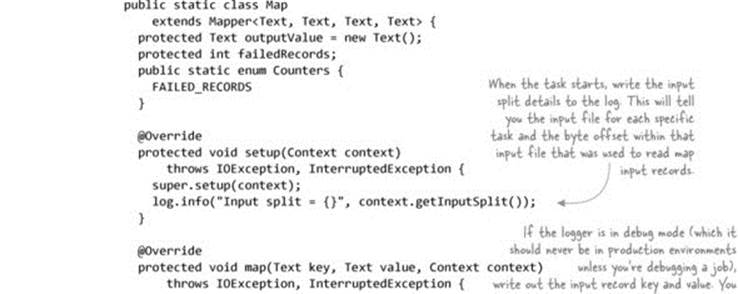
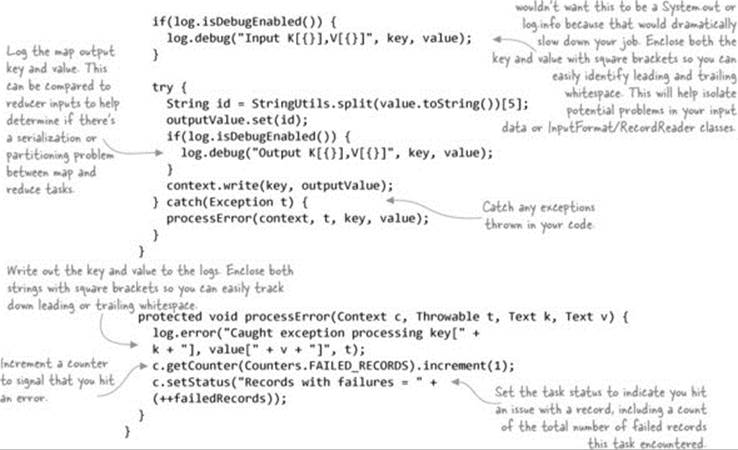
The reduce task should have similar debug log statements added to write out each reduce input key and value and the output key and value. Doing so will help identify any issues between the map and reduce sides, in your reduce code, or in the OutputFormat or RecordWriter.
Should exceptions be swallowed?
In the previous code example, you caught any exceptions in your code and then wrote the exception to the logs, along with as much contextual information as possible (such as the current key and value that the reducer was working on). The big question is whether you should rethrow the exception or swallow it.
Rethrowing the exception is tempting because you’ll immediately be aware of any issues in your MapReduce code. But if your code is running in production and fails every time it encounters a problem—such as some input data that’s not handled correctly—the ops, dev, and QA teams will be spending quite a few cycles addressing each issue as it comes along.
Writing code that swallows exceptions has its own problems—for example, what if you encounter an exception on all inputs to the job? If you write your code to swallow exceptions, the correct approach is to increment a counter (as in the code example), which the driver class should use after job completion to ensure that most of the input records within some tolerable threshold were successfully processed. If they weren’t, the workflow being processed should probably be terminated and the appropriate alerts be sent to notify operations.
Another approach is to not swallow exceptions and to configure record skipping with a call to setMapperMaxSkipRecords or setReducerMaxSkipGroups, indicating the number of records that you can tolerate losing if an exception is thrown when they’re processed. This is covered in more detail in Hadoop in Action by Chuck Lam (Manning, 2010).
You used counters to count the number of bad records you encountered, and the ApplicationMaster or JobHistory UI can be used to view the counter values, as shown in figure 8.12.
Figure 8.12. Screenshot of a counter in the JobHistory counter page
![]()
Depending on how you executed the job, you’ll see the counters dumped on standard out. If you look at the logs for your tasks, you’ll also see some informative data related to the task:
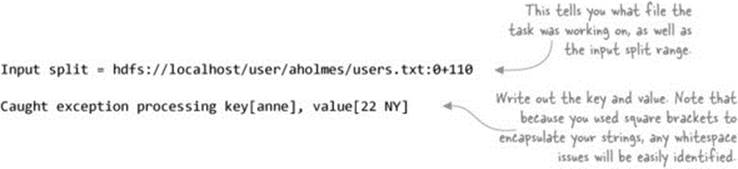
Because you also updated the task status in your code, you can use the ApplicationMaster or JobHistory UI to easily identify the tasks that had failed records, as shown in figure 8.13.
Figure 8.13. JobTracker UI showing map task and status

Summary
We looked at a handful of simple yet useful coding guidelines for your MapReduce code. If they’re applied and you hit a problem with your job in production, you’ll be in a great position to quickly narrow down the root cause of the issue. If the issue is related to the input, your logs will contain details about how the input caused your processing logic to fail. If the issue is related to some logic error or errors in serialization or deserialization, you can enable debug-level logging and better understand where things are going awry.
8.4. Testing MapReduce jobs
In this section we’ll look at the best methods for testing your MapReduce code, as well as design aspects to consider when writing MapReduce jobs to help in your testing efforts.
8.4.1. Essential ingredients for effective unit testing
It’s important to make sure unit tests are easy to write and to ensure that they cover a good spectrum of positive and negative scenarios. Let’s take a look at the impact that test-driven development, code design, and data have on writing effective unit tests.
Test-driven development
When it comes to writing Java code, I’m a big proponent of test-driven development (TDD),[10] and with MapReduce things are no different. Test-driven development emphasizes writing unit tests ahead of writing the code, and it recently has gained in importance as quick development turnaround times have become the norm rather than the exception. Applying test-driven development to MapReduce code is crucial, particularly when such code is part of a critical production application.
10 For an explanation of test-driven development, see the Wikipedia article: http://en.wikipedia.org/wiki/Test-driven_development.
Writing unit tests prior to writing your code forces you to structure your code in a way that easily facilitates testing.
Code design
When you write code, it’s important to think about the best way to structure it so you can easily test it. Using concepts such as abstraction and dependency injection will go a long way toward reaching this goal.[11]
11 For an explanation of dependency injection, see the Wikipedia article: http://en.wikipedia.org/wiki/Dependency_injection.
When you write MapReduce code, it’s a good idea to abstract away the code doing the work, which means you can test that code in regular unit tests without having to think about how to work with Hadoop-specific constructs. This is true not only for your map and reduce functions, but also for your input formats, output formats, data serialization, and partitioner code.
Let’s look at a simple example to better illustrate this point. The following code shows a reducer that calculates the mean for a stock:
public static class Reduce
extends Reducer<Text, DoubleWritable, Text, DoubleWritable> {
DoubleWritable outValue = new DoubleWritable();
public void reduce(Text stockSymbol, Iterable<DoubleWritable> values,
Context context)
throws IOException, InterruptedException {
double total = 0;
int instances = 0;
for (DoubleWritable stockPrice : values) {
total += stockPrice.get();
instances++;
}
outValue.set(total / (double) instances);
context.write(stockSymbol, outValue);
}
}
This is a trivial example, but the way the code is structured means you can’t easily test this in a regular unit test, because MapReduce has constructs such as Text, DoubleWritable, and the Context class that get in your way. If you were to structure the code to abstract away the work, you could easily test the code that’s doing your work, as the following code shows:
public static class Reduce2
extends Reducer<Text, DoubleWritable, Text, DoubleWritable> {
SMA sma = new SMA();
DoubleWritable outValue = new DoubleWritable();
public void reduce(Text key, Iterable<DoubleWritable> values,
Context context)
throws IOException, InterruptedException {
sma.reset();
for (DoubleWritable stockPrice : values) {
sma.add(stockPrice.get());
}
outValue.set(sma.calculate());
context.write(key, outValue);
}
}
public static class SMA {
protected double total = 0;
protected int instances = 0;
public void add(double value) {
total += value;
instances ++;
}
public double calculate() {
return total / (double) instances;
}
public void reset() {
total = 0;
instances = 0;
}
}
With this improved code layout, you can now easily test the SMA class that’s adding and calculating the simple moving average without the Hadoop code getting in your way.
It’s the data, stupid
When you write unit tests, you try to discover how your code handles both positive and negative input data. In both cases, it’s best if the data you’re testing with is a representative sample from production.
Often, no matter how hard you try, issues in your code in production will arise from unexpected input data. It’s important that when you do discover input data that causes a job to blow up, you not only fix the code to handle the unexpected data, but you also pull the data that caused the blowup and use it in a unit test to prove that the code can now correctly handle that data.
8.4.2. MRUnit
MRUnit is a test framework you can use to unit-test MapReduce code. It was developed by Cloudera (a vendor with its own Hadoop distribution) and it’s currently an Apache project. It should be noted that MRUnit supports both the old (org.apache.hadoop.mapred) and new (org.apache.hadoop.mapreduce) MapReduce APIs.
Technique 86 Using MRUnit to unit-test MapReduce
In this technique we’ll look at writing unit tests that use each of the four types of tests provided by MRUnit:
· MapDriver class—A map test that only tests a map function
· ReduceDriver class—A reduce test that only tests a reduce function
· MapReduceDriver class—A map and reduce test that tests both the map and reduce functions
· TestPipelineMapReduceDriver class—A pipeline test that allows a series of Map-Reduce functions to be exercised
Problem
You want to test map and reduce functions, as well as MapReduce pipelines.
Solution
Use MRUnit’s MapDriver, ReduceDriver, MapReduceDriver, and PipelineMapReduceDriver classes as part of your unit tests to test your MapReduce code.
Discussion
MRUnit has four types of unit tests—we’ll start with a look at the map tests.
Map tests
Let’s kick things off by writing a test to exercise a map function. Before starting, let’s look at what you need to supply to MRUnit to execute the test, and in the process learn about how MRUnit works behind the scenes.
Figure 8.14 shows the interactions of the unit test with MRUnit and how it in turn interacts with the mapper you’re testing.
Figure 8.14. MRUnit test using MapDriver
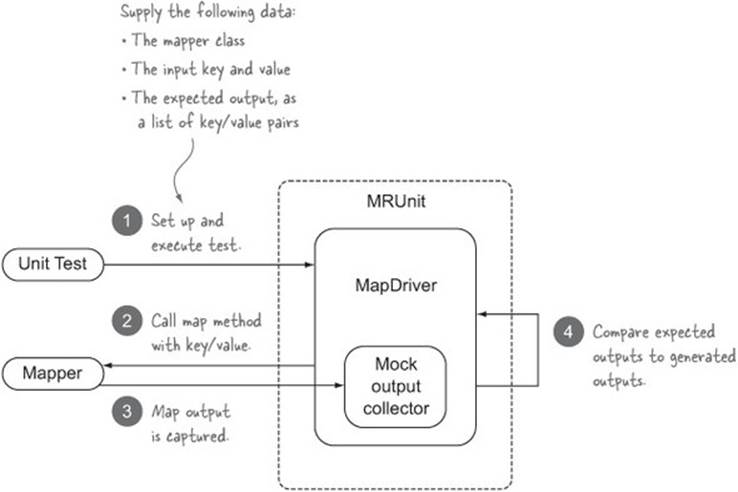
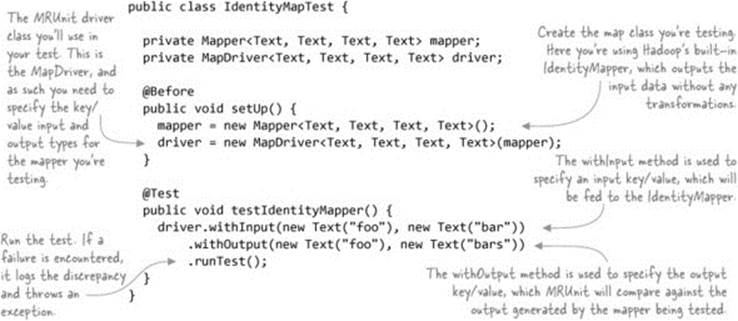
The following code is a simple unit test of the (identity) mapper class in Hadoop:[12]
12 GitHub source: https://github.com/alexholmes/hiped2/blob/master/src/test/java/hip/ch8/mrunit/IdentityMapTest.java.
MRUnit is not tied to any specific unit-testing framework, so if it finds an error, it logs the error and throws an exception. Let’s see what would happen if your unit test had specified output that didn’t match the output of the mapper, as in the following code:
driver.withInput(new Text("foo"), new Text("bar"))
.withOutput(new Text("foo"), new Text("bar2"))
.runTest();
If you run this test, your test will fail, and you’ll see the following log output:
ERROR Received unexpected output (foo, bar)
ERROR Missing expected output (foo, bar2) at position 0
MRUnit logging configuration
Because MRUnit uses the Apache Commons logging, which defaults to using log4j, you’ll need to have a log4j.properties file in the classpath that’s configured to write to standard out, similar to the following:
log4j.rootLogger=WARN, stdout
log4j.appender.stdout=org.apache.log4j.ConsoleAppender
log4j.appender.stdout.layout=org.apache.log4j.PatternLayout
log4j.appender.stdout.layout.ConversionPattern=
![]() %-5p [%t][%d{ISO8601}] [%C.%M] - %m%n
%-5p [%t][%d{ISO8601}] [%C.%M] - %m%n
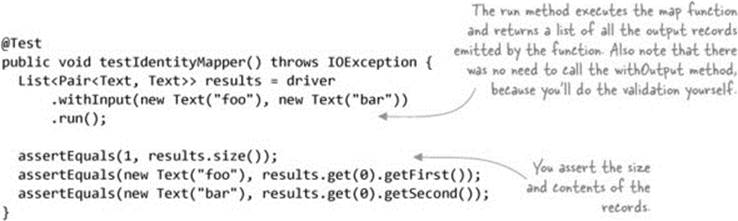
One of the powerful features of JUnit and other test frameworks is that when tests fail, the failure message includes details on the cause of the failure. Unfortunately, MRUnit logs and throws a nondescriptive exception, which means you need to dig through the test output to determine what failed.
What if you wanted to use the power of MRUnit, and also use the informative errors that JUnit provides when assertions fail? You could modify your code to do that and bypass MRUnit’s testing code:
With this approach, if there’s a mismatch between the expected and actual outputs, you get a more meaningful error message, which report-generation tools can use to easily describe what failed in the test:
junit.framework.AssertionFailedError: expected:<bar2> but was:<bar>
To cut down on the inevitable copy-paste activities with this approach, I wrote a simple helper class to use JUnit asserts in combination with using the MRUnit driver.[13] Your JUnit test now looks like this:
13 GitHub source: https://github.com/alexholmes/hiped2/blob/master/src/test/java/hip/ch8/mrunit/MRUnitJUnitAsserts.java
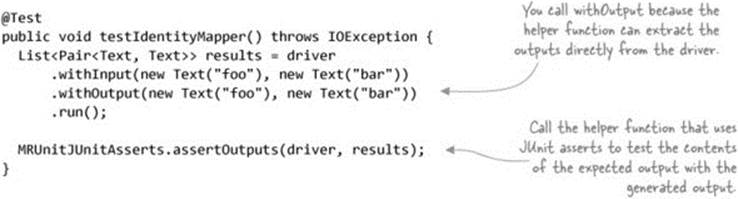
This is much cleaner and removes any mistakes that might arise from the copy-paste anti-pattern.
Reduce tests
Now that we’ve looked at map function tests, let’s look at reduce function tests. The MRUnit framework takes a similar approach for reduce testing. Figure 8.15 shows the interactions of your unit test with MRUnit, and how it in turn interacts with the reducer you’re testing.
Figure 8.15. MRUnit test using ReduceDriver
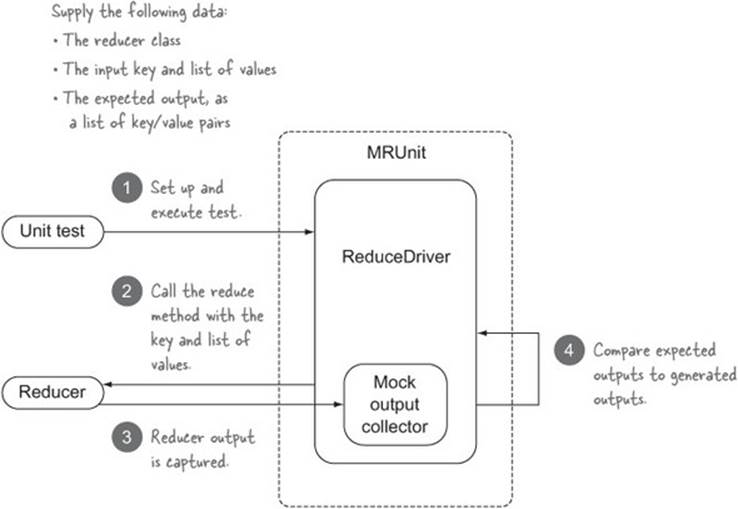
The following code is a simple unit test for testing the (identity) reducer class in Hadoop:[14]
14 GitHub source: https://github.com/alexholmes/hiped2/blob/master/src/test/java/hip/ch8/mrunit/IdentityReduceTest.java.
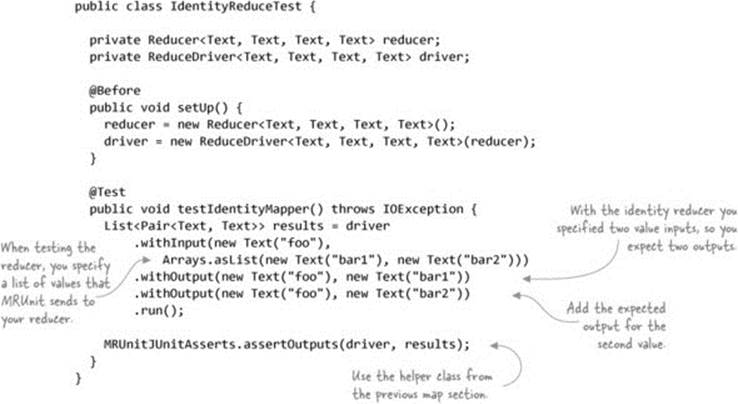
Now that we’ve completed our look at the individual map and reduce function tests, let’s look at how you can test a map and reduce function together.
MapReduce tests
MRUnit also supports testing the map and reduce functions in the same test. You feed MRUnit the inputs, which in turn are supplied to the mapper. You also tell MRUnit what reducer outputs you expect.
Figure 8.16 shows the interactions of your unit test with MRUnit and how it in turn interacts with the mapper and reducer you’re testing.
Figure 8.16. MRUnit test using MapReduceDriver
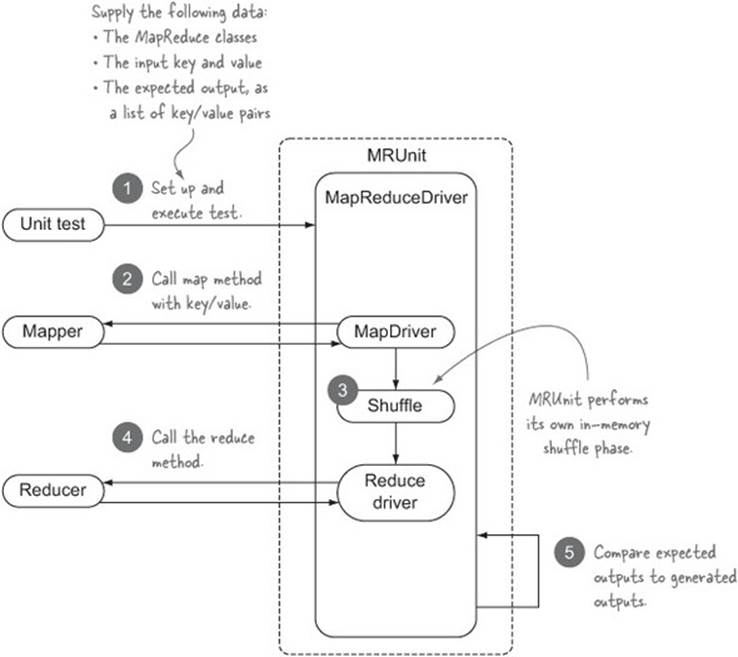
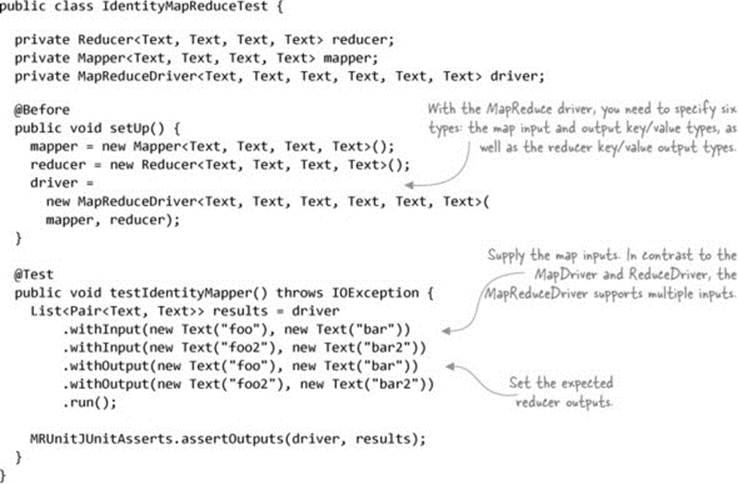
The following code is a simple unit test for testing the (identity) mapper and reducer classes in Hadoop:[15]
15 GitHub source: https://github.com/alexholmes/hiped2/blob/master/src/test/java/hip/ch8/mrunit/IdentityMapReduceTest.java.
Now we’ll look at the fourth and final type of test that MRUnit supports, pipeline tests, which are used to test multiple MapReduce jobs.
Pipeline tests
MRUnit supports testing a series of map and reduce functions—these are called pipeline tests. You feed MRUnit one or more MapReduce functions, the inputs to the first map function, and the expected outputs of the last reduce function.
Figure 8.17 shows the interactions of your unit test with the MRUnit pipeline driver.
Figure 8.17. MRUnit test using PipelineMapReduceDriver
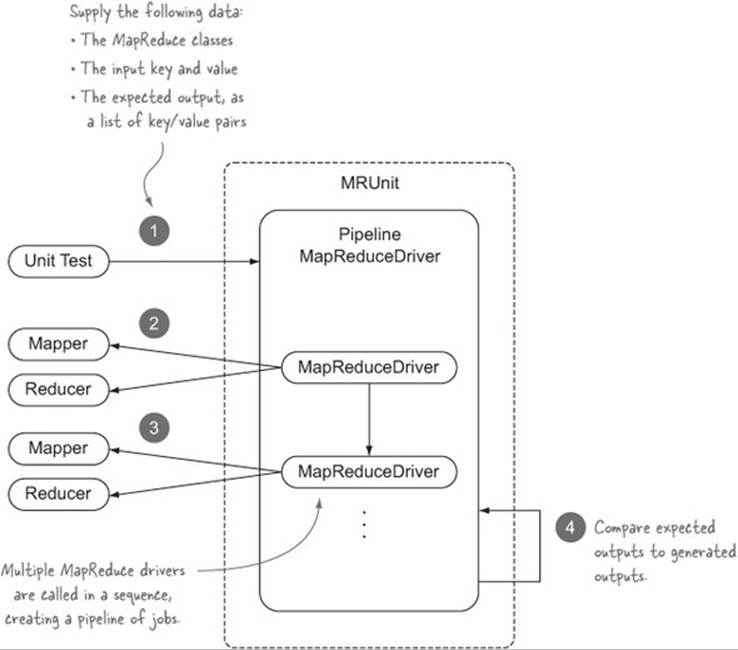
The following code is a unit test for testing a pipeline containing two sets of (identity) mapper and reducer classes in Hadoop:[16]
16 GitHub source: https://github.com/alexholmes/hiped2/blob/master/src/test/java/hip/ch8/mrunit/PipelineTest.java.
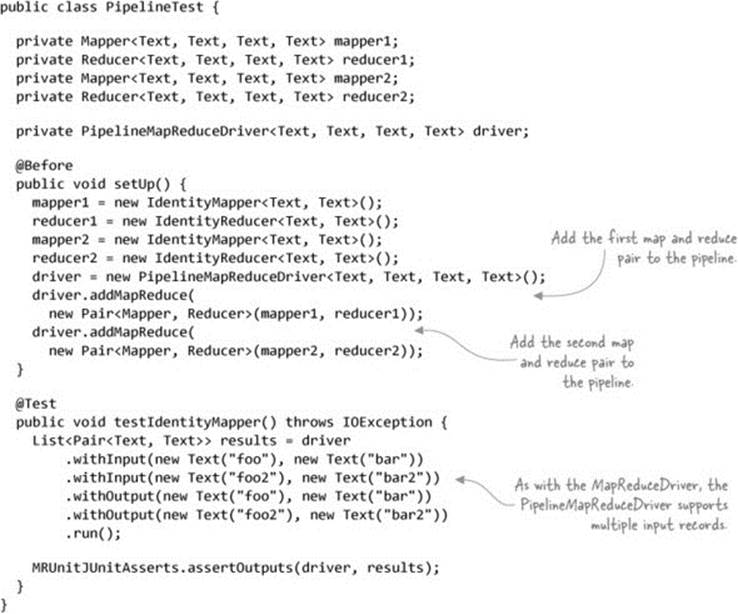
Note that the PipelineMapReduceDriver is the only driver in MRUnit that doesn’t come in both old and new MapReduce API versions, which is why the preceding code uses the old MapReduce API.
Summary
What type of test should you use for your code? Take a look at table 8.5 for some pointers.
Table 8.5. MRUnit tests and when to use them
|
Type of test |
Works well in these situations |
|
Map |
You have a map-only job, and you want low-level unit tests where the framework takes care of testing the expected map outputs for your test map inputs. |
|
Reduce |
Your job has a lot of complexity in the reduce function, and you want to isolate your tests to only that function. |
|
MapReduce |
You want to test the combination of the map and reduce functions. These are higher-level unit tests. |
|
Pipeline |
You have a MapReduce pipeline where the input of each MapReduce job is the output from the previous job. |
MRUnit has a few limitations, some of which we touched on in this technique:
· MRUnit isn’t integrated with unit-test frameworks that provide rich error-reporting capabilities for quicker determination of errors.
· The pipeline tests only work with the old MapReduce API, so MapReduce code that uses the new MapReduce API can’t be tested with the pipeline tests.
· There’s no support for testing data serialization, or InputFormat, RecordReader, OutputFormat, or RecordWriter classes.
Notwithstanding these limitations, MRUnit is an excellent test framework that you can use to test at the granular level of individual map and reduce functions; MRUnit also can test a pipeline of MapReduce jobs. And because it skips the InputFormat and OutputFormat steps, your unit tests will execute quickly.
Next we’ll look at how you can use the LocalJobRunner to test some MapReduce constructs that are ignored by MRUnit.
8.4.3. LocalJobRunner
In the last section we looked at MRUnit, a great, lightweight unit-test library. But what if you want to test not only your map and reduce functions, but also the InputFormat, RecordReader, OutputFormat, and RecordWriter code, as well as the data serialization between the map and reduce phases? This becomes important if you’ve written your own input and output format classes, because you want to make sure you’re testing that code too.
Hadoop comes bundled with the LocalJobRunner class, which Hadoop and related projects (such as Pig and Avro) use to write and test their MapReduce code. LocalJobRunner allows you to test all the aspects of a MapReduce job, including the reading and writing of data to and from the filesystem.
Technique 87 Heavyweight job testing with the LocalJobRunner
Tools like MRUnit are useful for low-level unit tests, but how can you be sure that your code will play nicely with the whole Hadoop stack?
Problem
You want to test the whole Hadoop stack in your unit test.
Solution
Use the LocalJobRunner class in Hadoop to expand the coverage of your tests to include code related to processing job inputs and outputs.
Discussion
Using the LocalJobRunner makes your unit tests start to feel more like integration tests, because what you’re doing is testing how your code works in combination with the whole MapReduce stack. This is great because you can use this to test not only your own MapReduce code, but also to test input and output formats, partitioners, and advanced sort mechanisms.
The code in the next listing shows an example of how you can use the LocalJobRunner in your unit tests.[17]
17 https://github.com/alexholmes/hiped2/blob/master/src/test/java/hip/ch8/localjobrunner/IdentityTest.java.
Listing 8.2. Using LocalJobRunner to test a MapReduce job
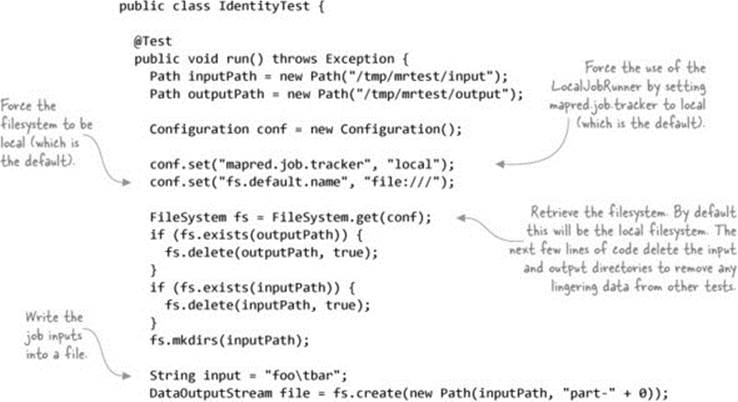
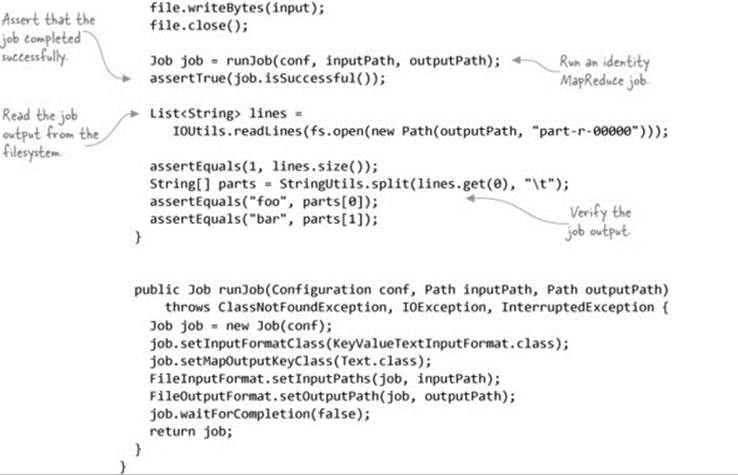
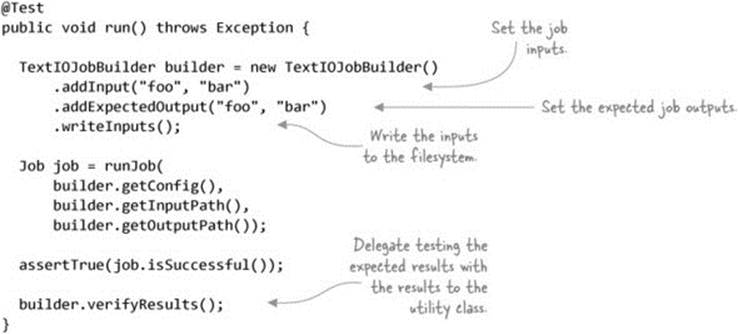
Writing this test is more involved because you need to handle writing the inputs to the filesystem and reading them back out. That’s a lot of boilerplate code to have to deal with for every test, and it’s probably something that you’ll want to factor out into a reusable helper class.
Here’s an example of a utility class to do that; the following code shows how IdentityTest code can be condensed into a more manageable size:[18]
18 GitHub source: https://github.com/alexholmes/hiped2/blob/master/src/test/java/hip/ch8/localjobrunner/IdentityWithBuilderTest.java.
Summary
What are some of the limitations to be aware of when using LocalJobRunner?
· LocalJobRunner runs only a single reduce task, so you can’t use it to test partitioners.
· As you saw, it’s also more labor intensive; you need to read and write the input and output data to the filesystem.
· Jobs are also slow because much of the MapReduce stack is being exercised.
· It’s tricky to use this approach to test input and output formats that aren’t file-based.
The most comprehensive way of testing your code is covered next. It uses an in-memory cluster that can run multiple mappers and reducers.
8.4.4. MiniMRYarnCluster
All of the unit-testing techniques so far have had restrictions on which parts of a MapReduce job could be tested. The LocalJobRunner, for example, only runs with a single map and reduce task, so you can’t simulate production jobs that run with multiple tasks. In this section you’ll learn about a built-in mechanism in Hadoop that allows you to exercise your job against the full-stack Hadoop.
Technique 88 Using MiniMRYarnCluster to test your jobs
The MiniMRYarnCluster class is included in the Hadoop testing code, and it supports test cases that require the complete Hadoop stack to be executed. This includes tests that need to test input and output format classes, including output committers, which can’t be tested using MRUnit orLocalTestRunner. In this technique, you’ll see how to use MiniMRYarnCluster.
Problem
You want to execute your tests against an actual Hadoop cluster, giving you the additional assurance that your jobs work as expected.
Solution
Use MiniMRYarnCluster and MiniDFSCluster, which allow you to launch in-memory YARN and HDFS clusters.
Discussion
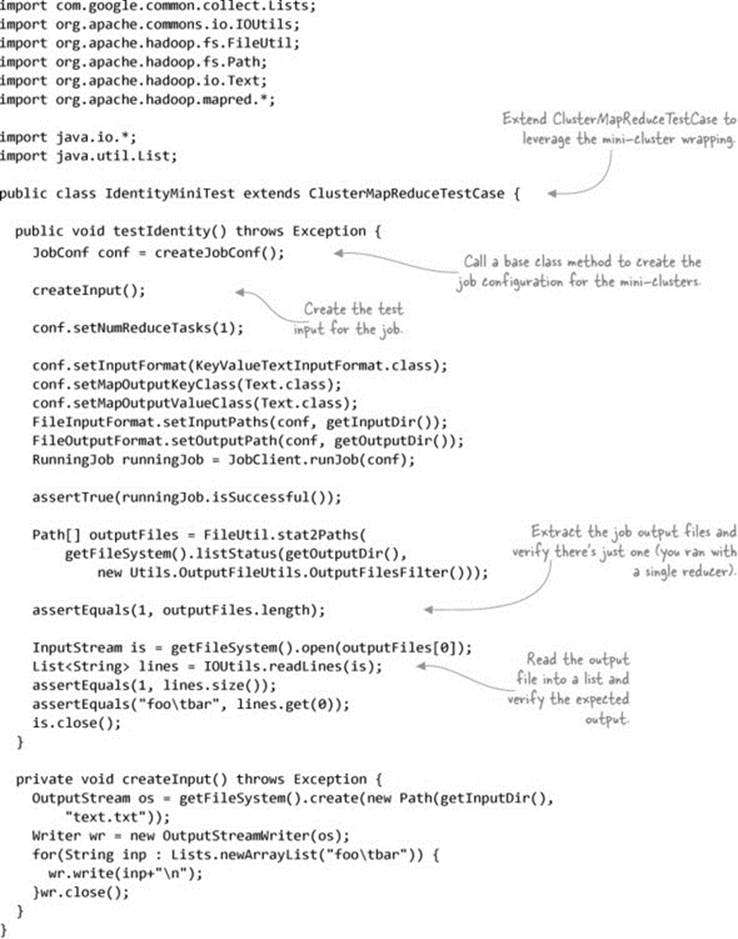
MiniMRYarnCluster and MiniDFSCluster are classes contained in Hadoop’s testing code, and are used by various tests in Hadoop. They provide in-process YARN and HDFS clusters that give you the most realistic environment within which to test your code. These classes wrap the full-fledged YARN and HDFS processes, so you’re actually running the complete Hadoop stack in your test process. Map and reduce containers are launched as processes external to the test process.
There’s a useful wrapper class called ClusterMapReduceTestCase that encapsulates these classes and makes it easy to quickly write your unit tests. The following code shows a simple test case that tests the identity mapper and reducer:[19]
19 GitHub source: https://github.com/alexholmes/hiped2/blob/master/src/test/java/hip/ch8/minimrcluster/IdentityMiniTest.java.
Summary
The only disadvantage to using the mini-clusters is the overhead of running your tests—each test class that extends ClusterMapReduceTestCase will result in a cluster being brought up and down, and each test has a considerable amount of time overhead because the full Hadoop stack is being executed.
But using the mini-clusters will provide you with the greatest assurance that your code will work as you expect in production, and it’s worth considering for jobs that are critical to your organization.
Therefore, the optimal way to test your code is to use MRUnit for simpler jobs that use built-in Hadoop input and output classes, and only use this technique for test cases where you want to test input and output classes and output committers.
8.4.5. Integration and QA testing
Using the TDD approach, you wrote some unit tests using the techniques in this section. You next wrote the MapReduce code and got it to the point where the unit tests were passing. Hooray! But before you break out the champagne, you still want assurance that the MapReduce code is working prior to running it in production. The last thing you want is your code to fail in production and have to debug it over there.
But why, you ask, would my job fail if all of my unit tests pass? Good question, and it could be due to a variety of factors:
· The data you used for your unit tests doesn’t contain all of the data aberrations and variances of the data used in production.
· Volume or data skew issues could cause side effects in your code.
· Differences in Hadoop and other libraries result in behaviors different from those in your build environment.
· Hadoop and operating system configuration differences between your build host and production may cause problems.
Because of these factors, when you build integration or QA test environments, it’s crucial to ensure that the Hadoop version and configurations mirror those of the production cluster. Different versions of Hadoop will behave differently, as will the same version of Hadoop configured in different ways. When you’re testing changes in test environments, you’ll want to ensure a smooth transition to production, so do as much as you can to make sure that the version and configuration are as close as possible to production.
After your MapReduce jobs are successfully running in integration and QA, you can push them into production, knowing there’s a much higher probability that your jobs will work as expected.
This wraps up our look at testing MapReduce code. We looked at some TDD and design principles to help you write and test your Java code, and we also covered some unit-test libraries that make it easier to unit-test MapReduce code.
8.5. Chapter summary
This chapter only scratched the surface when it comes to tuning, debugging, and testing. We laid the groundwork for how to tune, profile, debug, and test your Map-Reduce code.
For performance tuning, it’s important that you have the ability to collect and visualize the performance of your cluster and jobs. In this chapter we presented some of the more common issues that can impact the performance of your jobs.
If you’re running any critical MapReduce code in production, it’s crucial to at least follow the steps in the testing section of this chapter, where I showed you how to best design your code so it easily lends itself to basic unit-testing methodologies outside the scope of Hadoop. We also covered how the MapReduce-related parts of your code could be tested in both lightweight (MRUnit) and more heavyweight (LocalTestRunner) setups.
In part 4, we’ll venture beyond the world of MapReduce and examine various systems that allow you to interact with your data using SQL. Most SQL systems have moved beyond MapReduce to use YARN, so our last chapter looks at how to write your own YARN applications.