Oracle PL/SQL by Example, Fifth Edition (2015)
Chapter 25. Optimizing PL/SQL
In this chapter, you will learn about
![]() PL/SQL Tuning Tools
PL/SQL Tuning Tools
![]() PL/SQL Optimization Levels
PL/SQL Optimization Levels
![]() Subprogram Inlining
Subprogram Inlining
Oftentimes database developers need to improve the performance of their code when working in a complex development environment. The starting point of such exercise is usually the performance evaluation of the DML statements embedded in the PL/SQL code and their subsequent tuning. Once these statements have been improved, the tuning task is considered complete and the performance optimization of the PL/SQL code itself is usually overlooked.
In fact, Oracle provides a set of tools to help you identify performance bottlenecks and a wide variety of the optimization techniques specifically geared toward PL/SQL. For example, you have already seen how to minimize the number of context switches between PL/SQL and SQL engines and achieve better performance by employing bulk SQL and bulk binding. In this chapter, you will learn about the PL/SQL Profiler and Trace APIs, the PL/SQL Hierarchical Profiler tools, and the application of these tools to identify potential performance issues. In addition, you will learn about the PL/SQL performance optimizer and its optimization levels, and discover a new optimization technique called subprogram inlining.
Lab 25.1: PL/SQL Tuning Tools
After this lab, you will be able to
![]() Use the PL/SQL Profiler API
Use the PL/SQL Profiler API
![]() Use the Trace API
Use the Trace API
![]() Use the PL/SQL Hierarchical Profiler
Use the PL/SQL Hierarchical Profiler
As mentioned previously, Oracle provides specific tools to help you diagnose performance issues in PL/SQL code: PL/SQL Profiler API, Trace API, and PL/SQL Hierarchical Profiler. All of these tools are implemented via Oracle-supplied packages, which makes them both readily available and fairly easy to install and use.
PL/SQL Profiler API
The PL/SQL Profiler API is implemented via the DBMS_PROFILER package. It computes how much time a PL/SQL program spends on executing each line of code and saves these computed times in database tables that may be queried later.
The following scripts located in the RDBMS/ADMIN directory are required to install the PL/SQL Profiler API:
![]() PROFTAB.sql creates tables used by the profiler: PL/SQL_PROFILER_DATA, PLSQL_PROFILER_RUNS, and PLSQL_PROFILER_UNITS. This script should be executed by the STUDENT user.
PROFTAB.sql creates tables used by the profiler: PL/SQL_PROFILER_DATA, PLSQL_PROFILER_RUNS, and PLSQL_PROFILER_UNITS. This script should be executed by the STUDENT user.
![]() PROFLOAD.sql creates the DBMS_PROFILER package, and sets up synonyms and permissions for its usage. This script should be executed by the SYS user (connect as SYSDBA). The STUDENT user must be granted execute privileges on the DBMS_PROFILER package to run this script.
PROFLOAD.sql creates the DBMS_PROFILER package, and sets up synonyms and permissions for its usage. This script should be executed by the SYS user (connect as SYSDBA). The STUDENT user must be granted execute privileges on the DBMS_PROFILER package to run this script.
The main subprograms of the PL/SQL Profiler API are described in Table 25.1. More detailed information on the DBMS_PROFILER routines, exceptions, and tables may be found in the Introduction to Oracle Supplied PL/SQL Packages & Types, which is available online as part of Oracle’s documentation.
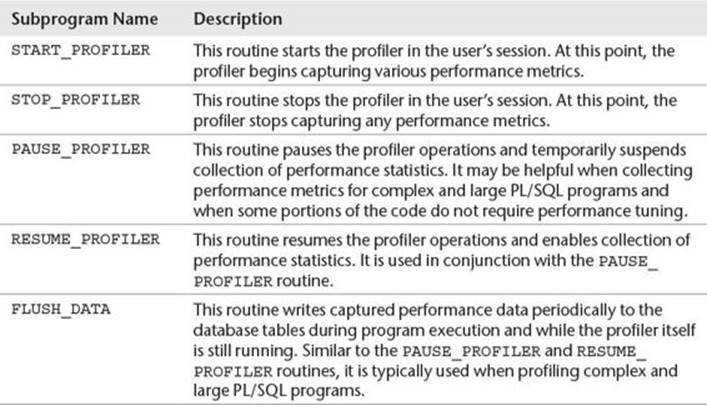
Table 25.1 DBMS_PROFILER Main Subprograms
This lab introduces the PL/SQL Profiler API, whereas Lab 25.1 demonstrates how this tool may be used to profile your code.
Trace API
The Trace API is implemented via the DBMS_TRACE package. Oftentimes this tool is used in conjunction with the PL/SQL Profiler API, as it provides an additional level of detail and context to the performance statistics captured by the profiler. The Trace API traces the order of the execution of the PL/SQL routines and saves this data in database tables that may be queried later.
The following scripts located in the RDBMS/ADMIN directory are required to install the Trace API:
![]() TRACETAB.sql creates tables used by the Trace API: PLSQL_TRACE_RUNS and PLSQL_TRACE_EVENTS. This script should be executed by the SYS user. The appropriate permissions (SELECT, INSERT, and DELETE) must be granted to the STUDENT user to run this script. You might also find it helpful to create synonyms for these tables.
TRACETAB.sql creates tables used by the Trace API: PLSQL_TRACE_RUNS and PLSQL_TRACE_EVENTS. This script should be executed by the SYS user. The appropriate permissions (SELECT, INSERT, and DELETE) must be granted to the STUDENT user to run this script. You might also find it helpful to create synonyms for these tables.
![]() The DBMS_TRACE package is usually installed as part of the default installation. However, the execute privileges may need to be granted to the STUDENT schema. This should be accomplished by the SYS user.
The DBMS_TRACE package is usually installed as part of the default installation. However, the execute privileges may need to be granted to the STUDENT schema. This should be accomplished by the SYS user.
The main subprograms of the Trace API are described in Table 25.2. More detailed information on the DBMS_TRACE routines, exceptions, and tables may be found in the Introduction to Oracle Supplied PL/SQL Packages & Types, which is available online as part of Oracle’s documentation.
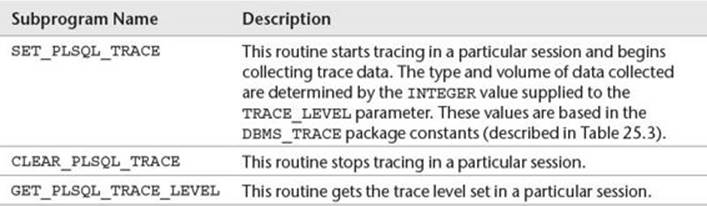
Table 25.2 DBMS_TRACE Main Subprograms
As mentioned previously, the content and volume of the trace data are based on the trace level, which is supplied when the trace starts and is based on the DBMS_TRACE constants listed in Table 25.3. A full and detailed description of the DBMS_TRACE constants may be found in the Introduction to Oracle Supplied PL/SQL Packages & Types, which is available online as part of Oracle’s documentation.
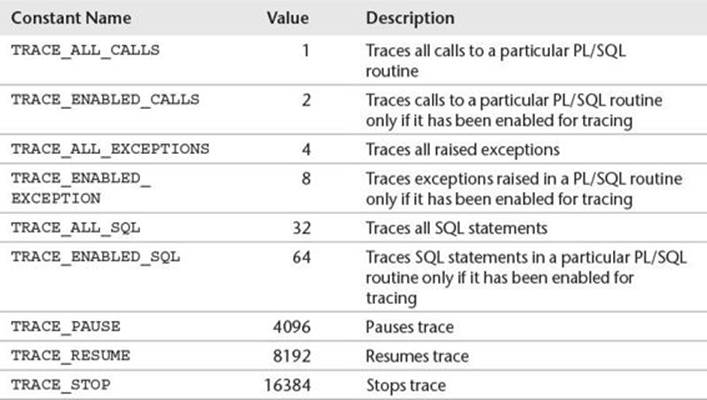
Table 25.3 DBMS_TRACE Main Constants
Tracing in PL/SQL programs can be enabled at the session level via the ALTER SESSION command or for a particular stored PL/SQL routine via the ALTER command:
ALTER SESSION SET PLSQL_DEBUG = TRUE;
or
ALTER [PROCEDURE/FUNCTION/PACKAGE] ROUTINE_NAME
COMPILE DEBUG [BODY (applicable to packages only)]
Consider the following example, which traces a simple PL/SQL procedure created specifically for this purpose:
For Example ch25_1a.sql
ALTER SESSION SET PLSQL_DEBUG = TRUE;
-- Create test procedure to be traced
CREATE OR REPLACE PROCEDURE TEST_TRACE
AS
v_num1 NUMBER;
v_num2 NUMBER;
v_num3 NUMBER;
v_date DATE;
BEGIN
FOR i IN 1..10
LOOP
v_num1 := 1;
v_num2 := i + i/2 + sqrt(i);
v_num3 := v_num1 + v_num2;
SELECT sysdate
INTO v_date
FROM DUAL;
END LOOP;
END TEST_TRACE;
/
-- Trace TEST_TRACE procedure
BEGIN
DBMS_TRACE.SET_PLSQL_TRACE (DBMS_TRACE.TRACE_ALL_CALLS);
TEST_TRACE;
DBMS_TRACE.CLEAR_PLSQL_TRACE;
END;
In this script, the database session has been enabled for tracing. As a result, the TEST_TRACE procedure created in this session is compiled with the DEBUG option and, therefore, is available for tracing as well. The execution of the newly created procedure is then traced in the PL/SQL block. Note that the level of tracing has been set via the DBMA_TRACE.TRACE_ALL_CALLS constant.
Once the procedure is created and the PL/SQL block is executed, the trace data may be examined by querying the PLSQL_TRACE_RUNS and PLSQL_TRACE_EVENTS tables as shown here:
SELECT r.runid
,e.event_seq
,e.event_unit_owner
,e.event_unit
,e.event_unit_kind
,e.proc_line
,e.event_comment
FROM plsql_trace_runs r
,plsql_trace_events e
WHERE r.runid = 1 –- this value must change based on the number of traces run
AND r.runid = e.runid
ORDER BY r.runid, e.event_seq;
RUNID EVENT EVENT EVENT_UNIT EVENT_UNIT_KIND PROC_LINE EVENT_COMMENT
SEQ UNIT_
OWNER
1 1 PL/SQL Trace Tool started
1 2 Trace flags changed
1 3 SYS DBMS_TRACE PACKAGE BODY 75 Return from procedure call
1 4 SYS DBMS_TRACE PACKAGE BODY 81 Return from procedure call
1 5 SYS DBMS_TRACE PACKAGE BODY 3 Return from procedure call
1 6 <anonymous> ANONYMOUS BLOCK 1 Procedure Call
1 7 STUDENT TEST_TRACE PROCEDURE PL/SQL Internal Call
1 8 STUDENT TEST_TRACE PROCEDURE PL/SQL Internal Call
1 9 STUDENT TEST_TRACE PROCEDURE PL/SQL Internal Call
1 10 STUDENT TEST_TRACE PROCEDURE PL/SQL Internal Call
1 11 STUDENT TEST_TRACE PROCEDURE PL/SQL Internal Call
1 12 STUDENT TEST_TRACE PROCEDURE PL/SQL Internal Call
1 13 STUDENT TEST_TRACE PROCEDURE PL/SQL Internal Call
1 14 STUDENT TEST_TRACE PROCEDURE PL/SQL Internal Call
1 15 STUDENT TEST_TRACE PROCEDURE PL/SQL Internal Call
1 16 STUDENT TEST_TRACE PROCEDURE PL/SQL Internal Call
1 17 STUDENT TEST_TRACE PROCEDURE 4 Return from procedure call
1 18 <anonymous> ANONYMOUS BLOCK 92 Procedure Call
1 19 SYS DBMS_TRACE PACKAGE BODY 69 Procedure Call
1 20 SYS DBMS_TRACE PACKAGE BODY 64 Procedure Call
1 21 SYS DBMS_TRACE PACKAGE BODY 12 Procedure Call
1 22 SYS DBMS_TRACE PACKAGE BODY 66 Return from procedure call
1 23 SYS DBMS_TRACE PACKAGE BODY 72 Return from procedure call
1 24 SYS DBMS_TRACE PACKAGE BODY 21 Procedure Call
1 25 PL/SQL trace stopped
PL/SQL Hierarchical Profiler
The PL/SQL Hierarchical Profiler is implemented via the DBMS_HPROF package. It profiles the execution of PL/SQL applications and reports on the execution times for SQL and PL/SQL separately. The Hierarchical Profiler organizes the run-time data it collects based on subprogram calls. Similarly to the PL/SQL Profiler and Trace APIs, it stores the collected statistics in database tables that may be queried later.
The following scripts located in the RDBMS/ADMIN directory are required to install the PL/SQL Hierarchical Profiler API:
![]() DBMSHPTAB.sql creates the tables used by the Hierarchical Profiler: DBMSHP_RUNS, DBMSHP_FUNCTION_INFO, and DBMSHP_PARENT_CHILD_INFO. This script may be executed by the STUDENT user.
DBMSHPTAB.sql creates the tables used by the Hierarchical Profiler: DBMSHP_RUNS, DBMSHP_FUNCTION_INFO, and DBMSHP_PARENT_CHILD_INFO. This script may be executed by the STUDENT user.
![]() The STUDENT user needs read and write privileges on the directory object and the directory itself to which the directory object is mapped. Note that these steps should be executed by the SYS user (connect as SYSDBA).
The STUDENT user needs read and write privileges on the directory object and the directory itself to which the directory object is mapped. Note that these steps should be executed by the SYS user (connect as SYSDBA).
![]() For example, if the file system includes the /plshprof/results directory, the following statement creates the directory object PLSHPROF_DIR and maps it to this directory:
For example, if the file system includes the /plshprof/results directory, the following statement creates the directory object PLSHPROF_DIR and maps it to this directory:
CREATE DIRECTORY PLSHPOF_DIR AS '/plshprof/results';
GRANT READ, WRITE ON DIRECTORY PLSHPOF_DIR TO STUDENT;
![]() The DBMS_HPROF package is usually installed as part of the default installation. However, the execute privileges may need to be granted to the STUDENT schema. This should be accomplished by the SYS user (connect as SYSDBA).
The DBMS_HPROF package is usually installed as part of the default installation. However, the execute privileges may need to be granted to the STUDENT schema. This should be accomplished by the SYS user (connect as SYSDBA).
The main subprograms of the PL/SQL Hierarchical Profiler are described in Table 25.4. More detailed information on the DBMS_HPROF routines, exceptions, and tables may be found in the Introduction to Oracle Supplied PL/SQL Packages & Types, which is available online as part of Oracle’s documentation.
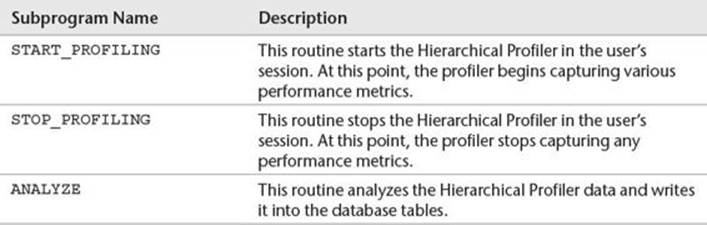
Table 25.4 DBMS_HPROF Main Subprograms
Use of the PL/SQL Hierarchical Profiler is demonstrated in Lab 25.3.
Lab 25.2: PL/SQL Optimization Levels
After this lab, you will be able to
![]() Understand PL/SQL Optimization Levels
Understand PL/SQL Optimization Levels
In version 10g, Oracle introduced a new feature to PL/SQL compiler, called the performance optimizer. Essentially, the optimizer enables the PL/SQL compiler to reorganize source code to enhance its performance. The level of optimization that compiler applies to the code is controlled by the PLSQL_OPTIMIZE_LEVEL parameter, which may be set at the instance or session level. These levels of optimization are listed in the Table 25.5.
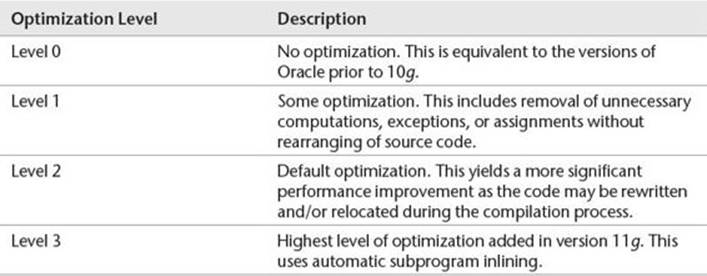
Table 25.5 PL/SQL Optimization Levels
To illustrate how PL/SQL code performance is affected by different optimization levels, consider a simple example that executes a numeric FOR LOOP and performs some meaningless calculations. It is executed with PLSQL_OPTIMIZE_LEVEL set to 0, 1, and 2, respectively. In addition, it uses the PL/SQL Profiler so that you can get a closer look at how and where the performance actually occurs. Note that the line numbers listed in the example are provided for future reference and are not part of the actual PL/SQL code. The SET TIMING ON command enables Oracle to measure and display the execution time of the script. The ALTER SESSION command sets the PL_SQL_OPTIMIZE level variable to a specified value at the session level.
Watch Out!
Prior to running examples used in this lab, the STUDENT schema should be enabled to use the PL/SQL Profiler API as described in Lab 25.1.
For Example ch25_2a.sql
SET TIMING ON;
ALTER SESSION SET PLSQL_OPTIMIZE_LEVEL = 0;
1 DECLARE
2 v_num1 NUMBER;
3 v_num2 NUMBER;
4 v_num3 NUMBER;
5 v_run_id BINARY_INTEGER; -- run ID generated by the profiler
6 BEGIN
7 DBMS_PROFILER.START_PROFILER ('Optimizer level at 0');
8
9 FOR i IN 1..1000000
10 LOOP
11 v_num1 := 1;
12 v_num2 := i + i/2 + sqrt(i);
13 v_num3 := v_num1 + v_num2;
14 END LOOP;
15
16 DBMS_PROFILER.STOP_PROFILER();
17
18 SELECT runid
19 INTO v_run_id
20 FROM plsql_profiler_runs
21 WHERE run_comment = 'Optimizer level at 0';
22
23 DBMS_OUTPUT.PUT_LINE ('Optimizer level at 0, run ID - '||v_run_id);
24 END;
As mentioned previously, this script performs some worthless calculations and employs the PL/SQL Profiler API to collect runtime statistics. To analyze these run-time statistics, it defines the v_run_id variable to store the ID of the profiler run. This ID is selected from thePLSQL_PROFILER_RUNS table and displayed at the end of the script. The profiler runtime data collection starts with the DBMS_PROFILER.START_PROFILER procedure and ends with the DBMS_PROFILER.STOP_PROFILER procedure.
When run, the script produces the following output:
Elapsed: 00:00:03.317
Optimizer level at 0, run ID - 1
The first line of the output is shown in the Script Output window when this script is executed in the SQL Developer. For the second run, the PLSQL_OPTIMIZE_LEVEL is set to 1 and the script is modified as shown. All changes are highlighted in bold.
For Example ch25_2b.sql
SET TIMING ON;
ALTER SESSION SET PLSQL_OPTIMIZE_LEVEL = 1;
1 DECLARE
2 v_num1 NUMBER;
3 v_num2 NUMBER;
4 v_num3 NUMBER;
5 v_run_id BINARY_INTEGER; -- run ID generated by the profiler
6 BEGIN
7 DBMS_PROFILER.START_PROFILER ('Optimizer level at 1');
8
9 FOR i IN 1.. 1000000
10 LOOP
11 v_num1 := 1;
12 v_num2 := i + i/2 + sqrt(i);
13 v_num3 := v_num1 + v_num2;
14 END LOOP;
15
16 DBMS_PROFILER.STOP_PROFILER();
17
18 SELECT runid
19 INTO v_run_id
20 FROM plsql_profiler_runs
21 WHERE run_comment = 'Optimizer level at 1';
22
23 DBMS_OUTPUT.PUT_LINE ('Optimizer level at 1, run ID - '||v_run_id);
24 END;
When run, this version produces the following output:
Elapsed: 00:00:03.103
Optimizer level at 1, run ID – 2
Note that there is a very negligible performance gain between the two runs.
Next, consider yet another version of the example where PLSQL_OPTIMIZE_LEVEL is set to 2 and the PL/SQL block is modified accordingly. Affected statements are highlighted in bold.
For Example ch25_2c.sql
SET TIMING ON;
ALTER SESSION SET PLSQL_OPTIMIZE_LEVEL = 2;
1 DECLARE
2 v_num1 NUMBER;
3 v_num2 NUMBER;
4 v_num3 NUMBER;
5 v_run_id BINARY_INTEGER; -- run ID generated by the profiler
6 BEGIN
7 DBMS_PROFILER.START_PROFILER ('Optimizer level at 2');
8
9 FOR i IN 1.. 1000000
10 LOOP
11 v_num1 := 1;
12 v_num2 := i + i/2 + sqrt(i);
13 v_num3 := v_num1 + v_num2;
14 END LOOP;
15
16 DBMS_PROFILER.STOP_PROFILER();
17
18 SELECT runid
19 INTO v_run_id
20 FROM plsql_profiler_runs
21 WHERE run_comment = 'Optimizer level at 2';
22
23 DBMS_OUTPUT.PUT_LINE ('Optimizer level at 2, run ID - '||v_run_id);
24 END;
When run, this version produces the following output:
Elapsed: 00:00:02.562
Optimizer level at 2, run ID - 3
With the PLSQL_OPTIMIZE_LEVEL set to 2, the gain in performance is more noticeable.
What has happened since the optimization level was changed from 0 to 1 to 2? To answer this question, let’s examine data generated by the PL/SQL Profiler:
SELECT r.runid, r.run_comment, d.line#, d.total_occur, d.total_time
FROM plsql_profiler_runs r
,plsql_profiler_data d
,plsql_profiler_units u
WHERE r.runid = d.runid
AND d.runid = u.runid
AND d.unit_number = u.unit_number
AND d.total_occur > 0
ORDER BY d.runid, d.line#;
RUNID RUN_COMMENT LINE# TOTAL_OCCUR TOTAL_TIME
----- -------------------- ----- ----------- ----------
1 Optimizer level at 0 9 1000001 128784207
1 Optimizer level at 0 11 1000000 204515328
1 Optimizer level at 0 12 1000000 1928730621
1 Optimizer level at 0 13 1000000 235407659
1 Optimizer level at 0 14 1 0
1 Optimizer level at 0 16 1 13032
2 Optimizer level at 1 9 1000001 122832257
2 Optimizer level at 1 11 1000000 143920674
2 Optimizer level at 1 12 1000000 1820567385
2 Optimizer level at 1 13 1000000 181771219
2 Optimizer level at 1 14 1 0
2 Optimizer level at 1 16 1 12000
3 Optimizer level at 2 9 1000001 134848732
3 Optimizer level at 2 11 1000000 0
3 Optimizer level at 2 12 1000000 1583962321
3 Optimizer level at 2 13 1000000 188121402
3 Optimizer level at 2 16 1 10015
The SELECT statement selects data from the PL/SQL profiler tables for each line of the code that was executed (d.total_occur > 0). Take a closer look at the data generated for line 11 (highlighted in bold). Line 11 corresponds to the assignment statement
11 v_num1 := 1;
in the body of the numeric FOR LOOP. Note that even though line 11 is executed 1 million times for run IDs 1 and 2 (optimization levels 0 and 1, respectively), there is a performance gain shown in the TOTAL_TIME column. Next, take a look at line 11 for run ID 3 (optimization level 2). Although the TOTAL_OCCUR column states that the assignment statement has executed 1 million times, the total time spent on this operation was 0. How is that possible?
Recall that setting the optimization level to 2 enables code relocation and rewriting. Thus it is possible that the assignment operation at line 11 was relocated outside the loop, or that variable v_num1 was removed all together and its value was substituted on line 13. So, the original statement
13 v_num3 := v_num1 + v_num2;
could have become
13 v_num3 := 1 + v_num2;
Another important optimization technique introduced for optimization level 2 is implicit bulk fetches for static CURSOR FOR LOOPs with a limit of 100 records. Thus, if a piece of code fetches and processes records in the CURSOR FOR LOOP one at time, with level 2 optimization the records will be fetched in a bulk, 100 records at a time. This approach yields a significant performance improvement, as demonstrated by the following example.
For Example ch25_3a.sql
SET TIMING ON;
-- Create test table
CREATE TABLE TEST_TAB
(col1 NUMBER);
/
-- Populate newly created table with random data
INSERT INTO TEST_TAB
SELECT ROUND(DBMS_RANDOM.VALUE (1, 99999999), 0)
FROM dual
CONNECT by level < 100001;
COMMIT;
-- Collect statistics
EXEC DBMS_STATS.GATHER_TABLE_STATS (user, 'TEST_TAB');
-- Run the same code sample with different optimization levels
ALTER SESSION SET PLSQL_OPTIMIZE_LEVEL = 1;
BEGIN
FOR rec IN (SELECT col1 FROM test_tab)
LOOP
null; -- do nothing
END LOOP;
END;
/
ALTER SESSION SET PLSQL_OPTIMIZE_LEVEL = 2;
BEGIN
FOR REC IN (SELECT col1 FROM test_tab)
LOOP
NULL; -- do nothing
END LOOP;
END;
/
First, this script creates the TEST_TAB table. Then, it populates the TES_TAB table with some random numeric data and gathers table statistics via the DBMS_STATS.GATHER_TABLE_STATS procedure.
Did You Know?
That DBMS_STATS package is used to gather various statistics on database objects. These statistics may be gathered for one database object at a time, as in the preceding example, or for all objects in the database or schema.
Next, the script sets optimizer level to 1, and executes the CURSOR FOR LOOP against the TEST_TAB table. Note the usage of the NULL; statement in the body of the loop. Essentially, it means that nothing is done in the body of the loop. Finally, the script sets the optimizer level to 2 and executes the CURSOR FOR LOOP again.
When run, this example produces the following output:
table TEST_TAB created.
Elapsed: 00:00:00.060
100,000 rows inserted.
Elapsed: 00:00:01.595
committed.
Elapsed: 00:00:00.016
anonymous block completed
session SET altered.
Elapsed: 00:00:00.001
anonymous block completed
Elapsed: 00:00:00.767
session SET altered.
Elapsed: 00:00:00.002
anonymous block completed
Elapsed: 00:00:00.080
Take a closer look at the elapsed times highlighted in bold. The execution time went from .767 to .080. This is a significant improvement for such a simple script. Next, consider expanding on this example by creating a new table TEST_TAB1 and populating it in the CURSOR FOR LOOP. Much like the preceding example, this version is executed for optimizer levels 1 and 2.
For Example ch25_4a.sql
SET TIMING ON;
-- Create test table
CREATE TABLE test_tab1 (col1 NUMBER);
/
-- Run the same code sample with different optimization levels
ALTER SESSION SET PLSQL_OPTIMIZE_LEVEL = 1;
BEGIN
FOR rec IN (SELECT col1 FROM test_tab)
LOOP
INSERT INTO TEST_TAB1 VALUES (rec.col1); -- populate newly created table
END LOOP;
END;
/
ALTER SESSION SET PLSQL_OPTIMIZE_LEVEL = 2;
BEGIN
FOR REC IN (SELECT col1 FROM test_tab)
LOOP
INSERT INTO TEST_TAB1 VALUES (rec.col1); -- populate newly created table
END LOOP;
END;
/
This example produces the following output:
table TEST_TAB1 created.
Elapsed: 00:00:00.059
session SET altered.
Elapsed: 00:00:00.001
anonymous block completed
Elapsed: 00:00:10.683
session SET altered.
Elapsed: 00:00:00.002
anonymous block completed
Elapsed: 00:00:09.668
As soon as the INSERT statement has been added to the body of the loop, the major performance gain between two optimization levels is lost. This is due to lack of implicit optimization for the DML statements. In this case, better performance is gained by changing the script and adding bulk SQL optimization techniques (covered in Chapter 18).
The last two examples demonstrate very clearly that while it is helpful to recognize that PL/SQL optimization may occur behind the scenes, it is not a good idea to rely exclusively on it. While sometimes the code you create may be optimized at the time of compilation, it is much better to go through the optimization exercise and change that code explicitly based on the performance findings.
Lab 25.3: Subprogram Inlining
After this lab, you will be able to
![]() Use Subprogram Inlining
Use Subprogram Inlining
In Lab 25.2, you learned about different PL/SQL optimization levels. Specifically, you saw examples with optimization levels of 0, 1, and 2. In this lab, you will learn about the concept of subprogram inlining and discover how it is used with optimization level 3.
In the PL/SQL Language Reference, subprogram inlining concept is defined as follows: “Subprogram inlining replaces a subprogram invocation with a copy of the invoked subprogram (if the invoked and invoking subprograms are in the same program unit).” Subprogram inlining may be enabled either by using the PRAGMA statement or by setting PLSQL_OPTIMIZE_LEVEL to 3 as shown in Listing 25.1.
Listing 25.1 Enabling Subprogram Inlining
PRAGMA INLINE (subprogram_name, 'YES');
or
ALTER SESSION SET PLSQL_OPTIMIZE_LEVEL = 3;
When a PRAGMA INLINE statement is used, it should appear prior to each subprogram call. Recall that PLSQL_OPTIMIZE_LEVEL may be set to a particular value at the instance level as well. When PLSQL_OPTIMIZE_LEVEL is set to 3, subprogram inlining is done automatically.
The usage of subprogram inlining and the performance gains associated with it are best illustrated by examining some examples. In these scripts, the same PL/SQL code is executed twice. For both runs, the PL/SQL optimization level remains at 2, but subprogram inlining is enabled for the second run only. The line numbers in the examples are provided for future reference and are not part of the actual PL/SQL code.
Watch Out!
Prior to running the examples in this lab, the STUDENT schema should be extended to use the PL/SQL Hierarchical Profiler. The necessary steps are described in Lab 25.1.
For Example ch25_5a.sql
SET TIMING ON;
ALTER SESSION SET PLSQL_OPTIMIZE_LEVEL = 2;
1 DECLARE
2 v_num PLS_INTEGER;
3 v_run_id BINARY_INTEGER; -- run ID generated by the profiler
4
5 FUNCTION test_func (num1 IN PLS_INTEGER
6 ,num2 IN PLS_INTEGER)
7 RETURN PLS_INTEGER
8 IS
9 BEGIN
10 RETURN (num1 + num2);
11 END test_func;
12
13 BEGIN
14 DBMS_HPROF.START_PROFILING ('PLSHPROF_DIR', 'test.txt');
15 FOR i IN 1..100000
16 LOOP
17 v_num := test_func (i-1, i);
18 END LOOP;
19 DBMS_HPROF.STOP_PROFILING;
20
21 -- Analyze profiler output and display its run ID
22 v_run_id := DBMS_HPROF.ANALYZE ('PLSHPROF_DIR', 'test.txt');
23 DBMS_OUTPUT.PUT_LINE ('Inline pragma is not enabled, run ID - '||v_run_id);
24 END;
This script defines a function test_func that returns the sum of two numbers. This function is then invoked in the body of the numeric FOR LOOP, where its result is assigned to the variable v_num. The execution of loop is profiled by the PL/SQL Hierarchical Profiler. The profiler writes its raw data into the file called test.txt located in the /plshprof/results/ directory. Finally, the profiler output is analyzed and recorded in its tables, and the run ID is displayed on the screen for later reference.
When run, this version of the example produces the following output:
session SET altered.
Elapsed: 00:00:00.001
Inline pragma is not enabled, run ID - 1
Elapsed: 00:00:00.602
Next, consider the modified version of the example in which subprogram inlining is enabled. Changes are highlighted in bold.
For Example ch25_5b.sql
SET TIMING ON;
ALTER SESSION SET PLSQL_OPTIMIZE_LEVEL = 2;
1 DECLARE
2 v_num PLS_INTEGER;
3 v_run_id BINARY_INTEGER; -- run ID generated by the profiler
4
5 FUNCTION test_func (num1 IN PLS_INTEGER
6 ,num2 IN PLS_INTEGER)
7 RETURN PLS_INTEGER
8 IS
9 BEGIN
10 RETURN (num1 + num2);
11 END test_func;
12
13 BEGIN
14 DBMS_HPROF.START_PROFILING ('PLSHPROF_DIR', 'test.txt');
15 FOR i IN 1..100000
16 LOOP
17 -- Inline pragma is enabled for each function call
18 PRAGMA INLINE (test_func, 'YES');
19 v_num := test_func (i-1, i);
20 END LOOP;
21 DBMS_HPROF.STOP_PROFILING;
22
23 -- Analyze profiler output and display its run ID
24 v_run_id := DBMS_HPROF.ANALYZE ('PLSHPROF_DIR', 'test.txt');
25 DBMS_OUTPUT.PUT_LINE ('Inline pragma is enabled, run ID - '||v_run_id);
26 END;
When run, this version of the example produces the following output:
session SET altered.
Elapsed: 00:00:00.001
Inline pragma is enabled, run ID – 2
Elapsed: 00:00:00.073
Note how much performance has been gained in the second run by adding the PRAGMA INLINE statement without changing the PL/SQL optimization level.
As mentioned previously, when the PL/SQL optimization level is set to 2, subprogram inlining must be enabled explicitly prior to each subprogram call. Hence, if the PRAGMA INLINE statement was placed outside the loop, subprogram inlining would not occur. This is demonstrated by the next example. Affected statements are shown in bold.
For Example ch25_5c.sql
SET TIMING ON;
ALTER SESSION SET PLSQL_OPTIMIZE_LEVEL = 2;
1 DECLARE
2 v_num PLS_INTEGER;
3 v_run_id BINARY_INTEGER; -- run ID generated by the profiler
4
5 FUNCTION test_func (num1 IN PLS_INTEGER
6 ,num2 IN PLS_INTEGER)
7 RETURN PLS_INTEGER
8 IS
9 BEGIN
10 RETURN (num1 + num2);
11 END test_func;
12
13 BEGIN
14 DBMS_HPROF.START_PROFILING ('PLSHPROF_DIR', 'test.txt');
15
16 -- Inline pragma is moved outside the loop
17 PRAGMA INLINE (test_func, 'YES');
18 FOR i IN 1..100000
19 LOOP
20 v_num := test_func (i-1, i);
21 END LOOP;
22 DBMS_HPROF.STOP_PROFILING;
23
24 -- Analyze profiler output and display its run ID
25 v_run_id := DBMS_HPROF.ANALYZE ('PLSHPROF_DIR', 'test.txt');
26 DBMS_OUTPUT.PUT_LINE
27 ('Inline pragma is enabled for a single call, run ID - '||v_run_id);
28 END;
When run, this version of the script produces the following output:
session SET altered.
Elapsed: 00:00:00.001
Inline pragma is enabled for a single call, run ID - 3
Elapsed: 00:00:00.490
As you can see, we have lost almost all of the performance gain.
Since each example run was profiled and analyzed, let’s see what information the PL/SQL Hierarchical Profiler has gathered:
SELECT runid, function, line#, calls, subtree_elapsed_time s_e_t
,function_elapsed_time f_e_t
FROM dbmshp_function_info;
RUNID FUNCTION LINE# CALLS S_E_T F_E_T
----- --------------------------- ----- ------ ------ ----------
1 __anonymous_block.TEST_FUNC 5 100000 17461 17461
1 STOP_PROFILING 63 1 0 0
2 STOP_PROFILING 63 1 0 0
3 __anonymous_block.TEST_FUNC 5 100000 18327 18327
3 STOP_PROFILING 63 1 0 0
For run IDs 1 and 3, test_func was executed 100,000 times; in contrast, for run ID 2, there is no reference to test_func. In effect, at the time of compilation the code is revised to look like the following example (all changes are shown in bold):
For Example ch25_5d.sql
SET TIMING ON;
ALTER SESSION SET PLSQL_OPTIMIZE_LEVEL = 2;
1 DECLARE
2 v_num PLS_INTEGER;
3 v_run_id BINARY_INTEGER; -- run ID generated by the profiler
4
5 BEGIN
6 DBMS_HPROF.START_PROFILING ('PLSHPROF_DIR', 'test.txt');
7 FOR i IN 1..100000
8 LOOP
9 v_num := i-1 + i; -- there is no reference to test_func
10 END LOOP;
11 DBMS_HPROF.STOP_PROFILING;
12
13 -- Analyze profiler output and display its run ID
14 v_run_id := DBMS_HPROF.ANALYZE ('PLSHPROF_DIR', 'test.txt');
15 DBMS_OUTPUT.PUT_LINE ('Inline pragma is enabled, run ID - '||v_run_id);
16 END;
As mentioned previously, setting the optimizer level to 3 ensures implicit subprogram inlining whenever possible. This is demonstrated by the next example (modified statements are shown in bold):
For Example ch25_5e.sql
SET TIMING ON;
ALTER SESSION SET PLSQL_OPTIMIZE_LEVEL = 3;
1 DECLARE
2 v_num PLS_INTEGER;
3 v_run_id BINARY_INTEGER; -- run ID generated by the profiler
4
5 FUNCTION test_func (num1 IN PLS_INTEGER
6 ,num2 IN PLS_INTEGER)
7 RETURN PLS_INTEGER
8 IS
9 BEGIN
10 RETURN (num1 + num2);
11 END test_func;
12
13 BEGIN
14 DBMS_HPROF.START_PROFILING ('PLSHPROF_DIR', 'test.txt');
15
16 FOR i IN 1..100000
17 LOOP
18 v_num := test_func (i-1, i);
19 END LOOP;
20 DBMS_HPROF.STOP_PROFILING;
21
22 -- Analyze profiler output and display its run ID
23 v_run_id := DBMS_HPROF.ANALYZE ('PLSHPROF_DIR', 'test.txt');
24 DBMS_OUTPUT.PUT_LINE ('Inline pragma is enabled implicitly, run ID - '||v_run_id);
25 END;
In this version, PLSQL_OPTIMIZE_LEVEL has been set to 3 and the PL/SQL compiler is able to perform subprogram inlining explicitly. This is demonstrated by the script’s output:
session SET altered.
Elapsed: 00:00:00.001
Inline pragma is enabled implicitly, run ID - 4
Elapsed: 00:00:00.065
As you can see, based on the elapsed time, it seems that the compiler has performed subprogram inlining. This fact can be confirmed by examining the data produced by the PL/SQL Hierarchical Profiler:
SELECT runid, function, line#, calls, subtree_elapsed_time s_e_t
,function_elapsed_time f_e_t
FROM dbmshp_function_info
WHERE runid = 4;
RUNID FUNCTION LINE# CALLS S_E_T F_E_T
----- --------------------------- ----- ------ ------ ----------
4 STOP_PROFILING 63 1 0 0
When the optimization level is set to 2 and subprogram inlining is specified for a particular function/procedure, this feature does not propagate to the procedures/functions that are being called from it. In other words, if subprogram inlining is enabled for procedure P1, and it references functions F1 and F2, these functions are not enabled for inlining. This concept is illustrated further by the next example.
For Example ch25_6a.sql
SET TIMING ON;
ALTER SESSION SET PLSQL_OPTIMIZE_LEVEL = 2;
1 DECLARE
2 v_run_id BINARY_INTEGER; -- run ID generated by the profiler
3
4 FUNCTION f1 (num1 IN PLS_INTEGER
5 ,num2 IN PLS_INTEGER)
6 RETURN PLS_INTEGER
7 IS
8 BEGIN
9 RETURN (num1 + num2);
10 END f1;
11
12 FUNCTION f2 (str1 IN VARCHAR2
13 ,str2 IN VARCHAR2)
14 RETURN VARCHAR2
15 IS
16 BEGIN
17 RETURN (str1||' '||str2);
18 END f2;
19
20 PROCEDURE p1 (num1 IN PLS_INTEGER
21 ,num2 IN PLS_INTEGER
22 ,str1 IN VARCHAR2
23 ,str2 IN VARCHAR2)
24 IS
25 v_num NUMBER;
26 v_str VARCHAR2(100);
27 BEGIN
28 v_num := f1(num1, num2);
29 v_str := f2(str1, str2);
30 END p1;
31
32 BEGIN
33 DBMS_HPROF.START_PROFILING ('PLSHPROF_DIR', 'test.txt');
34 FOR i in 1..100000
35 LOOP
36 -- Inline pragma is enabled for each procedure call
37 PRAGMA INLINE (p1, 'YES');
38 p1 (i-1, i, to_char(i-1), to_char(i));
39 END LOOP;
40 DBMS_HPROF.STOP_PROFILING;
41
42 -- Analyze profiler output
43 v_run_id := DBMS_HPROF.ANALYZE ('PLSHPROF_DIR', 'test.txt');
44 DBMS_OUTPUT.PUT_LINE ('Inline pragma is enabled, run ID - '||v_run_id);
45 END;
In this example, there are two functions, f1 and f2. These functions are called by the procedure p1, which in turn is called inside the numeric FOR LOOP. Note that subprogram inlining has been explicitly enabled for each procedure call. This example produces the following output:
session SET altered.
Elapsed: 00:00:00.001
Inline pragma is enabled, run ID - 5
Elapsed: 00:00:01.179
The PL/SQL Hierarchical Profiler reports these runtime statistics:
SELECT runid, function, line#, calls, subtree_elapsed_time s_e_t
,function_elapsed_time f_e_t
FROM dbmshp_function_info
WHERE runid = 5;
RUNID FUNCTION LINE# CALLS S_E_T F_E_T
----- --------------------------- ----- ------ ------ ----------
5 __anonymous_block.F1 4 100000 20595 20595
5 __anonymous_block.F2 12 100000 42010 42010
5 STOP_PROFILING 63 1 0 0
To enable subprogram inlining for functions f1 and f2, PLSQL_OPTIMIZE_LEVEL should be set to 3 or a PRAGMA INLINE statement should be executed prior to the functions’ invocations. When the optimization level is set to 3, the script produces this output:
session SET altered.
Elapsed: 00:00:00.001
Inline pragma is enabled, run ID - 6
Elapsed: 00:00:00.042
The PL/SQL Hierarchical Profiler reports these statistics:
SELECT runid, function, line#, calls, subtree_elapsed_time s_e_t
,function_elapsed_time f_e_t
FROM dbmshp_function_info
WHERE runid = 6;
RUNID FUNCTION LINE# CALLS S_E_T F_E_T
----- --------------------------- ----- ------ ------ ----------
6 STOP_PROFILING 63 1 0 0
When PL/SQL code contains embedded SQL statements, performance gains due to subprogram inlining become negligible. This is because oftentimes SQL statements are the main consumers of the execution time. Consider a modified version of the preceding example, where SELECT INTO statements have been added to the functions f1 and f2. All changes are shown in bold.
For Example ch25_6b.sql
SET TIMING ON;
ALTER SESSION SET PLSQL_OPTIMIZE_LEVEL = 3;
1 DECLARE
2 v_run_id BINARY_INTEGER; -- run ID generated by the profiler
3
4 FUNCTION f1 (num1 IN PLS_INTEGER
5 ,num2 IN PLS_INTEGER)
6 RETURN PLS_INTEGER
7 IS
8 v_num PLS_INTEGER;
9 BEGIN
10 SELECT num1 + num2
11 INTO v_num
12 FROM dual;
13 RETURN v_num;
14 END f1;
15
16 FUNCTION f2 (str1 IN VARCHAR2
17 ,str2 IN VARCHAR2)
18 RETURN VARCHAR2
19 IS
20 v_srt VARCHAR2(50);
21 BEGIN
22 SELECT str1||' '||str2
23 INTO v_str
24 FROM dual;
25 RETURN (v_str);
26 END f2;
27
28 PROCEDURE p1 (num1 IN PLS_INTEGER
29 ,num2 IN PLS_INTEGER
30 ,str1 IN VARCHAR2
31 ,str2 IN VARCHAR2)
32 IS
33 v_num NUMBER;
34 v_str VARCHAR2(100);
35 BEGIN
36 v_num := f1(num1, num2);
37 v_str := f2(str1, str2);
38 END p1;
39
40 BEGIN
41 DBMS_HPROF.START_PROFILING ('PLSHPROF_DIR', 'test.txt');
42 FOR i in 1..100000
43 LOOP
44 p1 (i-1, i, to_char(i-1), to_char(i));
45 END LOOP;
46 DBMS_HPROF.STOP_PROFILING;
47
48 -- Analyze profiler output
49 v_run_id := DBMS_HPROF.ANALYZE ('PLSHPROF_DIR', 'test.txt');
50 DBMS_OUTPUT.PUT_LINE ('Inline pragma is enabled, run ID - '||v_run_id);
51 END;
When run, the script produces the following output:
session SET altered.
Elapsed: 00:00:00.001
Inline pragma is enabled, run ID - 7
Elapsed: 00:00:06.156
Note how the elapsed time has increased from .042 to 6.156, even though the optimization level was set to 3 for both runs. The PL/SQL Hierarchical Profiler reports these statistics for run ID 7:
SELECT runid, function, line#, calls, subtree_elapsed_time s_e_t
,function_elapsed_time f_e_t
FROM dbmshp_function_info
WHERE runid = 7;
RUNID FUNCTION LINE# CALLS S_E_T F_E_T
----- --------------------------- ----- ------ ------- ----------
7 __static_sql_exec_line 44 200000 4382821 4382821
7 STOP_PROFILING 63 1 0 0
The PL/SQL optimizer was able to apply subprogram inlining, but performance was not gained due to the SQL statement that was executed on line 44. As expected, each SQL statement was executed 100,000 times, thereby increasing the overall execution time significantly. The results of this run also highlight that in this particular case, relocating the SELECT INTO statements from functions f1 and f2 inside the body of the loop would not have improved performance.
Summary
In this chapter, you learned about PL/SQL optimization levels and saw how the PL/SQL compiler optimizes code based on these levels. In addition, you explored the concept of subprogram inlining and considered in which instances it may be used to improve performance of PL/SQL code. Finally, you learned how to gather and interpret PL/SQL runtime statistics with the PL/SQL Profiler API and PL/SQL Hierarchical Profiler. Combining these optimization techniques with the optimization methods such as bulk SQL allows you to create robust and performant code.
All materials on the site are licensed Creative Commons Attribution-Sharealike 3.0 Unported CC BY-SA 3.0 & GNU Free Documentation License (GFDL)
If you are the copyright holder of any material contained on our site and intend to remove it, please contact our site administrator for approval.
© 2016-2026 All site design rights belong to S.Y.A.