MySQL Stored Procedure Programming (2009)
Part IV. Optimizing Stored Programs
Chapter 19. Tuning Stored Programs and Their SQL
This chapter kicks off the set of chapters in this book that are concerned with optimizing the performance of your stored programs. Like any program, a stored program might be correct in all of its functional aspects, but still be considered a failure if it does not perform well. Performance tuning of MySQL stored programs is of particular importance because the stored program language is interpreted, and thus it does not benefit from the performance improvements that can be obtained by optimizing compilers such as the ones common in languages such as C and Java. (Strictly speaking, Java is also an interpreted language, but the Java JVM performs a number of sophisticated optimizations.) Stored programs also almost always involve significant database activity and therefore are quite likely to become a performance bottleneck for the application as a whole.
We believe that there are three main principles of stored program optimization:
Optimize SQL
The SQL inside of a stored program must be optimized if the stored program has any chance of running efficiently. Untuned SQL statements can easily take hundreds or even thousands of times longer to return results than well-tuned SQL statements, so we therefore recommend tuning the SQL inside a stored program before tuning the stored program code itself. We'll look at SQL tuning in detail in the next few chapters.
Break up complex SQL
Sometimes you can use stored programs to break up complex and hard-to-tune SQL statements into distinct, smaller statements that are easier to tune individually—both for the MySQL optimizer (the part of MySQL that determines how SQL should be executed) and for the programmer who is trying to tune the SQL. We'll look at these cases in Chapter 22.
Perform non-SQL optimization
Finally, optimizations that are common and well known in other programming languages also apply to the MySQL stored program language. Loop structures, use of recursion, caching, and branching structures can all affect how fast the SQL will run. We'll examine how to optimize the non-SQL stored program code in detail in Chapter 22.
In this chapter, we provide a brief overview of the way in which MySQL processes SQL statements, review the tuning tools at our disposal, and provide a brief overview of tuning. In subsequent chapters we will delve more deeply into the tuning of stored programs and the SQL statements they contain.
Why SQL Tuning Is So Important
It might be surprising to you that a book dedicated to stored programming has such extensive coverage of SQL tuning . The reason for this is simple: we regard SQL tuning as an essential skill for anyone writing MySQL stored programs. The simple fact is this:
The vast majority of your stored program execution time is going to be spent executing SQL statements.
Furthermore, poorly tuned (or untuned) SQL can result in programs that are slower by orders of magnitude (e.g., thousands of times slower). Finally, untuned SQL almost never scales well as data volumes increase, so even if your program seems to run in a reasonable amount of time today, ignoring SQL statement tuning now can result in major problems later.
An Instructive Example
The following example demonstrates just how critical the role of SQL tuning is in overall system performance. An application executes a query (which might even be implemented within a stored program) that involves a simple join between two tables, as shown here:
SELECT sum(sale_value)
FROM ta_10000 a,tb_10000 b
WHERE a.sales_id=b.sales_id;
The tables grow in size with each day'accumulation s of data. Initial performance is satisfactory, but within a few days performance is questionable, and within a week the application is virtually unusable. You are called in to examine the situation. When you examine the relationship between table size and elapsed time, you discover the relationship shown in Figure 19-1.
Not only is the performance of the query growing worse as the tables grow, but the rate of increase is itself accelerating. Extrapolating the performance trend, you predict that by the time the tables reach their estimated peak sizes of 1,000,000 rows each, the join will take more than 20 hours to complete!
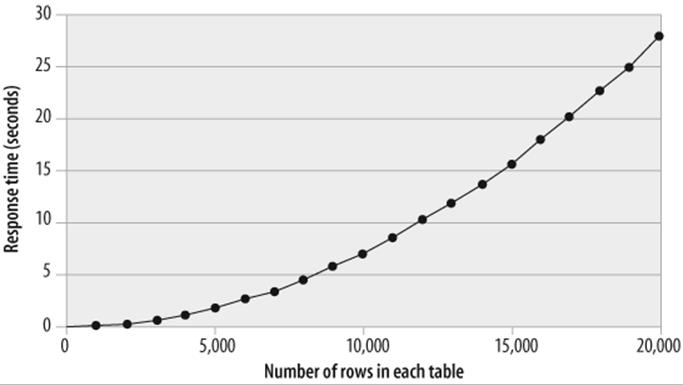
Figure 19-1. Response time and table row counts—before tuning
After examining the SQL statements involved in the application, the problem—and the solution—seems obvious. An index is needed to support the join, and you can create one with the following statement:
CREATE INDEX i_tb_1000 ON tb_1000 (sales_id)
Once the index is created, the performance trend adopts the profile shown in Figure 19-2.
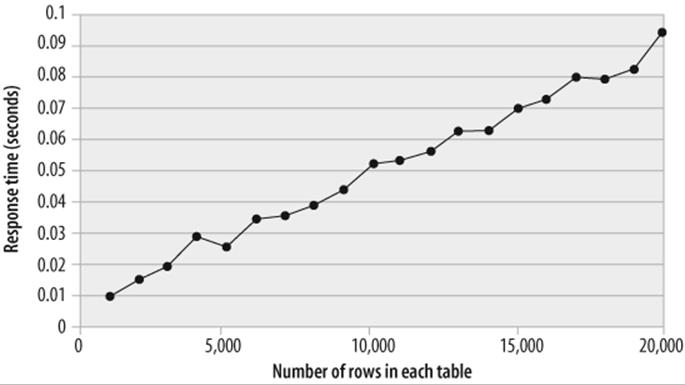
Figure 19-2. Table row counts versus elapsed time—after tuning
The performance improvement is remarkable—the elapsed time for the query has been reduced by more than 99%, and the SQL is more than 100 times faster. Furthermore, the SQL will now scale appropriately as the volumes of data in the tables increase.
No amount of server tuning, stored program tuning, or hardware upgrades could have obtained this improvement. Any such efforts would also have been ultimately futile, because the exponential degradation would eventually overwhelm any performance improvements gained by other measures. For these reasons, SQL tuning should always be performed before attempting any other optimization.
Tip
SQL tuning is the most important aspect of overall MySQL tuning. Ensure that SQL is tuned before starting any other optimization exercises.
How MySQL Processes SQL
The following sections provide a brief overview of the parsing and caching steps that MySQL undertakes as it processes a SQL statement.
Parsing SQL
A SQL statement sent to the MySQL server must first be parsed. Parsing involves the following actions:
§ Ensure that the SQL statement contains valid syntax.
§ Check that that you have been granted appropriate access to the objects involved.
§ Confirm that all required objects exist.
§ Determine an execution plan for the SQL statement.
The execution plan represents MySQL's strategy for retrieving or modifying the data specified by the SQL statement. The optimizer is that part of the MySQL code that is responsible for making these decisions. Here are some of the questions that the optimizer needs to ask before it can come up with its plan:
§ Is there a way to rewrite the SQL so that it will execute more efficiently?
§ Are there any indexes available to retrieve the required data?
§ Will using these indexes improve performance? If so, which of the possible indexes should be used?
§ If multiple tables are to be processed, in what order should the tables be processed?
Compared to some of the major relational databases (Oracle, SQL Server, DB2), MySQL's optimizer might seem, at first glance, to be relatively simplistic. MySQL's optimizer is, however, extremely effective. You will only rarely need to rewrite a SQL statement to make it perform more efficiently—the optimizer will usually make the right decision. Since the optimizer cannot create "missing" indexes that might make your statement run faster, the most important thing you can do to assist the optimizer is to create a good set of supporting indexes on your tables .
Understanding how the optimizer makes its decisions will help you to make sound database design and SQL programming decisions. In the next two chapters, we will look at specific SQL tuning scenarios, explain how the optimizer deals with each of these scenarios, and discuss techniques for optimizing the SQL involved.
Caching
MySQL supports some in-memory structures (also known generally as caches ), which can improve the performance of SQL statements.
Buffer pool and key cache
Almost every SQL statement needs to work with data from the database—either to return it to the calling program or to modify it as instructed by an INSERT, UPDATE, or DELETE statement. In many cases, however, MySQL can obtain this data without the overhead of disk I/O by retrieving the required data from one of a number of caches.
For MyISAM tables, MySQL relies on the operating system to cache the data contained in the individual files that make up the tables. All operating systems include read caches, and if you read from a MyISAM file more than once, there is a chance that the data will still be in the operating system cache when you try to read it a second time. You will usually have very little control over the size of the OS read cache, since it is normally managed by the operating system itself.
MyISAM does, however, have its own cache for index blocks. This is controlled by the startup parameter KEY_BUFFER_SIZE.
The InnoDB storage engine maintains a single cache for both index and table blocks. This is controlled by the parameter INNODB_BUFFER_POOL_SIZE.
Correctly sizing these two buffers can help reduce the amount of disk I/O required to satisfy the data requirements of your SQL statements. In general, you should allocate as much memory as possible to these caches. However, beware of allocating too much memory for the MyISAM key buffer—you might inadvertently starve the OS read buffer and reduce the amount of memory available for caching table data.
Table cache
The table cache maintains metadata about tables in memory and also contains the link to the storage handler's physical representation of the table. In MyISAM, these links are file descriptors pointing to the .frm files and the .MYD files. Each session that needs to access a table will require its own table cache entry. The default value of TABLE_CACHE (typically 256) is often too small for systems with large numbers of tables and/or high numbers of concurrent users.
Query cache
Before MySQL goes to the trouble of parsing a SQL statement, it will look in the query cache to see if it already has in memory a copy of the SQL statement and its result set. If it finds a match, it can return the result set directly from the query cache. This "shortcut" can greatly improve query performance. So what are the criteria for determining a match?
In order for MySQL to take advantage of a cached result set, the new SQL statement must match exactly the statement associated with the result set, including whitespace and comments . If the same logical statement is written more than once within an application, there is a very good chance that the statements will not be physically identical, thus negating a key performance enhancement.
In addition, if any table referred to in the statement is modified, then that statement and its result set will be flushed from the query cache. This behavior makes the query cache most useful for applications or tables that are read-intensive. If a table is being modified many times a second—as might be the case in an OLTP application—then it is unlikely that queries against that table are going to remain in cache long enough to be useful. Remember: any modification to the table will cause queries using that table to be flushed—even if the modification does not impact the rows returned by the query.
Some SQL statements cannot be cached at all—particularly if they contain a function that is not guaranteed to return the same result every time it is called. For instance, the CURDATE function will return a different value (the current date-time) every time it is called. So if you include a call toCURDATE in your query, it will not be cached.
The query cache will be most effective when at least some of the following are true:
§ The SQL statements being cached are expensive to execute (they may require scans of big tables or sort operations).
§ The result sets are relatively small (otherwise, the result set may not fit in the cache).
§ The SQL statements are executed with some frequency (otherwise, the result set may be flushed from the cache before the SQL is re-executed).
§ The underlying tables are rarely modified.
You can control the size of the cache with the SET GLOBAL query_cache_size= size statement.
You can view statistics about query cache usage with the SHOW STATUS LIKE 'qcache%'; statement.
Stored programs can benefit from the query cache. A stored program that returns a result set will be cached, and any subsequent execution of that program can be satisfied using the query cache. However, SQL statements within stored programs cannot currently be satisfied from the cache (we might imagine that when they execute within the database, they are executing "behind the cache").
Table statistics
Like most query optimizers, MySQL maintains statistics about table and index data so that it can use this additional information to formulate the most efficient execution plan.
You can view the statistics that MySQL keeps for a table with the SHOW TABLE STATUS statement. Example 19-1 shows an example of using this statement.
Example 19-1. Viewing table statistics
mysql> SHOW TABLE STATUS LIKE 'sales' \G
*************************** 1. row ***************************
Name: sales
Engine: InnoDB
Version: 9
Row_format: Fixed
Rows: 2500137
Avg_row_length: 114
Data_length: 285016064
Max_data_length: 0
Index_length: 0
Data_free: 0
Auto_increment: 2500001
Create_time: 2004-12-28 10:47:35
Update_time: NULL
Check_time: NULL
Collation: latin1_swedish_ci
Checksum: NULL
Create_options:
Comment: InnoDB free: 1766400 kB
1 row in set (0.60 sec)
You can view the statistics that MySQL keeps for the indexes on a table with the SHOW INDEXES statement, as shown in Example 19-2.
Example 19-2. Viewing index statistics
mysql> SHOW INDEXES FROM sales \G
*************************** 1. row ***************************
Table: sales
Non_unique: 0
Key_name: PRIMARY
Seq_in_index: 1
Column_name: SALES_ID
Collation: A
Cardinality: 2500137
Sub_part: NULL
Packed: NULL
Null:
Index_type: BTREE
Comment:
1 row in set (0.18 sec)
The two most important columns in the output from these commands are Rows and Avg_row_length from SHOW TABLE STATUS and Cardinality from SHOW INDEXES. Cardinality reports the number of distinct rows in the index—this helps MySQL to determine how efficient the index will be in retrieving rows. Indexes that have a high cardinality -to-rows ratio are often called selective indexes.
These statistics are created by MySQL (or the storage engine) during certain operations such as bulk loads/deletes, index creation, and ALTER TABLE operations. You can request that MySQL update the statistics with the ANALYZE TABLE statement. If your database is subject to large fluctuations in data volumes, you may want to run ANALYZE TABLE periodically, but be aware that this statement places a read lock on the table, preventing concurrent update, and therefore should not be run during times of heavy concurrent updates activity.
The optimizer also obtains additional statistics at runtime by probing a table's indexes to determine the relative cardinality of an index against the query values requested. Through this analysis, the optimizer may determine that although an index has low overall cardinality, it is highly selective for the values provided in the query.
Suppose, for instance, that we have an index on gender ('male', 'female', 'unsure'). MySQL will ignore this index for a query that requests all males or all females, but will choose to use the index for a query of all those unsure of their gender. Since this group comprises only a small proportion of the rows, the index will, in this case, help MySQL locate the total result set quickly. We'll look in detail in the next chapter at how MySQL chooses indexes.
SQL Tuning Statements and Practices
MySQL provides several statements and utilities that assist with tuning SQL, and you need to be familiar with these resources. The statements and utilities are described in the following sections.
EXPLAIN Statement
The most important SQL tuning statement in the MySQL language is EXPLAIN. EXPLAIN exposes the execution plan that the optimizer will use to resolve a particular SQL statement. Without EXPLAIN, you are doomed to trial-and-error tuning.
EXPLAIN has a simple syntax:
EXPLAIN sql_text;
EXPLAIN returns a result set consisting of at least one row for each table referenced in the SQL. Additional rows might be returned to indicate how subqueries or derived tables are used in the query. Example 19-3 is a simple demonstration of an explain plan for a two-table join (we used the\G option to print the output with each column on a separate line).
Example 19-3. Example of EXPLAIN output
mysql> EXPLAIN SELECT customer_name
-> FROM employees join customers
-> ON(customers.sales_rep_id=employees.employee_id)
-> WHERE employees.surname='GRIGSBY'
-> AND employees.firstname='RAY' \G
*************************** 1. row ***************************
id: 1
select_type: SIMPLE
table: employees1
type: ref
possible_keys: PRIMARY,i_employees_name3
key: i_employees_name4
key_len: 80
ref: const,const
rows: 15
Extra: Using where; Using index6
*************************** 2. row ***************************
id: 1
select_type: SIMPLE
table: customers2
type: ref
possible_keys: i_customers_sales_rep
key: i_customers_sales_rep8
key_len: 9
ref: sqltune.employees.EMPLOYEE_ID7
rows: 55589
Extra: Using where
2 rows in set (0.04 sec)
Let's take a look at the most important pieces of information from these plans. Numbers used in the explanation below correspond to superscripts in the EXPLAIN output above.
1. For joins, the order of the rows output by EXPLAIN corresponds to the join order, so the presence of the employees table in the first row indicates that employees was the first table in the join.
2. customers is the second table in the join.
3. MySQL had a choice between the primary key index and the i_employees_name index.
4. MySQL chose the i_employees_name index to retrieve rows from employees. This index was on (surname, firstname).
5. MySQL has determined that it will fetch only a single row in this stage of the query (e.g., it determined that there was only one employees row with that particular surname+firstname combination).
6. Because the columns in the i_employees_name index were the only employees columns included in the SQL, MySQL was able to satisfy this part of the query using the index alone—accessing rows in the table itself was unnecessary.
7. MySQL was required to find rows in the customers table that matched specific values of employees.employee_id.
8. MySQL used the i_customers_sales_rep index to retrieve these rows (this was an index on customers.sales_rep_id).
9. MySQL expected to retrieve about 5558 rows from customers. The value here refers to the number of rows that are expected to be processed each time this step is executed—which, in this case, is only once.
We'll look at a variety of EXPLAIN outputs for common query scenarios in the next few chapters. For now, the main thing to recognize and accept is that if you are going to be tuning SQL statements, you will need to get familiar with the EXPLAIN statement and learn how to interpret theEXPLAIN output.
Tip
The EXPLAIN statement is the primary tool in your SQL tuning toolbox. You should become competent in the interpretation of EXPLAIN output.
EXPLAIN and Stored Programs
Unfortunately, there is no way to directly obtain EXPLAIN output for the SQL statements inside stored programs. EXPLAIN will generate an error if asked to explain a CALL statement or a stored program name.
We hope that this restriction will be relaxed in future releases. In the meantime, to tune the SQL in your stored programs, you need to work with the SQL outside of the stored program and only add it to the program when you are satisfied that it is optimized.
Details of the EXPLAIN Output
The output from the EXPLAIN statement consists of lines containing the following columns:
id
Identifies the individual SELECT statement within a SQL statement that contains multiple SELECT clauses. There will be multiple SELECT statements in SQL statements that contain subqueries, in-line views, or UNION operations. All rows in the EXPLAIN output that have the same ID will belong to the same SELECT statement.
select_type
This column identifies the type of the SELECT statement responsible for this step. Table 19-1 lists the possible values.
Table 19-1. Possible values for the select_type column of the EXPLAIN statement output
|
select_type |
Explanation |
|
SIMPLE |
A simple SELECT statement that does not involve either subqueries or UNIONs. |
|
PRIMARY |
If the SQL contains subqueries or UNIONs, PRIMARY indicates the outermost SQL. PRIMARY could be the SELECT statement that contains subqueries within it or the first SELECT in a UNION. |
|
UNION |
The second or subsequent SELECT statements contributing to a UNION operation. |
|
UNION RESULT |
The result set of a UNION operation. |
|
SUBQUERY |
A subquery that returns rows that are not "dependent" on the rows in the outer SELECT. In practice, this means that the subquery does not contain references to columns in other SELECT statements. |
|
DEPENDENT SUBQUERY |
A subquery whose results are dependent on the values in an outer SELECT. This is typical of EXISTS subqueries and of IN subqueries (which MySQL rewrites as EXISTS). |
|
DEPENDENT UNION |
The second or subsequent SELECT in a UNION that is dependent on rows from an outer SELECT. |
|
DERIVED |
SELECT that appears within a subquery within the FROM clause of another SQL. |
table
Indicates the name of the table involved in this step. If the table is aliased within the SQL statement, then the name of the alias rather than the name of the table will be reported.
type
Indicates the method by which rows will be selected from the table involved. Table 19-2 shows the possible values for the type column.
Table 19-2. Possible values for the type column of the EXPLAIN statement output
|
type |
Explanation |
|
all |
All rows in the table concerned will be read. This occurs primarily when no suitable index exists to retrieve the rows, or when MySQL determines that a full scan of the table will be less expensive than an index lookup. |
|
const |
An index is used to retrieve all values from the table matching a constant value supplied in the WHERE clause. |
|
eq_ref |
An index is used to retrieve all rows from the table that match the rows supplied by a previous SELECT. eq_ref is typically seen in conjunction with a well-optimized, indexed join. eq_ref indicates that all parts of a unique or primary key index are used. |
|
ref |
Like eq_ref except that either only part of the index can be used or the index is not unique or primary. |
|
ref_or_null |
Like ref except that the condition also includes a search for null values. |
|
index merge |
Occurs when MySQL merges multiple indexes to retrieve the results. |
|
unique_subquery |
An index lookup is used to satisfy the result of a subquery. |
|
range |
An index is used to retrieve a range of values from the table. This occurs typically when >, <, or BETWEEN operators are involved. |
|
index |
A full scan of the index is undertaken to find the necessary rows. |
possible_keys
Lists all of the keys (indexes) that MySQL considered as having potential to resolve this step. If an index is listed here, but is not used to resolve the step, you can consider using optimizer hints to force or encourage the use of the index. If the index is not listed, then in all probability MySQL cannot use it.
key
Indicates the key (index) that MySQL used to resolve the query.
key_len
Shows the length of the columns in the index used to resolve the query. If there is more than one column in the index, key_len might indicate that only part of the index is used.
ref
Shows which columns are used to select rows from the table. ref may list columns from other tables (join columns from other tables) or the word const if a constant value will be used (this constant value might have come from a WHERE clause literal, or might have been obtained earlier in the query execution).
rows
Indicates the number of rows that MySQL estimates will be processed by this step.
Extra
Contains additional information about the execution step. Possible values for Extra are shown in Table 19-3. Multiple values from this column may appear in the Extra column, separated by semicolons.
Table 19-3. Possible values for the extra column of the EXPLAIN statement output
|
Extra |
Explanation |
|
distinct |
MySQL will stop searching for more rows after the first match is found. |
|
not exists |
Occurs in a LEFT JOIN when there is an additional WHERE clause condition that indicates that the WHERE clause condition will never be satisfied. A LEFT JOIN with an IS NULL condition will generate this output. This allows the optimizer to eliminate the table from further processing. |
|
range checked for each record |
There is no good general-purpose index to support a join. MySQL will determine on a row-by-row basis whether to use an index and/or which index to use. |
|
Using filesort |
MySQL needs to return rows in order, and no index is available to support that ordering. MySQL will need to sort the rows and may need to write to disk during that sorting. Even if there is sufficient memory to avoid a disk sort, you will still see this tag if a sort is necessary. |
|
Using index |
This step could be resolved by reading an index alone. Typically, this occurs when all of the columns required to resolve the step are present in an index. |
|
Using index for group-by |
Same as Using index, but used to support a GROUP BY operation. |
|
Using temporary |
A temporary table is created to hold intermediate results. Often seen in conjunction with using filesort. |
|
Using where |
The results returned by this step are filtered to satisfy the WHERE clause condition. |
|
Using sort_union |
Similar to using union except that the rows had to be sorted before the UNION could be performed, usually because range conditions are involved. |
|
Using union |
A form of index merge in which rows that appeared in any of the index scans are returned. Typically used to support WHERE clause conditions that include OR conditions. |
|
Using intersect |
A form of index merge in which only the rows appearing in all of the index scans are returned. Typically used to support WHERE clause conditions that include only AND conditions. |
Extended EXPLAIN
An undocumented feature of the EXPLAIN statement can be used to reveal the rewrites that MySQL performs on a statement prior to execution.
If you issue the statement EXPLAIN EXTENDED sql, followed by SHOW WARNINGS, MySQL will print the SQL that it actually executes, including any rewrites applied to the SQL by the optimizer. For instance, in Example 19-4, we see how MySQL rewrites an IN subquery to an EXISTSsubquery.
Example 19-4. Using EXPLAIN EXTENDED
mysql> EXPLAIN EXTENDED SELECT COUNT(*) FROM ta_5000 WHERE sales_id IN (SELECT sales_
id FROM tb_5000)\G
*************************** 1. row ***************************
id: 1
select_type: PRIMARY
table: ta_5000
type: ALL
possible_keys: NULL
key: NULL
key_len: NULL
ref: NULL
rows: 5131
Extra: Using where
*************************** 2. row ***************************
id: 2
select_type: DEPENDENT SUBQUERY
table: tb_5000
type: ALL
possible_keys: NULL
key: NULL
key_len: NULL
ref: NULL
rows: 4985
Extra: Using where
2 rows in set, 1 warning (0.04 sec)
mysql> SHOW WARNINGS \G
*************************** 1. row ***************************
Level: Note
Code: 1003
Message: select count(0) AS 'count(*)' from 'sqltune'.'ta_5000' where <in_optimizer>
('sqltune'.'ta_5000'.'SALES_ID',<exists>(select
1 AS 'Not_used' from 'sqltune'.'tb_5000' where (<cache>('sqltune'.'ta_5000'.
'SALES_ID') = 'sqltune'.'tb_5000'.'SALES_ID')))
1 row in set (0.05 sec)
Most of the time, MySQL rewrites are not particularly significant. However, if you are completely at a loss to understand MySQL's refusal to use an index or some other execution plan decision, examining the rewrite might be useful.
Optimizer Hints
Optimizer hints are instructions that you can embed in your SQL that do not change the meaning of the SQL, but rather instruct or suggest to the optimizer how you would like the SQL to be executed.
Most of the time, you will not need to add hints. In fact, hints can be dangerous because they limit the choices the optimizer has available, and if data in the tables change or if new indexes are added to the table, MySQL may be unable to adapt because of your hints. However, there definitely will be situations where you will discover that the optimizer has made a less than perfect decision and you will want to give the optimizer specific instructions.
Table 19-4 lists the commonly used optimizer hints . We will see examples of each of these hints in the next two chapters.
Table 19-4. MySQL optimizer hints
|
Hint |
Where it appears |
What it does |
|
STRAIGHT_JOIN |
After the SELECT clause |
Forces the optimizer to join the tables in the order in which they appear in the FROM clause. Use this if you want to force tables to be joined in a particular order. |
|
USE INDEX(index [,index...]) |
After a table name in the FROM clause |
Instructs MySQL to only consider using the indexes listed. MySQL may choose to use none of the indexes if it calculates that using them would not be faster than scanning the entire table. |
|
FORCE INDEX(index [,index...]) |
After a table name in the FROM clause |
Instructs MySQL to use one of the indexes listed. This differs from USE INDEX in that MySQL is instructed not to perform a table scan of the data unless it is impossible to use any of the indexes listed. |
|
IGNORE INDEX(index [,index...]) |
After a table name in the FROM clause |
Instructs MySQL not to consider any of the listed indexes when working out the execution plan. |
Measuring SQL and Stored Program Execution
When we execute a SQL statement from the MySQL command line, MySQL is kind enough to report on the elapsed time taken to execute the statement:
mysql> CALL TestProc1( );
Query OK, 0 rows affected (9.35 sec)
Elapsed time is a good first measurement of SQL or stored program performance, but there are lots of reasons why elapsed time might vary between runs that may have absolutely nothing to do with how well the SQL statement is optimized:
§ Other users may be running jobs on the host while we execute our SQL statements; we will be contending with them for CPU, disk I/O, and locks.
§ The number of physical I/Os necessary to execute our statement will vary depending on the amount of data cached in the operating system, the MyISAM key cache, the InnoDB buffer pool, and/or some other storage engine-specific cache.
For these reasons, it is sometimes better to obtain additional metrics to work out whether our tuning efforts are successful. Useful execution statistics can be obtained from the SHOW STATUS statement, although the level of detail will vary depending on our storage engine, with InnoDB currently offering the most comprehensive selection of statistics.
Generally, we will want to compare before and after variables for each statistic and—because the statistics are sometimes computed across all sessions using the MySQL server—ensure that our session has exclusive use of the server while the statement runs.
In Example 19-5, we calculate the number of logical and physical reads performed while counting the number of rows on the InnoDB-based sales table. Logical reads are the number of block requests from the InnoDB buffer pool, while physical reads reflect the number of blocks that actually had to be read from disk.
Example 19-5. Examining InnoDB execution statistics before and after SQL statement execution
mysql> /* Logical reads before execution*/
SHOW STATUS LIKE 'Innodb_buffer_pool_read_requests';
+----------------------------------+-------+
| Variable_name | Value |
+----------------------------------+-------+
| Innodb_buffer_pool_read_requests | 598 |
+----------------------------------+-------+
1 row in set (0.01 sec)
mysql> /* Physical reads before execution*/
SHOW STATUS LIKE 'Innodb_data_reads';
+-------------------+-------+
| Variable_name | Value |
+-------------------+-------+
| Innodb_data_reads | 79 |
+-------------------+-------+
1 row in set (0.01 sec)
mysql>
mysql> SELECT count(*) from sales;
+----------+
| count(*) |
+----------+
| 2500000 |
+----------+
1 row in set (27.67 sec)
mysql>
mysql> /* Logical reads after execution*/
SHOW STATUS LIKE 'Innodb_buffer_pool_read_requests';
+----------------------------------+--------+
| Variable_name | Value |
+----------------------------------+--------+
| Innodb_buffer_pool_read_requests | 365177 |
+----------------------------------+--------+
1 row in set (0.46 sec)
mysql> /* Physical reads after execution*/
SHOW STATUS LIKE 'Innodb_data_reads';
+-------------------+-------+
| Variable_name | Value |
+-------------------+-------+
| Innodb_data_reads | 17472 |
+-------------------+-------+
1 row in set (0.01 sec)
Subtracting the before values from the after values gives us a logical read count of 364,579 and a physical read count of 17,393. We also note the elapsed time of 27.67 seconds.
The next time we execute this query, we might see a lower physical read count and a lower elapsed time because the data we need is already in cache. However, we would not expect the logical read count to change unless the data in the table was changed. This makes the logical read statistics(Innodb_buffer_pool_read_requests) arguably the most useful statistics for determining if our SQL tuning efforts have been successful.
Table 19-5 shows the SHOW STATUS variables that are most useful for measuring SQL execution performance.
Table 19-5. SHOW STATUS statistics that are useful when measuring SQL performance
|
SHOW STATUS statistic |
Explanation |
|
Innodb_buffer_pool_read_requests |
Number of requests from the InnoDB buffer pool. This statistic is sometimes called logical reads since it reflects the absolute number of data reads required to satisfy a query. This value will remain constant between runs provided that our data does not change. If we observe a reduction in this statistic, then we have almost certainly improved the performance of our query. |
|
Innodb_data_reads |
Number of blocks from disk that InnoDB had to read to execute the query. If the cache is empty, then this value will be equal to Innodb_buffer_pool_read_requests. If all of the required blocks are in the cache, then this statistic will be 0. Usually, the value will be somewhere in between. If two executions of the same SQL have different response times, we can look at this statistic to determine if the difference is because one execution required more physical I/O[a]. |
|
Innodb_rows_read |
Number of rows read by InnoDB to satisfy the query. For some SQL statements, we may see excessive values for this statistic, which generally indicates that the SQL is inefficient (because it is accessing the same rows twice, or because it is accessing more rows than are required). |
|
Last_query_cost |
Optimizer's "cost" estimate for the last SQL executed. Unlike the other metrics, this statistic does not require us to have to calculate a delta value. Higher costs indicate that the optimizer thinks the SQL will take longer to run. |
|
Sort_rows |
Number of rows that had to be sorted. |
|
Sort_merge_passes |
Number of disk sort "merge runs" that had to be performed. The fewer merge runs, the faster the sort. Chapter 21 describes sort optimization in detail. |
|
[a] For example, if we execute a new SQL statement twice, the second execution will usually have a lower elapsed time because the first execution brings the required blocks into the InnoDB buffer pool or the MyISAM key cache. |
|
The Slow Query Log
One way to identify SQL statements or stored programs that may need tuning is to enable the MySQL slow query log. We can do this by adding the following lines to our MySQL initialization files:
log_slow_queries
long_query_time=N
This will cause MySQL to write any queries that exceed an elapsed time exceeding N seconds to a log file. The log file can be found in the MySQL data directory and is named hostname-slow.log. For each SQL statement identified, MySQL will print the SQL statement along with a few execution statistics, as shown in Example 19-6.
Example 19-6. Example of slow query log contents
Time Id Command Argument
# Time: 050214 23:42:30
# User@Host: root[root] @ localhost [127.0.0.1]
# Query_time: 67 Lock_time: 0 Rows_sent: 1 Rows_examined: 101199
use sqltune;
select count(*) from customers where contact_surname not in (select surname from
employees);
The slow query log execution statistics are not particularly enlightening, and there is no EXPLAIN output, so we would normally paste the SQL into our MySQL client for further analysis.
Starting with MySQL 5.1.6, the slow query log can be directed to the database table mysql.slow_log. This allows us to more easily access the information from MySQL clients and gives us the power to analyze the information using SQL statements. We enable logging to this table by specifying log_output=TABLE in our initialization file.
About the Upcoming Examples
For every significant tuning principle in the following chapters, we have provided at least one benchmarked example to illustrate the performance gains that can be obtained. However, you should be aware of the following:
§ Any example is just that—an example. Your real-life performance might not show the same improvements that we obtained in our tests, and indeed you might find that some of the techniques shown do not work for you at all. Differences in data volumes and distributions, the MySQL version, and the storage engine you are using—as well as many other factors—might result in significantly different outcomes. Nevertheless, the principles we outline are fairly general-purpose and should work for a wide range of applications and data types.
§ All of our examples were done using MySQL 5.0 with either the InnoDB or MyISAM storage engine (with the InnoDB engine being our default). Many of the optimizations involved (index merges, for instance) appeared only in 5.0, and you will certainly see different results if you use a different storage engine such as HEAP or BDB.
§ We looked only at "standard" SQL that is common to all of the storage engines. We felt that specialized operations—such as full text search or spatial queries—were beyond the scope of this book, since our intention is to provide a foundation in SQL tuning with respect to stored program development only.
We used a Perl program (MyTrace.pl) to perform our tests. This program can take a normal SQL file, such as you might submit to the MySQL command-line client, and it generates several varieties of performance reports that we used to display the execution plans and the performance characteristics of our examples.
We could have used the MySQL command line to do our tests, but we decided to develop this utility for a number of reasons:
§ The EXPLAIN output is a bit awkward. When the output is printed one line per row, the output can become garbled when wrapped to the column length. If the output is printed one line per column (with the \G option), then the output appears very verbose. Either way, the output is hard to read. There is also no way to select which columns to display in the output.
§ It's rather difficult to obtain the changed values from the SHOW STATUS statement that can reveal useful metrics such as logical or physical reads.
§ For benchmarking purposes, we wanted to do things like averaging statistics over a number of executions, measuring statistics only on a second or subsequent execution so as to avoid discrepancies caused by caching of data.
§ The utility was capable of generating comma-separated output that we could easily load into Excel to generate charts and perform analyses.
MyTrace.pl provides modified formats for EXPLAIN output and these formats are used throughout the next few chapters. We think you'll find this format easier to read and understand. For instance, whereas in the MySQL command-line client you might generate EXPLAIN output that looks like this:
mysql> EXPLAIN EXTENDED SELECT COUNT(*) FROM ta_5000
where sales_id in (select sales_id from tb_5000)\G
*************************** 1. row ***************************
id: 1
select_type: PRIMARY
table: ta_5000
type: ALL
possible_keys: NULL
key: NULL
key_len: NULL
ref: NULL
rows: 5131
Extra: Using where
*************************** 2. row ***************************
id: 2
select_type: DEPENDENT SUBQUERY
table: tb_5000
type: ALL
possible_keys: NULL
key: NULL
key_len: NULL
ref: NULL
rows: 4808
Extra: Using where
2 rows in set, 1 warning (0.01 sec)
we would show the EXPLAIN in a more truncated format, as follows:
Short Explain
-------------
1 PRIMARY select(ALL) on ta_5000 using no key
Using where
2 DEPENDENT SUBQUERY select(index_subquery) on tb_5000 using i_tb_5000
Using index
or in a more extended format like this:
Explain plan
------------
ID=1 Table=a Select type=SIMPLE Access type=ALL Rows=5158
Key= (Possible= )
Ref= Extra=
ID=1 Table=b Select type=SIMPLE Access type=ref Rows=1
Key=i_tb_5000 (Possible=i_tb_5000 )
Ref=sqltune.a.SALES_ID Extra=Using index
The output also includes timings for each stage of statement execution and details of any SHOW STATUS variables that changed during execution:
Phase Elapsed (s)
Parse 0.0001
Exec 1.3808
Fetch 0.0001
-----------------
Total 1.3810
Statistic Value
-------------------------------------------------------------
Bytes_received 99
Bytes_sent 4862
Com_select 1
Handler_read_first 1
Handler_read_key 5003
Handler_read_rnd_next 5001
Innodb_buffer_pool_pages_data 57
Innodb_buffer_pool_pages_misc 7
Innodb_buffer_pool_read_requests 15217
Innodb_buffer_pool_reads 57
Innodb_data_read 933888
Innodb_data_reads 57
Innodb_pages_read 57
Innodb_rows_read 10000
Questions 2
Select_scan 1
Table_locks_immediate 2
Uptime 3
You may find the MyTrace.pl utility useful. You can find documentation and download instructions for this utility at this book's web site.
Conclusion
There is nothing to be gained by trying to optimize a stored program without first optimizing the SQL statements that it contains. This chapter, therefore, intended to make you familiar with some basic principles of tuning MySQL stored programs and the SQL statements within those programs. With this knowledge, you will be able to better absorb the more specific tuning advice in the following chapters.
Remember that the performance of individual SQL statements can vary substantially, at least in part depending on whether the statement and/or the data it identifies resides in a MySQL memory cache. For this reason, you should be wary of basing your tuning efforts only on the elapsed time of SQL statements. Consider also calculating the number of logical reads required by your statements, as this will only decrease as efficiency improves. Unfortunately, at the time of writing, you can reliably obtain the logical read rate only from the InnoDB storage engine.
The EXPLAIN statement reveals how MySQL will execute a SQL statement. In order to effectively tune SQL, you need to become familiar with EXPLAIN and adept at interpreting its output.
Indexes exist primarily to improve query performance, so it's not surprising that creating a good set of indexes is the single most important thing you can do to obtain better SQL performance. In particular, you should support WHERE clause conditions and join conditions with appropriate indexes—this often means creating a concatenated ("composite" or multicolumn) index.
All materials on the site are licensed Creative Commons Attribution-Sharealike 3.0 Unported CC BY-SA 3.0 & GNU Free Documentation License (GFDL)
If you are the copyright holder of any material contained on our site and intend to remove it, please contact our site administrator for approval.
© 2016-2026 All site design rights belong to S.Y.A.