Programming the 65816 Including the 6502, 65C02, and 65802 (1986)
Part IV. Applications
15. DEBUG 16-A 65816 Programming Tool
This chapter consists of a complete 65816 application example and a detailed discussion of its dozen or so routines. Where possible, different programming techniques have been employed in an effort to illustrate some of the different methods of coding that are available.
The program, DEBUG16, is a rudimentary step-and-trace debugger. A debugger is a tool used during software development to isolate and reveal sources of error in the program being tested. In other words, it helps the programmer eliminate the bugs in a program, hence the name. A step-and-trace function lets the program be halted after the execution of each single instruction and the registers and possibly other memory locations to be examined. This effectively provides a "view" into the otherwise invisible internals of the processor.
The ability to trace programs in this manner can be extremely useful: uninitialized variables, wild branches, infinite loops—all of the common flaws that normally result in your program going away to never-never land with little clue to their reasons for departure—are made visible. In addition to displaying the register contents, a tracer will also list the opcode mnemonic and display the operand using the same syntax as originally specified in the source program. This process is called disassembly. Although the tracing program can accurately regenerate an approximation of the source line that resulted in a given instruction, it cannot determine any of the symbolic labels that might have been given to the addresses found by the tracer in the assembler source program. More sophisticated debuggers called symbolic debuggers let you load a program's symbol table created by either the link editor or assembler; the debugger's disassembly routine looks up each address in a disassembly in the symbol table and inserts labels in place of addresses wherever a correspondence is found.
DEBUG16 also has a LIST entry point, at which its disassembler can be used apart from its tracer; this lets you re-create a listing of a program without having the source code available. Again, there is no symbolic information (labels) available. Additionally, the disassembler in its current form does not deal with variable lengths of immediate operands when in the LIST mode.
The tracer can display the disassembled instruction and register values either one instruction at a time, or allow the trace to execute in free-running mode. When only one instruction is disassembled at a time, the tracer is said to be single-stepping; pressing a key lets the next instruction be executed. Pressing RETURN toggles the tracer into free-running mode. While free-running, a single key press will pause the trace. Pressing any key except RETURN resumes tracing; RETURN switches back to single-stepping.
The basic theory of operation of the tracer is simple. Starting with the first program instruction, the tracer calculates the length of the instruction by first determining the addressing mode associated with the opcode, and then referring to a table that gives the instruction lengths for the different addressing modes. It can therefore determine the location of the next instruction that follows the current one. It places a BRK instruction at that location, having first saved the original value stored there. Next, it executes (via a JMP instruction) the current instruction. As soon as that instruction completes, the program counter increments to the next instruction, where it encounters the inserted BRK. BRK initiates an interrupt cycle that returns control back to the tracer, saves copies of all of the processor's register contents to memory, then calls a routine which displays them, along with the disassembled instruction.
When the next step (next instruction) is to be executed, the BRK instruction is replaced with its original value, and the cycle is repeated. In this way the program is able to gain control of the processor "in between" the execution of each instruction.
The exception to this method is whenever an instruction (such as a branch or jump) is encountered which can change the flow of control; in these cases, the target location must be determined (by examining the operand of the instruction), and a BRK inserted at that location instead.
The disassembly output looks like Figure 15.1.
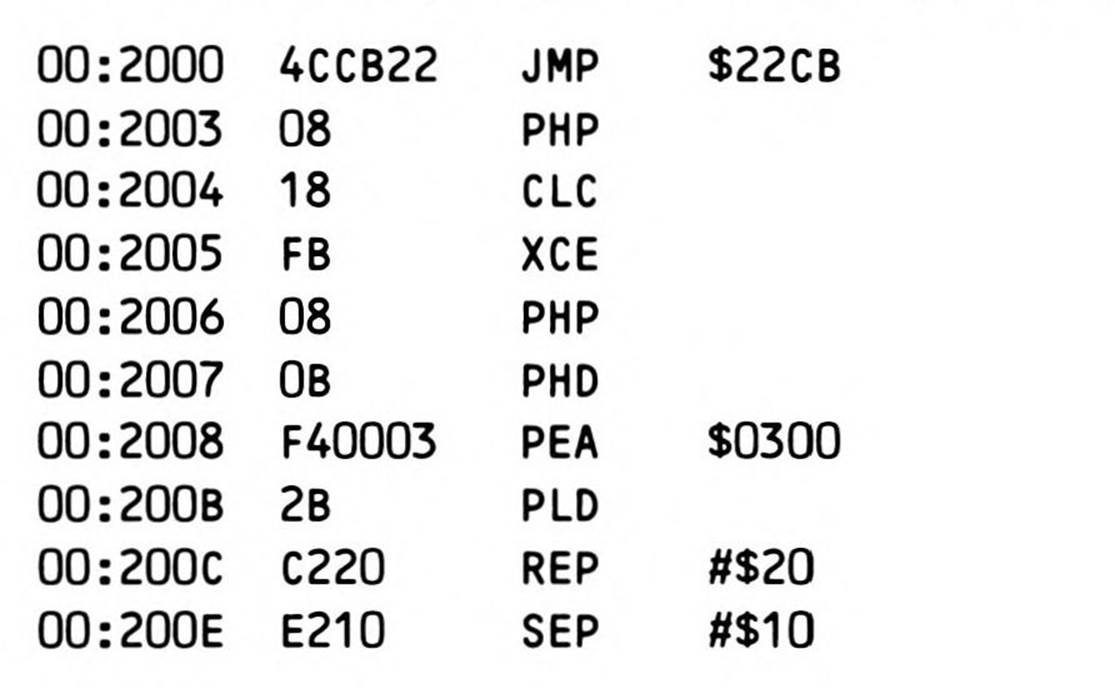
Figure 15.1. Disassembly Output.
And the tracer output looks like Figure 15.2.
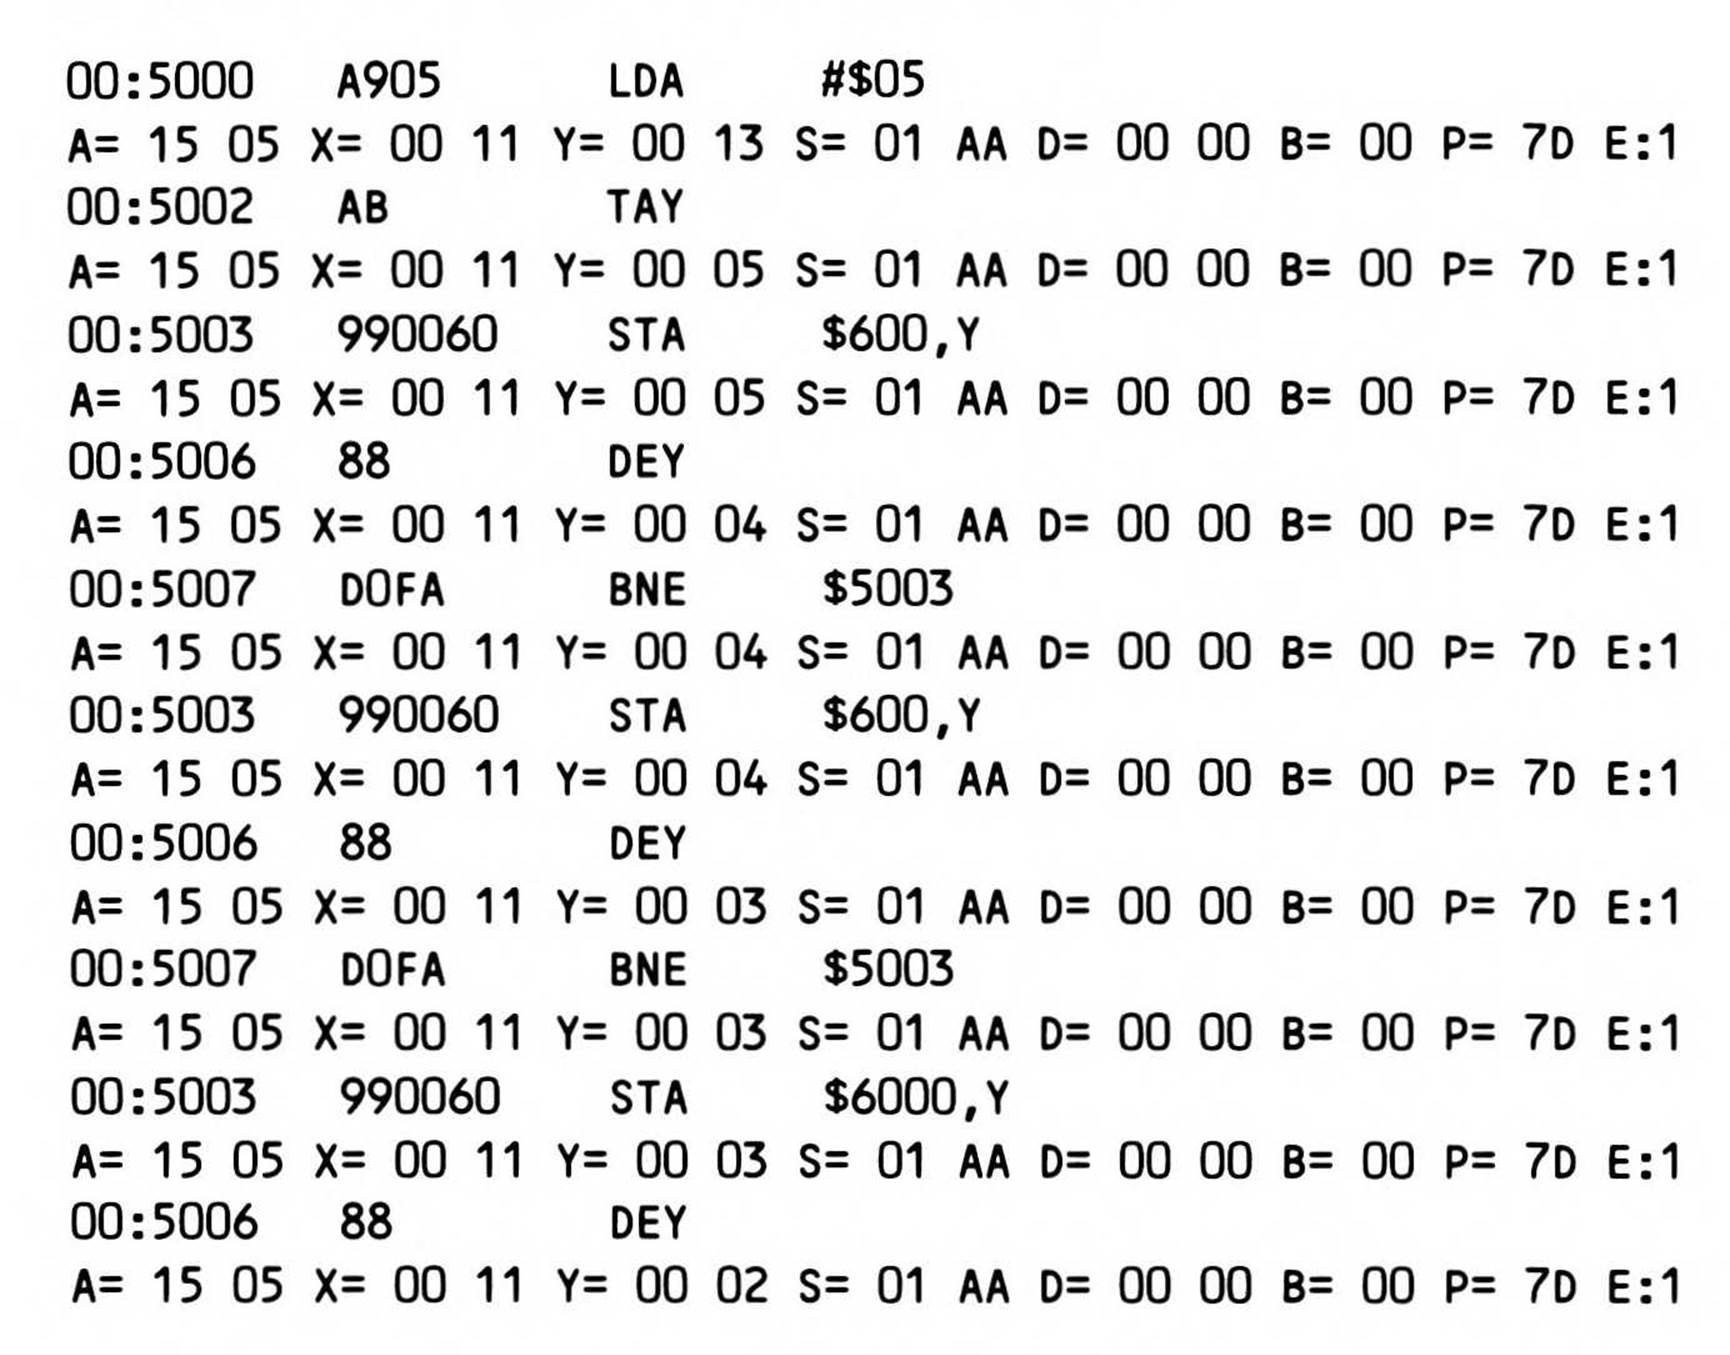
Figure 15.2. Tracer Output.
This example was developed and tested using an Apple //e with a 65816 processor card installed; the calls to machine-dependent locations have been isolated and are clearly identified as such. DEBUG16 uses the native BRK vector. On an Apple //, this location ($FFE6.FFE7) normally contains ROM data, which varies between monitor ROM versions. Since there is no way to patch ROM, the solution opted for here is for DEBUG16 to try to patch the location pointed to by the data that is stored there. For current ROMs, these are RAM locations that happen to be more or less livable. Check the location pointed to by your ROMs, and make sure that neither your own code nor the debugger are loaded into that area. DEBUG16 will automatically read whatever value is stored there and store a vector to that address to regain control after a BRK.
Both programs are executed by putting the starting address of the routine to list or trace (which has been loaded into memory) at DPAGE + 80.82 ($380.82) in low - high - bank order, and then calling either the TRACE entry point at $2000, or the LIST entry at $2003.
Declarations
The listing begins with the declaration of global values by way of GEQU statements. Almost all of these are addresses of direct page memory locations that will be used; one notable exception is the label DPAGE, a sixteen-bit value that defines the beginning of the direct page memory to be used by this program. Because a 65816 debugger is by definition a 6502 debugger, it is wise to relocate the direct page out of the default zero page, since it will be used by 6502 programs, and you want to avoid conflicting memory usage between the debugger and the program being debugged. In the listing, a value of $300 is used; on an Apple //, this relocates the direct page to page three, which is a convenient page to use.
Many of the direct page locations are used to store the register contents of the user program when the debugger is executing. All of the registers are represented. As you will see in the code, the adjacent positioning of some of the registers is important and must be maintained.
In addition to the direct page locations used for register storage, one general-purpose temporary variable is used, called TEMP. Three other variables—ADDRMODE, MNX, and OPLEN (for address mode, mnemonic index, and operation length, respectively)—are used primarily to access the tables used in disassembling an instruction.
The variable CODE contains the instruction opcode currently being executed in the user program. The variable NCODE contains the next instruction opcode to be executed, saved there before being replaced with the BRK instruction inserted in the code. OPRNDL, OPRNDH, and OPRNDB contain the three (possible) values of the operand of a given instruction.
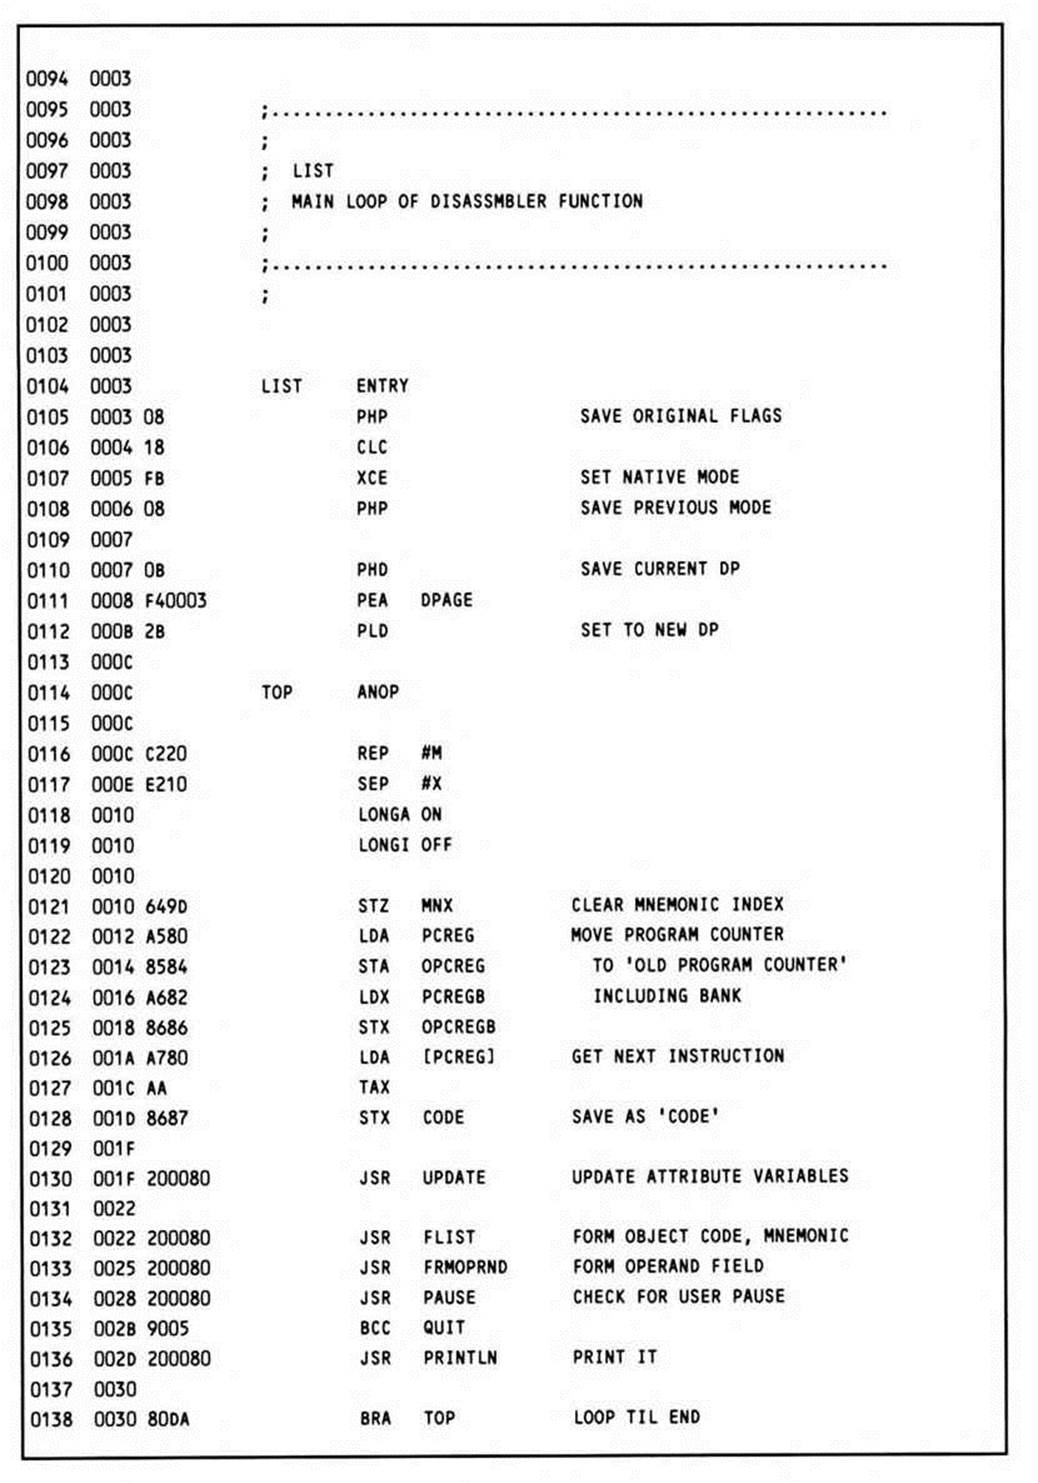
LIST
The program has two entry points, defined in the first routine. One is for listing (disassembling) a program, the other for tracing. The first entry point, at the program's origin (default $8000), is a jump to the actual entry point of the trace routine; the second, immediately past it (at $8003), is the beginning of the code for the disassembler.
Since this is a bare-bones disassembler, intended to be expanded and perhaps integrated with a general purpose machine language monitor, parameters such as the start address of the program to be traced are entered by modifying the values of the register variables; for example, to begin disassembly of a program stored at $800, the values $00, $08, and $00 are stored starting at PCREG. Since the direct page is relocated to page three, the absolute location of this variable is $380.
Starting at the LIST entry, some basic initialization is performed: saving the status register, switching to native mode, and then saving the previous operating mode (emulation/native) by pushing the status register a second time (the carry flag now containing the previous contents of the e bit). Thus this program may be called from either native or emulation mode.
The current value of the direct page is saved in program memory, and then the new value—DPAGE—is stored to the direct page register. The native mode is entered.
Control now continues at TOP, the beginning of the main loop of the disassembler. The mode is set to long accumulator, short index. This combination allows simple manipulation of both byte and double-byte values. The value of PCREG is copied to OPCREG (old pcreg).OPCREG will contain the starting location of the current instruction throughout the loop; PCREG will be modified to point to the next instruction. However, it hasn't been modified yet, so it is used to load the accumulator with the opcode byte. Indirect long addressing is used, so code anywhere within the sixteen-megabyte address space may be disassembled. Since the accumulator is sixteen bits, a second byte is fetched as well, but ignored; the next instruction transfers the opcode to the X register and then stores it at the location CODE.
The utility routine UPDATE is called next. This is common to both the disassembler and the tracer, and determines the attributes of this instruction by looking the instruction up in a table; it also increments the program counter to point to the next instruction.
The routines FLIST, FRMOPRND, and PRINTLN form the disassembled line and display it. After each line is printed, the routine PAUSE is called to check the keyboard to see if a key has been pressed, signalling a pause. If PAUSE returns with the carry clear, it means the user has signalled to quit, and control falls through to QUIT; otherwise, the program loops to TOP again, where it repeats the process for the next instruction.
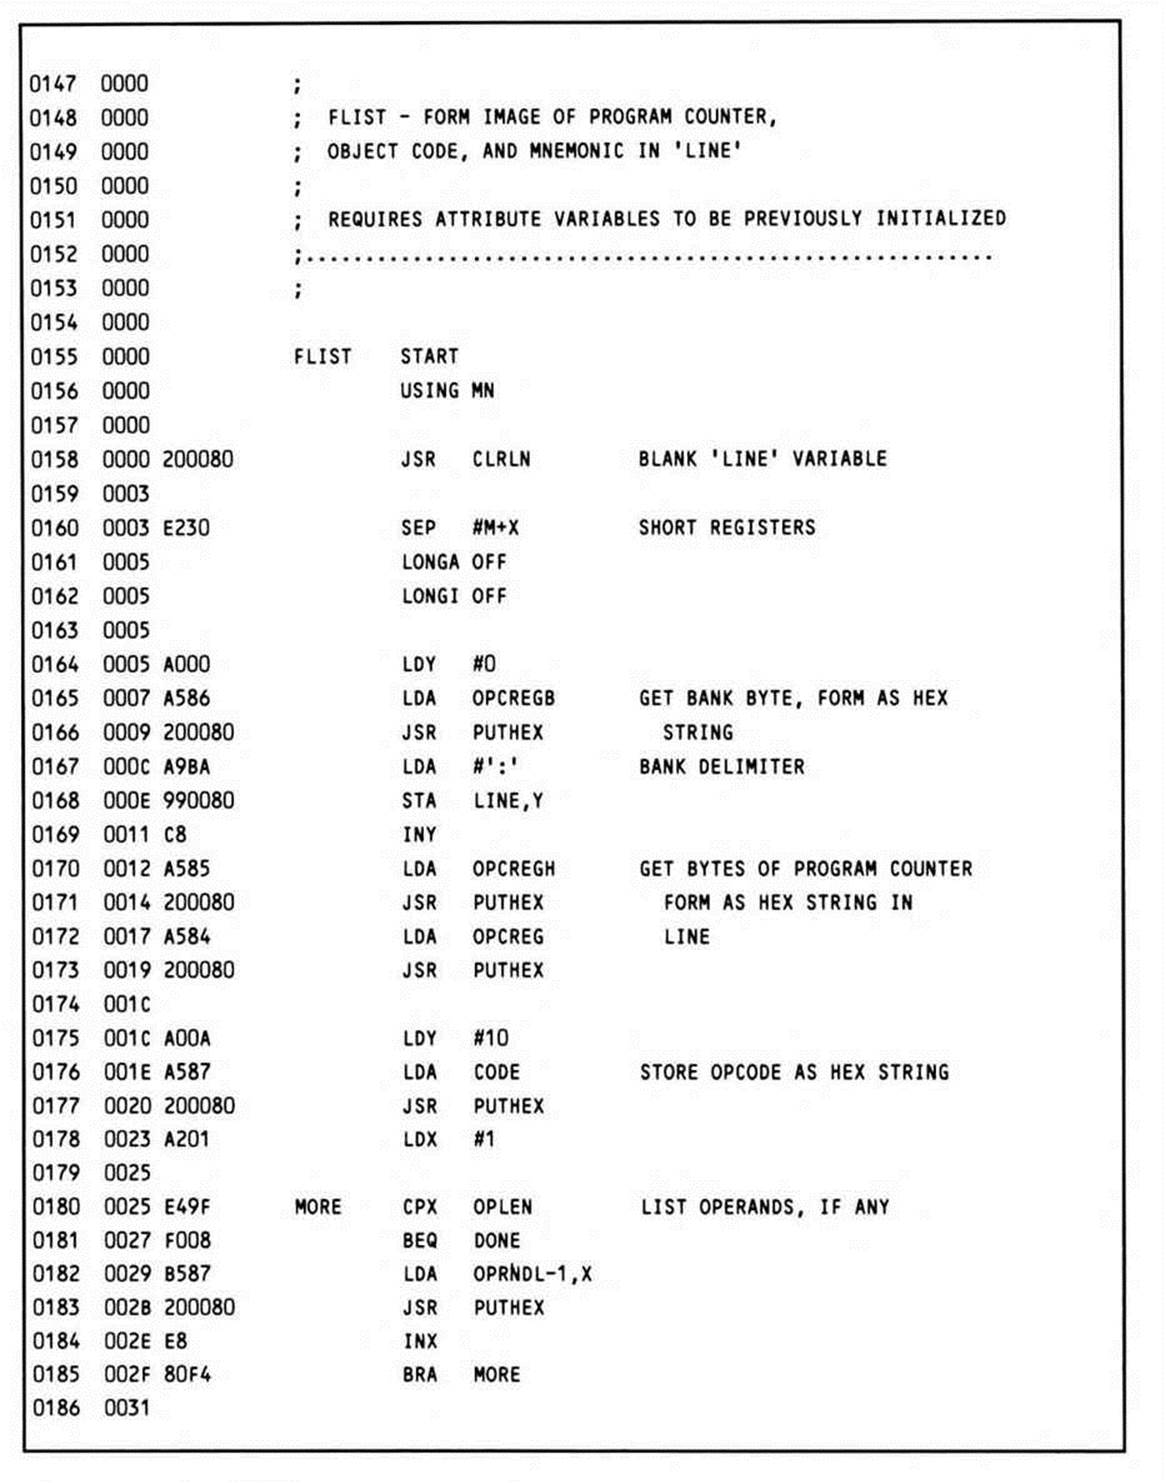
FLIST
FLIST is called by both the disassembler and the tracer. This routine displays the current program counter value, the object code of the instruction being disassembled in hexadecimal, and the mnemonic for the opcode. The code required to do this is basically the same for any instruction, the only difference being the length of the instruction, which has already been determined by UPDATE.
The first thing the code does is to blank the output buffer by calling CLRLN. Particularly since 6502 emulation-mode I/O routines are used, it is more efficient to build an output line first, then display it all at once, rather than output the line "on the fly." Characters are stored in the output buffer LINE via indexed absolute addressing; the Y register contains a pointer to the current character position within the line, and is incremented every time a character is stored. Since character manipulation is the primary activity in this routine, the accumulator is set to eight bits for most of the routine.
The flow of the program proceeds to generate the line from left to right, as it is printed; the first characters stored are therefore the current program counter values. Since UPDATE has already modified the program counter variable to load the operands of the instruction, the value in the variable OPCREG is used. The hex conversion routine, PUTHEX, converts the data in the accumulator into the two ASCII characters that represent the number's two hexadecimal digits, storing each character at the location pointed to by LINE,Y, and then incrementing Y to point to the next character. A colon is printed between the bank byte and the sixteen-bit program counter display to aid readability.
Next, some spaces are skipped by loading the Y register with a higher value, and the object code bytes are displayed in hexadecimal. These values have already been stored in direct page memory locations CODE and OPRNDL, OPRNDH, and OPRNDB by the UPDATEroutine, which also determined the length of the instruction and stored it at OPLEN. The length of the operand controls a loop that outputs the bytes; note that a negative displacement of one is calculated by the assembler so that the loop is not executed when OPLEN is equal to one.
All that remains is to print the instruction mnemonic. The characters for all of the mnemonics are stored in a table called MN; at three characters per mnemonic (which as you may have noticed is the standard length for all 65x mnemonics), the mnemonic index (MNX) determined by UPDATE from the instruction attribute table must be multiplied by three. This is done by shifting left once (to multiply by two), and adding the result to the original value of MNX. Note that this type of "custom” multiplication routine is much more efficient than the generalized multiplication routines described in the previous chapter. The characters in the mnemonic table are copied into the output line using the MVN instruction; the result just calculated is transferred into the X register as the source of the move. It is the line-buffered output that allows use of the block-move instruction; on-the-fly output would have required each character to be copied out of the mnemonic table in a loop.
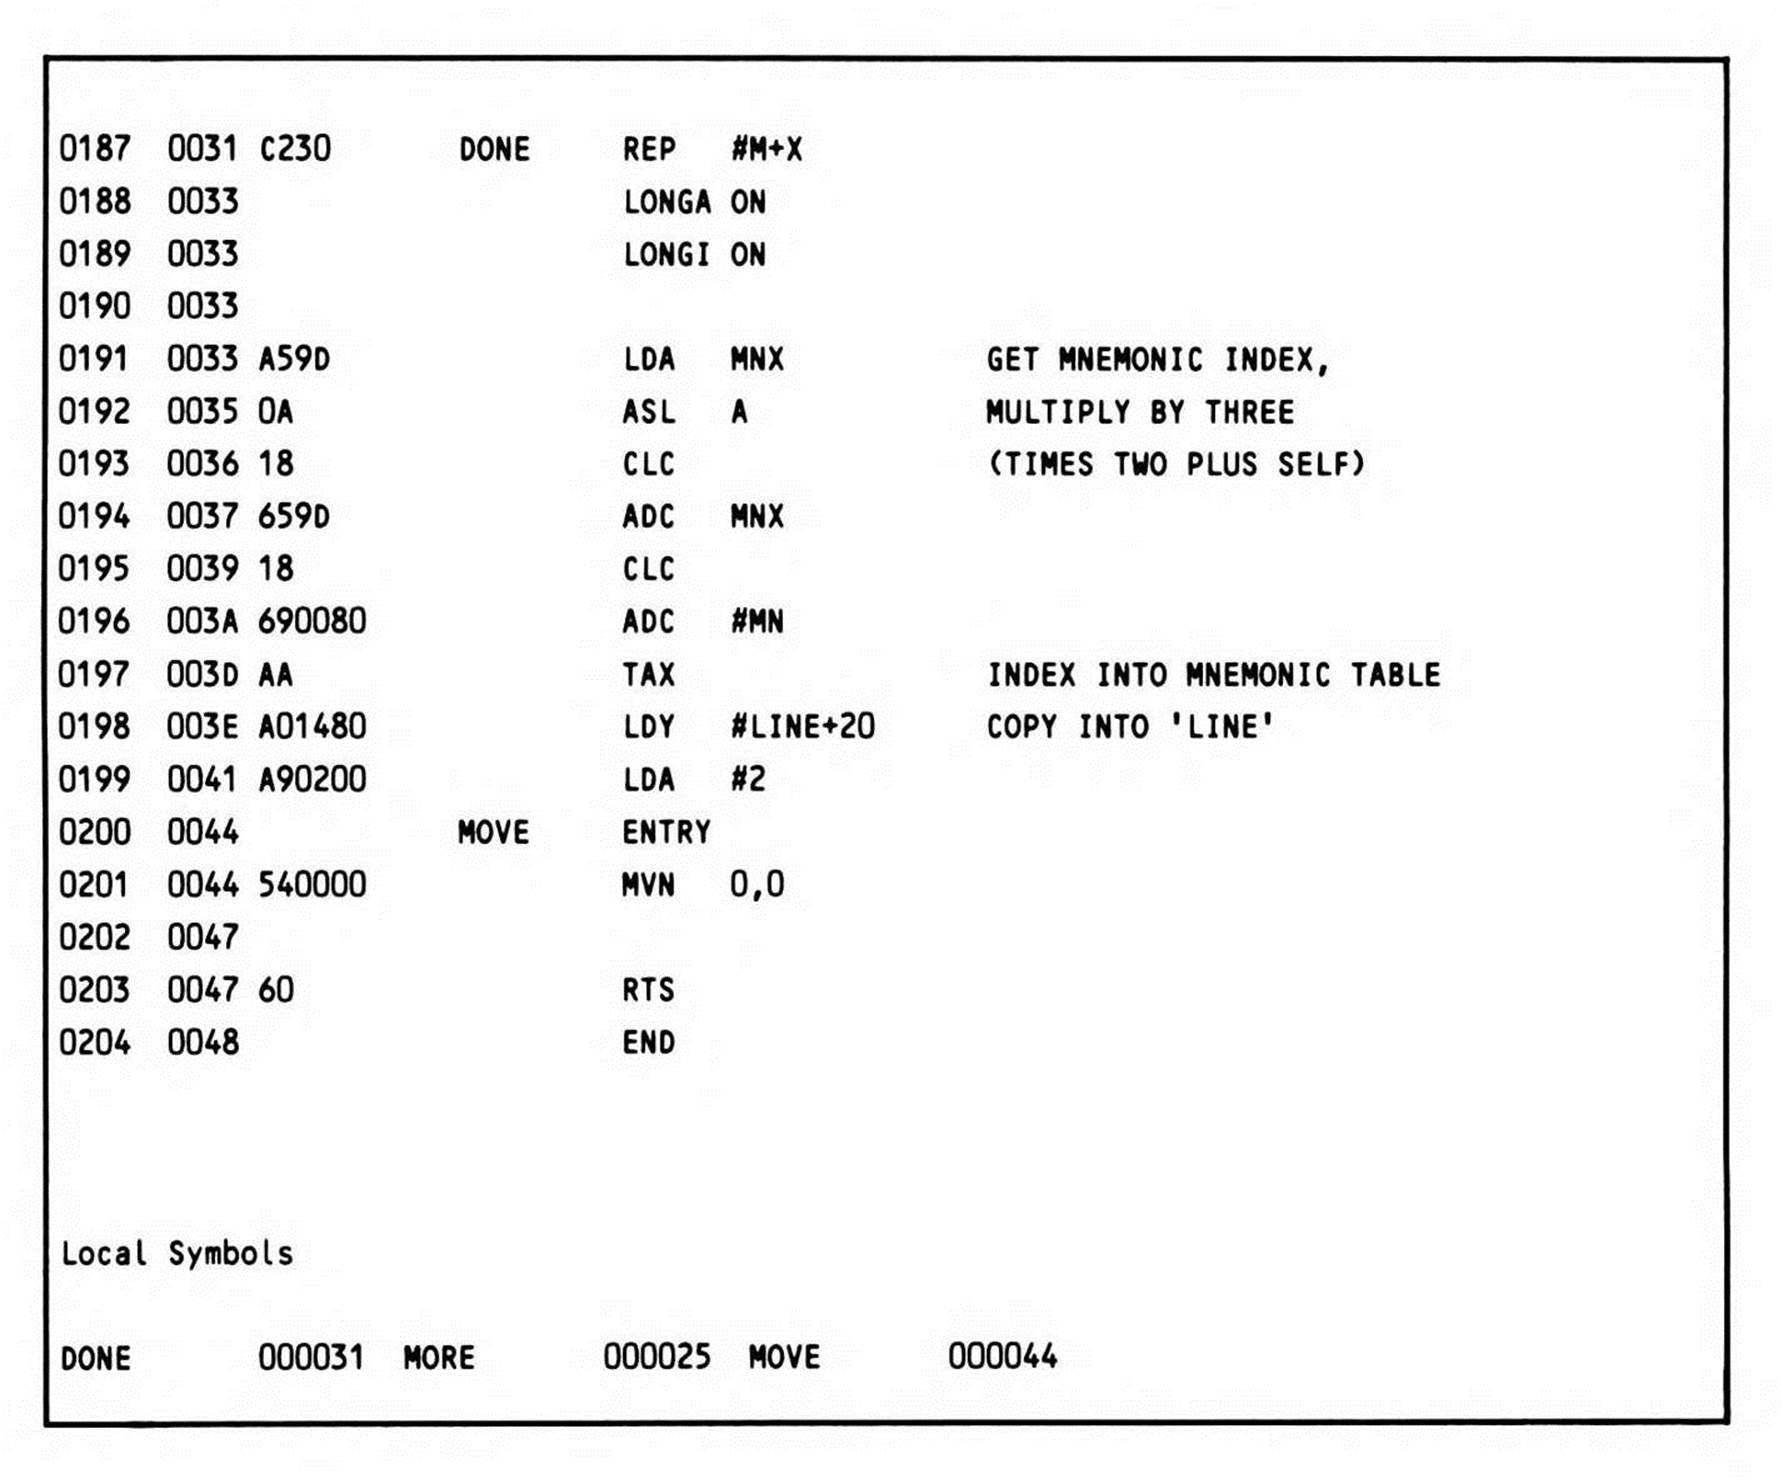
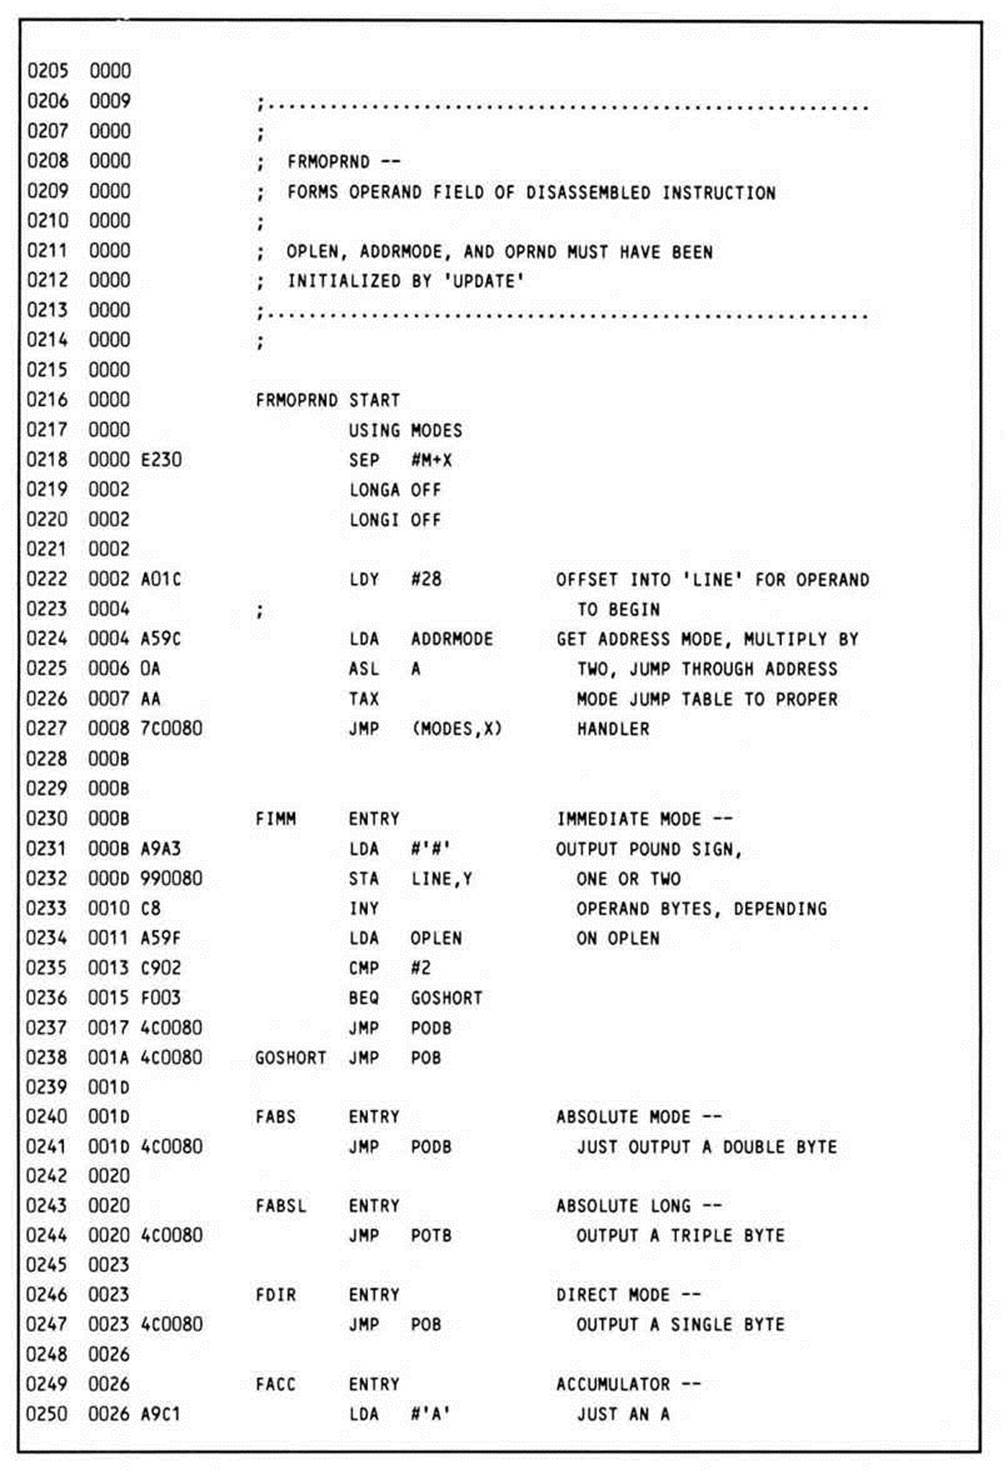
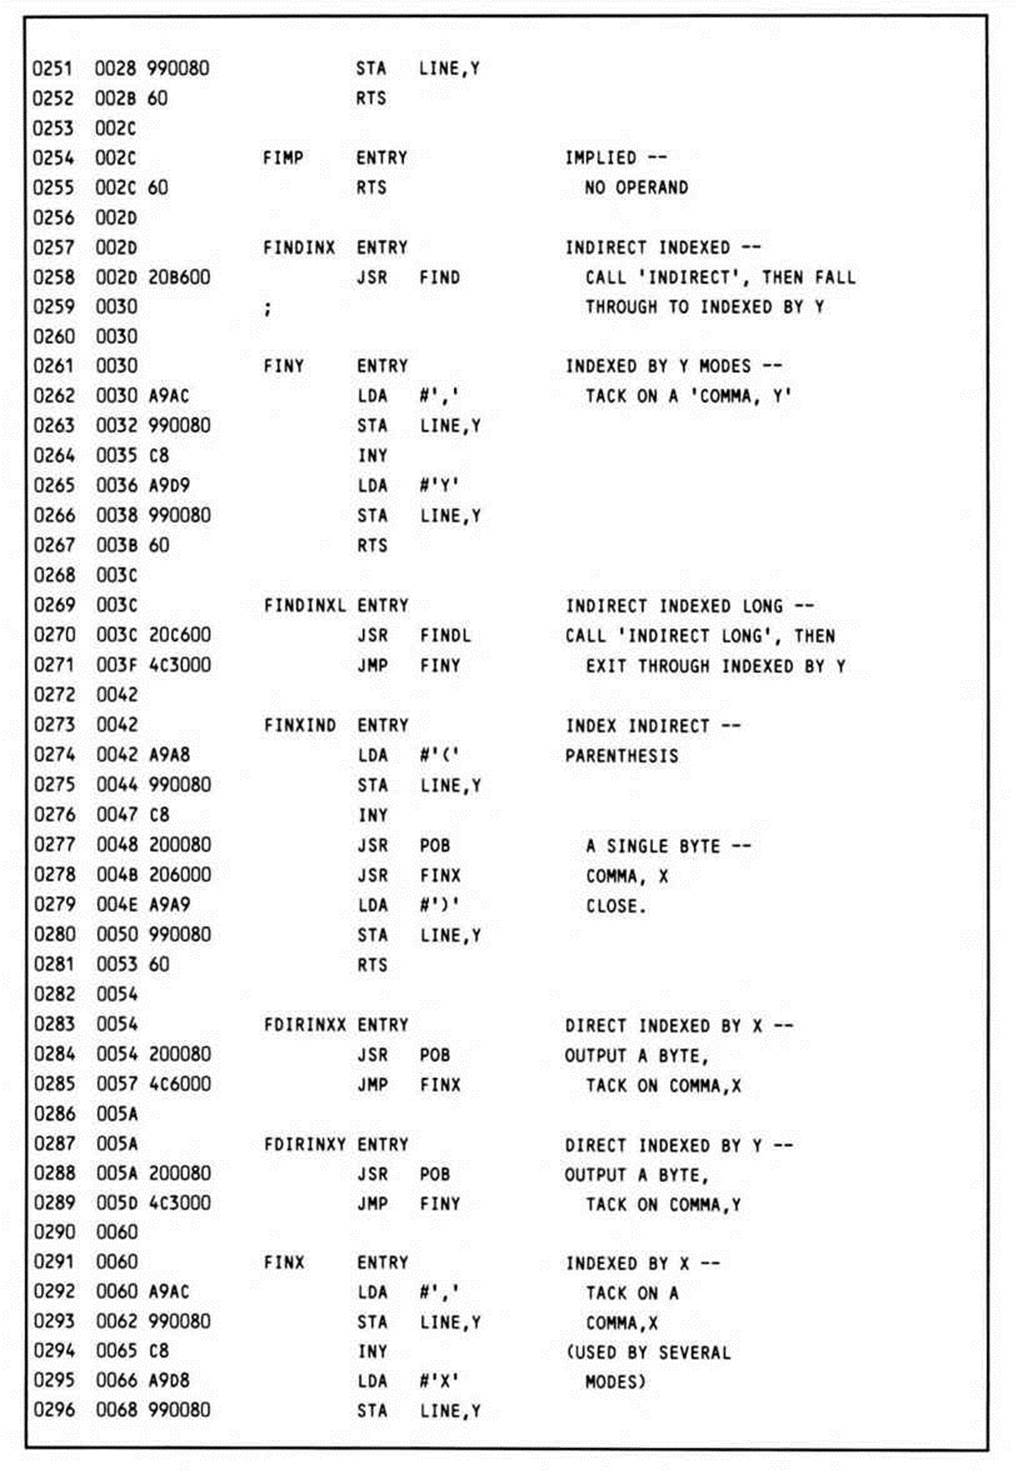
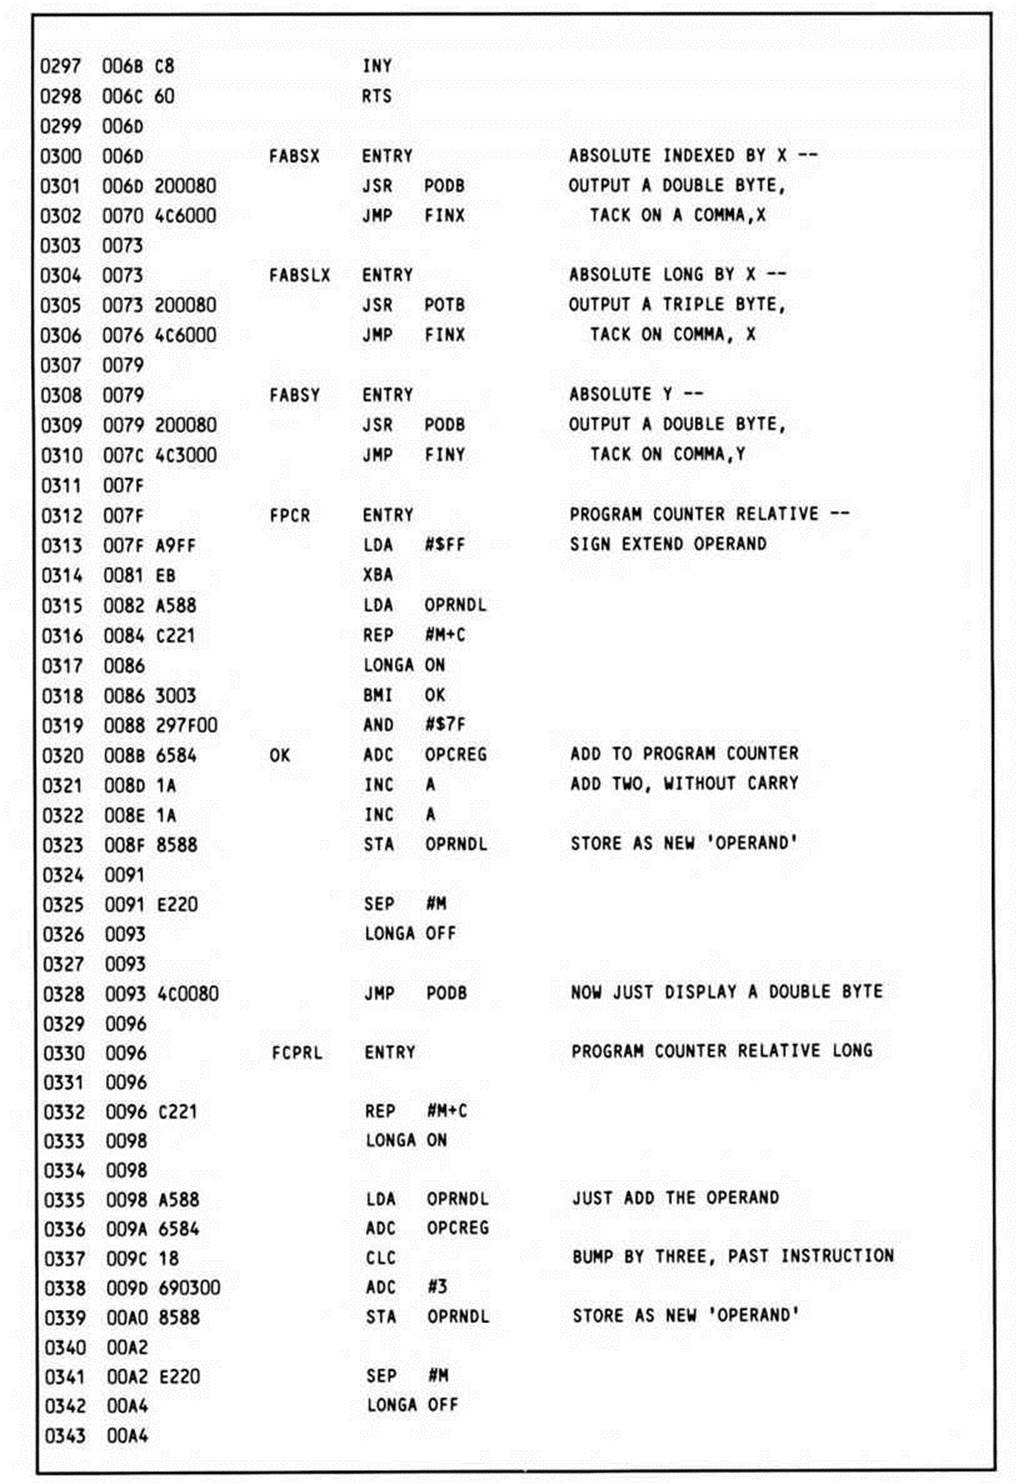
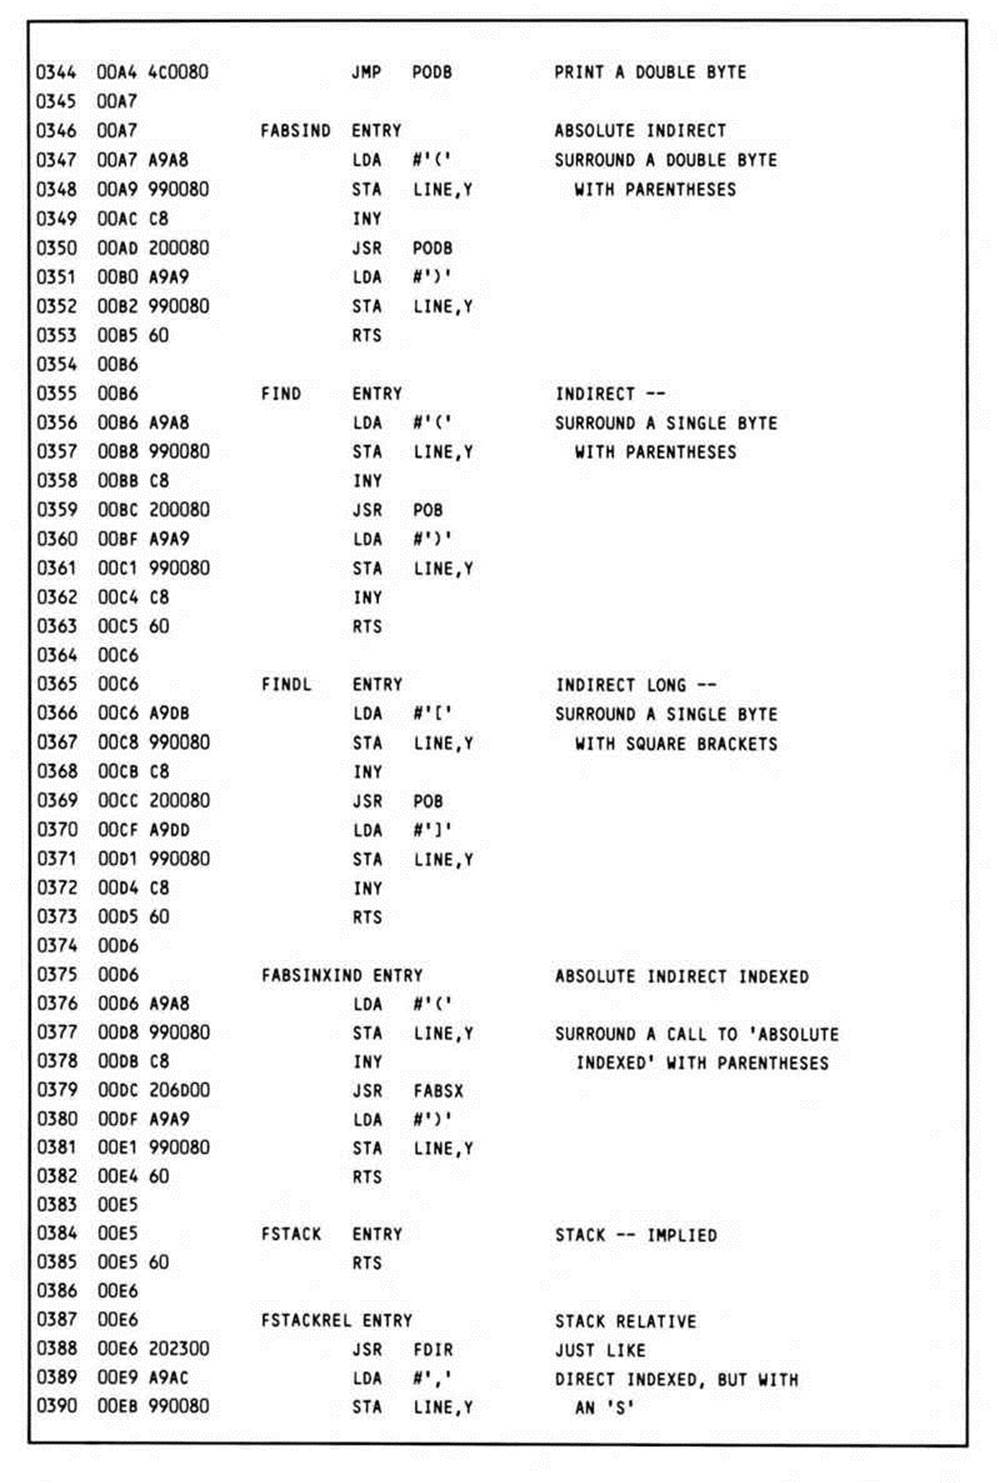
FRMOPRND
This routine is the second part of the line-disassembly pair. It performs the address-mode specific generation of the disassembled operand field; the result is similar to the address mode specification syntax of a line of 65x source code.
The Y register is loaded with the starting destination in LINE, and the attribute stored at ADDRMODE is multiplied by two to form an index into a jump table. There is a separate routine for each addressing mode; the address of that routine is stored in a table called MODESin the order that corresponds to the attributes given them from the attribute table.
The JMP indirect indexed instruction is used to transfer control through the jump table MODES to the appropriate routine, whose index, times two, has been loaded into the X register.
Each of the routines is basically similar; they output any special characters and print the address of the operand found in the instruction stream. There are three related routines, POB, PODB, and POTB (for put operand byte, put operand double byte, and put operand triple byte) which output direct page, absolute, and absolute long addresses.
The two routines FPCR and FPCRL, which handle the program counter relative instructions, however, must first calculate the destination address (which is how an assembler would specify the operand, so this is how they are disassembled) by adding the actual operand, a displacement, to the current program counter. The operand of a short program counter relative instruction is sign-extended before adding, resulting in a sixteen-bit signed displacement which is added to the program counter to find the destination address.
POB
This routine (put operand byte), with three entry points, outputs a dollar sign, followed by either one, two, or three operand bytes in hexadecimal form; it calls the routine PUTHEX to output the operand bytes. It is called by FRMOPRND.
Depending on the entry point, the X register is loaded with 0, 1, or 2, controlling the number of times the loop at MORE is executed; on each iteration of the loop, an operand byte is loaded by indexing into OPRNDL and then printed by PUTHEX.
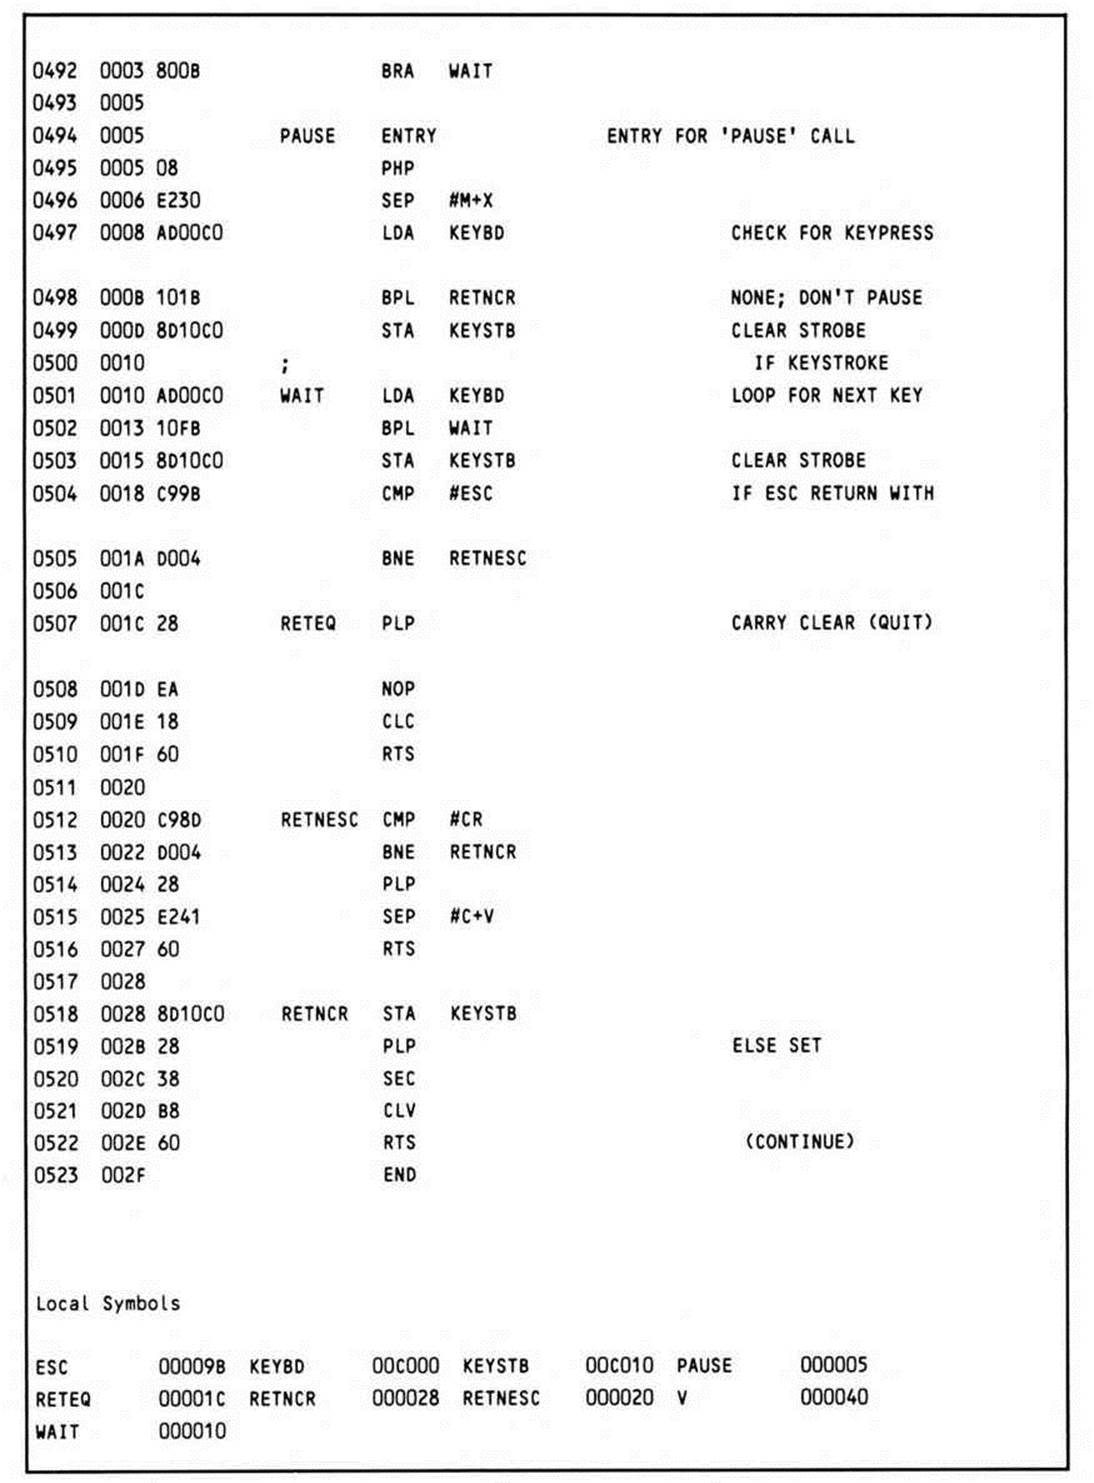
STEP
This routine also contains the PAUSE entry point called by LIST; STEP waits until a keypress, PAUSE simply checks to see if a key has been pressed, and waits only if there has been an initial keypress. In both cases, the wait loop continues until the next keypress. If the keypress that exits the wait loop was the ESCAPE key, the carry is cleared, signalling the calling program that the user wants to quit rather than continue. If it was RETURN, the overflow flag is cleared; the tracer uses this toggle between tracing and single stepping. Any other keypress causes the routine to return with both flags set.
The code in this listing is machine-dependent; it checks the keyboard locations of the Apple //. Since this is a relatively trivial task, in-line code is used rather than a call to one of the existing 6502 monitor routines; therefore, the processor remains in the native mode while it performs this I/O operation.
Like all utility routines, STEP saves and restores the status on entry and exit.
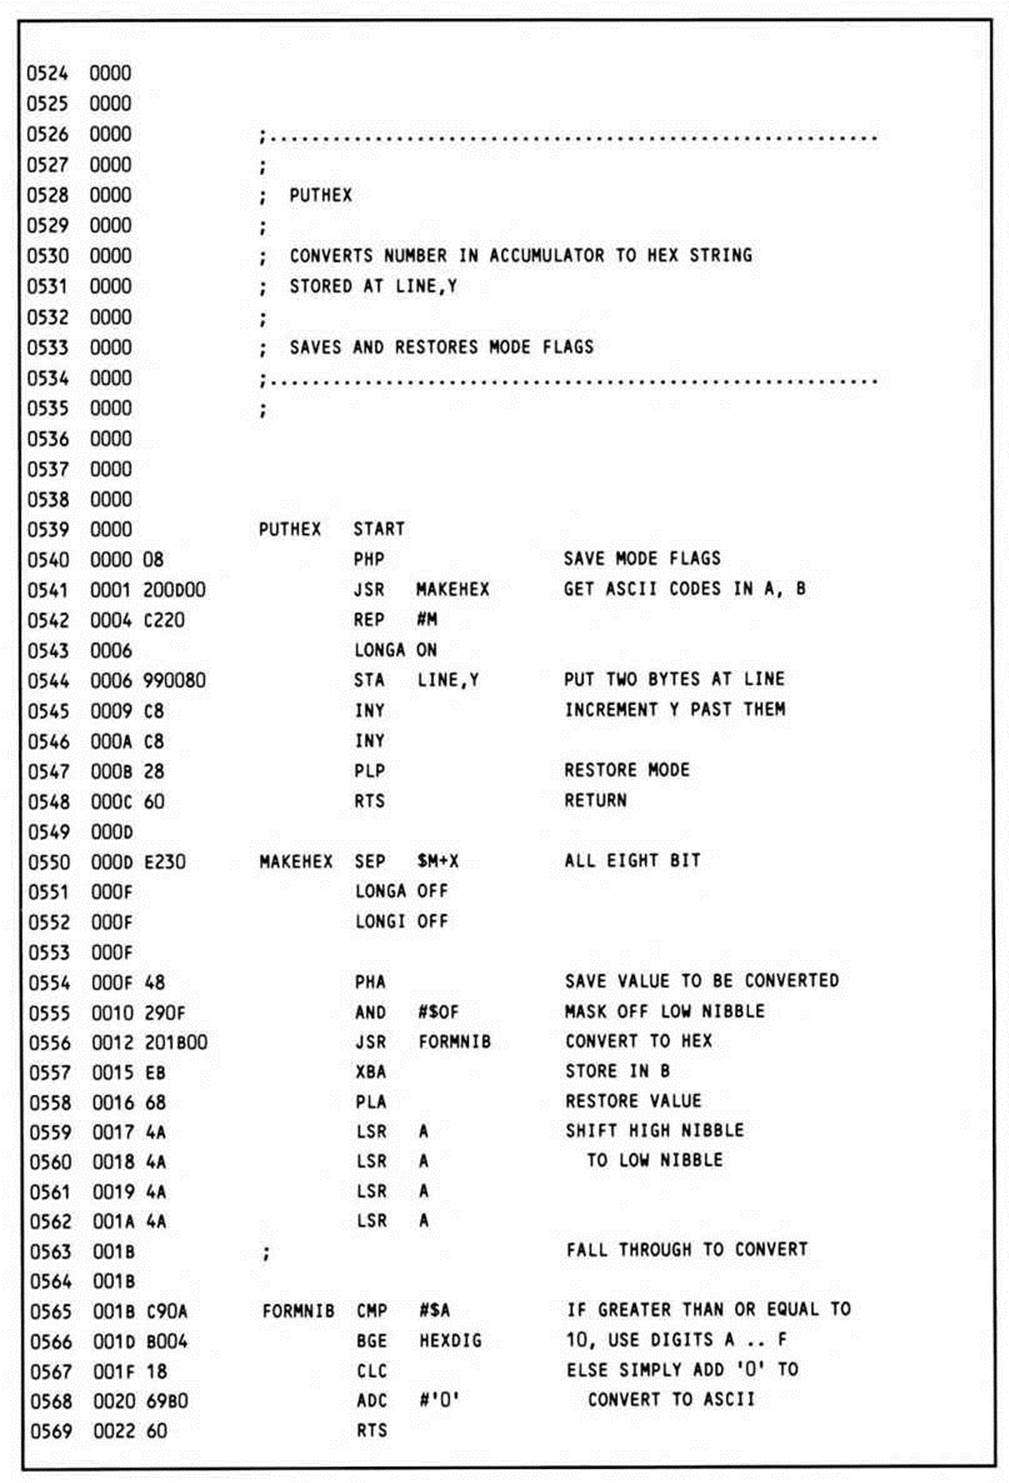
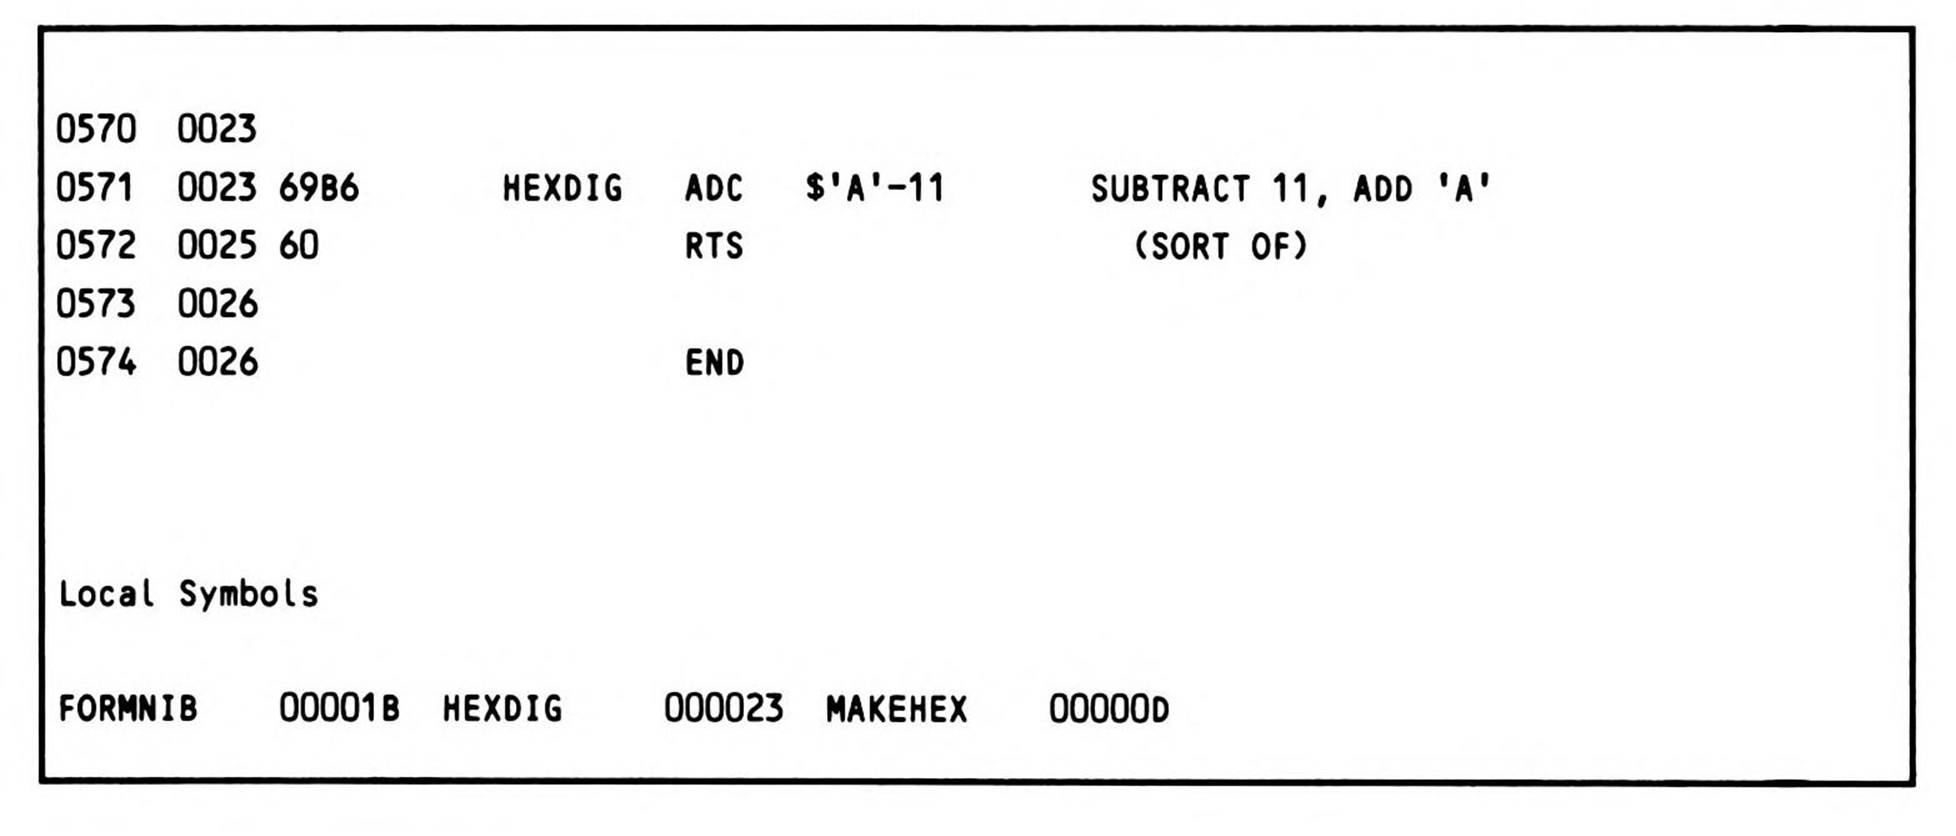
PUTHEX
This utility routine, already referred to in several descriptions, is called whenever a hexadecimal value needs to be output. It converts the character in the low byte of the accumulator into two hexadecimal characters, and stores them in the buffer LINE at the position pointed to by the Y register.
PUTHEX calls an internal subroutine, MAKEHEX, which does the actual conversion. This call (rather than in-line code) allows MAKEHEX to first call, then fall through into, an internal routine, FORMNIB.
When MAKEHEX returns, it contains the two characters to be printed in the high and low bytes of the accumulator; MAKEHEX was processed with the accumulator eight bits wide, so the sixteen-bit mode is switched to, letting both bytes be stored in one instruction. The Y register is incremented twice, pointing it to the space immediately past the second character printed.
FORMNIB is both called (for processing the first nibble) and fallen into (for processing the second). Thus the RTS that exits FORMNIB returns variously to either MAKEHEX or PUTHEX. This technique results in more compact code than if FORMNIB were called twice.
The conversion itself is done by isolating the respective bits, and then adding the appropriate offset to form either the correct decimal or alphabetic (A-F) hexadecimal character.
Like all utility routines, the status is saved and restored on entry and exit.
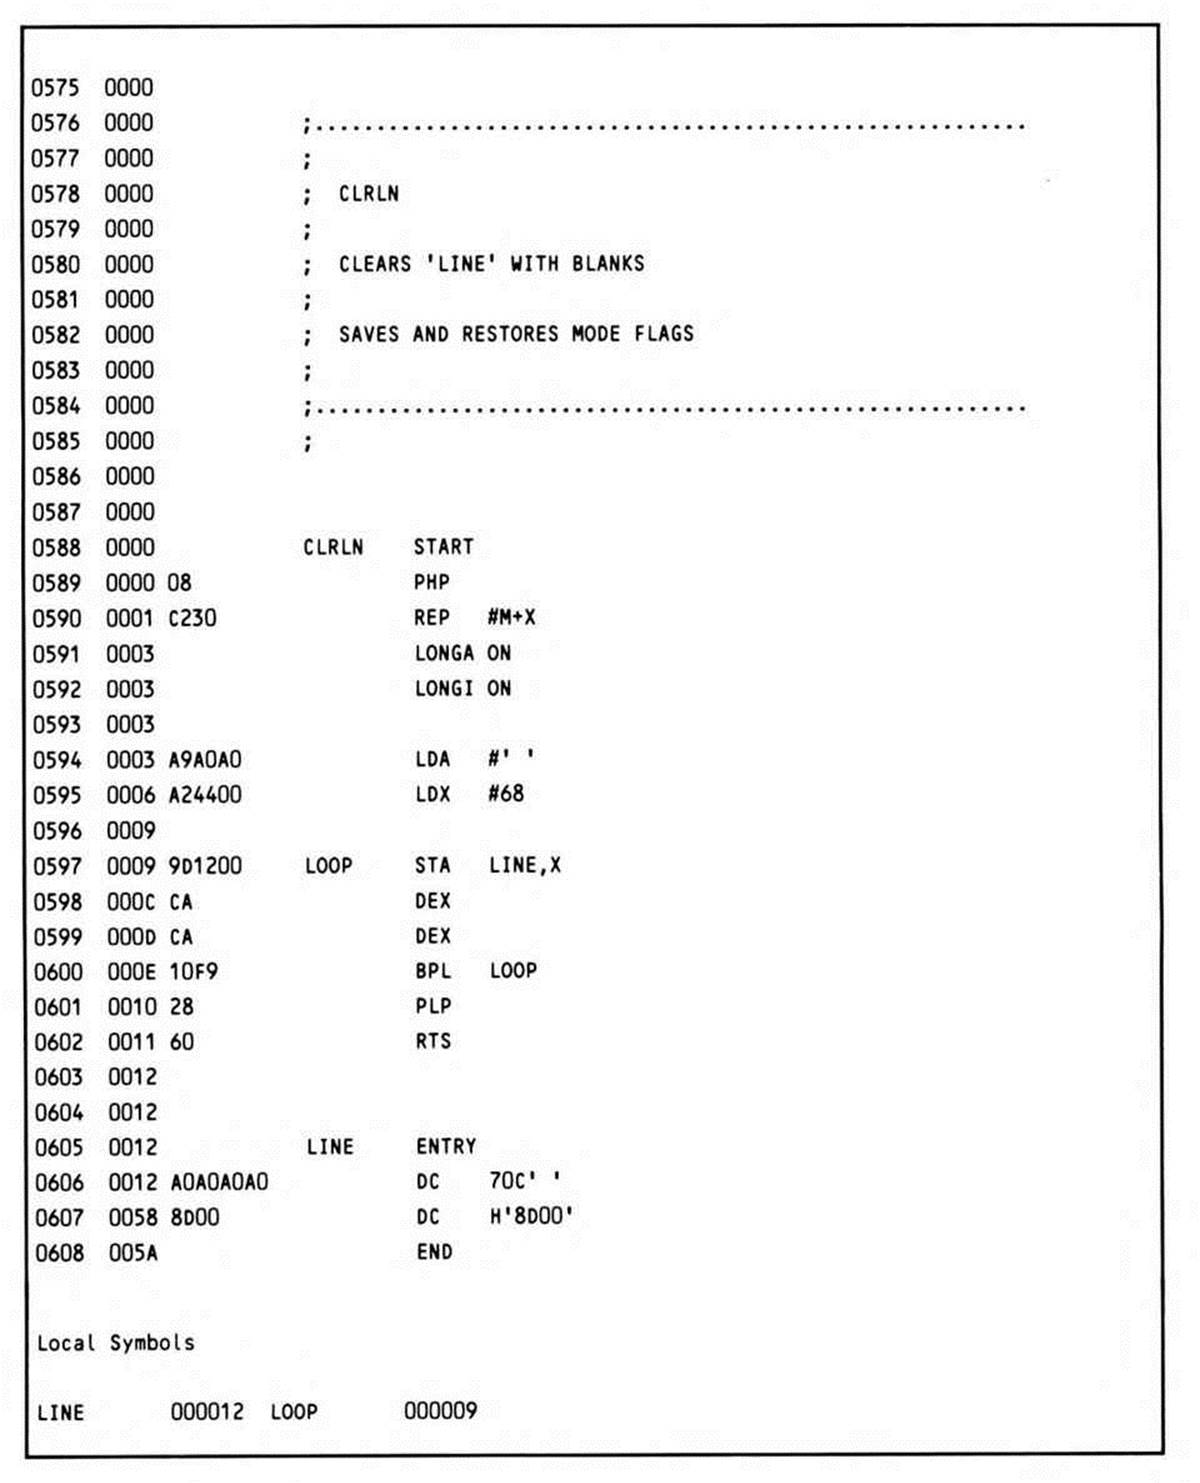
CLRLN
CLRLN performs the very straightforward task of clearing the output buffer, LINE, to blanks. It also contains the global storage reserved for LINE.
Like the other utility routines, CLRLN saves and restores the status.
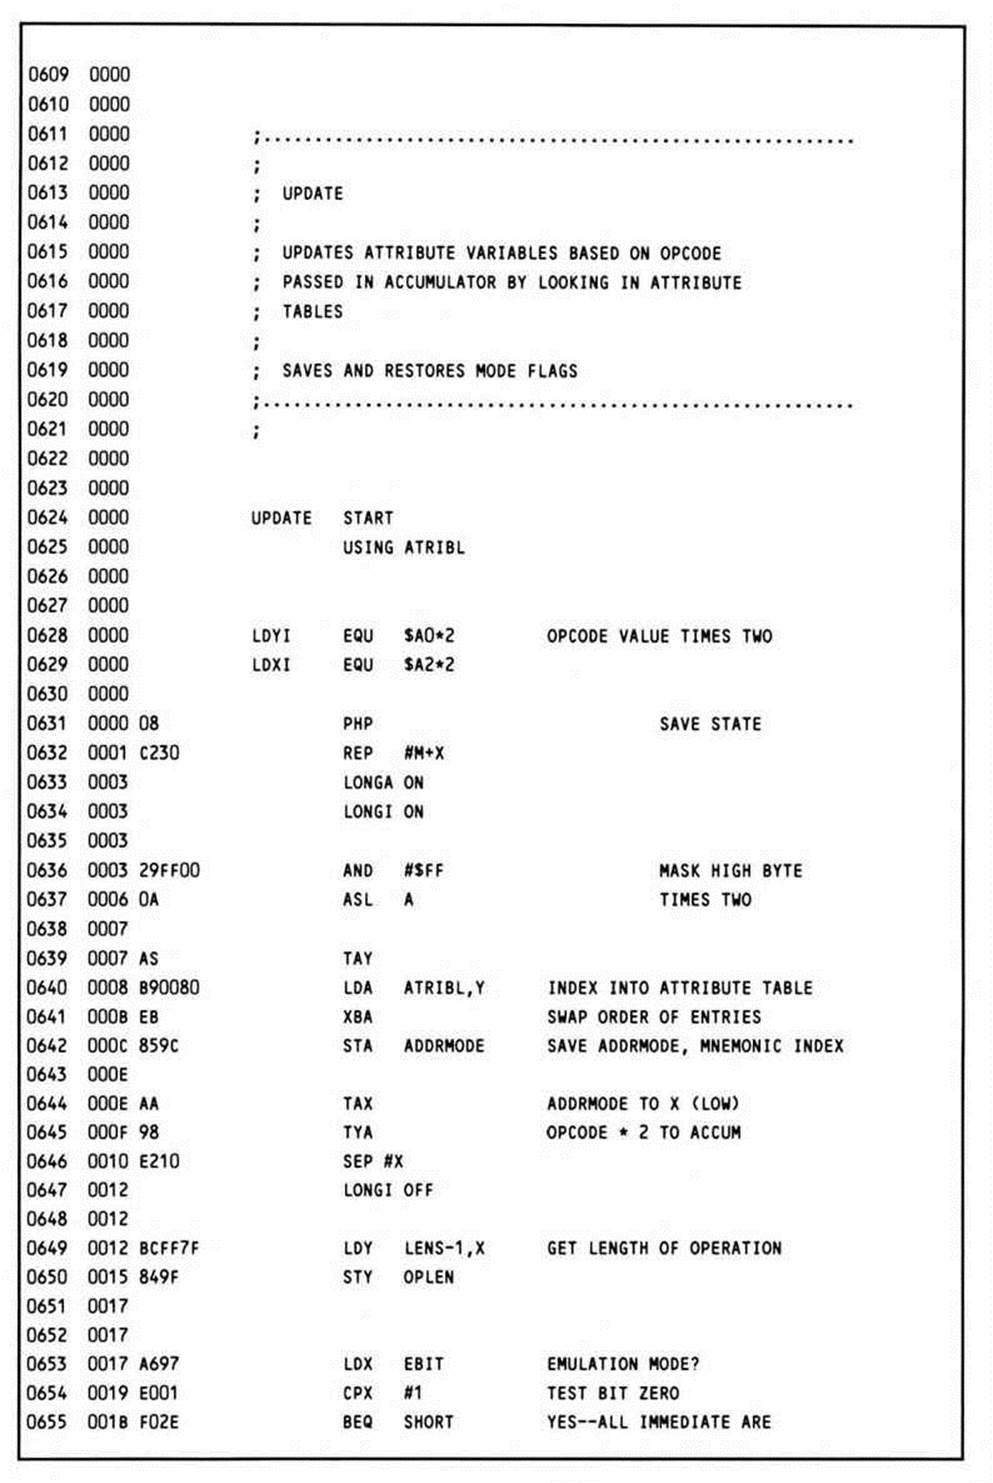
UPDATE
This routine, common to both the disassembler and the tracer, updates the program counter and other direct page variables—the address mode attribute (ADDRMODE) and the length (OPLEN)—and, using the length, reads the instruction operands into direct page memory.
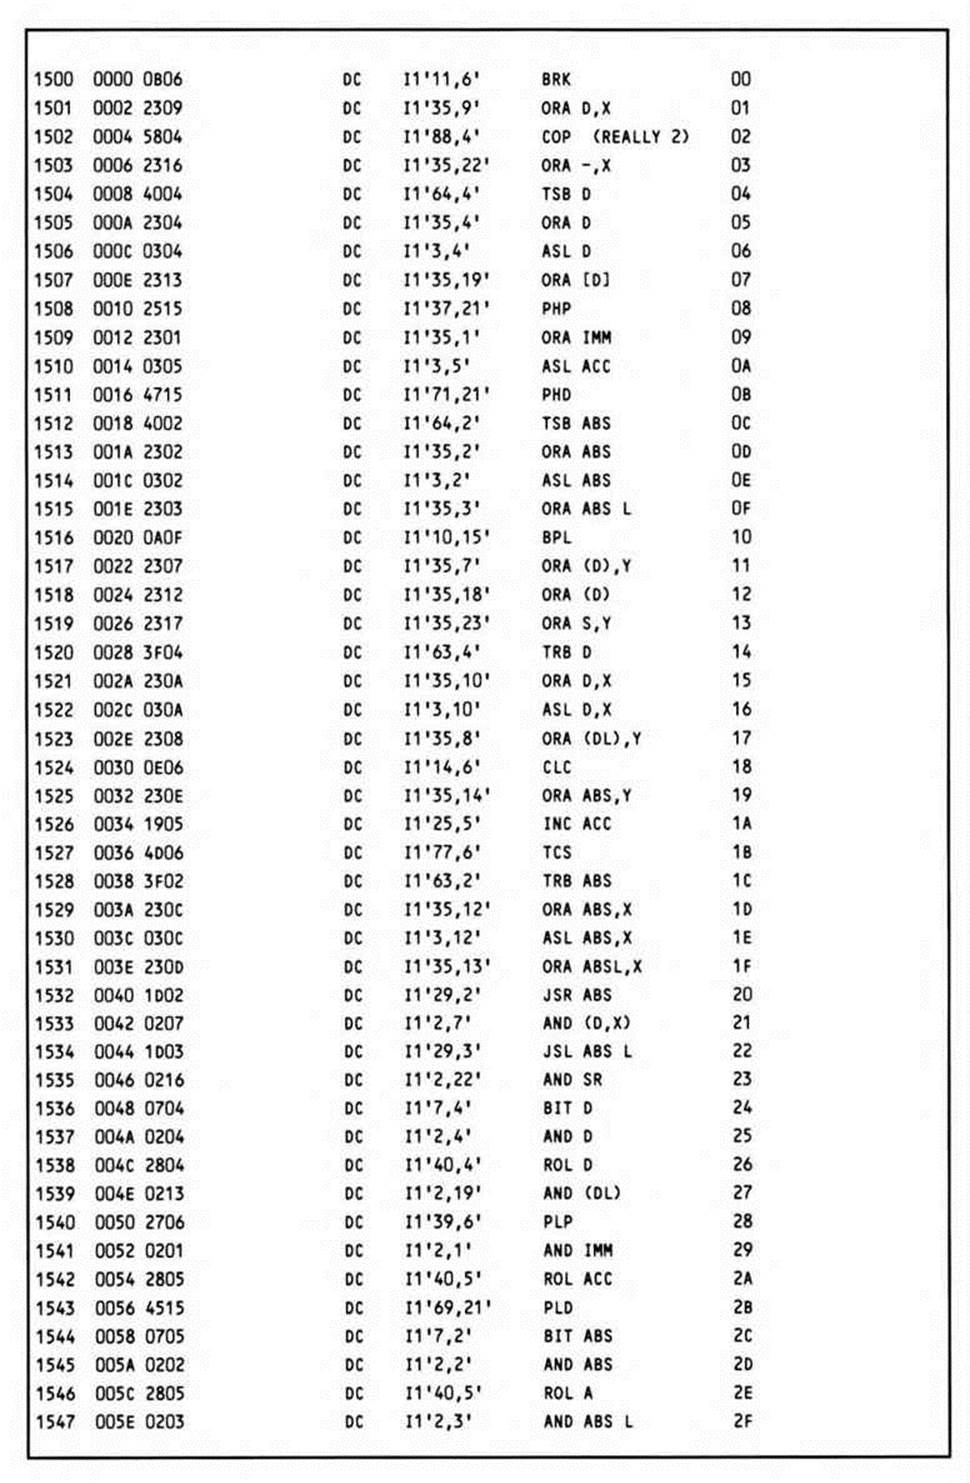
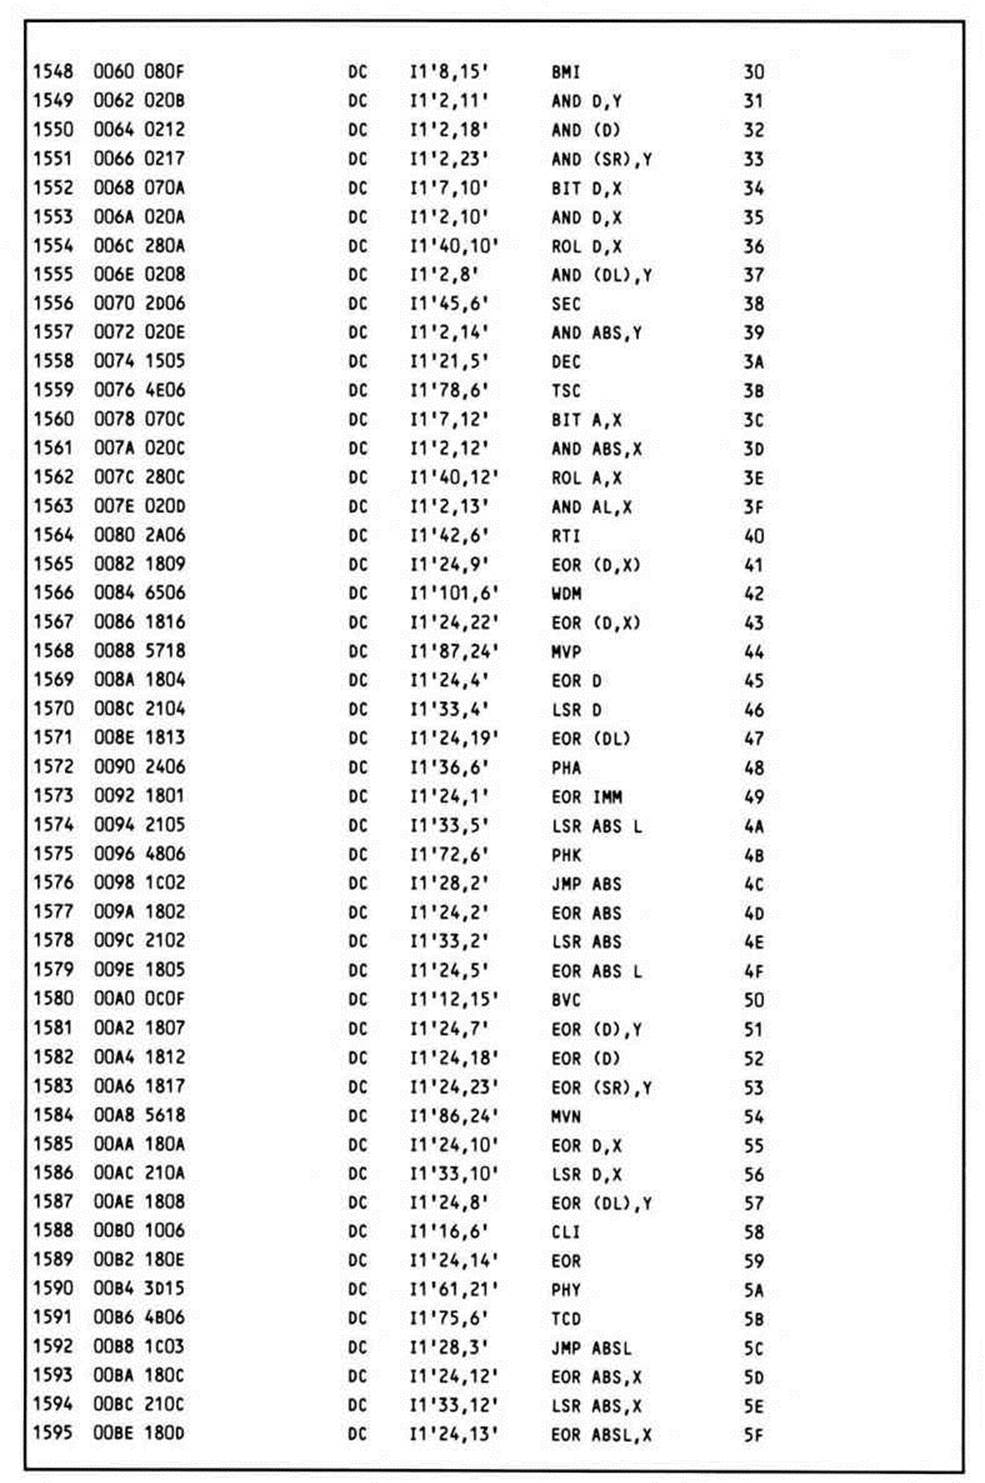
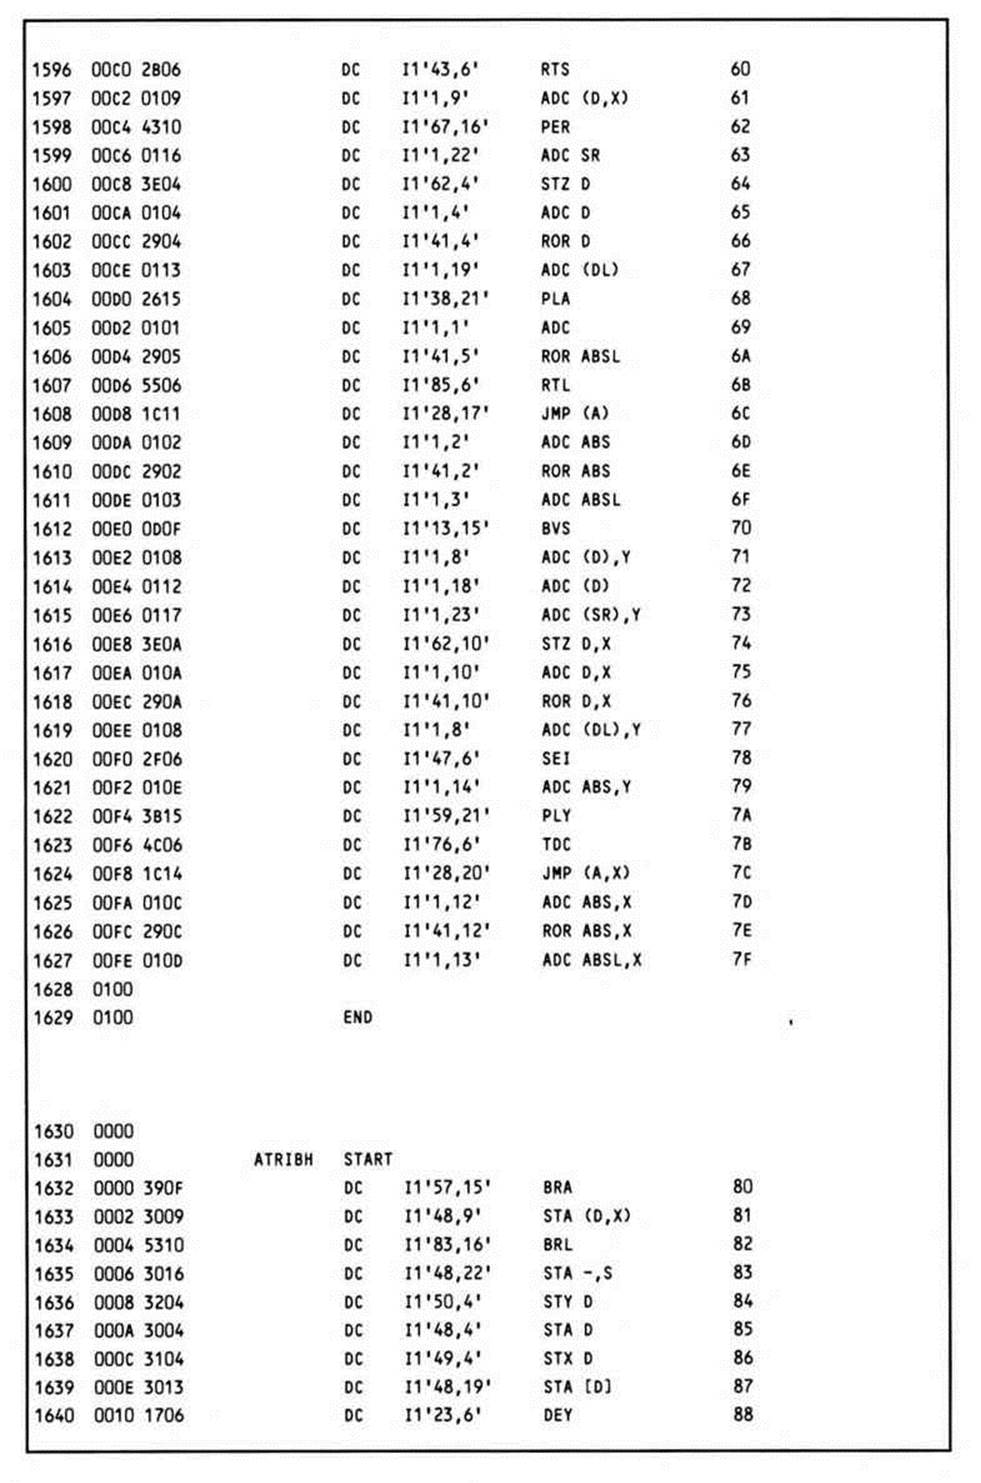
The address mode and length attributes are stored in a table called ATRIBL, two bytes per instruction. Since there are 256 different opcodes, the table size is 512 bytes. The current opcode itself, fetched previously, is used as the index into the table. Since the table entries are two bytes each, the index is first multiplied by two by shifting left. Since the sixteen-bit accumulator was used to calculate the index, both attribute bytes can be loaded in a single operation; since their location in direct page memory is adjacent, they can be stored in a single operation as well.
Normally, the value of OPLEN loaded from the attribute table is the correct one; in the case of the immediate addressing mode, however, the length varies with the setting of the m and x flags. The opcodes for the immediate instructions are trapped using just three comparisons, an AND, and four branches to test the opcode bits. Note that the immediate operands are multiplied times two because the opcode already happens to be shifted left once. If the current instruction uses immediate addressing, the stored value of the status register is checked for the relevant flag setting; if m or x, as appropriate, is clear, then OPLEN is incremented. The routines that output the immediate operand now know the correct number of operand bytes to print, and the tracer knows where the next instruction begins.
The status is saved on entry and restored on exit.
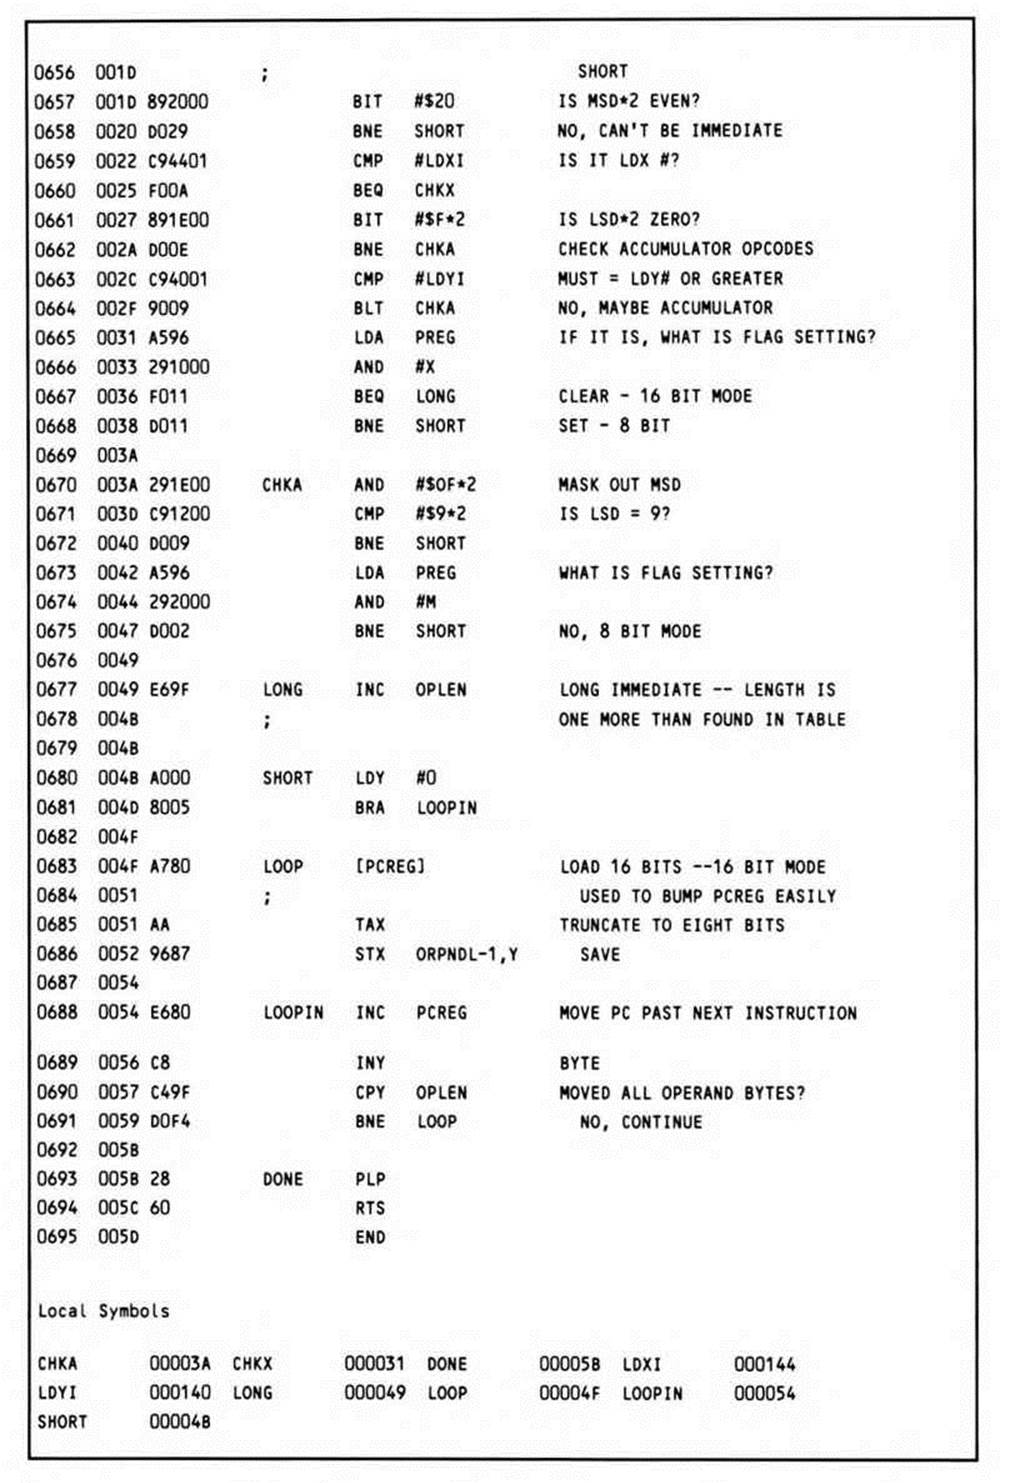
PRINTLN
This is the output routine. In this version, an existing 6502 output routine is called, necessitating a reversion to the emulation mode. Since this is the only place a 6502 routine is called, a simpler mode-switching routine than the generalized one of the previous chapter is used. The user registers do not need to be preserved, but zero needs to be swapped into the direct page to make it address page zero.
The main loop is in the emulation mode until the null terminal byte of LINE is encountered; on exit, the native mode, direct page, and status are restored.
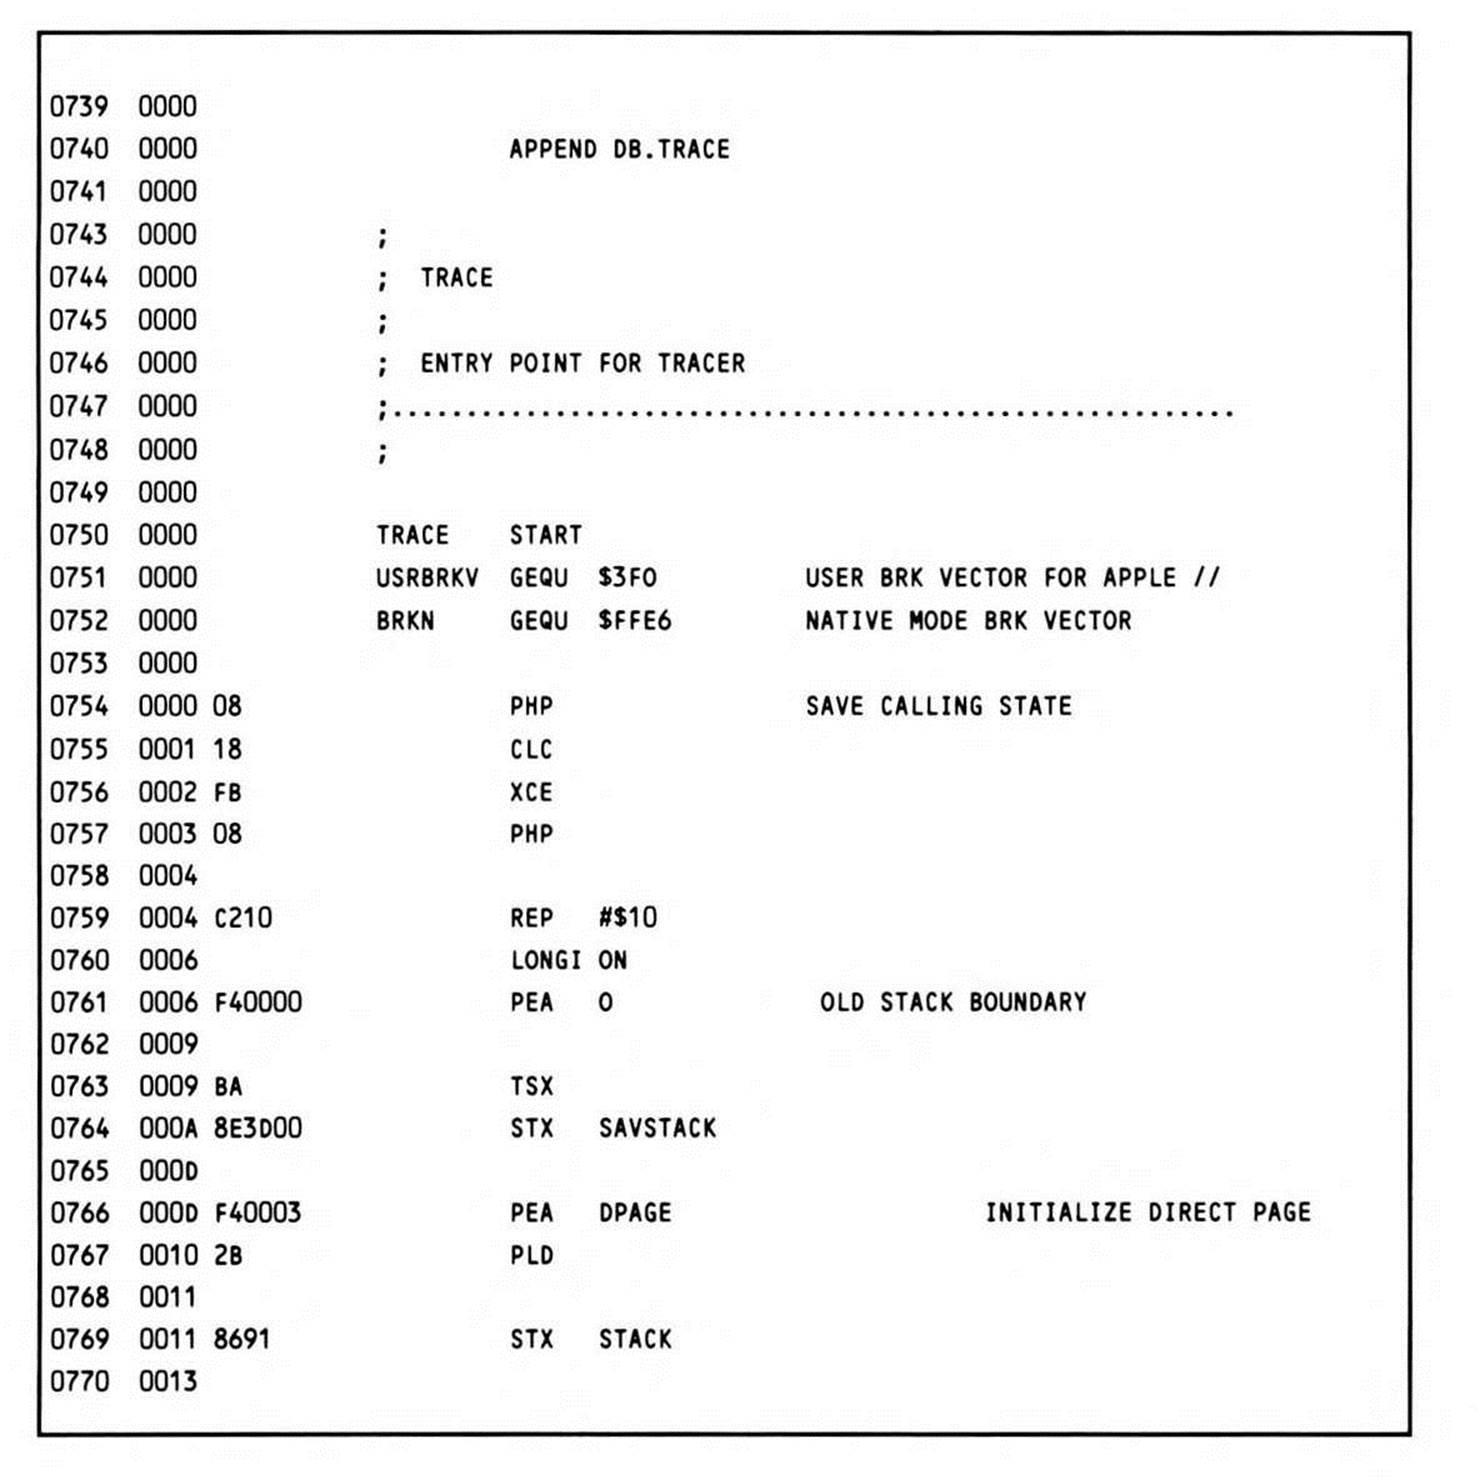
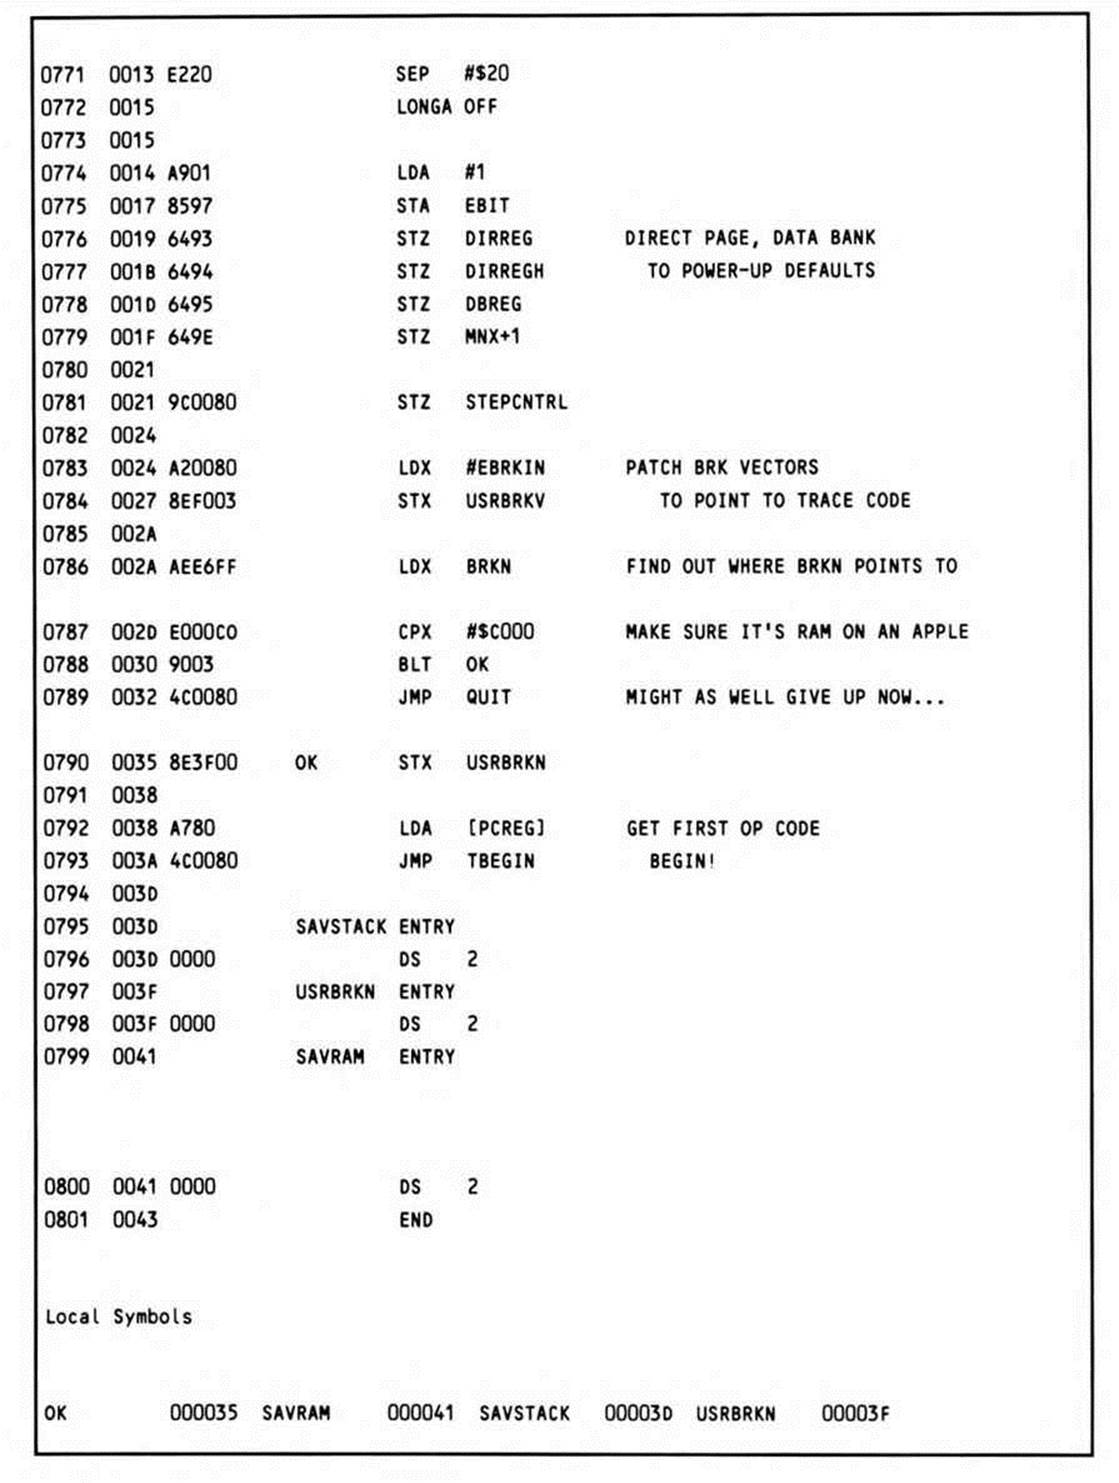
TRACE
This is the actual entry to the trace routine. It performs initialization similar to LIST, and additionally sets up the BRK vectors, so they can point to locations within the tracer.
The e flag, direct page register and data bank register are all given initial values of zero. The program counter and program counter bank are presumed to have been initialized by the user. The first byte of the program to be traced is loaded; since indirect long addressing is used, this program can be used with the 65816 to debug programs located in any bank. It can, of course, also be used with the 65802.
The jump to TBEGIN enters the main loop of the trace routine in the middle—in other words, "between instructions."
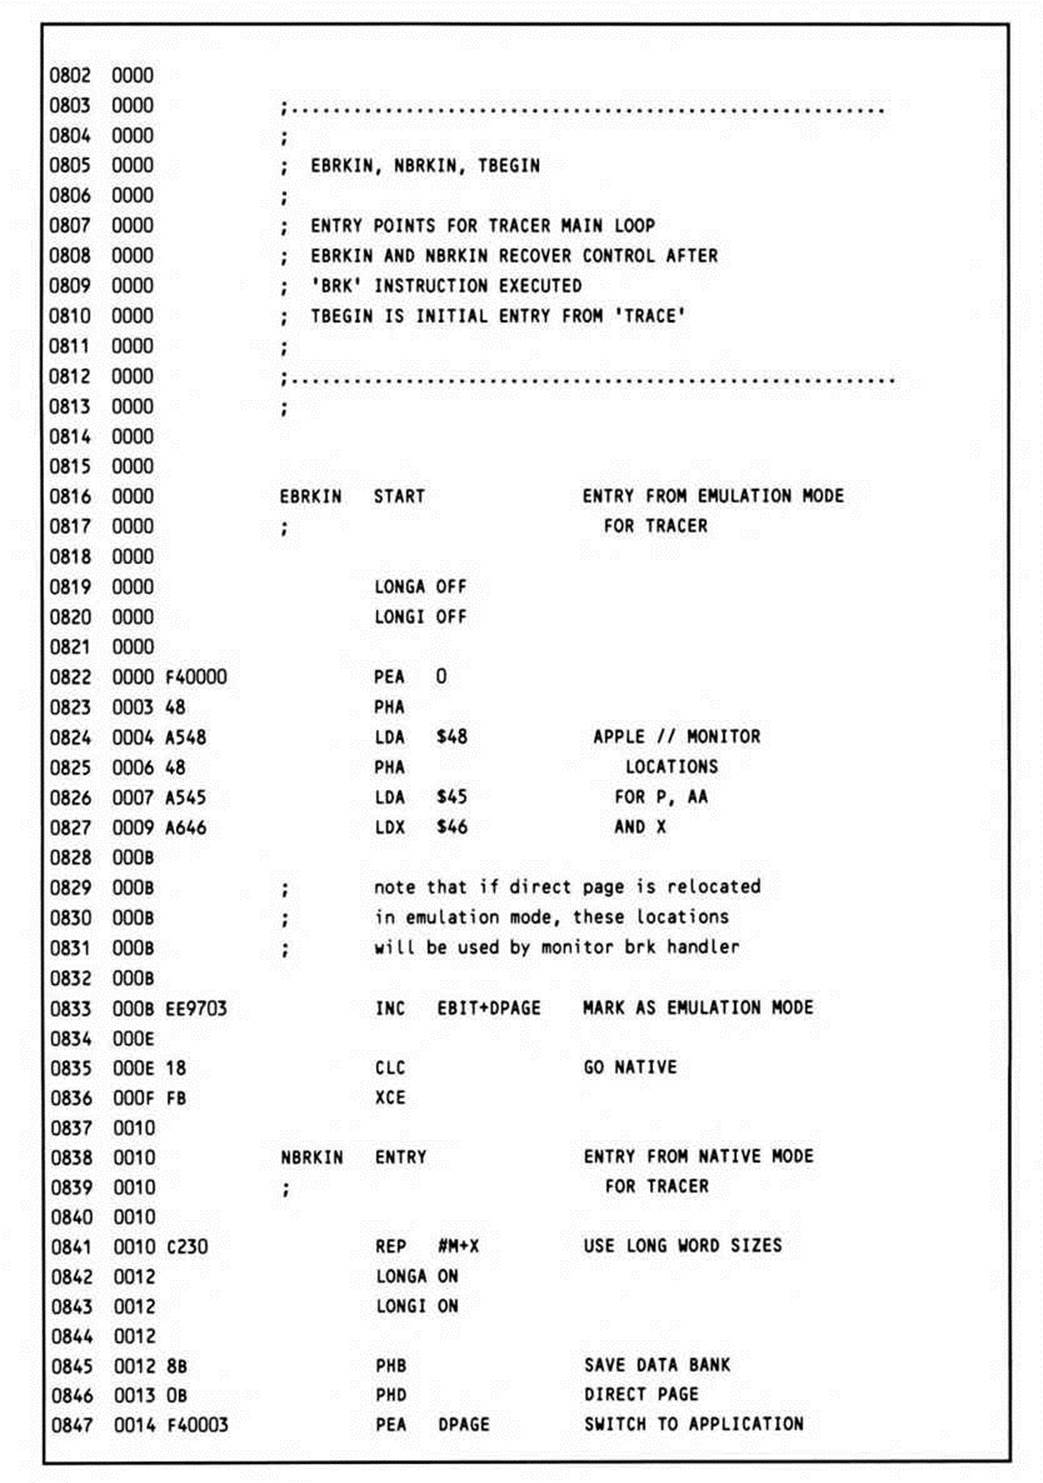
EBRKIN
This is the main loop of the tracer. It has three entry points: one each for the emulation and native mode BRK vectors to point to, and a third (TBEGIN) which is entered when the program starts tracing and there is no "last instruction.” This entry provides the logical point to begin examining the tracing process.
TRACE has performed some initialization, having loaded the opcode of the first instruction to be traced into the accumulator. As with FLIST, UPDATE is called to update the program counter and copy the instruction attributes and operand into direct page memory. The routine CHKSPCL is then called to handle the flow-altering instructions; in these cases, it will modify PCREG to reflect the target address. In either case, the opcode of the next instruction is loaded, and a BRK instruction (a zero) is stored in its place, providing a means to regain control immediately after the execution of the current instruction.
The contents of the RAM pointed to by the (arbitrary) ROM values in the native mode BRK vector are temporarily saved, and the location is patched with a jump to the NBRKIN entry point.
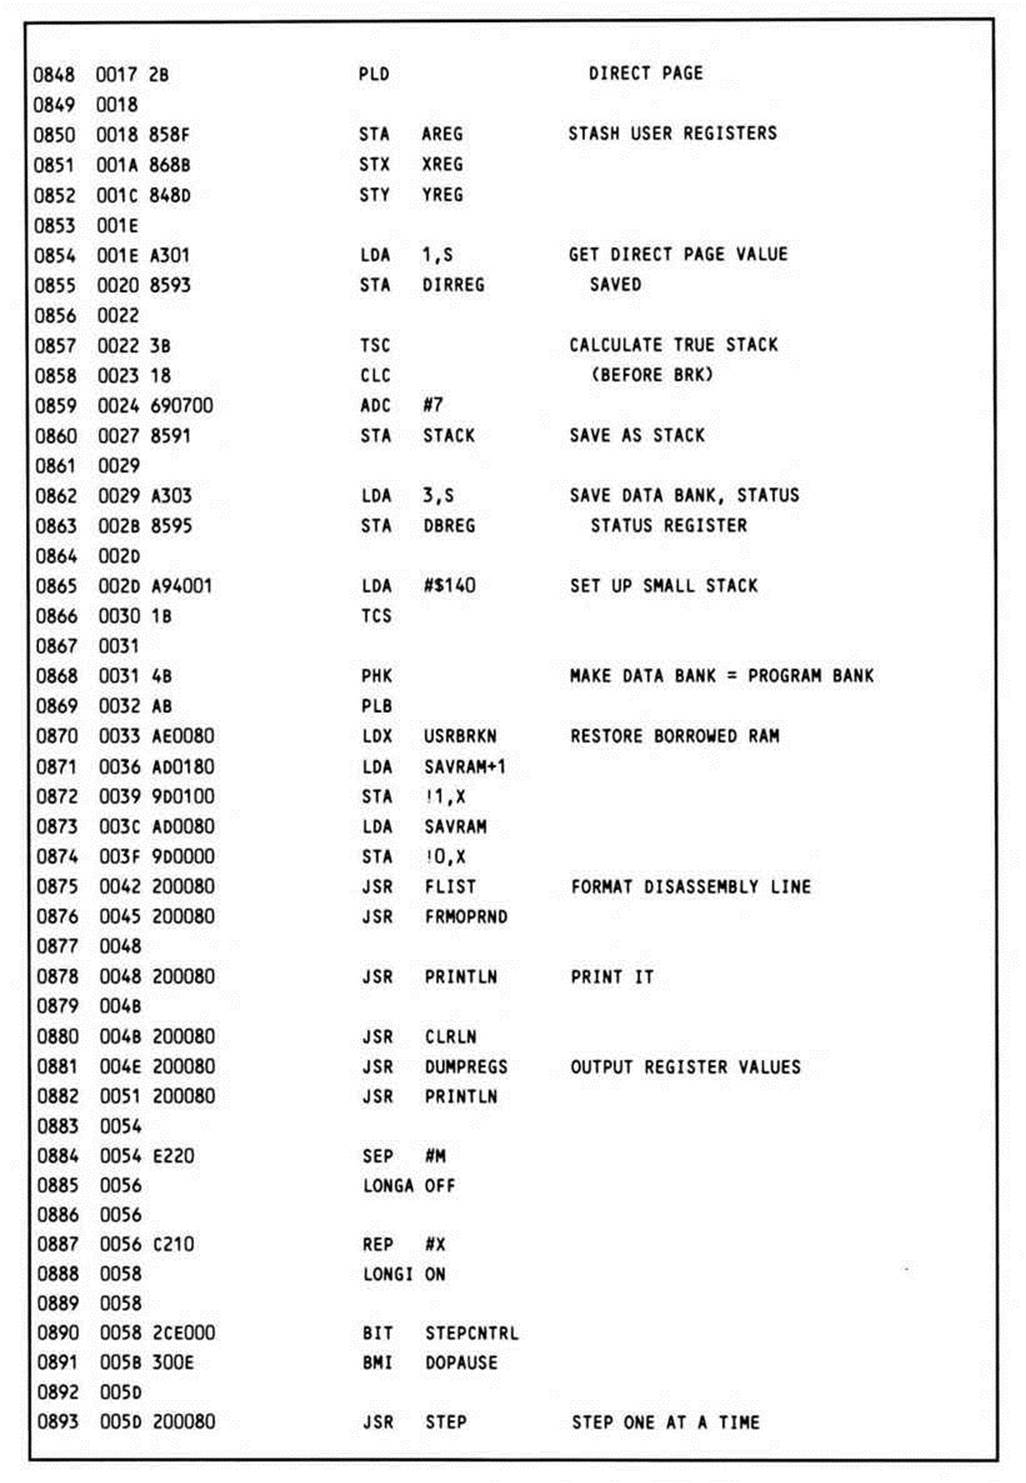
The registers are then loaded with their user program values: these will have been preinitialized by TRACE, or will contain the values saved at the end of the execution of the previous instruction. Note the order in which the registers are loaded; some with direct page locations, others pushed onto the stack directly from direct page locations, then pulled into the various registers. Once the user registers have been loaded with their values, they cannot be used for data movement. The P status register must be pulled last, to prevent any other instructions from modifying the flags.
The e bit is restored by loading the P register with a mask reflecting the value it should have; e is exchanged with the carry, and a second PLP instruction restores the correct status register values.
The routine exits via a jump indirect long through the "old" pcreg variable, which points to the current instruction. It will be reentered (at either EBRKIN or NBRKIN) when the BRK instruction that immediately follows the current instruction is executed.
Before this, however, the single instruction will be executed by the processor; any memory to be loaded or stored, or any registers to be changed by the instruction, will be modified.
After the BRK is executed, control returns to the tracer either at EBRKIN, if the user program was in emulation mode, or at NBRKIN if the user program was in native mode. The first thing that must be done is preserve the state of the machine as it was at the end of the instruction.
The BRK instruction has put the program counter bank (only in native mode), the program counter, and the status register on the stack. The program already knows the address of the next instruction, so the value on the stack can be disregarded. The status register is needed, however.
Entry to EBRKIN is from the Apple // monitor user vector at $3F0 and $3Fl. The Apple // monitor handles emulation mode BRK instructions by storing the register values to its own zero page locations; it pulls the program counter and status register from the stack and stores them, too. The code at EBRKIN dummies up a native mode post-BRK stack by first pushing three place-holder bytes, then loading the status register the from where the Apple Monitor stored it, and pushing it. The accumulator and X registers are re-loaded from monitor locations; Y has been left intact. A one is stored to variable EBIT, which will be used to restore the emulation mode when EBRKIN exits. The processor switches to native mode, and control falls through into NBRKIN, the native mode break handler.
With the stack in the correct state for both emulation mode and native mode entries, the routine proceeds to save the entire machine context. The register sizes are extended to sixteen bits to provide a standard size which encompasses the maximum size possible. The data bank and direct page registers are pushed onto the stack; the DPAGE value is pushed on immediately after, and pulled into the direct page, establishing the local direct page. With this in place, the A, X, and Y registers can be stored at their direct page locations. The register values pushed on the stack are picked off using stack-relative addressing. Since control is not returned by execution of an RTI (as is usual for interrupt processing), but instead is returned by means of a JMP, the stack must be cleaned up. Since seven bytes have been pushed, seven is added to the current stack pointer, and then saved at the direct page variable STACK. This being done, a small local stack region at $140 can be allocated.
The memory borrowed as a RAM native-mode BRK vector is restored.
The current line is then disassembled in the same manner as LIST. The register values just stored into memory are also displayed via the routine DUMPREGS.
Once this is done, the effect has been achieved and the contents of the registers between instructions has been made visible. Before resuming execution of the program being traced, a check is made to see if the user wishes to quit, pause or step, or toggle between tracing and stepping.
Before returning to the TBEGIN entry, the BRK instruction stored at the location of the new "current" instruction is replaced with the saved opcode, the current program counter is moved to the old program counter, and the cycle begins again at TBEGIN.
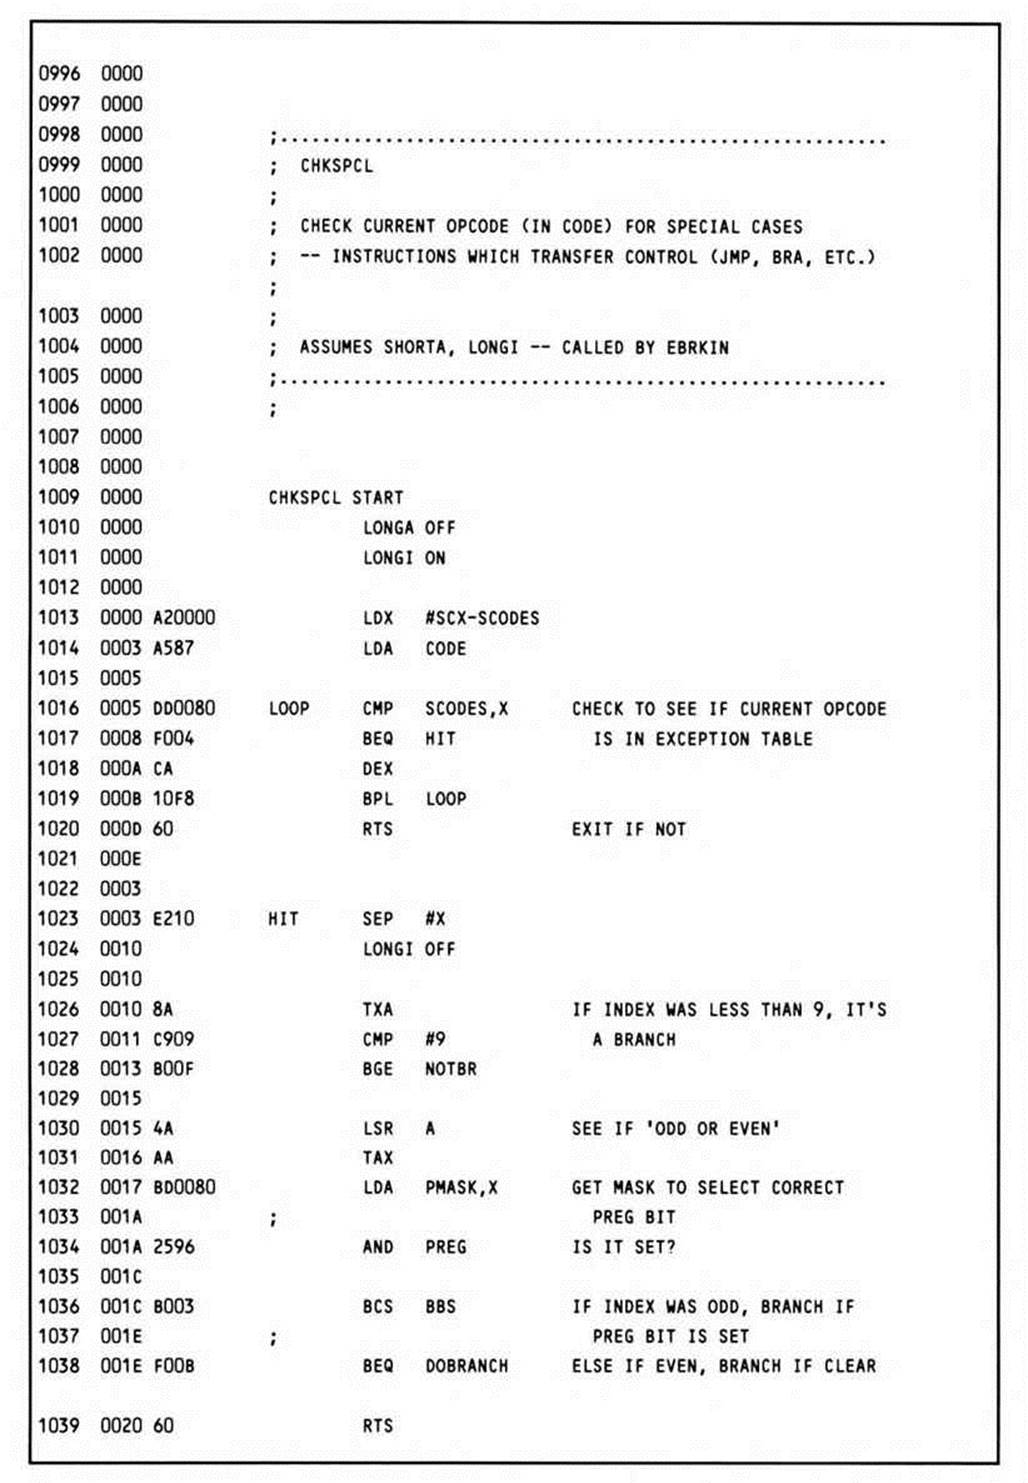
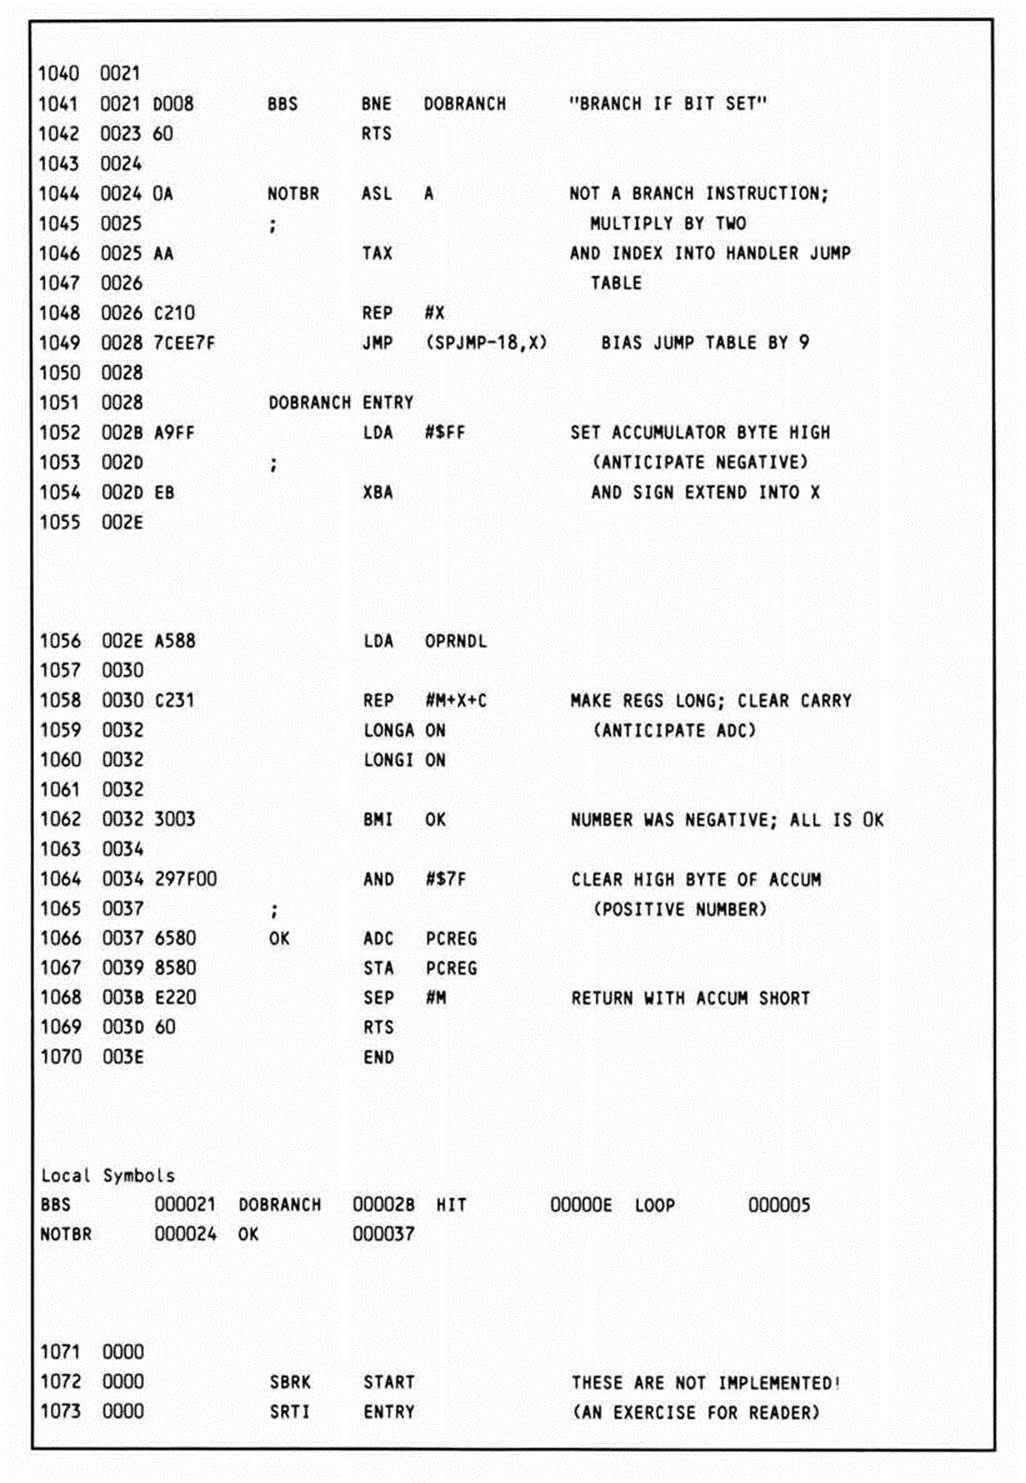
CHKSPCL
This routine checks the opcode about to be executed to see if it will cause a transfer of control. Is it a branch, a jump, or a call? If it is any of the three, the destination of the transfer must be calculated and stored at PCREG so that a BRK instruction can be stored there to maintain control after the current instruction is executed.
A table that contains all of the opcodes which can cause a branch or jump (SCODES) is scanned. If a match with the current instruction is not found, the routine exits and tracing resumes.
If a match is found, the value of the index into the table is checked. The opcodes for all the branches are stored at the beginning of SCODES, so if the value of the index is less than 9, the opcode was a branch and can be handled by the same general routine.
The first thing that must be determined if the opcode is a branch is whether or not the branch will be taken. By shifting the index right (dividing by two), an index for each pair of different types of branches is obtained. This index is used to get a mask for the bit in the status register to be checked. The value shifted into the carry determines whether the branch is taken if the status bit is set or clear.
If a branch is not taken, the routine exits. If, however, a branch is taken, the new program counter value must be calculated by sign extending the operand and adding it to the current program counter.
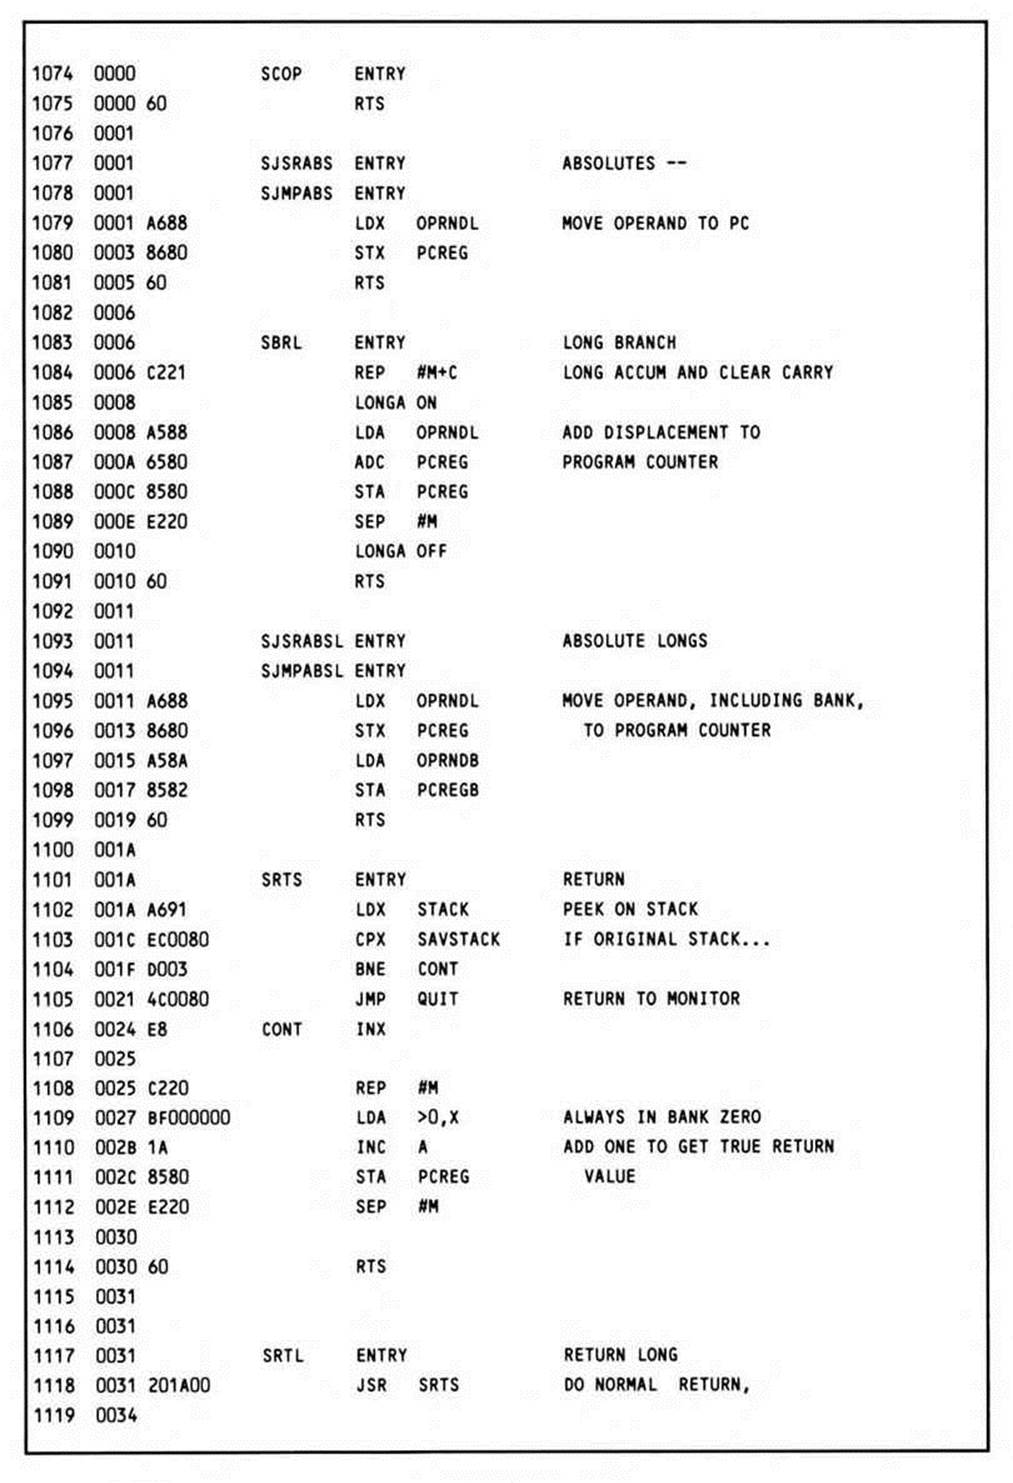
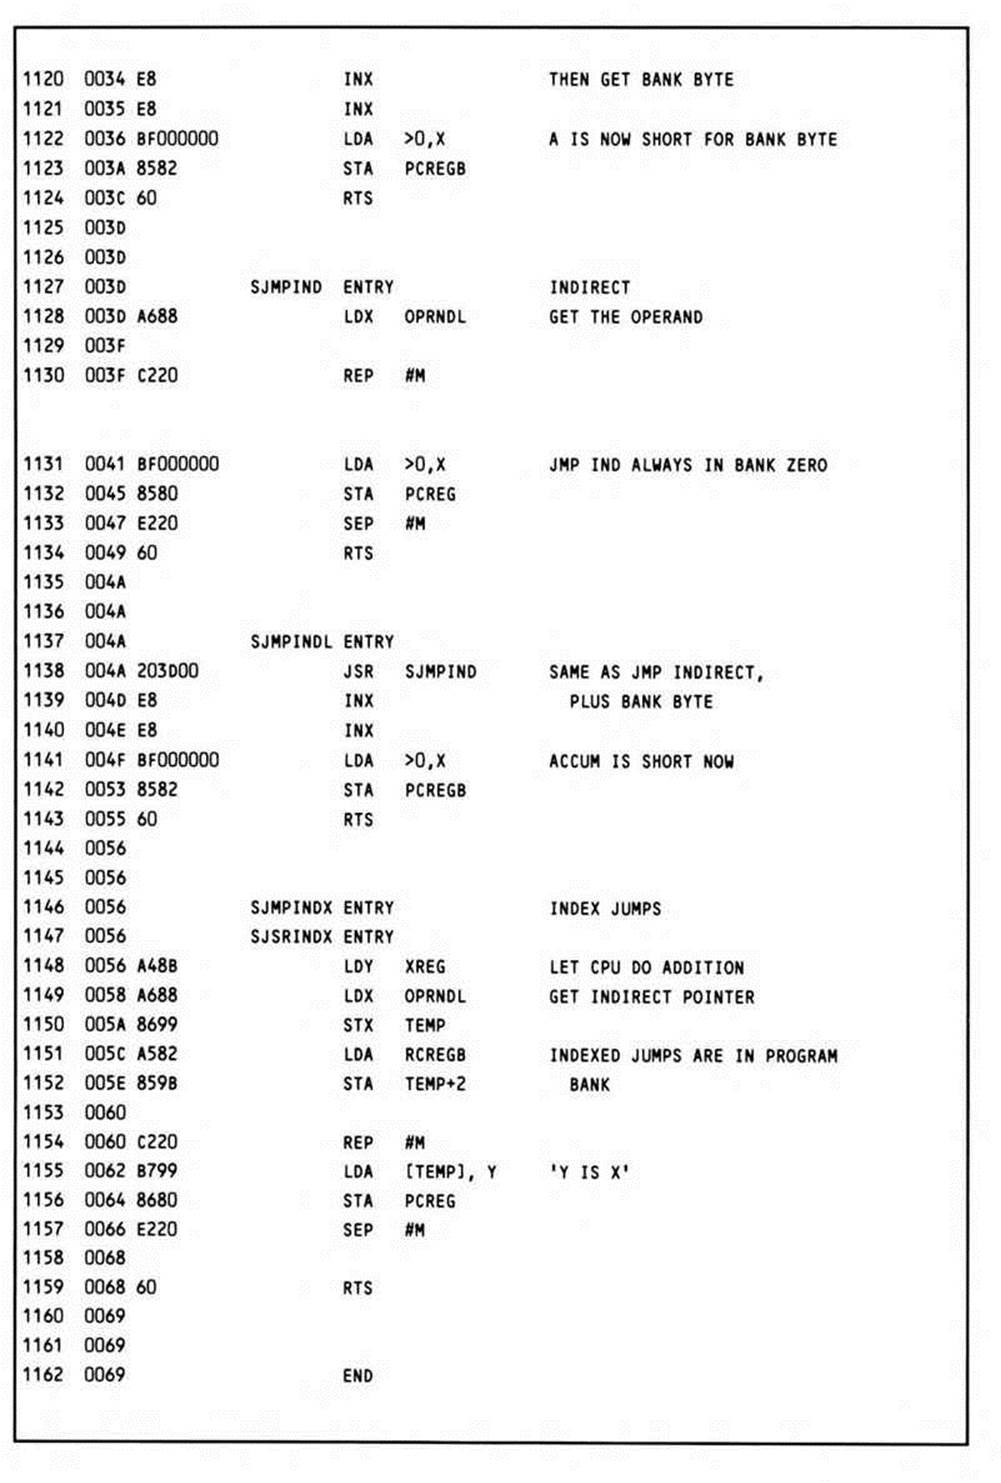
Each of the other opcodes (jumps and calls) are dispatched to handler routines through a jump table. Since only the new program counter values must be calculated, jumps and calls with the same addressing mode can be handled by the same routine.
Breaks, co-processor calls, and RTIs are not handled at all; a more robust tracer would handle BRKs by letting breakpoints be set and cleared. Since the software interrupts are not implemented, and software tracing of hardware interrupts is impractical, RTI is left unimplemented. The program counter is incremented by one, causing these instructions to be bypassed completely.
All of the jumps and calls are straightforward. Long addressing is used to force the stack and indirect addressing modes to access bank zero. Also notice the way the data bank register is copied to the program counter bank for indirect indexed addressing. Finally, note how the long addressing modes call their absolute analogs as subroutines, then handle the bank byte.
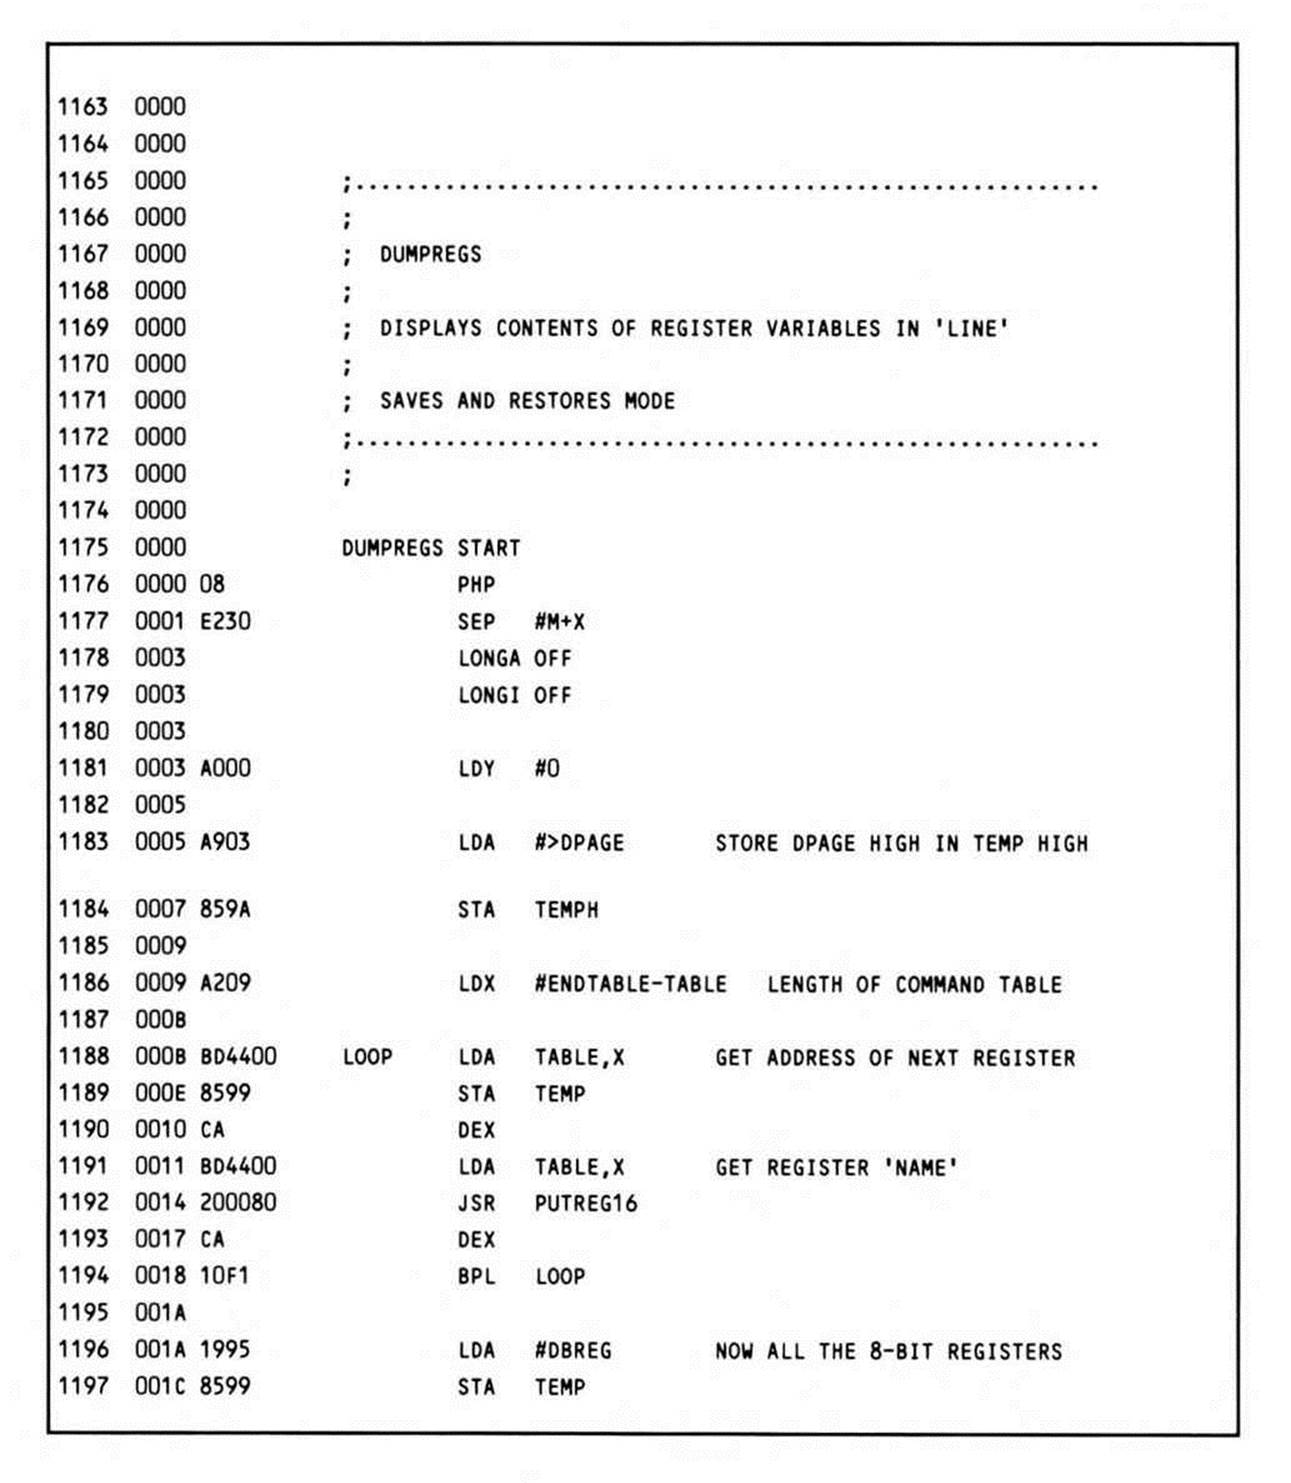
DUMPREGS
This routine forms an output line that will display the contents of the various registers. The routine is driven in a loop by a table containing single-character register names ("A," “X," and so on) and the address of the direct page variable that contains the corresponding register value. It is interesting in that a direct page pointer to a direct page address is used, since the two index registers are occupied with accessing the table entries and pointing to the next available location in the output buffer.
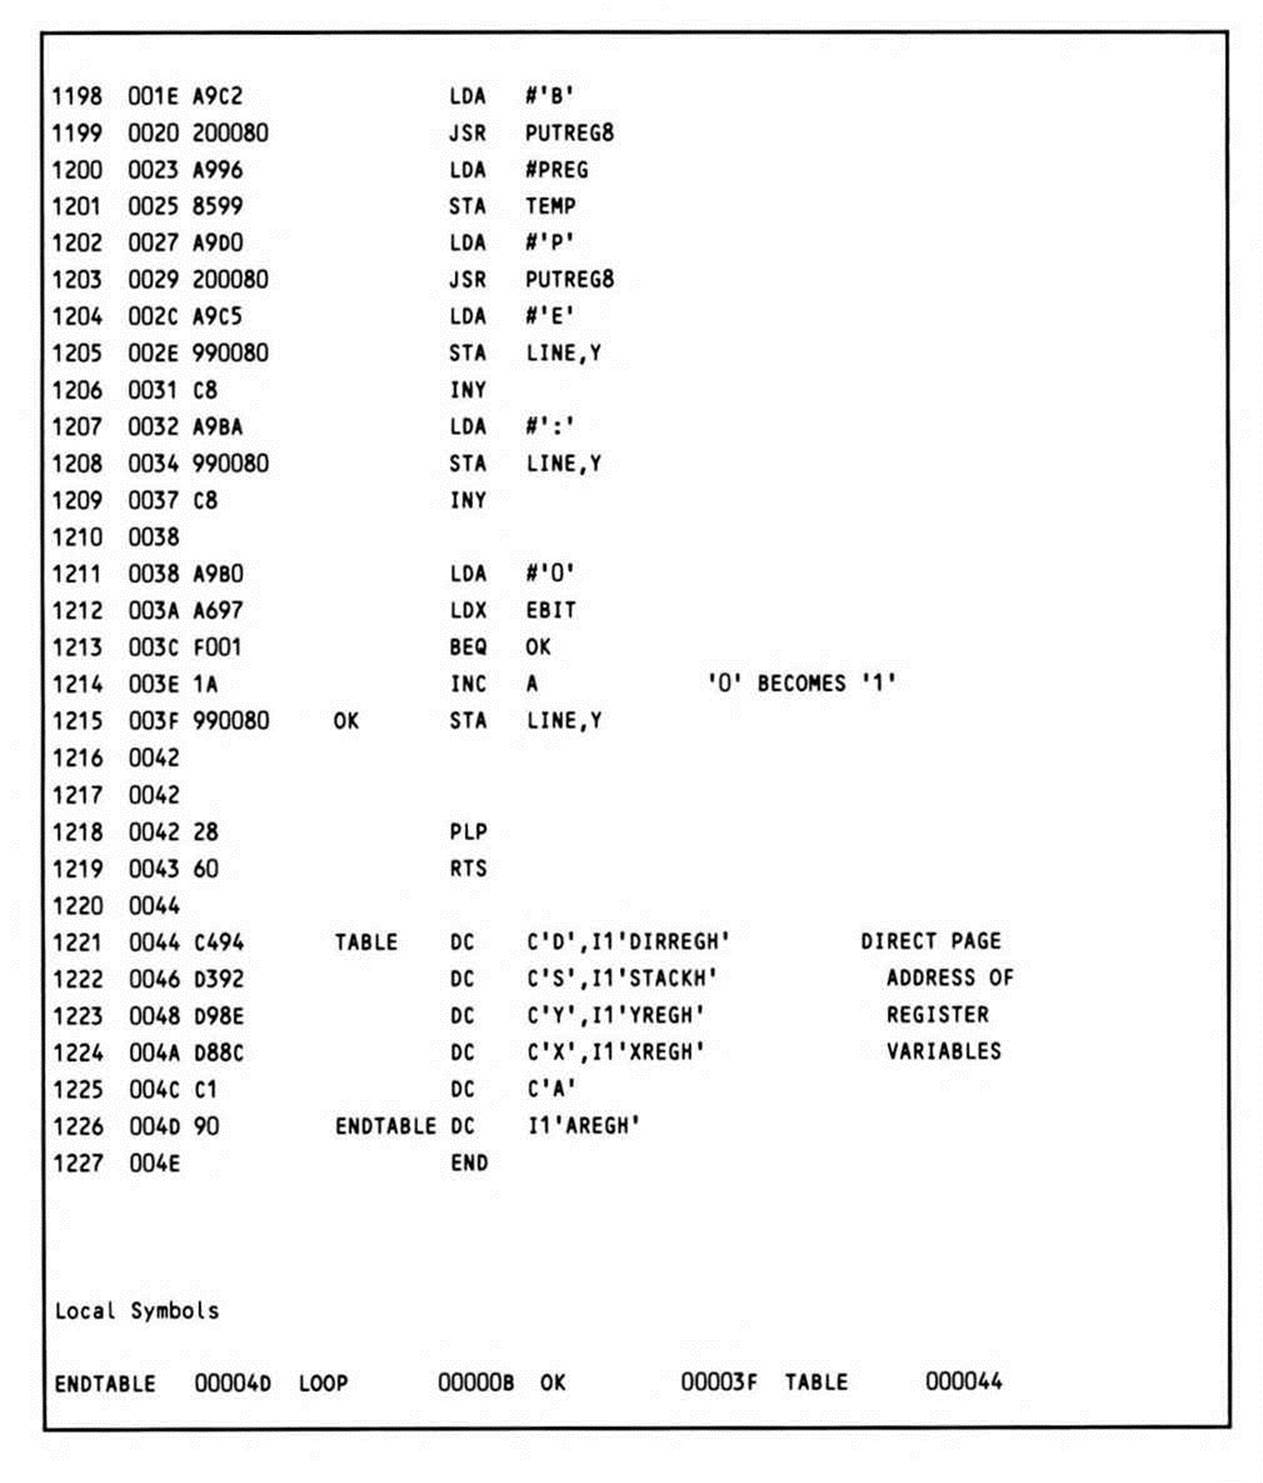
PUTREG8
This routine, along with PUTREG16, is called by DUMPREGS to actually output a register value once its label and storage location have been loaded from the table. Naturally, it calls PUTHEX to convert the register values to hexadecimal.
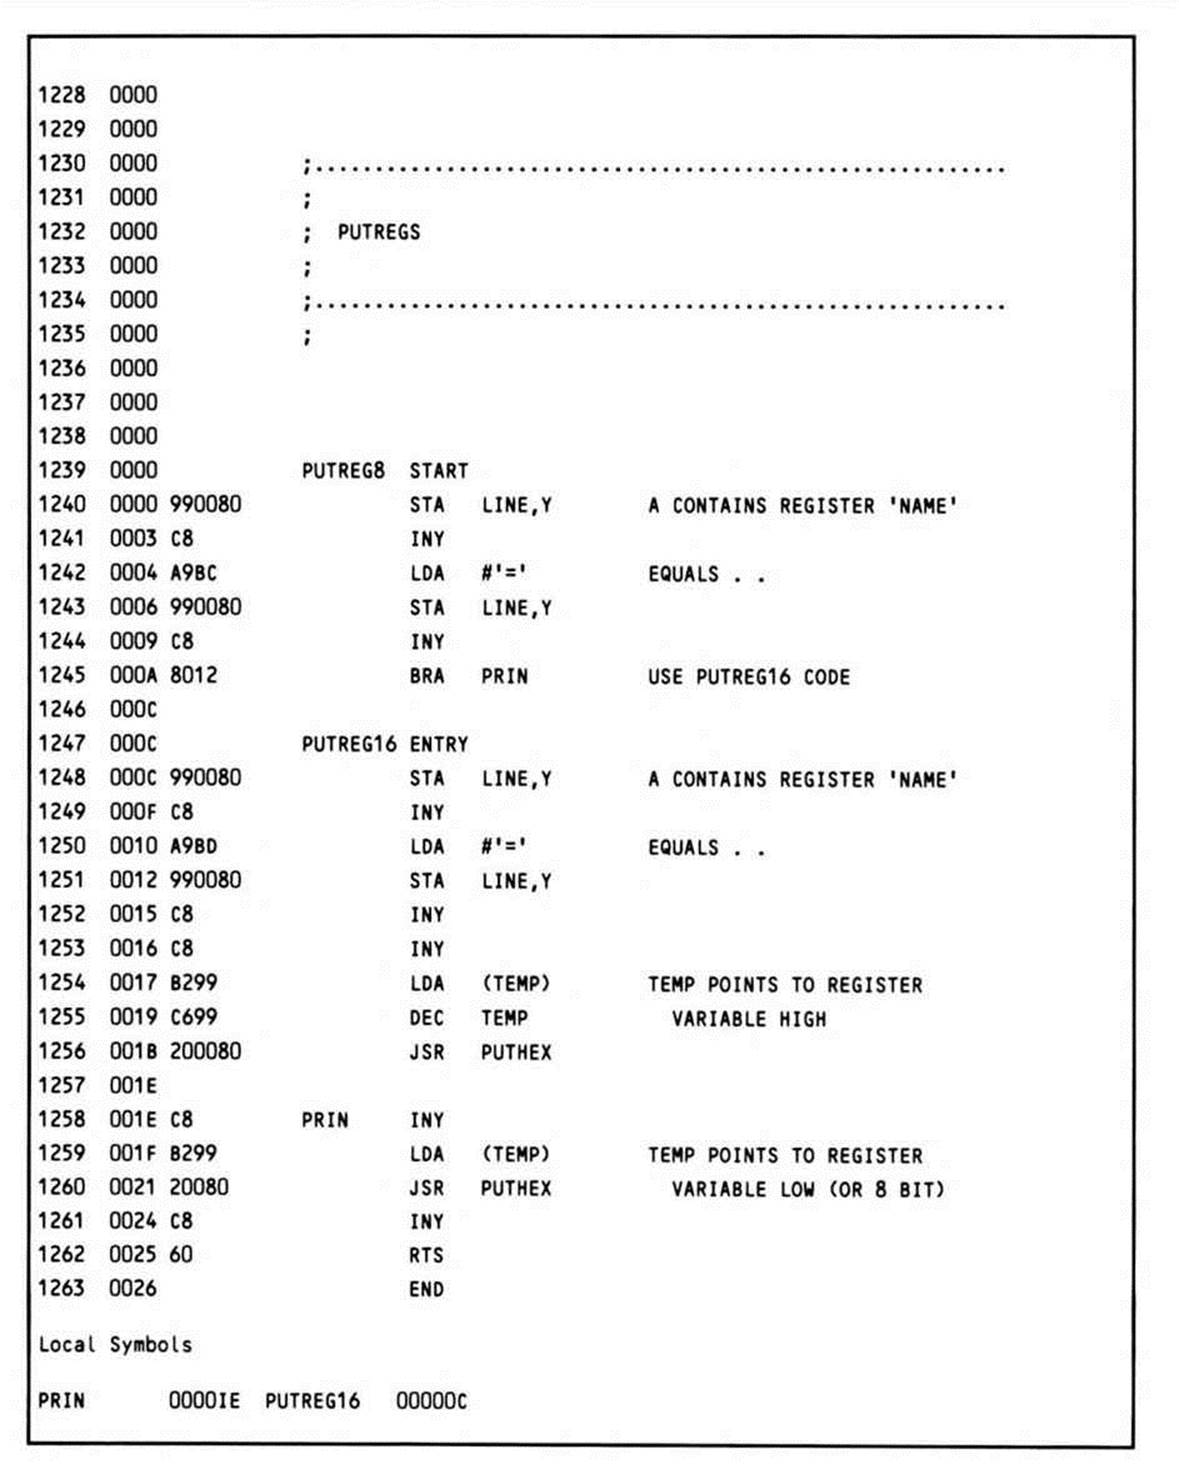
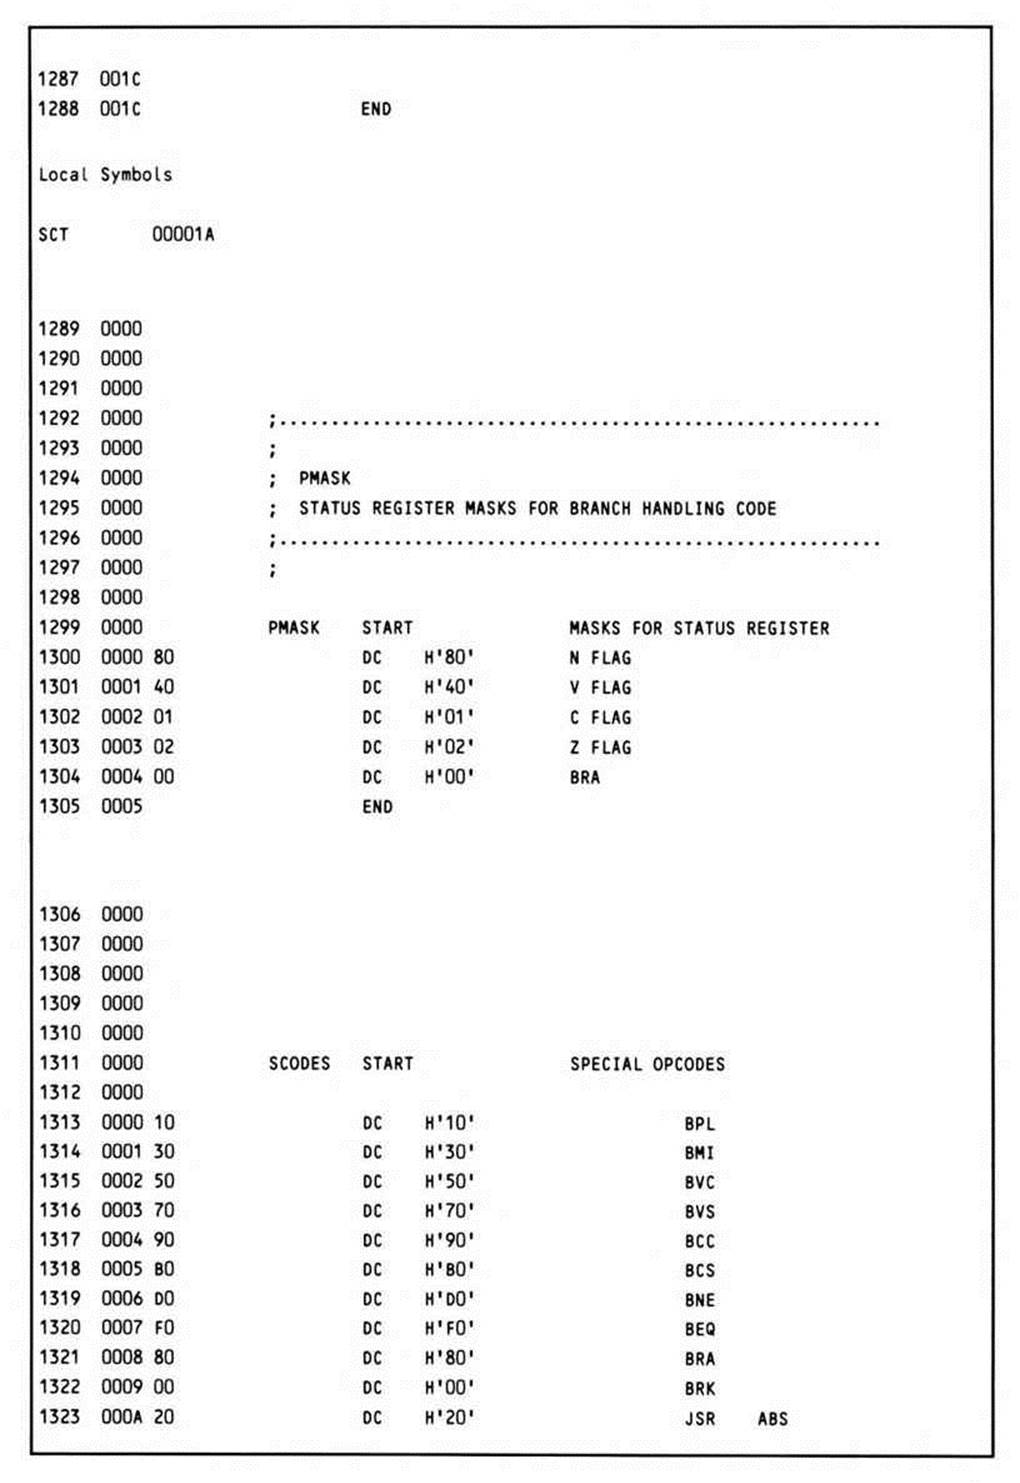
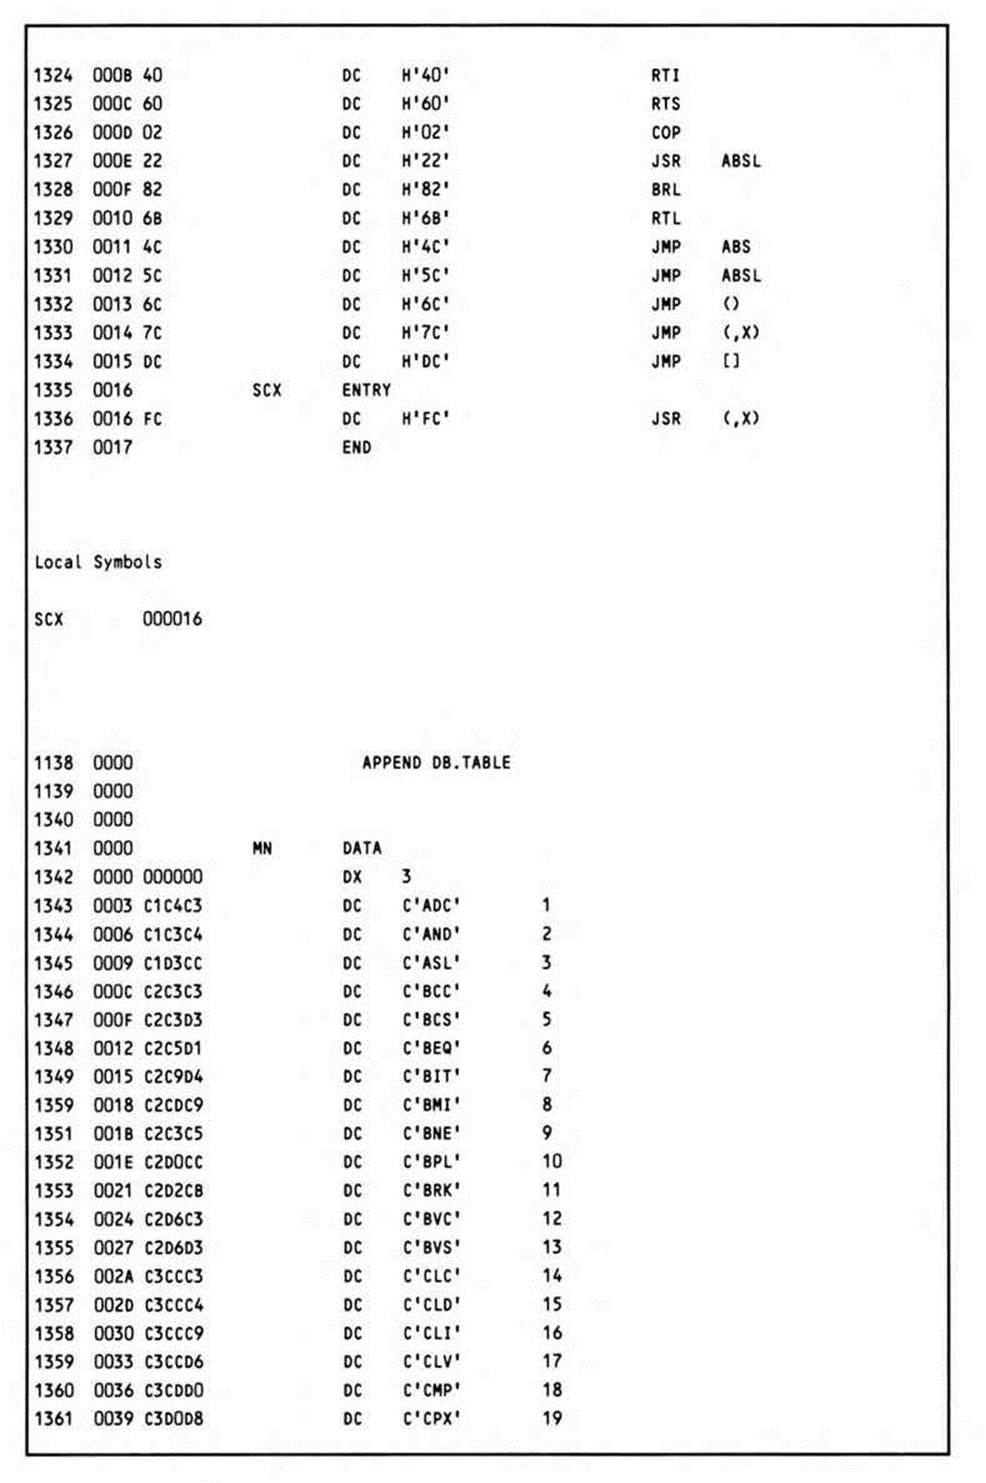
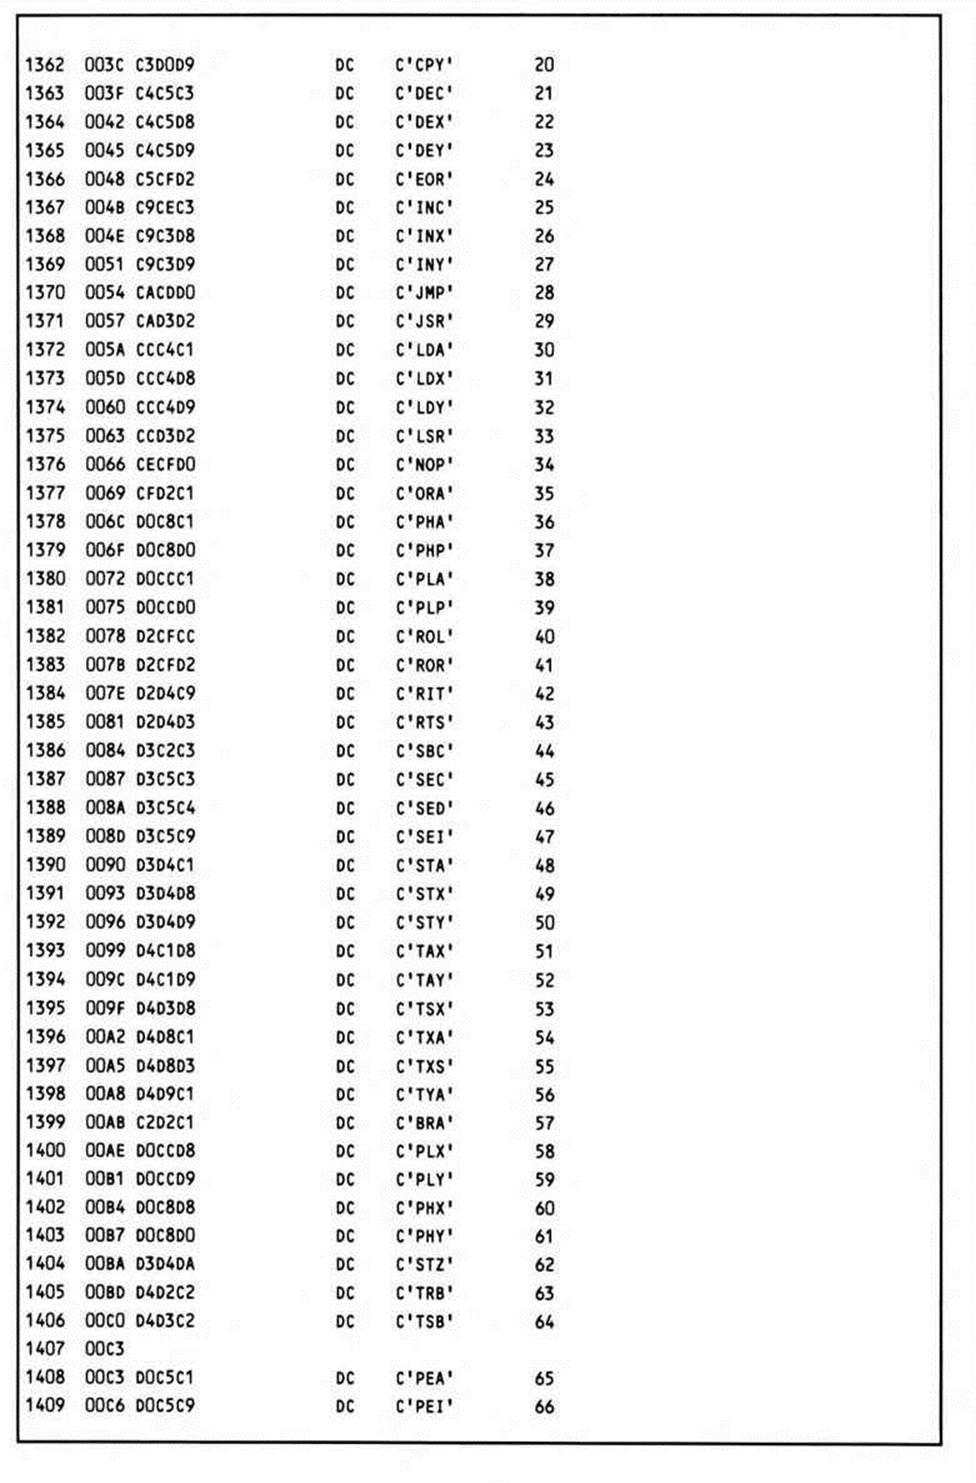
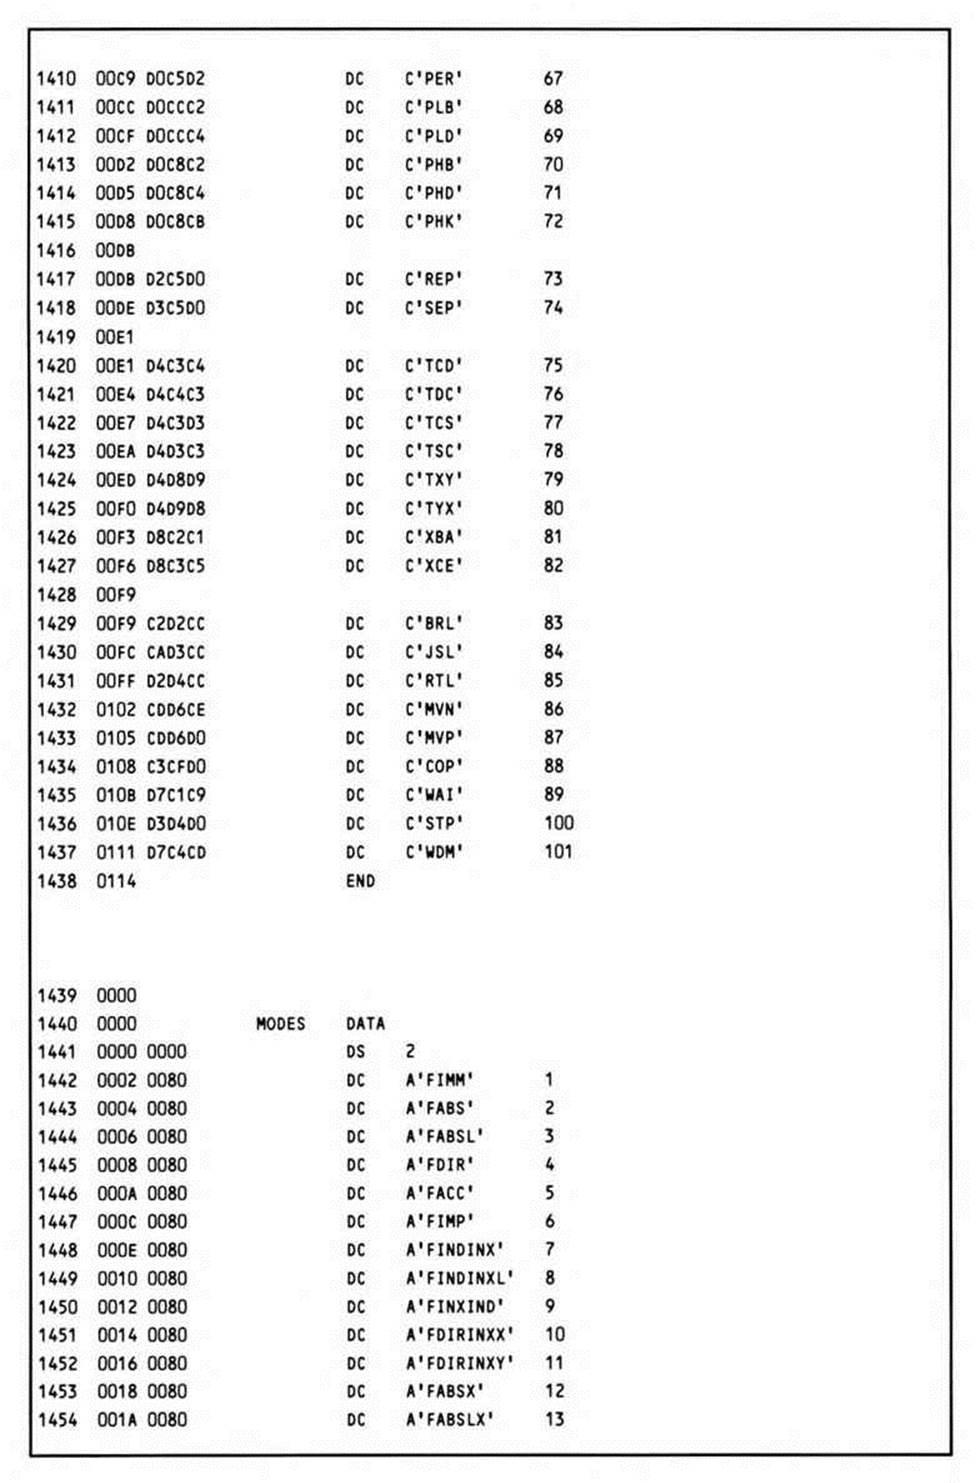
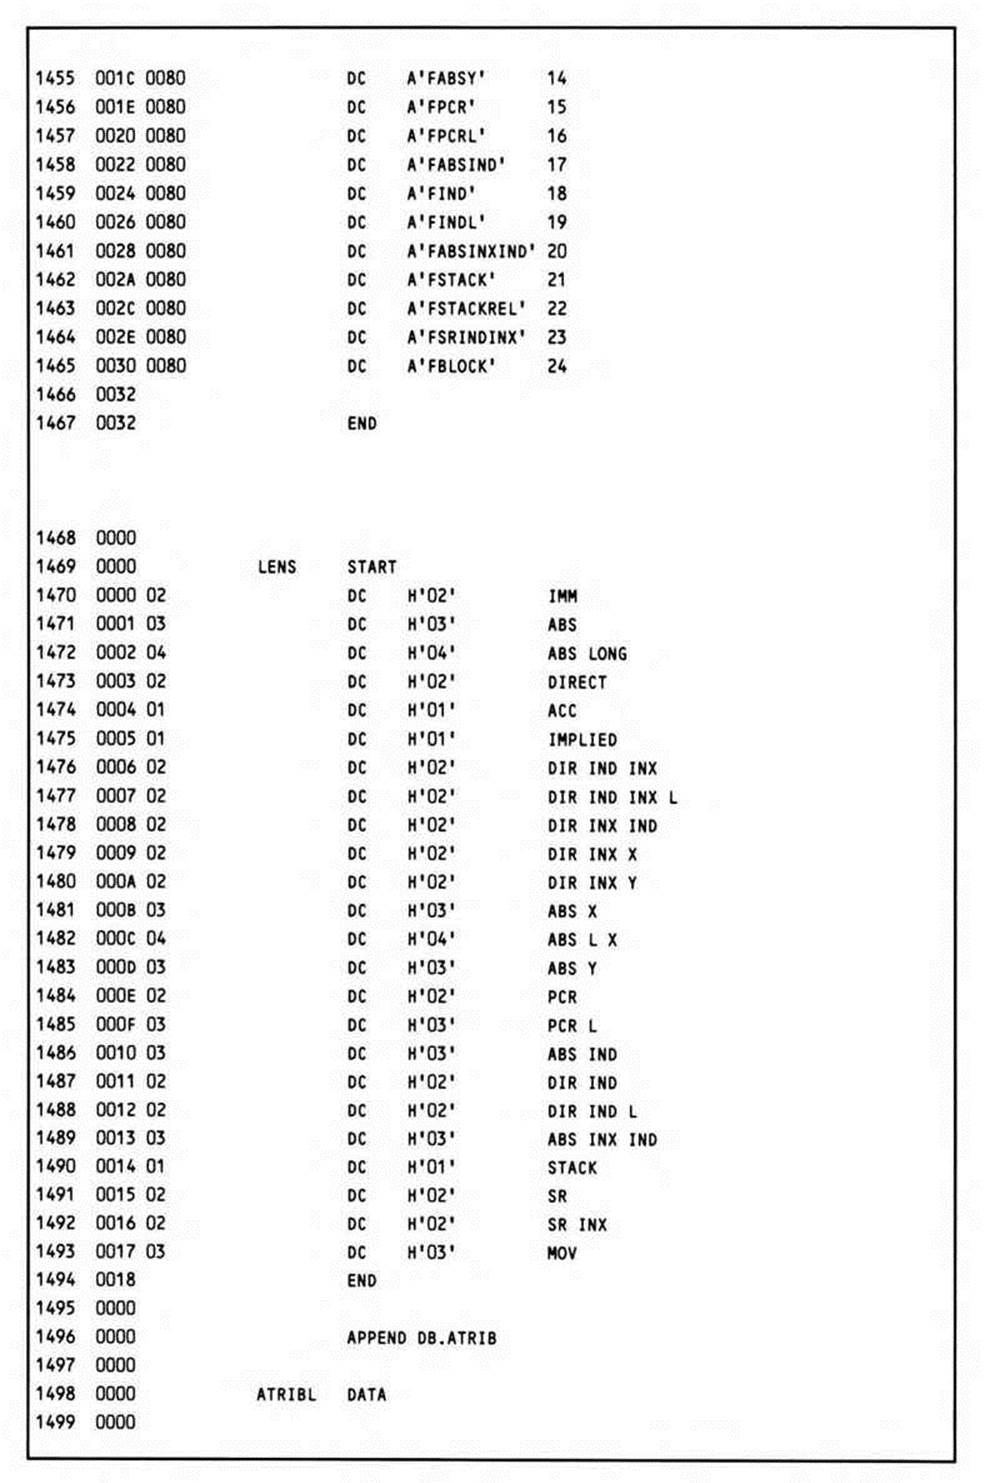
Tables
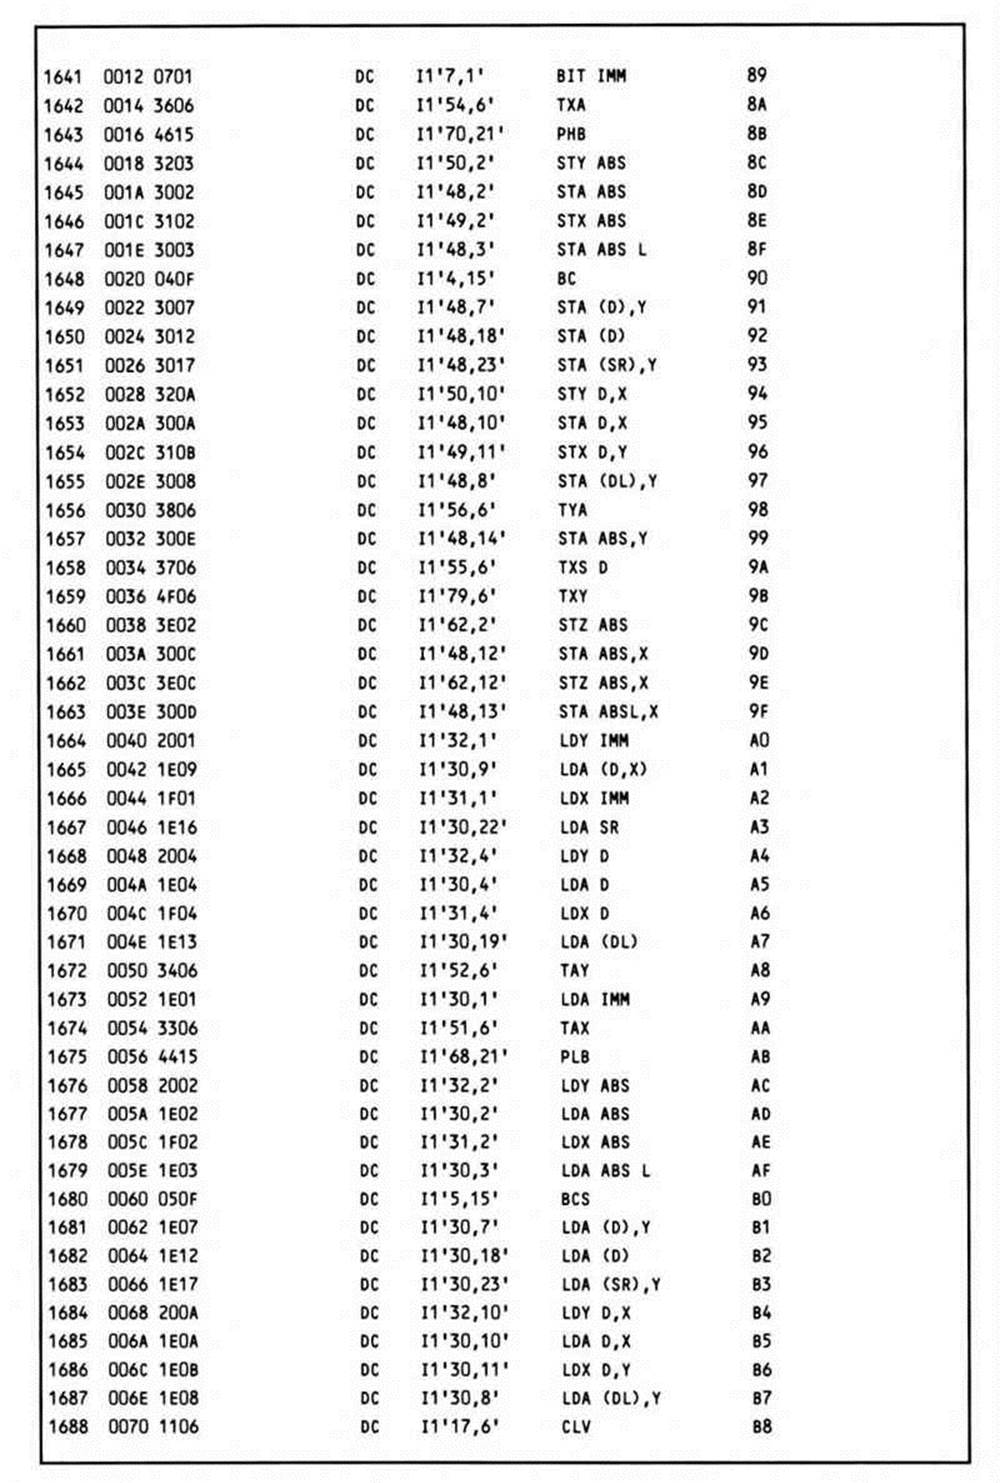
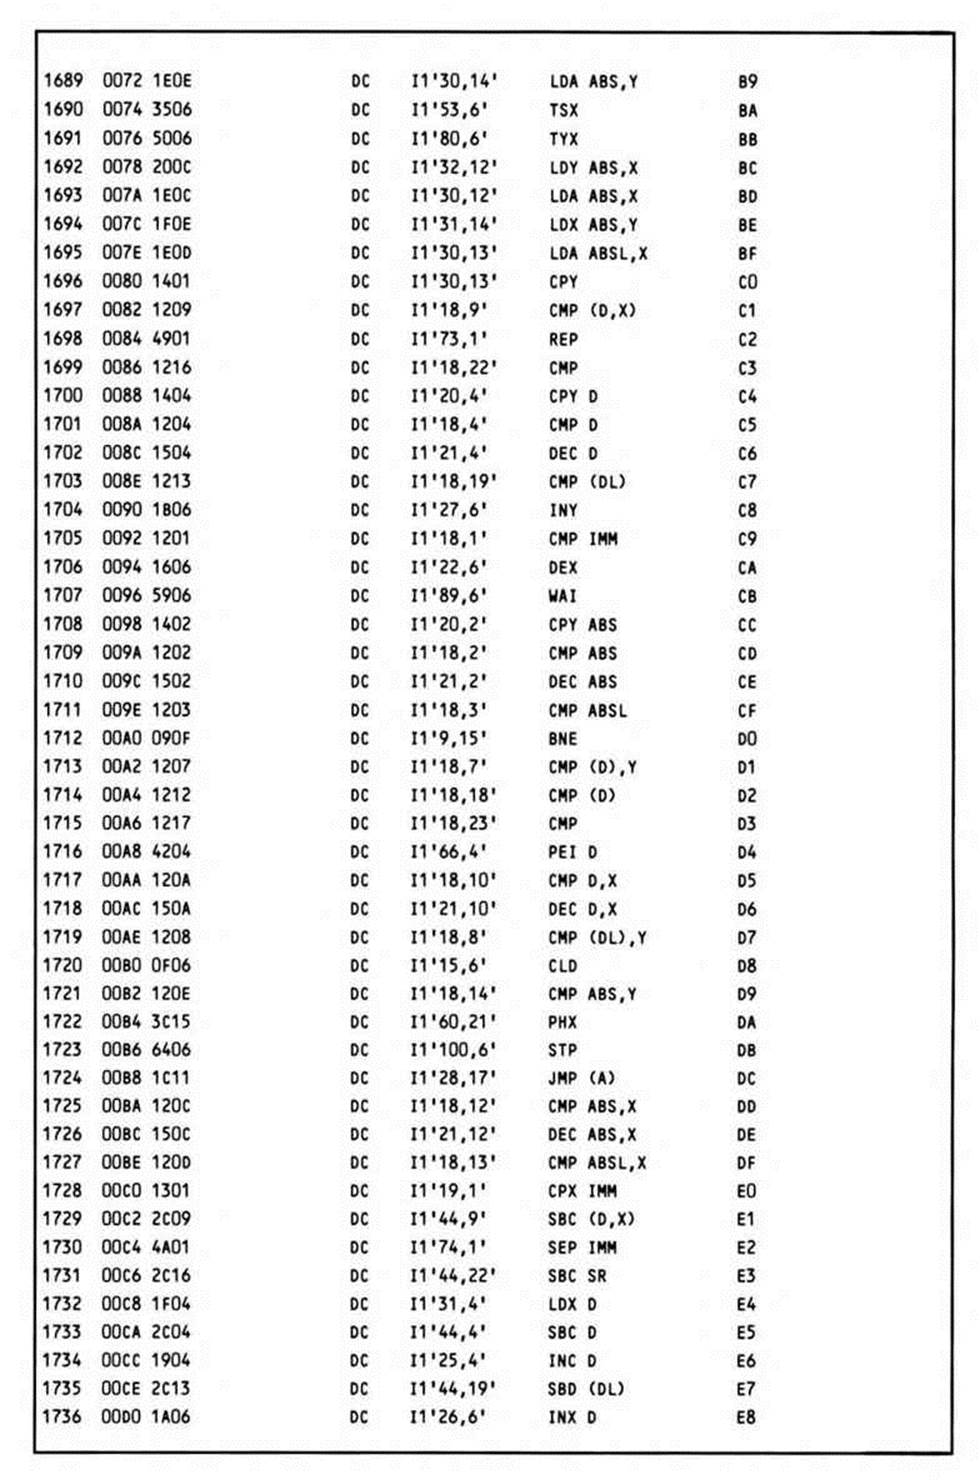
The next several pages list the tables used by the program—SPJMP, PMASK, SCODES, MN, MODES, LENS, and ATRIBL.
SPJMP is a jump table of entry points to the trace handlers for those instructions which modify the flow of control.
PMASK contains the masks used to check the status of individual flag bits to determine if a branch will be taken.
SCODS is a table containing the opcodes of the special (flow-altering) instructions.
ATRBL is the attribute table for all 256 opcodes. Each table entry is two bytes, one is an index into the mnemonic table, the other the address mode. This information is the key to the other tables, all used by the UPDATE routine, which puts a description of the current instruction's attributes into the respective direct page variables. MN is the table of instruction mnemonics that the 'mnemonic index' attribute points into. MODES is a jump table with addresses of the disassembly routine for each addressing mode, and LENS contains the length of instructions for each addressing mode. Both of these tables are indexed into directly with the 'address mode' attribute.
All materials on the site are licensed Creative Commons Attribution-Sharealike 3.0 Unported CC BY-SA 3.0 & GNU Free Documentation License (GFDL)
If you are the copyright holder of any material contained on our site and intend to remove it, please contact our site administrator for approval.
© 2016-2026 All site design rights belong to S.Y.A.