Agile Data Science (2014)
Part II. Climbing the Pyramid
Chapter 7. Exploring Data with Reports
In the next step, our third agile sprint, we’ll extend our chart pages into full-blown reports (Figure 7-1). In this step, charts become interactive, static pages become dynamic, and our data becomes explorable through networks of linked, related entities with charts. These are the characteristics of the reports stage of the data-value pyramid.
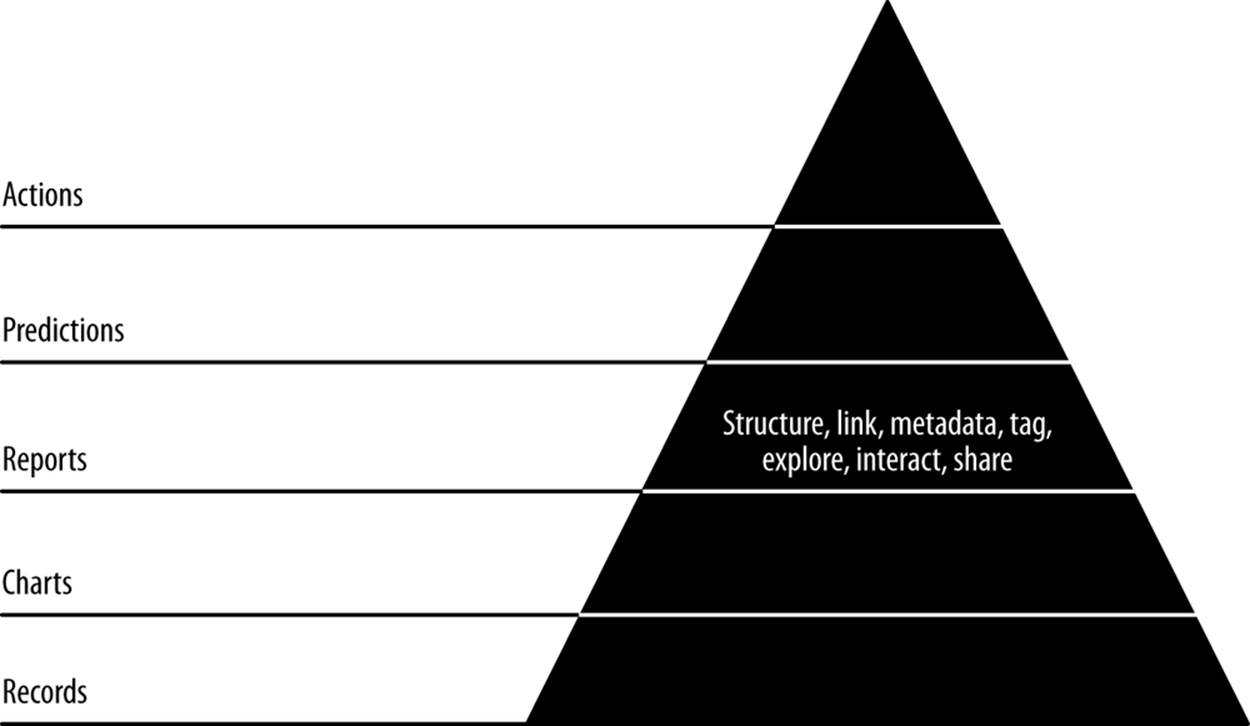
Figure 7-1. Level 3: exploring with reports
Code examples for this chapter are available at https://github.com/rjurney/Agile_Data_Code/tree/master/ch07. Clone the repository and follow along!
git clone https://github.com/rjurney/Agile_Data_Code.git
Building Reports with Multiple Charts
To build a report, we need to compose multiple views on the same entity. The charts we made in the previous chapter will serve us well as we increase interactivity to create reports. Let’s create an email address entity page and add a tag cloud for related emails to give us something closer to a report.
We’ll start by creating a relation that shows the most related email addresses. Check out ch07/pig/related_email_addresses.pig.
/* Set Home Directory - where we install software */
%default HOME `echo \$HOME/Software/`
/* Avro uses json-simple, and is in piggybank until Pig 0.12, where AvroStorage
and TrevniStorage are Pig builtins */
REGISTER $HOME/pig/build/ivy/lib/Pig/avro-1.5.3.jar
REGISTER $HOME/pig/build/ivy/lib/Pig/json-simple-1.1.jar
REGISTER $HOME/pig/contrib/piggybank/java/piggybank.jar
DEFINE AvroStorage org.apache.pig.piggybank.storage.avro.AvroStorage();
DEFINE substr org.apache.pig.piggybank.evaluation.string.SUBSTRING();
DEFINE tohour org.apache.pig.piggybank.evaluation.datetime.truncate.ISOToHour();
/* MongoDB libraries and configuration */
REGISTER $HOME/mongo-hadoop/mongo-2.10.1.jar
REGISTER $HOME/mongo-hadoop/core/target/mongo-hadoop-core-1.1.0-SNAPSHOT.jar
REGISTER $HOME/mongo-hadoop/pig/target/mongo-hadoop-pig-1.1.0-SNAPSHOT.jar
DEFINE MongoStorage com.mongodb.hadoop.pig.MongoStorage();
set default_parallel 5
set mapred.map.tasks.speculative.execution false
set mapred.reduce.tasks.speculative.execution false
rmf /tmp/related_addresses.txt
emails = load '/me/Data/test_mbox' using AvroStorage();
/* We need to insert reply_to as a valid from or email addresses will miss in
our index */
split emails into has_reply_to if (reply_tos is not null), just_froms if
(reply_tos is null);
/* Count both the from and reply_to as valid froms if there is a reply_tos
field */
reply_tos = foreach has_reply_to generate FLATTEN(reply_tos.address) as from,
tos, ccs, bccs;
reply_to_froms = foreach has_reply_to generate from.address as from, tos,
ccs, bccs;
/* Treat emails without reply_to as normal */
just_froms = foreach just_froms generate from.address as from, tos, ccs, bccs;
/* Now union them all and we have our dataset to compute on */
all_froms = union reply_tos, reply_to_froms, just_froms;
/* Now pair up our froms/reply_tos with all recipient types,
and union them to get a sender/recipient connection list. */
tos = foreach all_froms generate flatten(from) as from,
flatten(tos.address) as to;
ccs = foreach all_froms generate flatten(from) as from,
flatten(ccs.address) as to;
bccs = foreach all_froms generate flatten(from) as from,
flatten(bccs.address) as to;
pairs = union tos, ccs, bccs;
counts = foreach (group pairs by (from, to)) generate flatten(group) as (
from, to),
COUNT(pairs) as total;
top_pairs = foreach (group counts by from) {
filtered = filter counts by (to is not null);
sorted = order filtered by total desc;
top_8 = limit sorted 8;
generate group as address, top_8.(to) as related_addresses;
}
store top_pairs into '/tmp/related_addresses.txt';
store top_pairs into 'mongodb://localhost/agile_data.related_addresses'
using MongoStorage();
Our Flask controller combines several stubs we’ve already created along with top friends:
# Display information about an email address
@app.route('/address/<string:address>')
@app.route('/address/<string:address>/<int:offset1>/<int:offset2>')
def address(address, offset1=0, offset2=config.EMAILS_PER_ADDRESS_PAGE):
address = address.lower() # In case the email record linking to this isn't
lowered... consider ETL on base document inPig
sent_dist = sent_distributions.find_one({'address': address})
addresses = related_addresses.find_one({'address': address})
['related_addresses']
return render_template('partials/address.html',
sent_distribution=sent_dist['sent_distribution'],
addresses=addresses,
chart_json=json.dumps(sent_dist['sent_distribution']),
address='<' + address + '>'
)
Our template code adds a space for related contacts. Check out ch07/web/templates/partails/email.html.
{% if addresses -%}
<h3 style="margin-bottom: 5px;">Email Addresses</h2>
<ul class="nav nav-pills">
{% for item in addresses -%}
<li class="active">
<a style="margin: 3px;" href="/address/{{ item['address']
}}">{{ item['address'] }}</a>
</li>
{% endfor -%}
</ul>
{% endif -%}
The results are shown in Figure 7-2.
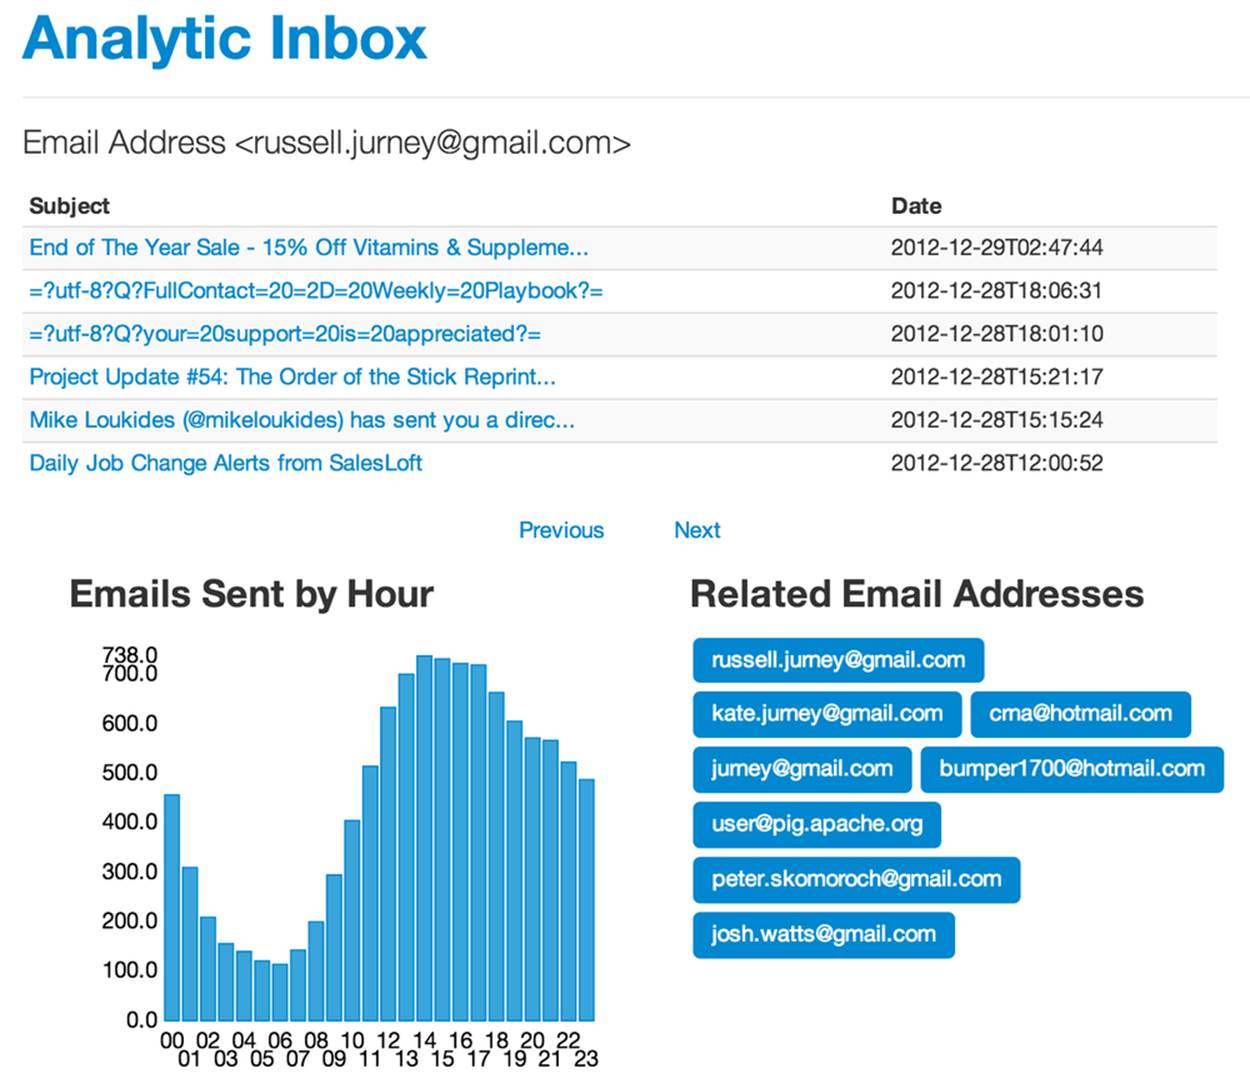
Figure 7-2. Email address page
Linking Records
Having created a report, adding interactivity is easy. Note how we inserted links between email address entities in the preceding section.
We can now explore email addresses and their time habits endlessly! Big deal, right? Maybe not, but it is a good start. Let’s extend this by making email addresses in email clickable. We need only extend our macros to add links when displaying email addresses. Check outch07/web/templates/macros.jnj.
{% macro limit_length(value, length) -%}
{% if value|length > 3 -%}{{value|truncate(length=length, killwords=True)}}
{% endif -%}
{% endmacro -%}
{% macro display_email_address(email_record) -%}
{% if email_record['real_name'] and email_record['real_name']
|length > 1 -%}
{{ display_link(email_record['address']|safe, '/address'|safe,
limit_length(email_record['real_name'],20)|safe + ' <' + email_record
['address']|safe + '>')|safe}}
{% else -%}
{{ display_link(email_record['address']|safe, '/address'|safe,
'<' + email_record['address'] + '>'|safe) }}
{% endif -%}
{% endmacro -%}
Now we can look at email addresses, their properties, and their relationships as we view emails (Figure 7-3). This kind of pivot offers insight, and is a form of simple recommendation.
What we’re doing can be described as creating interactive ontologies of semistructured data. Breaking up our process around building this kind of structure does several things for us. First, it creates small batches of work—one per entity—that break efficiently into an agile sprint. This enables a kind of data agility, and also extends our application into a more and more browsable state. This in turn enables users to click around and explore your dataset, which connects the team into the ground truth or reality of the data—which, as you know by now—is a theme in Agile Big Data.
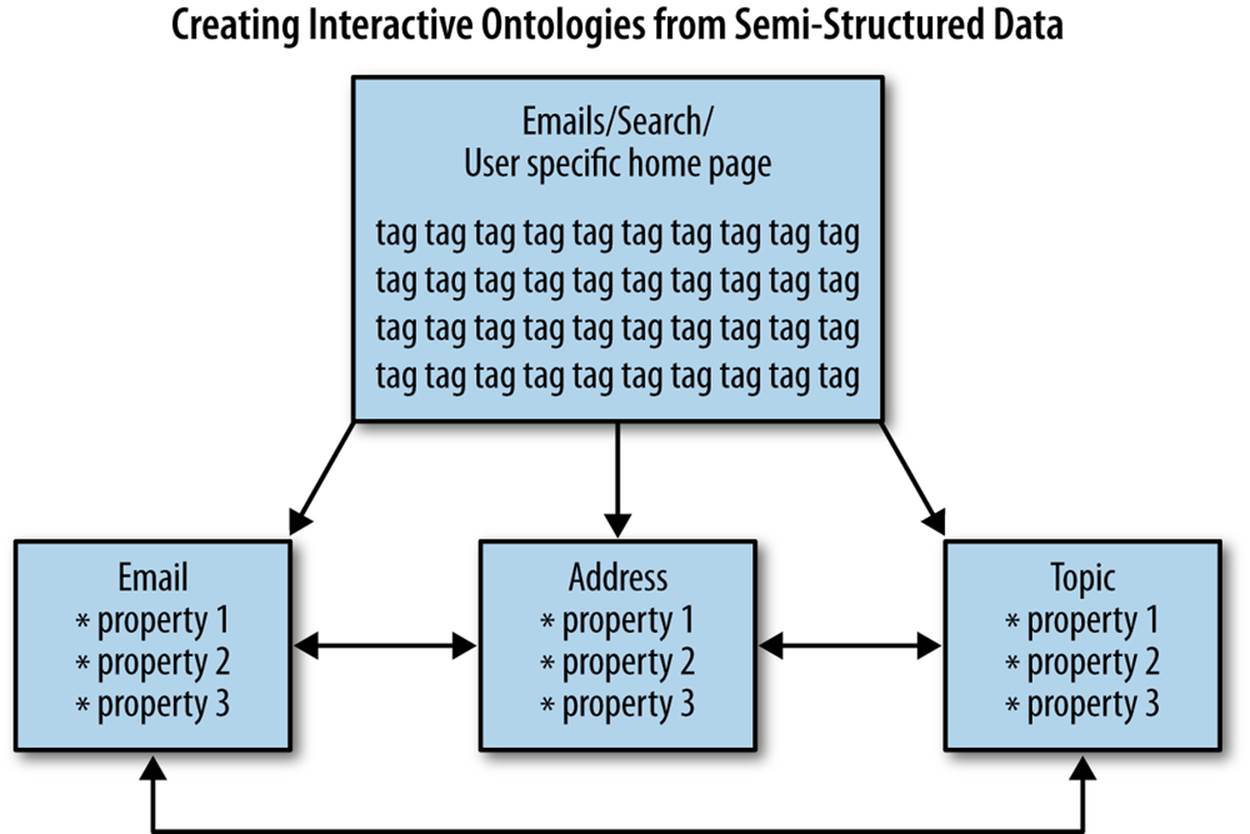
Figure 7-3. Page structure
But we’ve got a bug (Figure 7-4). For sparse entries, we are skipping hours in our table and chart.
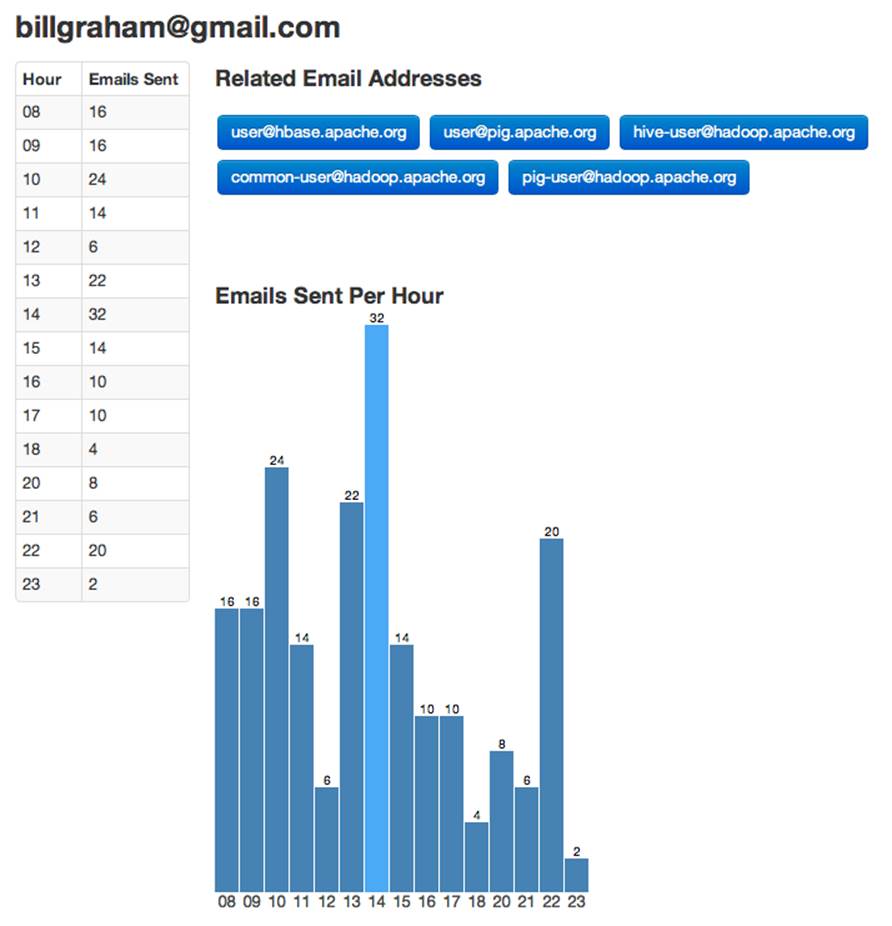
Figure 7-4. Bug in email address page
We can fix this bug in five places: JavaScript, the template, the controller, the database, or with Pig. Let’s look at where it makes the most sense to fix it (Figure 7-5).
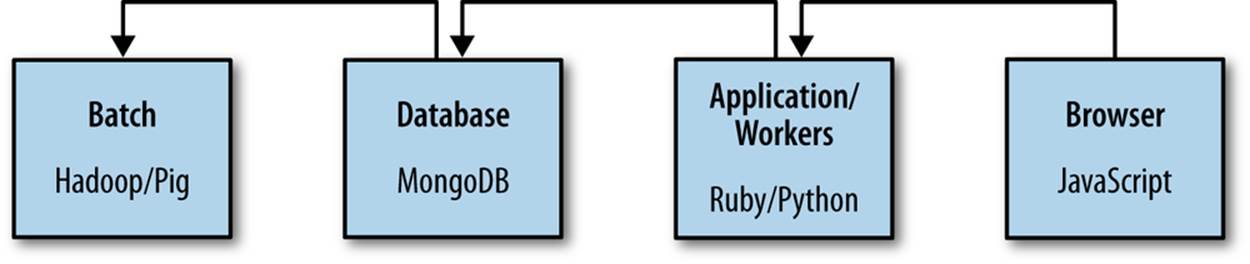
Figure 7-5. Fixing a bug at each level of our stack
// Get "00" - "23"
function makeHourRange(num) {
return num < 10 ? "0" + num.toString() : num.toString();
}
function fillBlanks(rawData) {
var hourRange = d3.range(0,24);
var ourData = Array();
for (hour in hourRange)
{
var hourString = makeHourRange(hour);
var found = false;
for(x in rawData)
{
if(rawData[x]['sent_hour'] == hourString)
{
found = true;
break;
}
}
if(found == true)
{
ourData.push(rawData[x]);
}
else
{
ourData.push({'sent_hour': hourString, 'total': 0})
}
}
return ourData;
}
var rawData = {{ chart_json|safe }};
var filledData = fillBlanks(rawData);
First, we can fix the bug in JavaScript in the user’s browser. Check out ch07/web/templates/partials/address.html.
It’s possible to fix this in the template language, but embedding this kind of logic here is discouraged. Jinja2 isn’t for data processing; we can do that elsewhere. Instead, we can fix it in our Python controller by reformatting the data at each request. Check outch07/python/sent_distribution_fix.py.
def fill_in_blanks(in_data):
out_data = list()
hours = [ '%02d' % i for i inrange(24) ]
for hour inhours:
entry = [x for x inin_data if x['sent_hour'] == hour]
if entry:
out_data.append(entry[0])
else:
out_data.append({'sent_hour': hour, 'total': 0})
return out_data
Changing one line in our controller gets our empty values filled in.
def address(email_address):
chart_json = json.dumps(fill_in_blanks(sent_dist['sent_dist']))
We can see that when it comes to data, Python has teeth. List comprehensions make this implementation fairly succinct.
The problem here is that we’re reformatting the data at each request that we formatted ourselves in our Pig script. Why not simply get the format right the first time? Consistency between model and view creates clarity for everyone.
Mongo can use the same JavaScript we used in the web page to fill in empty values in a query. Beautiful, right? There is one exception: we must create our own range() function, as d3.js is not available to MongoDB.
Thanks to the example at http://stackoverflow.com/questions/8273047/javascript-function-similar-to-python-range, we can write our own:
function range(start, stop, step){
if (typeof stop=='undefined'){
// one param defined
stop = start;
start = 0;
};
if (typeof step=='undefined'){
step = 1;
};
if ((step>0 && start>=stop) || (step<0 && start<=stop)){
return [];
};
var result = [];
for (var i=start; step>0 ? i<stop : i>stop; i+=step){
result.push(i);
};
return result;
};
// Get "00" - "23"
function makeHourRange(num) {
return num < 10 ? "0" + num.toString() : num.toString();
}
function fillBlanks(rawData) {
var hourRange = range(0,24);
var ourData = Array();
for (hour in hourRange)
{
var hourString = makeHourRange(hour);
var found = false;
for(x in rawData)
{
if(rawData[x]['sent_hour'] == hourString)
{
found = true;
break;
}
}
if(found == true)
{
ourData.push(rawData[x]);
}
else
{
ourData.push({'sent_hour': hourString, 'total': 0})
}
}
return ourData;
}
fillBlanks(data);
While being able to query our database in JavaScript is convenient, ideally we’d fix the problem at its source. To do so, we can reuse our Python code by modifying it into a Python UDF for Pig and calling this from our script. Note that Pig converts Pig tuples to tuples and Pig bags to lists of tuples.
@outputSchema("sent_dist:bag{t:(sent_hour:chararray, total:int)}")
def fill_in_blanks(sent_dist):
print sent_dist
out_data = list()
hours = [ '%02d' % i for i inrange(24) ]
for hour inhours:
entry = [x for x insent_dist if x[0] == hour]
if entry:
entry = entry[0]
print entry.__class__
out_data.append(tuple([entry[0], entry[1]]))
else:
out_data.append(tuple([hour, 0]))
return out_data
/* Load our Jython UDFs */
register 'udfs.py' using jython as funcs;
emails = load '/me/tmp/thu_emails/' using AvroStorage();
...
/* Here we apply our Jython UDF, fill_in_blanks() to fill holes in our time
series. */
filled_dist = foreach sent_distributions generate email, funcs.fill_in_blanks
(sent_dist) as sent_dist;
store filled_dist into '/tmp/filled_distributions.avro' using AvroStorage();
store filled_dist into 'mongodb://localhost/agile_data.sent_dist' using
MongoStorage();
We’ve fixed one bug four different ways (Figure 7-6). In practice we might process data at any part of the stack, but prudence tells us to push our processing deeper in the stack in order to reach a simple, globally consistent view of our entities and their relationships.
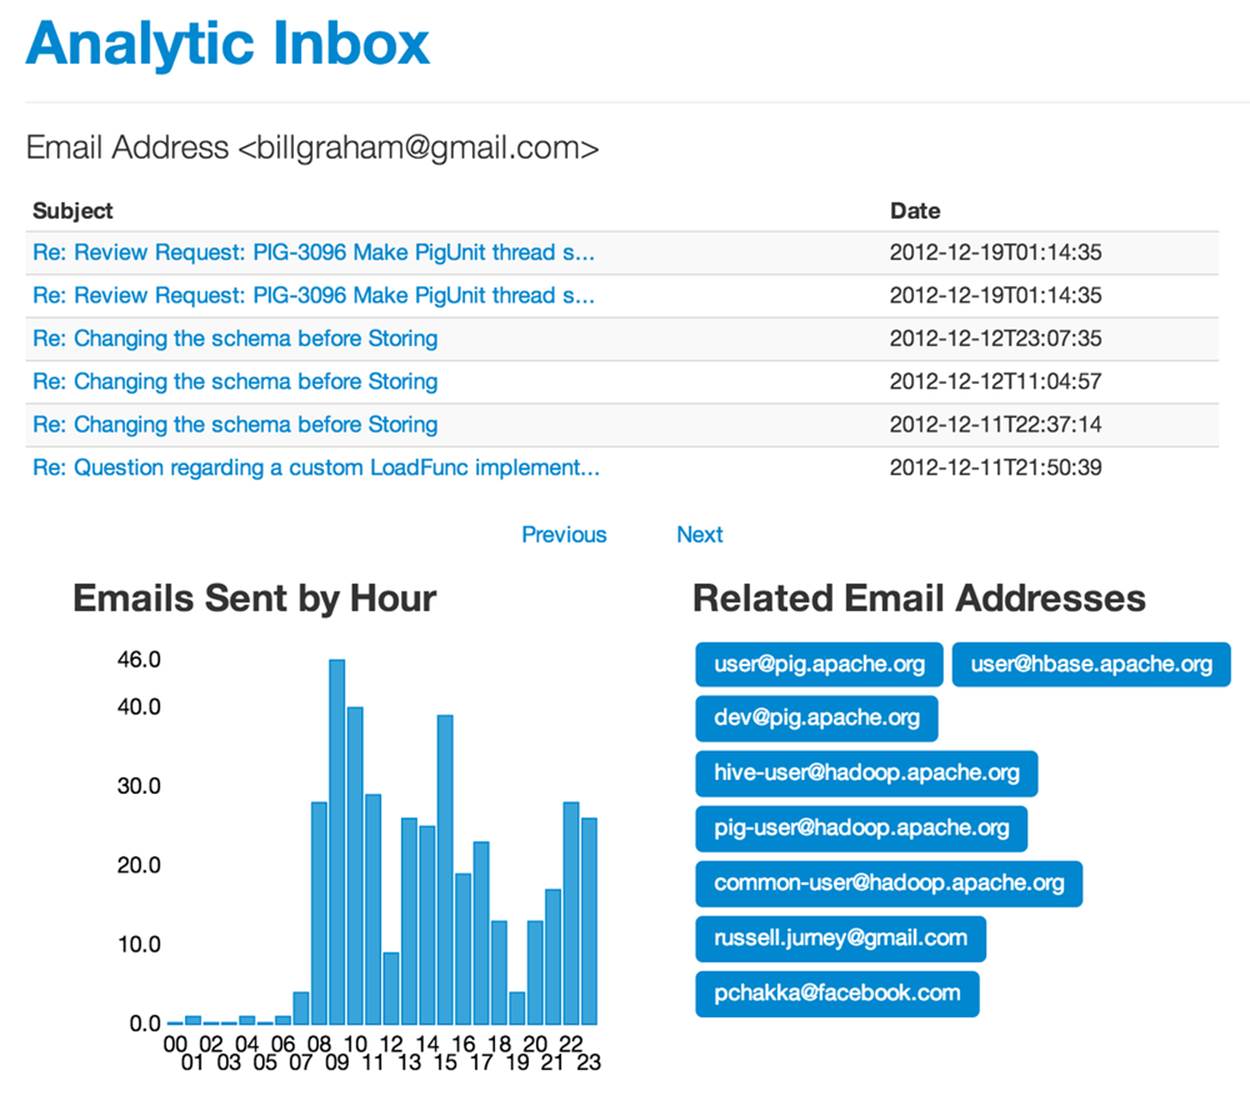
Figure 7-6. Fixed bug
Extracting Keywords from Emails with TF-IDF
Let’s get a little bit more sophisticated and tease some structured data from unstructured fields of our semistrutured email documents. To do this, we’ll use a derivative of a popular algorithm, TF-IDF (Term Frequency, Inverse Document Frequency), called Normalized Term Frequency, Inverse Document Frequency. TF-IDF works on the principle that words in a document that are common in all documents aren’t likely to be as important as words that appear in a document and don’t often appear in other documents.
I’ve implemented this algorithm as a macro. Check out ch07/pig/ntfidf.macro.
# Derived from TF-IDF by Jacob Perkins at
http://thedatachef.blogspot.com/2011/04/tf-idf-with-apache-pig.html with
# help from Mat Kelcey who referred me to
http://nlp.stanford.edu/IR-book/html/htmledition/maximum-tf-normalization-1.html
/* A Pig Macro to implement the NTF-IDF Algorithm */
DEFINE ntf_idf(token_records, id_field, token_field) RETURNS out_relation {
/* Calculate the term count per document */
doc_word_totals = foreach (group $token_records by ($id_field, $token_field))
generate
FLATTEN(group) as ($id_field, token),
COUNT_STAR($token_records) as doc_total;
/* Calculate the document size */
pre_term_counts = foreach (group doc_word_totals by $id_field) generate
group AS $id_field,
FLATTEN(doc_word_totals.(token, doc_total)) as (token, doc_total),
SUM(doc_word_totals.doc_total) as doc_size,
MAX(doc_word_totals.doc_total) as max_freq;
/* Calculate the TF - Term Frequency */
term_freqs = foreach pre_term_counts generate
$id_field as $id_field,
token as token,
((double)doc_total / (double)doc_size / (double) max_freq) AS term_freq;
/* Get count of documents using each token, for idf */
token_usages = foreach (group term_freqs by token) generate
FLATTEN(term_freqs) as ($id_field:chararray, token:chararray,
term_freq:double),
COUNT_STAR(term_freqs) as num_docs_with_token;
/* Get document count */
just_ids = foreach $token_records generate $id_field;
just_ids = DISTINCT just_ids;
ndocs = foreach (group just_ids all) generate COUNT_STAR(just_ids)
as total_docs;
/* Note the use of Pig Scalars to calculate idf */
scores = foreach token_usages {
idf = LOG((double)ndocs.total_docs/(double)num_docs_with_token);
ntf_idf = (double)term_freq * idf;
generate $id_field as $id_field,
token as token,
(double)ntf_idf as score:double;
};
$out_relation = filter scores by token IS NOT NULL and token != ''
and LENGTH(token) > 2; -- score > 0.10 and
};
This is called by ch07/pig/topics.pig. Note that this script uses the TokenizeText UDF from the varaha project, which is available at https://github.com/Ganglion/varaha. To install varaha, run:
git clone git@github.com:Ganglion/varaha.git
cd varaha
mvn install
The script itself is straightforward:
/* Set Home Directory - where we install software */
%default HOME `echo \$HOME/Software/`
/* Avro uses json-simple, and is in piggybank until Pig 0.12, where AvroStorage and
TrevniStorage are builtins */
REGISTER $HOME/pig/build/ivy/lib/Pig/avro-1.5.3.jar
REGISTER $HOME/pig/build/ivy/lib/Pig/json-simple-1.1.jar
REGISTER $HOME/pig/contrib/piggybank/java/piggybank.jar
DEFINE AvroStorage org.apache.pig.piggybank.storage.avro.AvroStorage();
DEFINE LENGTH org.apache.pig.piggybank.evaluation.string.LENGTH();
REGISTER $HOME/varaha/lib/*.jar /* Varaha has a good tokenizer */
REGISTER $HOME/varaha/target/varaha-1.0-SNAPSHOT.jar
DEFINE TokenizeText varaha.text.TokenizeText();
set default_parallel 20
rmf /tmp/tf_idf_scores.txt
rmf /tmp/ntf_idf_scores.txt
rmf /tmp/trimmed_tokens.txt
register 'udfs.py' using jython as funcs;
import 'ntfidf.macro';
/* Load emails and trim unneeded fields */
emails = load '/me/Data/test_mbox' using AvroStorage();
id_body_address = foreach emails generate message_id, body, from.address as
address;
/* Project and flatten to message_id/address/token and basic filter */
token_records_address = foreach id_body_address generate message_id, address,
FLATTEN(TokenizeText(body)) as token;
trimmed_tokens = filter token_records_address by token is not null and token
!= '' and LENGTH(token) > 2;
store trimmed_tokens into '/tmp/trimmed_tokens.txt';
/* Run topics per message */
ntf_idf_scores_per_message = ntf_idf(trimmed_tokens, 'message_id', 'token');
store ntf_idf_scores_per_message into '/tmp/ntf_idf_scores_per_message.txt';
Once topics per document and their scores are calculated, they are processed into groups per document, with the top N topics for the document in each group. Check out ch07/pig/process_topics.pig.
set default_parallel 20
rmf /tmp/topics_per_document.txt
-- Topics Per Document
topic_scores_per_message = LOAD '/tmp/ntf_idf_scores_per_message.txt' as
(message_id:chararray, topic:chararray, score:double);
per_document = foreach (group topic_scores_per_message by message_id) {
sorted = order topic_scores_per_message by score desc;
limited = limit sorted 10;
generate group as message_id, limited.(topic, score);
};
store per_document into '/tmp/topics_per_document.txt';
Finally, the topics are stored in Mongo in the topics_per_email relation, by ch07/pig/publish_topics_per_email.pig.
/* Set Home Directory - where we install software */
%default HOME `echo \$HOME/Software/`
/* MongoDB libraries and configuration */
REGISTER $HOME/mongo-hadoop/mongo-2.10.1.jar
REGISTER $HOME/mongo-hadoop/core/target/mongo-hadoop-core-1.1.0-SNAPSHOT.jar
REGISTER $HOME/mongo-hadoop/pig/target/mongo-hadoop-pig-1.1.0-SNAPSHOT.jar
DEFINE MongoStorage com.mongodb.hadoop.pig.MongoStorage();
per_document_scores = LOAD '/tmp/topics_per_document.txt' AS
(message_id:chararray, topics:bag{topic:tuple(word:chararray, score:double)});
store per_document_scores into 'mongodb://localhost/agile_data.topics_per_email'
using MongoStorage();
Checking on our data in MongoDB yields:
db.topics_per_email.findOne()
{
"_id" : ObjectId("510ef2803004df85dba4ec3a"),
"message_id" : "CANSvDjrA-dea9T-iZ6wJOLBP_Kqriae3FMDasU2OxO0gfzxJjg@mail.gmail.com",
"topics" : [
{
"word" : "grass",
"score" : 0.31845143365191986
},
{
"word" : "plant",
"score" : 0.2810330077326449
},
{
"word" : "rye",
"score" : 0.20285020154575548
},
{
"word" : "sack",
"score" : 0.19571670266698085
},
{
"word" : "topsoil",
"score" : 0.19381049907089434
},
{
"word" : "warms",
"score" : 0.19207027153110176
},
{
"word" : "turf",
"score" : 0.1889872579345566
},
{
"word" : "weeds",
"score" : 0.16849717160426886
},
{
"word" : "winter",
"score" : 0.13641124134559518
},
{
"word" : "dad",
"score" : 0.12483962902570728
}
]
}
We display these records in our controller for emails:
# Controller: Fetch an email and display it
@app.route("/email/<message_id>")
def email(message_id):
email = emails.find_one({'message_id': message_id})
address_hash = addresses_per_email.find_one({'message_id': message_id})
sent_dist_records = sent_distributions.find_one({'address': email['from']
['address']})
topics = topics_per_email.find_one({'message_id': message_id})
return render_template('partials/email.html', email=email,
addresses=address_hash
['addresses'],
chart_json=json.dumps
(sent_dist_records
['sent_distribution']),
sent_distribution=
sent_dist_records,
topics=topics)
In our template:
{% if topics -%}
<h3 style="margin-bottom: 5px;">Topics</h2>
<ul class="nav nav-pills">
{% for item in topics['topics'] -%}
<li class="active">
<a style="margin: 3px;" href="/topic/{{ item['word'] }}">{{ item['word'] }}</a>
</li>
{% endfor -%}
</ul>
{% endif -%}
And finally, in our browser, as Figure 7-7 shows.
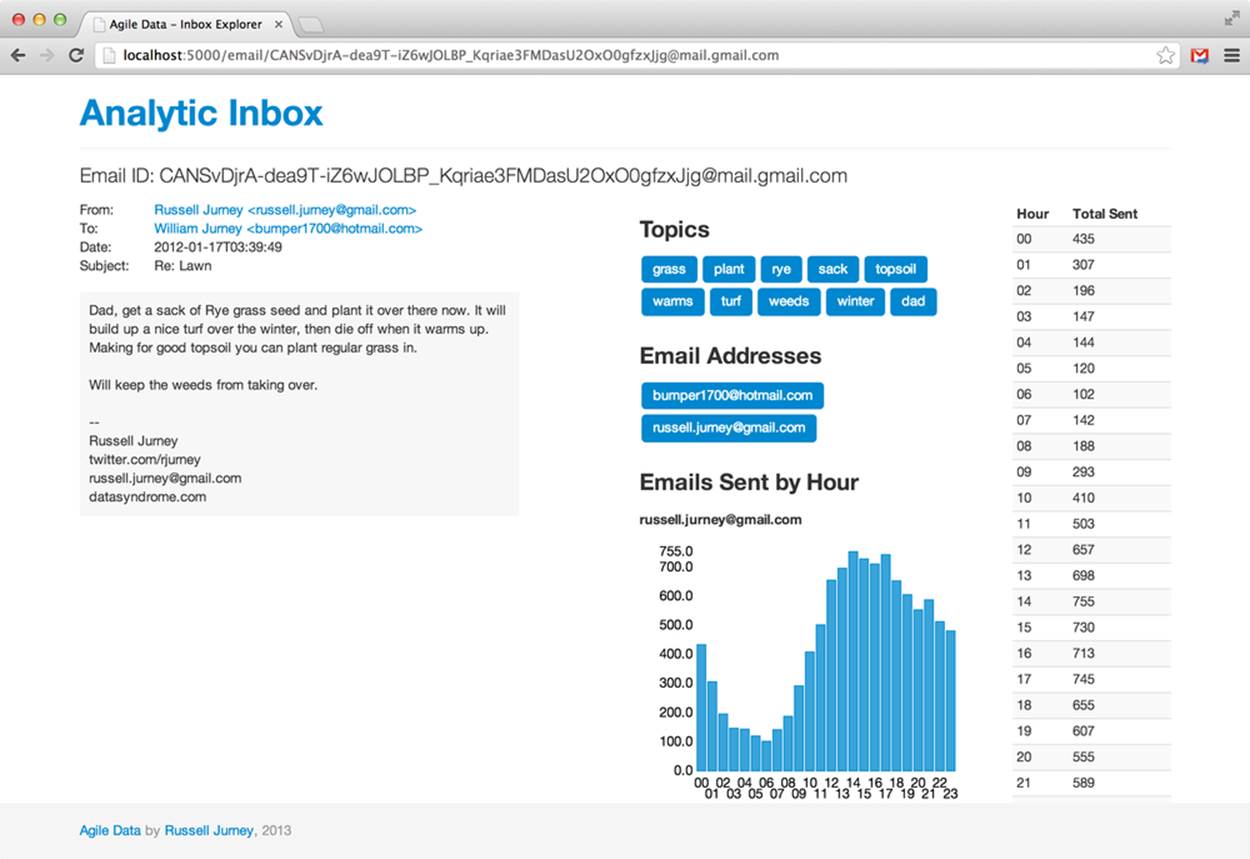
Figure 7-7. Email topics
Conclusion
Here’s a summary of what we’ve done so far in these steps:
1. Create interesting, interconnected records. The bar for “interesting” is initially low. We will improve it over time based on user feedback, traffic analysis, and noodling.
2. Store these records as objects in a document store, like so:
key => {property1, property2, links => [key1, key2, key3]}
Split records as properties increase and become complex to avoid deep nesting. Or go at it as a document. Both approaches are valid if they fit your data.
3. Use a lightweight web framework like Flask or Sinatra to emit the key/value data as JSON, or use a document store that returns JSON in the first place.
All materials on the site are licensed Creative Commons Attribution-Sharealike 3.0 Unported CC BY-SA 3.0 & GNU Free Documentation License (GFDL)
If you are the copyright holder of any material contained on our site and intend to remove it, please contact our site administrator for approval.
© 2016-2026 All site design rights belong to S.Y.A.