Practical Reverse Engineering: x86, x64, ARM, Windows Kernel, Reversing Tools, and Obfuscation (2014)
Chapter 4. Debugging and Automation
Debuggers are programs that leverage support from the processor and operating system to enable tracing of other programs so that one can discover bugs or simply understand the logic of the debugged program. Debuggers are an essential tool for reverse engineers because, unlike disassemblers, they allow runtime inspection of the program's state.
The purpose of this chapter is to familiarize you with the free debugging tools from Microsoft. It is not intended to teach you debugging techniques or how to troubleshoot memory leaks, deadlocks, and so forth. Instead, it focuses on the most important commands and automation/scripting facilities, and how to write debugger extensions for the sole purpose of aiding you in reverse engineering tasks.
The chapter covers the following topics:
· The debugging tools and basic commands—This section covers the basics of debugging, various commands, expression evaluations and operators, process and thread-related commands, and memory manipulation.
· Scripting—The scripting language of the debugger engine is not very user friendly. This section explains the language in a structured and easy to follow manner, with various examples and a set of scripts to illustrate each topic. After reading this section, you will start leveraging the power of scripting in the debugger.
· Using the SDK—When scripts are not enough, you can always write extensions in C or C++. This section outlines the basics of extension writing in C/C++.
The Debugging Tools and Basic Commands
The Debugging Tools for Windows package is a set of debugging utilities that you can download for free from Microsoft's website. The toolset ships with four debuggers that are all based on the same debugger engine (DbgEng).
The DbgEng is a COM object that enables other programs to use advanced debugging APIs rather than just the plain Windows Debugging APIs. In fact, the Debugging Tools package comes with an SDK that illustrates how to write extensions for the DbgEng or host it in your own programs.
The Debugging Tools for Windows package includes the following debuggers:
· NTSD/CDB—Microsoft NT Symbolic Debugger (NTSD) and Microsoft Console Debugger (CDB) are both identical except that the former creates a new console window when started, whereas the latter inherits the console window that was used to launch it.
· WinDbg—This a graphical interface for the DbgEng. It supports source-level debugging and saving workspaces.
· KD—Kernel Debugger (KD) is used to debug the kernel.
The debuggers have a rich set of command-line switches. One particularly useful switch is –z, which is used to analyze crash dumps (*.dmp), cab files (*.cab) containing a crash dump file. Another use of the -z switch is to analyze PE files (executables or DLLs) by having the DbgEng map them as though they were in a crash dump.
The following example runs the cdb debugger with the -z switch in order to map calc.exe in the debugger:
C:\>cdb -z c:\windows\syswow64\calc.exe
Microsoft (R) Windows Debugger Version 6.13.0009.1140 X86
Copyright (c) Microsoft Corporation. All rights reserved.
Loading Dump File [c:\windows\syswow64\calc.exe]
Symbol search path is: SRV*C:\cache*http://msdl.microsoft.com/download/
symbols
Executable search path is:
ModLoad: 00400000 004c7000 c:\windows\syswow64\calc.exe
eax=00000000 ebx=00000000 ecx=00000000 edx=00000000 esi=00000000 edi=00000000
eip=0041a592 esp=00000000 ebp=00000000 iopl=0 nv up di pl nz na po nc
cs=0000 ss=0000 ds=0000 es=0000 fs=0000 gs=0000 efl=00000000
calc!WinMainCRTStartup:
0041a592 e84bf0ffff call calc!__security_init_cookie (004195e2)
0:000>
Please note two things:
· Calc.exe was mapped into the debugger, and EIP points to its entry point (unlike live targets, which point inside ntdll.dll).
· Many debugger commands won't be present, especially the process control commands (because the program is mapped for analysis/inspection, not for dynamic tracing/debugging).
Using the -z switch, you can write powerful scripts to analyze programs and extract information.
Note
You can configure WinDbg to act as the just-in-time (JIT) debugger (for the purposes of postmortem debugging) by running Windbg.exe -I once as a privileged user.
The following sections explain various debugger commands, providing examples along the way.
Setting the Symbol Path
Before launching any of the debuggers (WinDbg, CDB, NTSD, or KD), let's set up the _NT_SYMBOL_PATH environment variable:
_NT_SYMBOL_PATH=SRV*c:\ cache*http://msdl.microsoft.com/download/symbols
You can also set that up from inside the debugger using the .sympath command:
Note
Setting the symbol path is important so that you can inspect some basic OS structures as you debug the programs in question. For instance, the !peb extension command will not function without symbols loaded for NTDLL.
Debugger Windows
The following windows, including their hotkeys when applicable, are exposed in WinDbg:
· Command/output window (Alt+1)—This window enables you to type commands and see the output of operations. While it is possible to debug using other windows and menu items, the command window enables you to make use of the full power of DbgEng's built-in commands and the available extensions.
· Registers window (Alt+4)—Displays the configured registers. It is possible to customize this view to control which registers are displayed or hidden.
· Memory (Alt+5)—Memory dump window. This window enables you to see the contents of memory, and to scroll, copy, and even edit the memory contents.
· Calls (Alt+6)—Displays the call stack information.
· Disassembly (Alt+7)—Whereas the command window will display the current instruction disassembly listing, the disassembly window displays a page worth of disassembled code. In this window it is also possible to carry out actions with hotkeys:
· Add or delete breakpoints on the selected line (F9)
· Process control (stepping/F11, resuming/F5, etc.)
· Navigation (Page up/Page down to explore disassembled code)
Note
WinDbg supports workspaces to enable the window configuration to be saved or restored.
Evaluating Expressions
The debugger understands two syntaxes for expression evaluation: Microsoft Macro Assembler (MASM) and C++.
To determine the default expression evaluator, use .expr without any arguments:
0:000> .expr
Current expression evaluator: MASM - Microsoft Assembler expressions
To change the current expression evaluation syntax, use
0:000> .expr /s c++
Current expression evaluator: C++ - C++ source expressions
or
0:000> .expr /s masm
Current expression evaluator: MASM - Microsoft Assembler expressions
Use the ? command to evaluate expressions (using the default syntax).
The ?? command is used to evaluate a C++ expression (disregarding the default selected syntax).
Note
The C++ syntax is preferable when type/symbol information is present and you need to access structure members or simply leverage the C++ operators.
Numbers, if not prefixed with a base specifier, are interpreted using the default radix setting. Use the n command to display the current number base, or n base_value to set the new default base.
When using MASM syntax, you can express a number in a base of your choice, use the following prefixes:
· 0n123 for decimal
· 0x123 for hex
· 0t123 for octal
· 0y10101 for binary
Unlike evaluating with the MASM syntax, when using ?? to evaluate commands, it is not possible to override the radix:
? 0y101 -> works
?? 0y101 -> does not work.
Note
When the default radix is 16 and you try to evaluate an expression such as abc, it can be confused between a symbol named abc or the hexadecimal number abc (2748 decimal). To resolve the symbol instead, prepend ! before the variable name: ? !abc.
As in the C++ language, the C++ evaluator syntax only permits the 0x prefix for hex and the 0 prefix for octal numbers. If no prefix is specified, base 10 is used.
To mix and match various types of expression, use the @@c++(expression) or @@masm(expression):
0:000> .expr
Current expression evaluator: MASM - Microsoft Assembler expressions
0:000> ? @@c++(@$peb->ImageSubsystemMajorVersion) + @@masm(0y1)
Evaluate expression: 7 = 00000007
The @@ prefix is a shorthand prefix that can be used to denote the alternative expression evaluation syntax (not the currently set syntax):
0:000> .expr
Current expression evaluator: MASM - Microsoft Assembler expressions
0:000> ? @@(@$peb->ImageSubsystemMajorVersion) + @@masm(0y1)
Evaluate expression: 7 = 00000007
You do not have to specify @@c++(…) because when MASM is the default, @@(…) will use the C++ syntax and vice versa.
Useful Operators
This section illustrates various useful operators that can be used in expressions. For the sake of demonstration, we use the predefined pseudo-registers $ip and $peb, which denote the current instruction pointer and the _PEB * of the current process, respectively. Other pseudo-registers are mentioned later in the chapter.
The notation used is “operator (expression syntax)”, where the expression syntax will be either C++ or MASM. Note that in the following examples the MASM expression evaluator is set by default.
· Pointer->Field (C++)—As in the preceding example, you use the arrow operator to access the field value pointed at by $peb and the offset of the ImageSubsystemMajorVersion field.
· sizeof(type) (C++)—This operator returns the size of the structure. This can come in handy when you are trying to parse data structures or write powerful conditional breakpoints:
· 0:000> ? @@c++(sizeof(_PEB))
Evaluate expression: 592 = 00000250
· #FIELD_OFFSET(Type, Field) (C++)—This macro returns the byte offset of the field in the type:
· 0:000> ? #FIELD_OFFSET(_PEB, ImageSubsystemMajorVersion)
Evaluate expression: 184 = 000000b8
· The ternary operator (C++)—This operator behaves like it does in the C++ language:
· 0:000> ? @@c++(@$peb->ImageSubsystemMajorVersion >= 6 ? 1 : 0)
Evaluate expression: 1 = 00000001
· (type) Value (C++)—Type casting enables you to cast from one type to another:
· 0:000> ? #FIELD_OFFSET(_PEB, BeingDebugged)
· Evaluate expression: 2 = 00000002
· 0:000> ? @$peb
· Evaluate expression: 2118967296 = 7e4ce000
· 0:000> ? #FIELD_OFFSET(_PEB, BeingDebugged) + (char *)@$peb
Evaluate expression: 2118967298 = 7e4ce002
Note that you cast @$peb to (char*) before adding to it the offset of BeingDebugged.
· *(pointer) (C++)—Dereferencing operator:
· 0:000> dd @$ip L 4
· 012a9615 2ec048a3 8b5e5f01 90c35de5 90909090
· 0:000> ? *( (unsigned long *)0x12a9615 )
Evaluate expression: 784353443 = 2ec048a3
Note that before dereferencing the pointer you have to give it a proper type (by casting it).
· poi(address) (MASM)—Pointer dereferencing:
· 0:000> ? @@masm(poi(0x12a9615))
Evaluate expression: 784353443 = 2ec048a3
· hi|low(number) (MASM)—Returns the high or low 16-bit value of a number:
· 0:000> ? hi(0x11223344)
· Evaluate expression: 4386 = 00001122
· 0:000> ? low(0x11223344)
Evaluate expression: 13124 = 00003344
· by/wo/dwo(address) (MASM)—Returns the byte/word/dword value when the address is dereferenced:
· 0:000> db @$ip L 4
· 012a9615 a3 48 00 00
· 0:000> ? by(@$ip)
· Evaluate expression: 163 = 000000a3
· 0:000> ? wo(@$ip)
· Evaluate expression: 18595 = 000048a3
· 0:000> ? dwo(@$ip)
Evaluate expression: 18595 = 000048a3
· pointer[index] (C++)—The array subscript operator enables you to dereference memory using indices:
· 0:000> db @$ip L 10
· 012a9615 a3 48 c0 2e 01 5f 5e 8b e5 5d
· 0:000> ? @@c++(((unsigned char *)@$ip)[3])
Evaluate expression: 46 = 0000002e
The same thing can be achieved using MASM syntax and poi() or by():
0:000> ? poi(@$ip+3) & 0xff
Evaluate expression: 46 = 0000002e
0:000> ? by(@$ip+3)
Evaluate expression: 46 = 0000002e
Note
When the pointer[index] is used, the base type size will be taken into consideration (unlike poi(), for which one has to take the type size into consideration).
· $scmp("string1", "string2")/$sicmp("String1", "String2") (MASM)—String comparison (case sensitive/case insensitive). Returns -1, 0, or 1, as in C's strcmp() / stricmp():
· 0:000> ? $scmp("practical", "practica")
· Evaluate expression: 1 = 00000001
· 0:000> ? $scmp("practical", "practical")
· Evaluate expression: 0 = 00000000
· 0:000> ? $scmp("practica", "practical")
· Evaluate expression: -1 = ffffffff
· 0:000> ? $scmp("Practical", "practical")
· Evaluate expression: -1 = ffffffff
· 0:000> ? $sicmp("Practical", "practical")
Evaluate expression: 0 = 00000000
· $iment(address) (MASM)—Returns the image entry point for the image existing in that address. The PE header is parsed and used:
· 0:000> lmvm ole32
· start end module name
· 74b70000 74c79000 ole32
· …
· 0:000> ? $iment(74b70000)
· Evaluate expression: 1958154432 = 74b710c0
· 0:000> u $iment(74b70000)
· ole32!_DllMainCRTStartup:
· 74b710c0 8bff mov edi,edi
· 74b710c2 55 push ebp
74b710c3 8bec mov ebp,esp
· $vvalid(address, length) (MASM)—Checks if the memory pointed at by the address until address + length is accessible (returns 1) or inaccessible (returns 0):
· 0:000> ? @@masm($vvalid(@$ip, 100))
· Evaluate expression: 1 = 00000001
· 0:000> ? @@masm($vvalid(0x0, 100))
Evaluate expression: 0 = 00000000
· $spat("string", "pattern") (MASM)—Uses pattern matching to determine if the pattern exists in the string, and returns true or false.
Process Control and Debut Events
This section introduces the basic process control commands (such as single stepping, stepping over, etc.) and the commands that can be used to change how the debugger reacts to certain debug events.
Process and Thread Control
These are some commands that allow you control the flow of the debugger:
· t (F11)—Step into.
· gu (Shift+F11)—Go up. Steps out of the current function and back to the caller.
· p (F10)—Step over.
· g (F5)—Go. Resumes program execution.
· Ctrl+Break—When the debuggee is running, use this hotkey to suspend it.
Note that the preceding commands work only with live targets.
There are useful variations to the “resume,” “step into,” and “step over” instructions, including the following:
· [t|p]a Address—Step into. Steps over until the specified address is reached.
· gc—This is used to resume execution when a conditional breakpoint suspends execution.
· g[h|n]—This is used to resume execution as handled or unhandled when an exception occurs.
Another set of tracing/stepping commands are useful to discover basic blocks:
· [p|t]c—Step over/into until a CALL instruction is encountered.
· [p|t]h—Step over/into until a branching instruction is encountered (all kinds of jump, return, or call instructions).
· [p|t]t—Step over/into until a RET instruction is encountered.
· [p|t]ct—Step over/into until a CALL or RET instruction is encountered.
Most of the preceding commands (tracing and stepping over) are implicitly operating within the context of the current thread.
To list all threads, use the ˜ command:
0:004> ˜
0 Id: 1224.13d8 Suspend: 1 Teb: ff4ab000 Unfrozen
1 Id: 1224.1758 Suspend: 1 Teb: ff4a5000 Unfrozen
2 Id: 1224.2920 Suspend: 1 Teb: ff37f000 Unfrozen
3 Id: 1224.1514 Suspend: 1 Teb: ff37c000 Unfrozen
. 4 Id: 1224.b0 Suspend: 1 Teb: ff2f7000 Unfrozen
The first column is the thread number (decided by DbgEng), followed by a pair of SystemProcessId.SystemThreadId in hexadecimal format.
The DbgEng commands work with DbgEng IDs, rather than the operating system's process/thread IDs.
To switch to another thread, use the ˜Ns command, where N is the thread number you want to switch to:
0:004> ˜1s
eax=00000000 ebx=00bb1ab0 ecx=00000000 edx=00000000 esi=02faf9ec edi=00b2ec00
eip=7712c46c esp=02faf8a4 ebp=02fafa44 iopl=0 nv up ei pl nz na po nc
cs=0023 ss=002b ds=002b es=002b fs=0053 gs=002b efl=00000202
ntdll!NtWaitForWorkViaWorkerFactory+0xc:
7712c46c c21400 ret 14h
0:001>
The debugger prompt also shows the selected thread ID in the prompt ProcessID:ThreadId>.
You don't have to switch to threads before issuing a command; for instance, to display registers of thread ID 3, use the ˜3 prefix followed by the desired debugger command (in this case the r) command:
0:001> ˜3r
eax=00000000 ebx=00000000 ecx=00000000 edx=00000000 esi=00000001 edi=00000001
eip=7712af2c esp=031afb38 ebp=031afcb8 iopl=0 nv up ei pl nz na po nc
cs=0023 ss=002b ds=002b es=002b fs=0053 gs=002b efl=00000202
ntdll!NtWaitForMultipleObjects+0xc:
7712af2c c21400 ret 14h
0:001> ˜3t
eax=00000000 ebx=00000000 ecx=77072772 edx=00000000 esi=00000001 edi=00000001
eip=758c11b5 esp=031afb50 ebp=031afcb8 iopl=0 nv up ei pl nz na po nc
cs=0023 ss=002b ds=002b es=002b fs=0053 gs=002b efl=00000202
KERNELBASE!WaitForMultipleObjectsEx+0xdc:
758c11b5 8bf8 mov edi,eax
To display the register values of all the threads, simply pass * as the thread number.
Note
Not all debugger commands can be prefixed with ˜N cmd so that they yield information about thread N. Instead, use the thread-specific command ˜eN cmd.
If you are debugging various user mode processes (i.e., when the debugger is launched with the -o switch), it is possible to switch from one process to another using the | command. The following example uses Internet Explorer because it normally spawns various child processes (with different integrity levels and for various purposes):
C:\ dbg64>windbg -o "c:\Program Files (x86)\Internet Explorer\iexplore.exe"
Let it run, open a few tabs, and then let the debugger resume with g and then suspend it and type |:
0:030> |
. 0 id: 1818 child name: iexplore.exe
1 id: 1384 child name: iexplore.exe
To switch from one process to another, type |Ns, where N is the process number:
0:030> |1s
1:083> |
# 0 id: 1818 child name: iexplore.exe
. 1 id: 1384 child name: iexplore.exe
Once you switch to a new process, future commands will apply to this process. Breakpoints you set for a process will not be present in the other process.
Note
Aliases and pseudo-registers will be common to all the processes being debugged.
Monitoring Debugging Events and Exceptions
It is possible to capture certain debugging events and exceptions as they occur and let the debugger suspend, display, handle, leave unhandled, or just ignore the event altogether.
The DbgEng may suspend the target and give the user a chance to decide what action to take in the follow two circumstances:
· Exceptions—These events happen when an exception triggers in the context of the application (Access Violation, Divide By Zero, Single Step Exception, etc.).
· Events—These events are not errors, they are triggered by the operating system to notify the debugger about certain activities taking place (a new thread has been created or terminated, a module has been loaded or unloaded, a new process has been created or terminated, etc.).
To list all the events, use the sx command. Equally, if you are using WinDbg, you can navigate to the Debug/Event Filters menu to graphically configure the events, as shown in Figure 4.1.
Figure 4.1
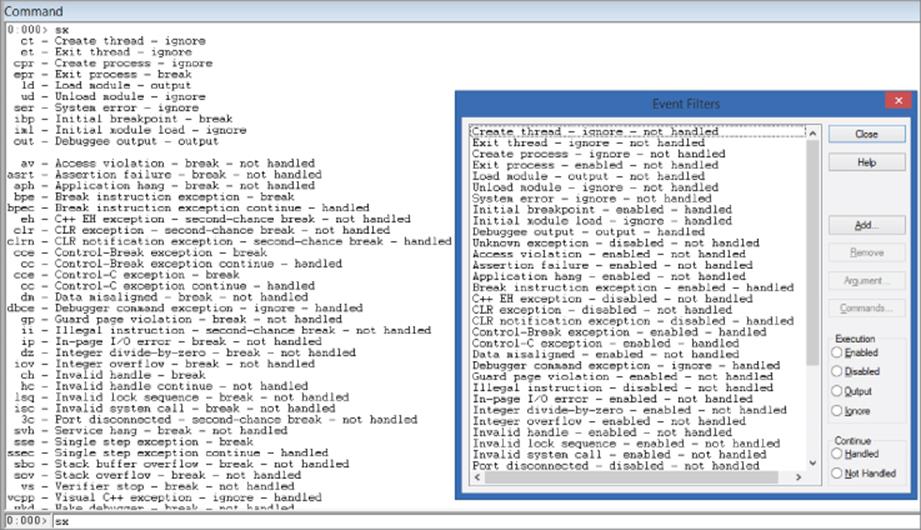
The screenshot shows two sets of configuration to control events:
· Execution—Dictates what to do when that event takes place.
· Continue—Decides how to resume from the event or exception.
· Handled—Marks the exception as being handled (the application's exception handler will not trigger). This is useful when the debugger breaks and you manually fix the situation and then resume the application with the gh command.
· Not Handled—Lets the application's exception handler take care of the exception. Use the gn command to resume.
Use the following commands to control how events/exceptions are handled:
· sxe event—Enables breaking for an event
· sxd event—Disables breaking for an event
· sxr event—Enables output only for an event
· sxi event—Ignores the event (do not event output anything)
The event parameter can be an exception code number, event short code name, or * for any event.
A rather useful application of the sxe or the sxd commands is to catch module loading or unloading. For example, when kernel debugging, to stop the debugger when a certain driver is loaded, use the following command:
sxe ld:driver_name.sys
To associate a command with an event, use the sx- -c command event command. For example, to display the call stack each time a module is loaded, use the following command:
sx- -c "k" ld
Registers, Memory, and Symbols
This section covers some of the useful commands that deal with registers management, memory contents inspection and modification, symbols, structures, and other handy commands.
Registers
The r command is used to display register values or to change them.
Note
The r command can also be used to alter fixed-name aliases and pseudo-registers values. This usage is covered in subsequent sections.
The general syntax of the r command is as follows:
r[M Mask|F|X] [RegisterName_Or_FlagName[:[Num]Type] [=[Expression_Or_Value]]]
Here is the simplest syntax of the r command:
r RegisterName|FlagName [= Expression_Or_Value ]
If the expression or value is omitted, then r will display the current value of the register:
0:001> r eax
eax=7ffda000
0:001> r eax = 2
0:001> r eax
eax=00000002
To display the registers involved in the current instruction, use the r. command:
0:000> u rip L1
00007ff6‘f54d6470 48895c2420 mov qword ptr [rsp+20h],rbx
0:000> r.
rsp=000000c9‘e256fbb8 rbx=00000000‘00000000
0:000> u eip L1
user32!MessageBoxA+0x3:
773922c5 8bec mov ebp,esp
0:000> r.
ebp=0018ff98 esp=0018ff78
Register Masks
The r command can be suffixed with the M character followed by a 32-bit mask value. The mask designates which registers to display when r is typed without parameters. Table 4.1 shows a short list of the mask values:
Note
Use the OR operator (|) to combine various masks.
Table 4.1 Register Mask Values
|
Register mask value |
Description |
|
2 |
General registers |
|
4 |
Floating-point registers |
|
8 |
Segment registers |
|
0x10 |
MMX |
|
0x20 |
Debug registers |
|
0x40 |
SSE XMM |
|
0x80 |
Kernel mode: Control registers |
|
0x100 |
Kernel mode: TSS |
To see the current mask, type rm:
0:000> rm
Register output mask is a:
2 - Integer state (64-bit)
8 - Segment registers
Now if you execute r, you should see only general-purpose registers and the segment registers:
eax=025ad9d4 ebx=00000000 ecx=7c91056d edx=00ba0000 esi=7c810976 edi=10000080
eip=7c810978 esp=025ad780 ebp=025adbec iopl=0 nv up ei pl nz na po nc
cs=001b ss=0023 ds=0023 es=0023 fs=003b gs=0000 efl=00000202
To display all possible registers, set all the bits to one in the mask parameter (mask 0x1ff):
kd> rM1ff
eax=025ad9d4 ebx=00000000 ecx=7c91056d edx=00ba0000 esi=7c810976 edi=10000080
eip=7c810978 esp=025ad780 ebp=025adbec iopl=0 nv up ei pl nz na po nc
cs=001b ss=0023 ds=0023 es=0023 fs=003b gs=0000 efl=00000202
fpcw=027F: rn 53 puozdi fpsw=0000: top=0 cc=0000 -------- fptw=FFFF
fopcode=0000 fpip=0000:00000000 fpdp=0000:00000000
st0= 0.000000000000000000000e+0000 st1= 0.303405511757512497160e-4933
st2=-3.685298464319287816590e-4320 st3= 0.000000015933281407050e-4357
st4=-0.008610620845784322250e-4310 st5= 0.000000125598791309870e-4184
st6=-0.008011795206688037930e+0474 st7=-1.#QNAN0000000000000000e+0000
mm0=0000000000000000 mm1=0127b52000584c8e
mm2=2390ccb400318a24 mm3=000000057c910732
mm4=003187cc00000000 mm5=000000117c910732
mm6=003187ec00000000 mm7=7c9107387c90ee18
xmm0=1.79366e-043 0 6.02419e+036 6.02657e+036
xmm1=0 3.08237e-038 3.08148e-038 0
xmm2=3.30832e-029 5.69433e-039 0 3.08147e-038
xmm3=5.6938e-039 0 9.62692e-043 5.69433e-039
xmm4=3.04894e-038 2.12997e-042 3.07319e-038 5.69433e-039
xmm5=5.69528e-039 6.02651e+036 4.54966e-039 1.16728e-042
xmm6=5.69567e-039 0 5.69509e-039 6.02419e+036
xmm7=4.54901e-039 5.69575e-039 0 5.69559e-039
cr0=8001003b cr2=7c99a3d8 cr3=07f40280
dr0=00000000 dr1=00000000 dr2=00000000
dr3=00000000 dr6=ffff4ff0 dr7=00000400 cr4=000006f9
gdtr=8003f000 gdtl=03ff idtr=8003f400 idtl=07ff tr=0028 ldtr=0000
Note
Some processor registers (GDT, IDT, control registers, etc.) can be displayed in kernel mode debugging only.
To set the default mask, use the rm command followed by the desired mask value:
0:000> rm 2|4|8
0:000> rm
Register output mask is f:
2 - Integer state (64-bit)
4 - Floating-point state
8 - Segment registers
The DbgEng provides shorthand flags for certain masks—namely, the floating-point and the MMX registers.
To display floating-point registers, use rF; and to display XMM registers, use rX:
0:000> rF
fpcw=027F: rn 53 puozdi fpsw=4020: top=0 cc=1000 --p----- fptw=FFFF
fopcode=0000 fpip=0023:74b785bc fpdp=002b:00020a84
st0= 0.000000000000000000000e+0000 st1= 0.000000000000000000000e+0000
…
0:000> rX
xmm0=0 0 0 0
xmm1=0 0 0 0
xmm2=0 0 0 0
…
Register Display Format
It is possible to specify how the registers should be displayed. This is very useful in many cases, as illustrated in the following examples.
Displaying Registers in Floating-Point Formats
Suppose you're debugging and notice that register eax holds a floating-point value:
0:000> r eax
eax=3f8ccccd
To display it properly, use the following:
0:000> r eax:f
eax=1.1
To display the contents of rax in double-precision, floating-point value, use this:
0:000> r rax
rax=4014666666666666
0:000> r rax:d
rax=5.1
Displaying Registers in Bytes/Word/Dword/Qword Formats
When registers are involved in data transfer, it is useful to see the register's individual bytes:
msvcrt!memcpy+0x220:
00007ff9‘5f671a5d f30f7f40f0 movdqu xmmword ptr [rax-10h],xmm0
0:000> r xmm0
xmm0= 0 1.05612e-038 1.01939e-038 1.00102e-038
0:000> r xmm0:ub
xmm0=00 00 00 00 00 73 00 6c 00 6f 00 62 00 6d 00 79
0:000> rX xmm0:uw
xmm0=0000 0000 0073 006c 006f 0062 006d 0079
0:000> rX xmm0:ud
xmm0=00000000 0073006c 006f0062 006d0079
0:000> rX xmm0:uq
xmm0=000000000073006c 006f0062006d0079
In the preceding example, memcpy() uses the XMM registers to transfer 16 bytes at a time. You use the ub format to display the contents of xmm0 in unsigned bytes format, uw for word format, ud for double-word format, and uq for quad-word format. To display in signed format, use the i prefix instead of u.
Display Selector Command
The display selector command has the following syntax:
dg FirstSelector [LastSelector]
It displays information about a given selector (or range of selectors). In this case, you are interested in selector values that are currently set in one of the x86/x64 registers—namely, the cs, ds, ss, gs, and fs registers.
Selectors are used in the segment part of an address in protected mode.
The following example executes the dg command for cs, ds, ss, gs, and fs, respectively:
0:001> .foreach /s (sel "cs ds ss gs fs") { dg sel; }
(cs Selector)
P Si Gr Pr Lo
Sel Base Limit Type l ze an es ng Flags
---- -------- -------- ---------- - -- -- -- -- --------
0023 00000000 ffffffff Code RE Ac 3 Bg Pg P Nl 00000cfb
(ds Selector)
P Si Gr Pr Lo
Sel Base Limit Type l ze an es ng Flags
---- -------- -------- ---------- - -- -- -- -- --------
002B 00000000 ffffffff Data RW Ac 3 Bg Pg P Nl 00000cf3
(ss Selector)
P Si Gr Pr Lo
Sel Base Limit Type l ze an es ng Flags
---- -------- -------- ---------- - -- -- -- -- --------
002B 00000000 ffffffff Data RW Ac 3 Bg Pg P Nl 00000cf3
(gs Selector)
P Si Gr Pr Lo
Sel Base Limit Type l ze an es ng Flags
---- -------- -------- ---------- - -- -- -- -- --------
002B 00000000 ffffffff Data RW Ac 3 Bg Pg P Nl 00000cf3
(fs Selector)
P Si Gr Pr Lo
Sel Base Limit Type l ze an es ng Flags
---- -------- -------- ---------- - -- -- -- -- --------
0053 7ffda000 00000fff Data RW Ac 3 Bg By P Nl 000004f3
In MS Windows/user-mode applications, the cs, ds, es, ss, and gs selectors have a base value of zero, thus the linear address is the same as the virtual address.
Conversely, the fs register is variable, changing its value from thread to thread. The fs segment in user-mode processes points to the TEB (Thread Environment Block) structure:
0:003> dg fs
Sel Base Limit Type l ze an es ng Flags
---- -------- -------- ---------- - -- -- -- -- --------
0053 ff306000 00000fff Data RW Ac 3 Bg By P Nl 000004f3
(Switch to another thread)
0:003> ˜2s
0:002> dg fs
Sel Base Limit Type l ze an es ng Flags
---- -------- -------- ---------- - -- -- -- -- --------
0053 ff4a5000 00000fff Data RW Ac 3 Bg By P Nl 000004f3
Memory
Before describing memory-related commands, it is important to explain the address and range notations because they are passed as arguments to most commands that require a memory address and count.
The Address parameter can be any value, expression, or symbol that resolves to a numeric value that can be interpreted as an address. The number 0x401000 can be treated as an address if the address is mapped in memory. The name kernel32 will resolve to the image base of the module:
0:000> lmm kernel32
start end module name
75830000 75970000 KERNEL32
0:000> ? kernel32
Evaluate expression: 1971519488 = 75830000
A symbol such as module_name!SymbolName can be used as an address as long as it resolves:
0:000> ? kernel32!GetProcAddress
Couldn't resolve error at 'kernel32!GetProcAddress'
0:000> ? kernelbase!GetProcAddress
Evaluate expression: 1979722334 = 76002a5e
It is possible to use any expression as an address (notwithstanding whether the value resolves to a valid address or not):
0:000> ? (kernelbase!GetProcAddress - kernel32) / 0n4096
Evaluate expression: 2002 = 000007d2
The Range parameter can be specified in two ways. The first method is with a pair of starting and ending addresses:
0:000> db 02c0000 02c0005
002c0000 23 01 00 00 00 00 #.....
The second method is by using an address followed by the L character and an expression (address L Expression_Or_Value) that designs a count.
If the count is a positive value, then the starting address will be the specified address, and the ending address is implied and equal to address + count:
0:000> db 02c0000 L5
002c0000 23 01 00 00 00 #....
If the count is a negative value, then the ending address becomes the specified address, and the starting address becomes address - count:
0:000> db 02c0005 L-5
002c0000 23 01 00 00 00 #....
By default, the expression or the value passed after L cannot exceed 256MB. This is to prevent accidentally passing very large values. To overwrite this limitation, use L? instead of just L. For example, notice how the DbgEng will complain about this big size:
0:000> db @$ip L0xffffffff
^ Range error in 'db @$ip l0xffffffff
When L? is used, the DbgEng will be happy to comply:
0:000> db @$ip L?0xffffffff
760039c2 83 e4 f8 83 ec 18 8b 4d-1c 8b c1 25 b7 7f 00 00 .......M…%....
…
Dumping Memory Contents
The d command is used to dump memory contents. The general syntax is as follows:
d[a|b|c|d|D|f|p|q|u|w|W] [Options] [Range]
Various formats can be used to display memory contents. The most common formats are as follows:
· b, w, d, q—For byte, word, double-word, and quad-word format, respectively
· f, D—For single and double-precision floating-point values, respectively
· a, u—To display ASCII or Unicode memory contents, respectively
· p—For pointer values (the size varies according to the current pointer size of the target)
When the dp, dd, or dq are suffixed with s, the symbols corresponding to the addresses will be displayed. This can be handy to discover function pointers that are defined in an array or a virtual table:
(1)
0:011> bp combase!CoCreateInstance
(2)
0:024> g
Breakpoint 0 hit
combase!CoCreateInstance:
7526aeb0 8bff mov edi,edi
0:011> ? poi(esp+4*5)
Evaluate expression: 112323728 = 06b1ec90
0:011> ? poi(poi(esp+4*5))
Evaluate expression: 0 = 00000000
(3)
0:011> g poi(esp)
combase!CustomUnmarshalInterface+0x15d:
752743e7 fe8ef0000000 dec byte ptr [esi+0F0h] ds:002b:08664160=01
0:011> ? poi(06b1ec90)
Evaluate expression: 141774136 = 08734d38
(4)
0:011> dps 08734d38 L1
08734d38 752c9688 combase!CErrorObject::‘vftable'
0:011> dps 752c9688 L3
752c9688 752f6bdf combase![thunk]:CErrorObject::QueryInterface‘adjustor{8}'
752c968c 752f6bd0 combase![thunk]:CErrorObject::AddRef‘adjustor{8}'
752c9690 752a9b91 combase![thunk]:CErrorObject::Release‘adjustor{8}'
Marker 1 adds a breakpoint on the following function:
HRESULT CoCreateInstance(
REFCLSID rclsid,
LPUNKNOWN pUnkOuter,
DWORD dwClsContext,
REFIID riid,
LPVOID *ppv)
We are interested in determining the pointer value (parameter 5) of the newly created interface after the function returns. On marker 2, we resume execution. The program later breaks on the breakpoint and gets suspended. We then inspect the fifth pointer location and dereference it. Its dereferenced value should be NULL and initialized properly only if the function returns successfully. On marker 3, we let the debugger run the CoCreateInstance function and return to the caller. We then dereference the output pointer again. Finally, on marker 4, we use the dps command to display the address of the vftable, and then use dps once more to display three pointers at the vftable.
Note
dps is equivalent to dds on 32-bits targets, and to dqs on 64-bits targets.
Editing Memory Contents
To edit the memory contents, use the e command. The general syntax is as follows:
e[b|d|D|f|p|q|w] Address [Values]
Note
If no suffix is specified after the e command, the last suffix that was previously used with e will be used. For instance, if ed were used the first time, then the next time e alone is used, it will act as if it were ed.
Use the b, w, d, or q format specifiers to set byte, word, dword, or qword values, respectively, at the specified memory address:
0:000> eb 0x1b0000 11 22 33 44; db 0x1b0000 L 4
001b0000 11 22 33 44
0:000> ed 0x1b0000 0xdeadbeef 0xdeadc0de; dd 0x1b0000 L 2
001b0000 deadbeef deadc0de
It is possible to use single quotes to enter character values when using either of the w/d or q formats. The DbgEng will respect the “endianness” of the target:
0:000> ed 1b0000 'TAG1'
0:000> db 1b0000 'TAG1' L 4
001b0000 31 47 41 54 1GAT
Apart from editing the memory with integer values, the e command has other format specifiers that allow you to enter other types:
· e[f|D] (address values)—Sets a single or double-precision floating-pointer number:
· 0:000> eD @$t0 1999.99
· 0:000> dD @$t0 L 1
000000c9‘e2450000 1999.99
· ep (address values)—Sets pointer-sized values. This command knows how big a pointer is based on the currently debugged target.
· e[a|u] (address string)—Enters an ASCII or Unicode string at the given address. The entered string will not be zero terminated:
· 0:000> f 0x1b0000 L0x40 0x21 0x22 0x23; db 0x1b0000 L0x20;
· Filled 0x40 bytes
· 001b0000 21 22 23 21 22 23 21 22-23 21 22 23 21 22 23 21 !"#!"#!"#!"#!"#!
· 001b0010 22 23 21 22 23 21 22 23-21 22 23 21 22 23 21 22 "#!"#!"#!"#!"#!"
· 0:000> ea 0x1b0000 "Hello world"; db 0x1b0000 L0x20
· 001b0000 48 65 6c 6c 6f 20 77 6f-72 6c 64 23 21 22 23 21 Hello world#!"#!
001b0010 22 23 21 22 23 21 22 23-21 22 23 21 22 23 21 22 "#!"#!"#!"#!"#!"
· e[za|zu] (address string)—As opposed to e[a|u], this command will enter the zero character termination at the end of the string.
To fill a memory area with a given pattern, use the f command:
f Address L Count Values
For example:
0:000> f @eax L0x40 0x21 0x22 0x23; db @eax L0x20
Filled 0x40 bytes
001b0000 21 22 23 21 22 23 21 22-23 21 22 23 21 22 23 21 !"#!"#!"#!"#!"#!
001b0010 22 23 21 22 23 21 22 23-21 22 23 21 22 23 21 22 "#!"#!"#!"#!"#!"
Miscellaneous Memory Commands
Following is another set of memory-related commands that come in handy:
· s [-[flags]type] Range Pattern—Searches the memory for a given pattern
· c Range_For_Address1 Address2—Compares two memory regions
· .dvalloc [Options] Size—Allocates memory in the process space of the debugger:
· 0:000> .dvalloc 0x2000
Allocated 2000 bytes starting at 001c0000
· .dvfree [Options] BaseAddress Size—Frees the memory previously allocated by .dvalloc
· .readmem FileName Range—Reads a file from disk to the debuggee's memory:
· kd> .readmem file.bin @eax L3
Reading 3 bytes.
· .writemem FileName Range—Writes the debuggee's memory to a file on disk
Symbols
The following commands enable you to inspect symbols and structured data:
· dt [type] [address]—A very handy command to display the type of an item at the given address:
· $$ Display the type of the structure UNICODE_STRING
· 0:000> dt UNICODE_STRING
· ole32!UNICODE_STRING
· +0x000 Length : Uint2B
· +0x002 MaximumLength : Uint2B
· +0x004 Buffer : Ptr32 Wchar
· $$ Display type information and values in a type at a given address
· 0:000> dt _UNICODE_STRING 0x18fef4
· ntdll!_UNICODE_STRING
· "KERNEL32.DLL"
· +0x000 Length : 0x18
· +0x002 MaximumLength : 0x1a
+0x004 Buffer : 0x00590168 "KERNEL32.DLL"
· dv [flags] [pattern]—Displays information about local variables
· x [options] [module_pattern]![symbol_pattern]—Displays symbol(s) in a given module or modules
· !dh [options] Address—Dumps PE image headers
· !drvobj DriverObjectPtr [Flags]—Displays information about a DRIVER_OBJECT object.
· !heap—Displays heap information
· !pool—Displays kernel pool information
Breakpoints
On the x86/x64 architecture, the DbgEng supports two types of breakpoints:
· Software breakpoints—These breakpoints are created by saving the byte at the breakpoint address then replacing it with a 0xCC byte (on x64/x64). The debugger implements the underlying logic to handle the breakpoint magic.
· Hardware breakpoints—Also known as processor or data breakpoints, these breakpoints may or may not be present depending on the hardware running the target. They are limited in count and can be set up to trigger on read, write, or execute.
The simple syntax to create a software breakpoint is as follows:
bp Address ["CommandString"]
bu Address "CommandString"
bm SymbolPattern ["CommandString"]
Note
Please refer to the debugger documentation for the full syntax of the b* commands.
To list breakpoints, simply use the bl command:
0:001> bl
0 e 771175c9 0001 (0001) 0:**** ntdll!RtlInitString+0x9
1 e 77117668 0001 (0001) 0:**** ntdll!RtlInitUnicodeString+0x38
2 e 771176be 0001 (0001) 0:**** ntdll!_sin_default+0x26
3 e 7711777e 0001 (0001) 0:**** ntdll!sqrt+0x2a
4 e 771177c0 0001 (0001) 0:**** ntdll!sqrt+0x6a
To disable breakpoints, use the bd command. Similarly, use the be command to enable breakpoints, and the bc command to clear (delete) breakpoints.
You can specify a series of breakpoint IDs to enable, disable, or clear them:
be 0 2 4
Or a range:
be 1-3
Or simply all breakpoints:
be *
Unresolved Breakpoints
The bu command creates a breakpoint whose address is still unknown/unresolved or whose address may change if it belongs to a module (that is ASLR aware) that is loaded and unloaded many times at different base addresses.
The debugger will try to reevaluate the breakpoint address when a new module is loaded and if the symbol is matched the breakpoint becomes active. When the module is unloaded, the breakpoint becomes inactive until the symbol can be resolved again.
In short, the address of the breakpoint is not fixed and will automatically be adjusted by the debugger.
Software Breakpoints
Software breakpoints can be created using the bp command. If the address can be resolved when the breakpoint is created, then the breakpoint becomes active. If the breakpoint cannot be resolved, the breakpoint will act like an unresolved breakpoint and become active once the address can be resolved. If the module at the breakpoint address is unloaded and then loaded again, the previously resolved breakpoint address will remain fixed (as opposed to the unresolved breakpoints).
Hardware Breakpoints
Hardware breakpoints can be created using the ba command. These breakpoints are assisted by the hardware. To create a hardware breakpoint you need to specify the address, access type, and size. The access type designates whether to break on read (read/write), write (write only), or execute. The size designates how big the item you are breaking on access for is. For instance, to break on “word access,” specify the size 2.
Note
There is an architectural limit on the number of hardware breakpoints you can have.
Conditional Breakpoints
Conditional breakpoints can be any type of breakpoint just described. In fact, each breakpoint can be associated with a command. When a conditional command is associated with a breakpoint, the breakpoint can be considered a conditional breakpoint.
The following example creates a conditional breakpoint such that when eax has the value of 5, the breakpoint will suspend execution; otherwise, the breakpoint will continue resuming execution:
0:000> uf kernelbase!GetLastError
KERNELBASE!GetLastError:
7661d0d6 64a118000000 mov eax,dword ptr fs:[00000018h]
7661d0dc 8b4034 mov eax,dword ptr [eax+34h]
7661d0df c3 ret
0:000> bp 7661d0df ".if @eax!=5 { gc; }"
0:000> bl
0 e 7661d0df 0001 (0001) 0:*** KERNELBASE!GetLastError+0x9 ".if @eax!=5 {gc;}"
It is possible to associate a more elaborate condition with a breakpoint. This is covered in the section “Scripting with the Debugging Tools,” later in this chapter.
Inspecting Processes and Modules
The DbgEng enables you to inspect running processes, loaded/unloaded modules, or loaded kernel mode drivers.
To get the list of loaded and unloaded modules, use lm:
0:001> lm n
start end module name
00400000 00405000 image00400000
5ca40000 5cb44000 MFC42
733a0000 733b9000 dwmapi
73890000 73928000 apphelp
…
Similarly, in kernel mode debugging, the lm command will display the list of loaded device drivers:
kd> lm n
start end module name
804d7000 806cd280 nt ntkrnlpa.exe
806ce000 806ee380 hal halaacpi.dll
b205e000 b2081000 Fastfat Fastfat.SYS
b2121000 b2161380 HTTP HTTP.sys
b2d2b000 b2d4cd00 afd afd.sys
b2d4d000 b2d74c00 netbt netbt.sys
b2d75000 b2dcca80 tcpip tcpip.sys
bf800000 bf9c0380 win32k win32k.sys
f83e6000 f8472480 Ntfs Ntfs.sys
f86ca000 f86d6c80 VolSnap VolSnap.sys
f8aaa000 f8aad000 BOOTVID BOOTVID.dll
…
Note
The n option was passed to minimize the default output of the lm command.
To view module information (version, size, base, etc.), use the v switch for verbose mode and m to specify a module name to match:
kd> lm v m *volsnap*
start end module name
f86ca000 f86d6c80 VolSnap
Loaded symbol image file: VolSnap.sys
Image path: VolSnap.sys
Image name: VolSnap.sys
Timestamp: Tue Aug 03 23:00:14 2004 (41107B6E)
CheckSum: 00017B61
ImageSize: 0000CC80
Translations: 0000.04b0 0000.04e4 0409.04b0 0409.04e4
When in kernel mode, you have a full view of all running processes. Use the !process extension command with the 0 0 flags to list all running processes:
kd> !process 0 0
**** NT ACTIVE PROCESS DUMP ****
PROCESS 823c8830 SessionId: none Cid: 0004 Peb: 00000000 ParentCid: 0000
DirBase: 00334000 ObjectTable: e1000c90 HandleCount: 246.
Image: System
PROCESS 820ed020 SessionId: none Cid: 017c Peb: 7ffdd000 ParentCid: 0004
DirBase: 07f40020 ObjectTable: e14f9c60 HandleCount: 21.
Image: smss.exe
PROCESS 81e98740 SessionId: 0 Cid: 0278 Peb: 7ffde000 ParentCid: 017c
DirBase: 07f40060 ObjectTable: e1010ac8 HandleCount: 517.
Image: winlogon.exe
PROCESS 81e865c0 SessionId: 0 Cid: 02a4 Peb: 7ffde000 ParentCid: 0278
DirBase: 07f40080 ObjectTable: e1a7a450 HandleCount: 265.
Image: services.exe
PROCESS 821139f0 SessionId: 0 Cid: 0354 Peb: 7ffd9000 ParentCid: 02a4
DirBase: 07f400e0 ObjectTable: e1a78ce0 HandleCount: 201.
Image: svchost.exe
PROCESS 81e68558 SessionId: 0 Cid: 0678 Peb: 7ffdd000 ParentCid: 0658
DirBase: 07f401e0 ObjectTable: e177aa70 HandleCount: 336.
Image: explorer.exe
Note
This is equivalent to using the !for_each_process extension command without any parameters.
It is possible to set breakpoints in user-mode processes using the kernel debugger. First you need to switch to the correct process context, and for that you need the EPROCESS value:
kd> !process 0 0 explorer.exe
PROCESS 81e68558 SessionId: 0 Cid: 0678 Peb: 7ffdd000 ParentCid: 0658
DirBase: 07f401e0 ObjectTable: e177aa70 HandleCount: 336.
Image: explorer.exe
Then use the .process /r /p EPROCESS command to switch to the context of the desired process:
kd> .process /r /p 81e68558
Implicit process is now 81e68558
.cache forcedecodeuser done
Loading User Symbols.........
At this point, after the context switch, use lm to not only list the loaded kernel drivers but also the user-mode modules.
The next example sets a breakpoint at kernel32!CreateFileW for that EPROCESS:
(1)
kd> bp /p 81e68558 kernel32!CreateFileW
(2)
kd> bl
0 e 7c810976 0001 (0001) kernel32!CreateFileW
Match process data 81e68558
(3)
kd> g
Breakpoint 0 hit
kernel32!CreateFileW:
001b:7c810976 8bff mov edi,edi
(4)
kd> .printf "%mu\n", poi(@esp+4);
C:\Temp\desktop.ini
In marker 1, we set an EPROCESS filter with the bp /p EPROCESS command so that only the explore.exe process triggers the breakpoint. Marker 2 lists the breakpoints. Note that it will only match for a certain EPROCESS. At marker 3 we resume execution and wait until the breakpoint triggers. At marker 4, we display the filename that was accessed. Marker 4 will become much clearer after you read the “Language” section later in this chapter.
Now suppose you want to display all processes that called the CreateFileW API and display which filename was referenced:
kd> bp kernel32!CreateFileW "!process @$proc 0;.printf "%mu\n",poi(@esp+4);gc;"
This will break whenever any user-mode process hits the breakpoint, and then the breakpoint command will invoke !process with the current EPROCESS (set in the pre-defined pseudo-register $proc) to display the current process context information, display the filename, and finally resume execution with gc.
Note
!process @$proc 0 is equivalent to !process -1 0.
When execution is resumed, you see this redacted output:
kd> g
PROCESS 82067020 SessionId: 0 Cid: 0138 Peb: 7ffdf000 ParentCid: 02a4
DirBase: 07f40260 ObjectTable: e1b66ef8 HandleCount: 251.
Image: vmtoolsd.exe
C:\WINDOWS\SoftwareDistribution\DataStore\DataStore.edb
PROCESS 81dc0da0 SessionId: 0 Cid: 0204 Peb: 7ffd5000 ParentCid: 03fc
DirBase: 07f40280 ObjectTable: e1ba8ea8 HandleCount: 177.
Image: wuauclt.exe
PROCESS 81e68558 SessionId: 0 Cid: 0678 Peb: 7ffdd000 ParentCid: 0658
DirBase: 07f401e0 ObjectTable: e177aa70 HandleCount: 362.
Image: explorer.exe
C:\WINDOWS\media\Windows XP Start.wav
PROCESS 81e68558 SessionId: 0 Cid: 0678 Peb: 7ffdd000 ParentCid: 0658
DirBase: 07f401e0 ObjectTable: e177aa70 HandleCount: 351.
Image: explorer.exe
C:\WINDOWS\WinSxS\Policies\x86_Policy.6.0.Microsoft.Windows.Common-Controls
_6595b64144ccf1df_x-ww_5ddad775\6.0.2600.2180.Policy
PROCESS 820f0020 SessionId: 0 Cid: 0260 Peb: 7ffdf000 ParentCid: 017c
DirBase: 07f40040 ObjectTable: e1503128 HandleCount: 343.
Image: csrss.exe
Miscellaneous Commands
This section introduces several miscellaneous debugger commands, the .printf command, along with the format specifiers it supports, and describes how to use the Debugger Markup Language (DML) with .printf or other commands that support DML.
The .printf Command
The .printf command is one of the most useful commands to help display information from scripts or commands. As in the C language, this command takes format specifiers. Following are a few important ones:
· %p (pointer value)—Displays a pointer value.
· %d, %x, %u (number value)—Displays integer values. The syntax is very similar to C's format specifiers.
· %ma / %mu (pointer value)—Displays the ASCII/Unicode string at the specified pointer.
· %msa / %msu (pointer value)—Displays the ANSI_STRING / UNICODE_STRING value at the specified pointer.
· %y (pointer value)—Displays the symbol name (and displacement if any) at the specified pointer.
Here is a simple example:
0:000> .printf "t0=%d t1=%d eax=%x ebx=%d\n", @$t0, @$t1, @eax, @ebx
t0=0 t1=0 eax=5 ebx=8323228
There is no %s specifier to expand string arguments. The following example expands the value of the user-defined alias by embedding it in the format parameter:
0:000> aS STR "TheValue"
0:000> al
Alias Value
------- -------
STR TheValue
0:000> .printf "This value of string is ${STR}\n"
The .printf command can make use of the Debugger Markup Language (DML). To use DML with .printf, specify the /D switch.
Note
DML works only in WinDbg.
To display with strings with colors, use the col markup:
0:000> .printf /D "<col fg=\"emphfg\">Hello</col> world\n"
Hello world
It is also possible to use the u, i, and b tags for underline, italic, and bold, respectively:
0:000> .printf /D "<u>underline</u><b>bold</b><i>italics</i>\n";
underline bold italics
A very useful markup is the link because it makes the output clickable and associated with a command:
0:000> .printf /D "Click <linkcmd=\"u 0x401000\">here</link>\n"
Click here
Some debugger commands also take the /D switch. For example, lm /D will list the modules, and each module is clickable. When a module is clicked, the command lmvm modulename will be issued.
Note
Use the .prefer_dml 1 command to toggle a global setting that tells commands that support DML to prefer DML when applicable.
For more information, check dml.doc in the debugging tools distribution.
Other Commands
Before ending our discussion about debugger commands, we list a few more useful commands:
· #—Searches for a disassembly pattern.
· !gle—Returns the last error code.
· .logopen/.logfile/.logappend/.logclose—Commands to manage logging of output from the command window to text files.
· .load—Loads a debugger extension.
· .cls—Clears the debugger's output window. (This command does not work in scripts because it is not part of the DbgEng scripting language.)
· .effmach—Changes or displays the processor mode that the debugger uses. It is useful when debugging WOW64 processes. This command is also similar to the extension command !wow64exts.sw.
Scripting with the Debugging Tools
This section illustrates important scripting features in the DbgEng that are useful for automating reverse engineering and debugging tasks.
Pseudo-Registers
The DbgEng supports pseudo-registers to hold certain values. All of the pseudo-registers start with the $ sign. Prefixing a pseudo-register or a register with the @ sign tells the interpreter that the identifier is not a symbol, thus no exhaustive, sometimes slow, symbol lookup will take place.
Predefined Pseudo-Registers
In this section we introduce some useful predefined pseudo-registers. They can be used in expressions or as parameters to debugger commands or scripts. Please note that some pseudo-registers may or may not be defined, depending on the debugged target.
· $csp—The current call stack pointer. This is useful because you don't have to guess if you should use esp or rsp.
· $ip—The current instruction pointer. Similarly, a dot (.) can be used to denote the current instruction pointer.
· $retreg/$retreg64—The return registers (typically eax, edx:eax, or rax).
· $p—The first value that the last d? command displayed:
· 0:000> dd @$ip L 1
· 012aa5e5 012ec188
· 0:000> ? @$p
· Evaluate expression: 19841416 = 012ec188
· 0:000> dw @$ip+2 L 1
· 012aa5e5 c188
· 0:000> ? @$p
· Evaluate expression: 49544 = 0000c188
· 0:000> db @$ip+2 L 1
· 012aa5e5 88
· 0:000> ? @$p
Evaluate expression: 136 = 00000088
· $ra—The current return address. This is equivalent to poi(@$csp).
· $exentry—The entry point address of the first executable of the current process. This is very useful when debugging a program from the beginning because DbgEng does not break on the entry point but in the kernel.
· $peb—Process Environment Block. This pseudo-register has the following type: ntdll!_PEB *.
· $proc—The EPROCESS* address of the current process in kernel mode. In user-mode it equates to $peb.
· $teb—Thread Environment Block of the current thread. It has the following type: ntdll!_TEB*.
· $thread—ETHREAD* in kernel mode. In user-mode it is same as $teb.
· $tpid—The current process id.
· $tid—The current thread id.
· $ptrsize—The pointer size from the point of view of the debuggee. If your host OS is 64-bit and you are debugging a 32-bit process, then $ptrsize=4. In kernel mode it returns the pointer size of the target machine.
· $pagesize—The number of bytes per memory page (usually 4,096).
· $dbgtime—The current time (based on the computer running the debugger).
· $bpNUM—The address associated with the breakpoint number:
· 0:000> bl
· 0 e 012aa597 0001 (0001) 0:**** calc!WinMainCRTStartup+0xf
· 1 e 012aa5ab 0001 (0001) 0:**** calc!WinMainCRTStartup+0x23
· 0:000> ? @$bp0
· Evaluate expression: 19572119 = 012aa597
· 0:000> ? @$bp1
Evaluate expression: 19572139 = 012aa5ab
· $exp—The value of the last expression evaluated:
· 0:000> r $t0 = 1 + 4
· 0:000> ? @$exp
Evaluate expression: 5 = 00000005
or
0:000> ? Esp
Evaluate expression: 1637096 = 0018fae8
0:000> ? @$exp
Evaluate expression: 1637096 = 0018fae8
The first example assigns a value into a pseudo-register after it was evaluated. You can see how $exp returns the last value. The same is true for the second example, which evaluates the value of the esp register.
User-Defined Pseudo-Registers
In addition to the pre-defined pseudo-registers, DbgEng enables users to define their own set of pseudo-registers. DbgEng provides 20 user-defined pseudo-registers (UDPRs) for use and to store integer values. They are $t0 to $t19.
The r command is used to assign values to those registers:
0:000> r $t0 = 1234
0:000> ? @$t0
Evaluate expression: 4660 = 00001234
Because numbers can be pointers, it is possible to store typed pointers into those pseudo-registers using the r? command:
(1)
0:000> ? poi(@$ip)
Evaluate expression: 409491562 = 1868586a
(2)
0:000> r? $t0 = @@c++((unsigned long *)@$ip)
(3)
0:000> ? @@c++(*@$t0)
Evaluate expression: 409491562 = 1868586a
On marker 1, we dereference and evaluate the value pointed to by $ip. On marker 2, we use r? to assign a C++ expression to $t0; the cast operator is used to return a typed pointer (of type unsigned long *) into $t0. Finally, on marker 3 we use the C++ dereferencing operator to dereference $t0. (This would have not been possible without having a previously typed $t0 or without preceding the expression by a cast.)
Here's another example:
0:000> r? $t0 = @@c++(@$peb->ProcessParameters->ImagePathName)
0:000> ? $t0
Evaluate expression: 0 = 00000000
0:000> ?? @$t0
struct _UNICODE_STRING
"c:\windows\syswow64\calc.exe"
+0x000 Length : 0x38
+0x002 MaximumLength : 0x3a
+0x004 Buffer : 0x0098189e "c:\windows\syswow64\calc.exe"
Note that when you evaluate $t0 with ?, you get zero. When you use the C++ evaluation syntax ??, however, you get the actual typed value.
Symbols, all kinds of pseudo-registers, or aliases can also be used in expressions.
Aliases
An alias is a mechanism that enables you to create equivalence between a value and a symbolic name. By evaluating the alias you get the value that was assigned to the alias.
The DbgEng supports three kinds of aliases:
· User-named aliases—As the name implies, these aliases are chosen by the user.
· Fixed-name aliases—There are ten of them, named $u0 .. $u9.
· Automatic aliases—These are pre-defined aliases that expand to certain values.
User-Named Aliases
This section describes how to create and manage user-defined aliases and explains how they are interpreted.
Creating and Managing User-Named Aliases
The following commands are used to create user-named aliases:
· as AliasName Alias_Equivalence—Creates a line equivalence for the given alias:
as MyAlias lm;vertarget
This will create an alias for two commands: lm and then vertarget. You can execute both commands by invoking MyAlias.
· aS AliasName Alias_Equivalence—Creates a phrase equivalence for the given alias. That means a semicolon will terminate the alias equivalence (unless the equivalence was enclosed in quotes) and start a new command.
· aS MyAlias lm;vertarget
aS MyAlias "lm;vertarget"
The first line will execute two things: create an alias with value lm and then execute the vertarget command. The second line (because the equivalence is enclosed in quotes) defines the alias with value lm;vertarget.
Note
User-defined alias names cannot contain the space character.
Other alias commands include the following:
· al—Lists already defined aliases.
· ad [/q] AliasName|*—Deletes an alias by name or all aliases. The /q switch will not show error messages if the alias name was not found.
The aS command can used to create aliases that equate to environment variables values, expressions, file contents, command output, or even string contents from the debuggee's memory:
· aS /f AliasName FileName—Assigns the contents of a file to the alias:
· 0:000> aS /f AliasName c:\temp\lines.txt
· 0:000> al
· Alias Value
· ------- -------
· AliasName line1
· line2
· line3
· line4
line5
· aS /x AliasName Expression64—Assigns the 64-bit value of an expression to the alias. This is useful in many ways, especially when assigning the value of an automatic alias to a user-named alias:
· 0:000> r $t0 = 0x123
· 0:000> as /x AliasName @$t0
· 0:000> al
· Alias Value
· ------- -------
· AliasName 0x123
· 0:000> as IncorrectAlias @$t0
· 0:000> al
· Alias Value
· ------- -------
· AliasName 0x123
IncorrectAlias @$t0
Note that the first as /x usage correctly assigned the value 0x123 to the alias, whereas the second as assignment took the literal value of @$t0 (because of the missing /x switch).
· as /e AliasName EnvVarName—Sets the AliasName alias to the value of the environment variable called EnvVarName:
· 0:000> as /e CmdPath COMSPEC
· 0:000> al
· Alias Value
· ------- -------
CmdPath C:\Windows\system32\cmd.exe
· as /ma AliasName Address—Sets the content of the null-terminated ASCII string pointed to by the address in the alias:
· 0:000> db 0x40600C
· 0040600c 54 6f 6f 6c 62 61 72 57-69 6e 64 6f 77 33 32 00 ToolbarWindow32.
· 0:000> as /ma Str1 0x40600C
· 0:000> al
· Alias Value
· ------- -------
Str1 ToolbarWindow32
· as /mu AliasName Address—Sets the content of the null-terminated Unicode string pointed to by the address in the alias
· as /ms[a|u] AliasName Address—Sets the contents of an ASCII_STRING (structure defined in the DDK) or UNICODE_STRING in the alias:
· (1)
· 0:000> dt _UNICODE_STRING
· ntdll!_UNICODuE_STRING
· +0x000 Length : Uint2B
· +0x002 MaximumLength : Uint2B
· +0x004 Buffer : Ptr32 Uint2B
· (2)
· 0:000> ?? sizeof(_UNICODE_STRING)
· unsigned int 8
· (3)
· 0:000> ?? @@c++(@$peb->ProcessParameters->DllPath)
· struct _UNICODE_STRING
· "C:\Windows\system32\NV"
· +0x000 Length : 0x2c
· +0x002 MaximumLength : 0x2e
· +0x004 Buffer : 0x001f1880 "C:\Windows\system32\NV"
· (4)
· 0:000> dd @@c++(&(@$peb->ProcessParameters->DllPath)) L2
· 001f1408 002e002c 001f1880
· (5)
· 0:000> db 001f1880 L2e
· 001f1880 43 00 3a 00 5c 00 57 00-69 00 6e 00 64 00 6f 00 C.:.\.W.i.n.d.o.
· 001f1890 77 00 73 00 5c 00 73 00-79 00 73 00 74 00 65 00 w.s.\.s.y.s.t.e.
· 001f18a0 6d 00 33 00 32 00 5c 00-4e 00 56 00 00 00 m.3.2.\.N.V…
· (6)
· 0:000> as /msu DllPath @@c++(&(@$peb->ProcessParameters->DllPath))
· 0:000> al
· Alias Value
· ------- -------
DllPath C:\Windows\system32\NV
At marker 1, we display the fields of the _UNICODE_STRING structure, and at marker 2 we display the structure's size using the C++ evaluator. Similarly, marker 3 uses the C++ typed evaluation to dump the value of DllPath field. Marker 4 uses the & operator to dump the _UNICODE_STRING field contents, and marker 5 dumps the Buffer address. Finally, marker 6 uses the as command to create an alias with its contents read from a _UNICODE_STRING pointer.
Interpreting User-Named Aliases
User-named aliases can be interpreted using the basic syntax ${AliasName} or by simply typing the alias name. The former should be used when the alias is embedded in a string and not surrounded by space characters:
0:000> aS AliasName "Alias value"
0:000> .printf "The value is >${AliasName}<\n"
The value is >Alias value<
When an alias is not defined, alias evaluation syntax remains unevaluated:
0:000> .printf "The value is >${UnkAliasName}<\n"
The value is >${UnkAliasName}<
The following switches control how the aliases are interpreted:
· ${/d:AliasName}—Evaluates to 1 if the alias is defined, and 0 if the alias is not defined. This switch comes in handy when used in a script to determine whether an alias is defined or not:
· 0:000> .printf ">${/d:AliasName}<\n"
· >1<
· 0:000> .printf ">${/d:UnkAliasName}<\n"
>0<
· ${/f:AliasName}—When this switch is used, an undefined alias will evaluate to an empty string or to the actual value if the alias was defined:
· 0:000> .printf ">${/f:DefinedAliasName}<\n"
· >Alias value<
· 0:000> .printf ">${/f:UndefinedAliasName}<\n"
><
· ${/n:AliasName}—Evaluates to the alias name or remains unevaluated if the alias is not defined:
· 0:000> .printf ">${/n:AliasName}<\n"
· >AliasName<
· 0:000> .printf ">${/n:AliasName2}<\n"
· >${/n:AliasName2}<
· 0:000> .printf ">${/n:UnkAliasName}<\n"
>${/n:UnkAliasName}<
· ${/v:AliasName}—This switch prevents any alias evaluation:
· 0:000> .printf ">${/v:AliasName}<\n"
· >${/v:AliasName}<
· 0:000> .printf ">${/v:UnkAliasName}<\n"
>${/v:UnkAliasName}<
After an alias is defined, it can be used in any subsequent command (as a command or a parameter to a command):
0:000> aS my_printf .printf
0:000> al
Alias Value
------- -------
my_printf .printf
When used as a command:
0:000> ${my_printf} "Hello world\n"
Hello world
0:000> my_printf "Hello world\n"
Hello world
When used as a parameter to a command:
0:000> .printf "The command to display strings is >${my_printf}<\n"
The command to display strings is >.printf
0:000> .printf "The command to display strings is my_printf \n"
The command to display strings is printf
When reassigning values to user-defined aliases, note the following:
· Using the aS command as follows produces an error:
· 0:000> aS MyVar 0n123;.printf "v=%d", ${MyVar}
v=Couldn't resolve error at '${MyVar}'
The reason for this error is because aliases are expanded in new blocks only. This can be remedied with the following:
0:000> aS MyVar 0n123;.block { .printf "v=%d", ${MyVar}; }
v=123
· The /v: switch behaves like the /n: switch when used with aS, as, and ad. The reason we mention this is illustrated in the following example:
· 0:000> aS MyVar 0n123;.block { aS /x MyVar ${MyVar}+1 }
· 0:000> al
· Alias Value
· ------- -------
· 0n123 0x7c
MyVar 0n123
The first command creates the MyVar alias and increments its value by one; however, a new alias named 0n123 is created. That's because the MyVar alias has been replaced by its equivalent instead of being used as an alias name.
What you instead need to do is let the aS command know that MyVar is the alias name, and its value should not be expanded or evaluated. This is where the /v: switch, when used with the as or the aS command, should be used:
0:000> aS MyVar 123;.block { aS /x ${/v:MyVar} ${MyVar}+1 };al
Alias Value
------- -------
MyVar 0x124
Notice that now, when ${/v:MyVar} is used in conjunction with aS, it evaluates to the alias name (like the ${/n:AliasName} would).
Fixed-Name Aliases
As mentioned earlier, there are 10 fixed-name aliases named $u0 through $u9. While the fixed-name aliases look like registers or pseudo-registers, they are not. To assign values to them, use the r command followed by $. and the alias name, like this:
(1)
0:000> r $.u0 = .printf
(2)
0:000> r $.u1 = 0x123
(3)
0:000> r $.u2 = Hello world
(4)
0:000> $u0 "$u2\n"
Hello world
(5)
0:000> $u0 "$u2, u1=%x", $u1
Hello world, u1=123
Marker 1 aliases $u0 to the .printf command. Note the $. prefix and that the .printf command is purposely not enclosed with quotes in the equivalence. Marker 2 defines $u1 with a numeric value, and marker 3 defines $u2 with a string value. Marker 4 uses $u0 as an equivalent to the .printfcommand and prints $u2, which is enclosed in quotes and resolves to "Hello world." Finally, marker 5 prints the value $u1 in a similar fashion to marker 4.
Note
Always use $. when defining the alias; however, when using the alias you do not need to use $. or even the @ sign as you do for pseudo-registers or aliases.
Fixed-name alias replacement has a higher precedence than user-named aliases.
Automatic Aliases
The DbgEng defines a few aliases when the debugging session starts. The automatic aliases are similar to the pre-defined pseudo-registers except that they can also be used with the ${} syntax (like user-named aliases).
The following registers are defined:
· $ntnsym
· $ntwsym
· $ntsym
· $CurrentDumpFile
· $CurrentDumpPath
· $CurrentDumpArchiveFile
· $CurrentDumpArchivePath
To illustrate this, the following invokes the cdb command-line debugger with the -z switch to open a crash dump file, and uses -cf script.wds to execute a series of commands from a text file:
c:\Tools\dbg>cdb -cf av.wds -z m:\xp_kmem.dmp
The contents of the script file is as follows:
.printf "Script started\n"
.logopen @"${$CurrentDumpFile}.log"
!analyze -v
.logclose
.printf "Script finished, quitting\n"
q
When the debugger starts, it will interpret each line in av.wds:
1. Print a startup message.
2. Open a log file that has the name of the current crash dump file with .log appended to it. Note how you expand to automatic alias with the ${} syntax.
3. Issue the !analyze -v command.
4. Close the log file, print a quit message, and exit the debugger with the q command.
Note
The @ sign is used to define a literal (or raw) string. See the upcoming “Characters and Strings” section.
Language
In this section, we discuss the scripting language, tokens, and commands.
Comments
Use the $$ command to specify comments. For instance:
$$ This is a comment
$$ This is another comment
To use more than one comment on a line with multiple statements, use the semicolon character to terminate the comment:
r eax = 0; $$ clear EAX ; r ebx = ebx + 1; $$ increment EBX;
The asterisk (*) can also be used to create comments; however, the entire line after the asterisk will be ignored even if a semicolon delimiter is used:
r eax = 0; * clear EAX ; r ebx = ebx + 1;
The preceding command will just clear EAX; it won't increment EBX by one.
There is a slight difference between the $$ comment specifier and the .echo command. The .echo command displays the line instead of just ignoring it.
Characters and Strings
Characters are specified when enclosed in single quotes:
0:000> @dvalloc 1
0:000> eb @$t0 'a' 'b' 'c' 'd' 'f' 'g'
0:000> db @$t0 L 6
02250000 61 62 63 64 66 67
Strings are specified with double quotes:
0:000> ea @$t0 "Practical reverse engineering";
0:000> db @$t0 L20
02250000 50 72 61 63 74 69 63 61-6c 20 72 65 76 65 72 73 Practical revers
02250010 65 20 65 6e 67 69 6e 65-65 72 69 6e 67 00 00 00 e engineering…
As in C, the string may contain escape sequences; therefore, you need to escape the sequence in order to get the correct result:
(1)
0:000> .printf "c:\\tools\\dbg\\windbg.exe\n"
c:\tools\dbg\windbg.exe
(2)
0:000> .printf "a\tb\tc\n1\t2\t3\n"
a b c
1 2 3
The first command escaped the backslash with the escape character. The second example uses the horizontal tab escape sequence (\t).
The DbgEng allows the use of raw strings; such strings will be interpreted literally without taking into consideration the escape sequence. To specify a literal string, precede the string with the at sign (@):
(1)
0:000> .printf @"c:\tools\dbg\windbg.exe\n";.printf "\n";
c:\tools\dbg\windbg.exe\n
(2)
0:000> .printf @"a\tb\tc\n1\t2\t3\n"
a\tb\tc\n1\t2\t3\n
Notice how the escape sequences remained as specified without being interpreted. Similarly, if you have a user-named alias that was created from memory contents and you want to evaluate it literally, also prefix the ${} with @:
(1)
0:000> aS /mu STR 0x3cba030
0:000> al
Alias Value
------- -------
STR C:\Temp\file.txt
(2)
0:000> .printf "${STR}\n";
C:Tempfile.txt
(3)
0:000> .printf @"${STR}";.printf "\n";
C:\Temp\file.txt
Marker 1 creates a user-named alias from the zero-terminated Unicode string at the specified memory address and displays the list of aliases. Marker 2 prints the alias value. (Notice that the output is not as intended.) At marker 3, after prefixing the string with @, the output is correct.
Blocks
A block can be created via the .block command followed by opening and closing curly braces ({ }):
.block
{
$$ Inside a block …
.block
{
$$ Nested block …
}
}
When a user-named alias is created in a script, its value won't be evaluated/interpreted as intended unless a new block is created:
aS MyAlias (@eax + @edx)
.block
{
$$ Inside a block …
.printf "The value of my alias is %X\n", ${MyAlias}
}
Conditional Statements
The .if, .elsif, and .else command tokens are used to write conditional statements.
The usage of .if and .elsif is similar to other languages where they take a condition. The condition can be any expression that evaluates to zero (treated as false) or a non-zero value (treated as true):
r $t0 = 3;
.if (@$t0==1)
{
.printf "one\n";
}
.elsif @$t0==2
{
.printf "two\n";
}
.elsif (@$t0==3)
{
.printf "three\n";
}
.else
{
.printf "unknown\n";
}
Note
The use of parentheses around the condition is optional.
All the built-in repetition structures and conditional statements require the use of the curly braces ({ and }) and thus create a block, which results in the proper evaluation of aliases:
aS MyAlias (@eax + @edx)
.if (1)
{
$$ Inside a block …
.printf "The value of my alias is %X\n", ${MyAlias}
}
You can also compare strings with .if using a few different methods:
$$ By enclosing the strings to be compared in single quotes:
.if '${my_alias}'=='value'
{
.printf "equal\n";
}
.else
{
.printf "not equal!\n";
}
$$ By using the MASM operator scmp (or sicmp):
.if $scmp("${my_alias}", "value")
{
.printf "equal\n";
}
$$ By using the MASM operator spat:
.if $spat("${my_alias}", "value")
{
.printf "equal\n";
}
.else
{
.printf "not equal!\n";
}
The DbgEng also provides the j command, which can be compared to C's ternary operator ( cond ? true-expr: false-expr), except that it runs commands instead of returning expressions:
j Expression [']Command-True['] ; [']Command-False[']
The following is a very simple example with one command being executed in both cases (true or false):
0:000> r $t0 = -1
0:000> j (@$t0 < 0) r $t0 = @$t0-1 ; r $t0 = @$t0+1
0:000> ? $t0
Evaluate expression: -2 = fffffffe
The single quotes are optional in most cases; specify them if more than one command is to be executed:
0:000> r $t0 = 2
0:000> j (@$t0 < 0) 'r $t0 = @$t0-1;.echo Negative value' ;
'r $t0 = @$t0+1;.echo Positive value'
Positive value
0:000> ? $t0
Evaluate expression: 3 = 00000003
It is common to use the j command as part of breakpoint commands to form conditional breakpoints.
The following example suspends the debugger (note the empty single quotes that specify that no command should be executed when the expression evaluates to True) only when the return address matches a certain value:
0:000> bp user32!MessageBoxA "j (@$ra=0x401058) '';'gc;'"
0:000> g
user32!MessageBoxA:
756e22c2 8bff mov edi,edi
0:000> ? $ra
Evaluate expression: 4198488 = 00401058
The next example suspends the debugger whenever the GetLastError function is called and it returns ACCESS_DENIED (value 5):
0:014> bp kernelbase!GetLastError "g @$ra;j @eax==5 '';'gc'"
0:014> g
uxtheme!ThemePreWndProc+0xd8:
00007ff8‘484915e8 33c9 xor ecx,ecx
0:000> !gle
LastErrorValue: (Win32) 0x5 (5) - Access is denied.
LastStatusValue: (NTSTATUS) 0xc0000034 - Object Name not found.
This is not the optimal way to achieve that. The public symbols of NTDLL, when loaded, expose a symbol called g_dwLastErrorToBreakOn. Editing this value in memory and passing the desired error value to break on is the better approach:
0:000> ep ntdll!g_dwLastErrorToBreakOn 5
0:000> g
(2a0.2228): Break instruction exception - code 80000003 (first chance)
ntdll!RtlSetLastWin32Error+0x21:
00007ff8'4c444df1 cc int 3
0:000> !gle
LastErrorValue: (Win32) 0 (0) - The operation completed successfully.
LastStatusValue: (NTSTATUS) 0xc0000034 - Object Name not found.
Script Errors
If an error is encountered when a debugger script is executing, then the entire script will be aborted after the error message is displayed. Consider a script file with the following contents:
.printf "Script started\n";
invalid command;
.printf "Script ending\n";
When this script is executed, it will produce an error:
Script started
Script started
^ Syntax error in '.printf "Script started
'
0:000>
To prevent the script from aborting, you can use the .catch command token:
.printf "Script started\n";
.catch
{
invalid command;
.printf "!! will not be reached !!\n";
}
.printf "After catch\n";
The error will cause the script to break out of the .catch block and display the error, but continue executing the script after that block:
Script started
^ Syntax error in '; invalid command; '
After catch
When inside a .catch block, one can explicitly exit it with the .leave command token.
Interestingly, .leave can be used to emulate a “break,” like in a loop:
r $t0=0;
.catch
{
.if (by(@$ip) == 0xb9)
{
.printf "found MOV ECX, …\n";
r $t0 = dwo(@$ip+1);
.leave;
}
.elsif (by(@$ip) == 0xb8)
{
.printf "found MOV EAX, …\n";
r $t0 = dwo(@$ip+1);
.leave;
}
$$ do some other analysis …
.printf "Could not find the right opcode\n";
$$ do more stuff…
}
$$ Reached after the catch block is over, an error has
$$ occurred or a .leave is used
Repetition Structures
The DbgEng supports four repetition structures, which are described in the following sections.
The .break command can be used to break out of a loop. Similarly, the .continue command can be used to go to the next iteration within the encapsulating repetition structure.
Note
In the case of an erroneous repetition condition (the script or command executes endlessly), you can interrupt it by pressing Ctrl+C in any of the console debuggers (kd, cdb, ntsd) or Ctrl+PauseBreak in WinDbg.
The for Loop
The .for command token has the following syntax:
.for (InitialCommand ; Condition ; IncrementCommands) { Commands }
The following example script dumps the interrupt descriptor table (IDT) handlers using a for loop. First, we run the dt command to inspect the structure of an IDTENTRY on a 32-bit system in a kernel-mode debug session:
kd> dt _KIDTENTRY
ntdll!_KIDTENTRY
+0x000 Offset : Uint2B
+0x002 Selector : Uint2B
+0x004 Access : Uint2B
+0x006 ExtendedOffset : Uint2B
The script is as follows:
.for (r $t0=0; 1;r $t0=@$t0+1)
{
$$ Take a typed pointer to the next IDT entry
r? $t1 = @@c++(((_KIDTENTRY *)@idtr) + @$t0);
$$ Last entry?
.if (@@c++(@$t1->Selector) == 0)
{
$$ Break out
.break;
}
$$ Resolve the full address
r $t2 = @@c++((long)(((unsigned long)@$t1->ExtendedOffset ![]() 0x10) +
0x10) +
(unsigned long)@$t1->Offset));
.printf "IDT[%02x] @ %p\n", @$t0, @$t2
$$ .printf "IDT[%02x] @ %p\n", @$t2
}
Some important aspects of the script to note:
· The for loop's condition is set to 1 so it loops indefinitely. We will break out conditionally from inside the loop's body with the .break command.
· The r? is used to assign a typed value to $t1.
· The pseudo-register $t1 is a pointer to _KIDTENTRY. When $t0 is added to it, this will advance to the appropriate memory location (taking into consideration the size of _KIDTENTRY).
· You determine the end of the IDT entries by examining the Selector field and breaking out of the loop accordingly.
· The full base address of the IDT handler is computed by combining the ExtendedOffset and Offset fields.
· You cast $t2 to long so that it is properly sign extended (as pseudo-registers are always 64-bit values).
· Display the result.
If you find using pseudo-registers like $t0 as a for loop counter a bit unusual and instead want to use a name like i, j, or k, for example, then create a user-named alias called i that is equivalent to @$t0:
aS i @$t0;
.block
{
.for (r ${i} = 1; ${i} <= 5; r ${i} = ${i}+1)
{
.printf "i=%d\n", ${i}
}
}
The while Loop
The while loop is a simplified form of a for loop that has neither an initial command nor an increment command:
.while (Condition) { Commands }
Depending on the condition expression, the while loop's body may not execute at all. Here's a sample script that traces 200 instructions in a newly started process:
$$ Go to entry point (skip NT process initialization)
.printf "Going to entry point\n";
g @$exentry;
.printf "Started tracing…\n";
$$ Reset the counter
r $t0 = 0;
.while (@$t0 <= 0n200)
{
.printf "ip -> %p; ntrace=%d\n", @$ip, @$t0;
r $t0 = @$t0 + 1;
tr;
}
.printf "Condition satisfied\n";
u @$ip L1;
Note that this is not the ideal way to do conditional tracing. The t and j commands used together are a better approach.
The do-while Loop
The do-while loop has the following syntax:
.do { Commands } (Condition)
Unlike the while loop, the do loop's body will execute at least once before the condition is evaluated:
.do
{
.if (by(@$ip) == 0xb8)
{
.printf "Found MOV EAX, …\n";
.break;
}
$$ do other things
$$ ....
$$ ....
} (0);
.printf "Continue doing something else…\n";
The DbgEng also provides the z command to execute commands while a certain condition holds true:
Command [ Command ; [Command …;] ]; z( Expression )
In the following example, $t0 is used as a counter to trace five (5) branching instructions:
0:000> r $t0=1
0:000> th;r $t0=@$t0 + 1; z (@$t0 <= 5);
redo [1] th;r $t0=@$t0 + 1; z (@$t0 <= 5);
redo [1] th;r $t0=@$t0 + 1; z (@$t0 <= 5);
redo [1] th;r $t0=@$t0 + 1; z (@$t0 <= 5);
redo [1] th;r $t0=@$t0 + 1; z (@$t0 <= 5);
0:000> ? @$t0
Evaluate expression: 6 = 00000006
As in the preceding example, one or more commands can be specified to the left of the z command.
The foreach Loop
The foreach loop is very useful and can be used to enumerate tokens read from a file, from the output of a command or from a user-provided string.
Two common options can be passed (separately or together) as first parameters to the .foreach command token:
· /pS ExpressionValue—Initial number of tokens to skip when the loop starts. This is equivalent to initializing the counter to a non-zero value in a for loop.
· /ps ExpressionValue—The number of tokens to skip after each iteration. This is equivalent to the for loop increment part where the programmer can specify the counter increment value.
Tokenizing from a String
The general syntax is as follows:
.foreach [Options] /s (TokenVariableName "InString" ) { OutCommands }
For example, assume you are looking for *CreateFile*-related symbols in the following three modules: ntdll, kernelbase, and kernel32. This is one way to do it:
.foreach /s (token "ntdll kernel32 kernelbase") { x ${token}!*CreateFile*; }
In the next example, suppose you want to tokenize the contents of a given ASCII string in memory:
aS /mu STR 0x8905e8
r $t0 = 0;
.block
{
.foreach /s (token "${STR}")
{
.printf "token_i=%d, token_val=${token}\n", @$t0;
r $t0 = @$t0 + 1;
}
}
The ${} is used to evaluate the token variable's value. This is only necessary only if the token is not surrounded by the space character at the time of evaluation. The .block was used in order to cause the alias STR to be evaluated.
Tokenizing from the Output of a Command
The general syntax is as follows:
.foreach [Options] ( Variable { InCommands } ) { OutCommands }
This use of .foreach is the most common because it enables extracting information from a command's output and using it in your script.
For the sake of demonstration, imagine a script that needs to allocate memory in the process space of the debuggee and then uses that memory to read a file's contents to it.
First, examine the output of the memory allocation command .dvalloc:
0:000> .dvalloc 0n4096
Allocated 1000 bytes starting at 00620000
The output can be tokenized into six tokens; thus, the foreach loop should use the /pS flag to skip the first five tokens and directly start with the last token (which is the newly allocated memory address):
0:000> .foreach /pS 5 (token {.dvalloc 0x1000 }) { r $t0 = ${token}; .break; }
0:000> ? @$t0
Evaluate expression: 8323072 = 007f0000
The full script becomes the following:
$$ Set the image file name
aS fileName @"c:\temp\shellcode.bin"
.catch
{
$$ Set the allocation size to be equal to the file we want to read
r $t0 = 0n880;
.foreach /pS 5 (token {.dvalloc @$t0; })
{
r $t1 = token;
.break;
}
$$ Read the file
.readmem "${fileName}" @$t1 L@$t0;
.printf "Loaded ${fileName} @ %p\n", @$t1
}
Note
Remember to free the memory with the .dvfree command.
The next example parses the output of lm1m (which, by design, returns simplified output for use with .foreach):
0:000> lm1m
image00400000
SHCORE
KERNEL32
comctl32
user32
Ntdll
The foreach loop should look like this:
0:000> .foreach (modulename { lm1m; }) { .printf "Module name: modulename \n";}
Tokenizing from a File
The general syntax is as follows:
.foreach [Options] /f ( Variable "InFile" ) { OutCommands }
Assume a file called lines.txt with the following contents:
This is line 1
This is line 2
This is line 3
It will be tokenized as follows:
0:000> .foreach /f (line "c:\\temp\\lines.txt") { .printf ">${line}<\n" }
>This<
>is<
>line<
>1<
>This<
>is<
>line<
>2<
>This<
>is<
>line<
>3<
Extension-Provided foreach Loops
There are a few other foreach commands provided by extensions that are not part of the scripting language. These foreach commands are implemented inside various DbgEng extensions:
· !for_each_frame—Executes a command for each frame in the stack of the current thread
· !for_each_function—Executes a command for each function in a given module that matches the search pattern
· !for_each_local—Executes a command for each local variable in the current frame
· !for_each_module—Executes a command for each loaded module
· !for_each_process—Executes a command for each process (this extension works in kernel debugging only)
· !for_each_thread—Executes a command for each thread (kernel debugging only)
Note
Use the .extmatch *for_each* command to enumerate all the foreach extension commands.
Each of those extension commands exposes special variables to the command they execute. Please refer to the debugger manual to learn what variables are exposed for each specific extension command.
The following example lists all modules and displays some information about them:
!for_each_module .printf /D "%16p %16p: ${@#ModuleName}
@<link cmd=\"u %p\">%p</link>\n", ${@#Base},${@#End},
$iment(0x${@#Base}), $iment(0x${@#Base})
400000 408000: image00400000 @00406800
74b70000 74c78000: gdi32 @74b7afc5
75130000 75270000: KERNEL32 @7514a5cf
755d0000 75656000: comctl32 @755d1e15
75670000 757bf000: user32 @75685422
759b0000 76b28000: shell32 @759b108d
76c00000 76cbe000: msvcrt @76c0a9ed
76fa0000 77017000: ADVAPI32 @76fa1005
The entry point was computed with the $iment() operator. Also, the Debugger Markup Language (DML) was used to make the entry point clickable. When clicked it will unassemble the instructions at the entry point.
The next example scans for all functions in ntdll that contain the File substring
in their name:
!for_each_function -m:ntdll -p:*File* -c:.echo @#SymbolName
Note
To run more commands, enclose them in quotes or just use one of the commands that run script files.
Script Files
Various commands can be used to instruct the DbgEng to run scripts. These commands are split into two main categories:
· Commands that open the script file, replace all new lines with a semicolon (the command separator), and concatenate the whole contents into a single command block. These commands have the following form: $><.
· Commands that open the script file and interpret each line separately. These commands have the following form: $<.
The former is very handy when using a debugger command that accepts other commands as its arguments. For example, the bp command takes a breakpoint action, which can be a simple command or a command that runs a script file (that contains various commands inside of it).
The latter interprets the contents of the script file line by line; each line could contain various commands separated by a semicolon. Each command executed will also be echoed in the debugger output.
Some debugger commands interpret the whole line, disregarding whether there is a semicolon (;) or not. This means that using the $><-related commands will not work for such scripts. Consider the following example script:
r eax;r ebx
r $.u0 = This is just a line
.printf "$u0"
r ecx;r edx
Running this script with $>< does not work as intended:
0:000> $><test.wds
eax=00000000
ebx=00000000
0:000> ? $u0
Couldn't resolve error at 'This is just a line;.printf "";r ecx;r edx'
Conversely, running this particular script with $< works just fine:
0:000> $<test.wds
0:000> r eax;r ebx
eax=00000000
ebx=00000000
0:000> r $.u0 = This is just a line
0:000> .printf "$u0"
This is just a line0:000> r ecx;r edx
ecx=f7fc0000
edx=00000000
The reason for this behavior is that when assigning a value to a fixed-name alias, semicolons will also be part of the assignment. This explains why in the first output, the script seems to have been suddenly stopped; it's because $>< will concatenate all lines and separate them with a semicolon.
For the same reason, if you use a command that creates blocks and the curly braces ({ and }) are used on separate lines in the script file, $< will not work properly:
.if (1 == 2)
{
.printf "No way!\n";
}
.else
{
.printf "That's what I thought";
}
When executed, the preceding returns the following error:
(1)
0:000> $<blocktest.wds
0:000> .if (1 == 2)
^ Syntax error in '.if (1 == 2)'
0:000> {
^ Syntax error in '{'
0:000> .printf "No way!";
No way!0:000> }
^ Syntax error in '}'
0:000> .else
^ Syntax error in '.else'
0:000> {
^ Syntax error in '{'
0:000> .printf "That's what I thought";
That's what I thought0:000> }
^ Syntax error in '}'
(2)
0:000> $><p:\book\scripts\t_blocktest.wds
That's what I thought
Note
When the run script commands are prefixed with an extra $, the script file name/path can no longer contain semicolons. When a semicolon is found after $$>< or $$<, then whatever comes after it is interpreted as another set of commands.
To run a script file with its contents concatenated into a single command block, use $>< or $$><:
$$><path_to\the_script.wds; r eax; al; bl;
Because $$>< is used, the semicolon allows the subsequent commands to be executed.
Passing Arguments to Script Files
It is possible to pass arguments to scripts using the $$>a< command:
$$>a<path_to\the_script.wds arg1 arg2 …
The arguments can then be accessed in the script via the $argN aliases. The alias $arg0 contains the script name (as in C's argv[0]).
If you pass UDPRs as arguments, then they will not be expanded or evaluated before being passed to the script. This is a tricky situation and can lead to various unexpected behaviors. For example, suppose you call a script like this:
$$>a<script.wds @$t1 @$t2
The preceding script will be passed the values @$t1 and @$t2 as ${$arg1} and ${$arg2}, respectively. To solve this problem, assign the pseudo-registers to a user-named alias and then call the script from a .block. This will guarantee expansion of the alias values before they are passed to the script:
aS /x val1 @$t0
aS /x val2 @$t1
.block
{
$$>a<script.wds ${val1} ${val2}
}
ad /q val1
ad /q val2
To check whether an argument is present, use the .if" with "${/d:…}:
.catch
{
.if ${/d:$arg1} == 0 or ${/d:$arg2} == 0
{
.printf "Usage: ${$arg0} memory-address len\n";
.leave;
}
r $t0 = ${$arg1};
.if $vvalid($t0, 1) == 0
{
.printf "Invalid memory address specified\n";
.leave;
}
r $t1 = @$t0 + ${$arg2} - 1;
.printf "Summing memory bytes from %x to %x\n", @$t0, @$t1;
.for (r $t3 = 0;@$t0 <= @$t1;r $t0 = @$t1 +1)
{
r $t3 = @$t3 + by(@$t1);
}
.printf "The result is %x\n", @$t3;
}
We used a few tricks worthy of a brief explanation:
· .catch and .leave were used to simulate a function start and “return” like behavior.
· .if and ${/d:$arg1} were used to check if the first argument was defined. Because we did not explicitly switch the evaluator syntax, the scripting engine will evaluate using MASM; thus the operators used should all be valid in MASM syntax. Enclosing an expression with @@c++(expression) will evaluate the expression using C++ syntax.
· The $vvalid() operator is used to check if the passed memory address is valid.
· The .for command token is used to loop through the memory contents, and each byte at that location is dereferenced using MASM's by() operator.
In the following output, the script is passed various arguments:
(1)
0:000> $$>a<script.wds
Usage: script.wds memory-address len
(2)
0:000> $$>a<script.wds 0xbadf00d
Invalid memory address specified
(3)
0:000> $$>a<script.wds @eip 2
Summing memory bytes from 76f83bc5 to 76f83bc6
The result is eb
At marker 1, the script is executed without any arguments and it successfully showed its arguments. At marker 2, the script is passed an invalid memory address. Finally, at marker 3, the script is called correctly and the sum of the bytes is returned.
Note
The .wds file extension is not necessary. It is just a convention used by various script writers and stands for WinDbg Script file.
Using Scripts Like Functions
There is no way to define functions in the DbgEng's scripting language. However, it is possible to use various script files as if they were functions. A script can call itself recursively or call another script with another set of arguments, and those arguments will be different in the context of each script.
UDPRs are very handy when writing a script. When a script calls another script, those UDPRs will be common to all scripts and thus cannot be used exclusively inside each script without disrupting the state of the other caller scripts, unless of course they are saved and restored by the script in its entry and exit points.
Note
You can think of the need to preserve UDPRs in terms of registers in X86 or AMD64 programs, where the compiler ensures that it emits code that preserves certain general-purpose registers upon the entry and the exit of each function while (depending on the calling convention) dedicating certain registers for input/output of the function.
With that in mind, it is important to devise a mechanism that allows us to easily and seamlessly, and with as little repetition as possible, save/restore certain UDPRs anytime a script is going to call another.
The @call Script File Alias
In the previous section we outlined the necessity of having a way to save/restore UDRPs. For that reason, we devised two simple scripts that do just that. This section illustrates both the init.wds and call.wds scripts and explains how they work.
The init.wds script is used to set up the scripting environment and create the short aliases to act like function names:
(1)
ad /q *;
(2)
aS ${/v:SCRIPT_PATH} @"p:\book\scripts";
.block
{
$$ Callable scripts (using @call) (3)
aS ${/v:#sigma} @"${SCRIPT_PATH}\sigma";
aS ${/v:#pi} @"${SCRIPT_PATH}\pi";
$$ Script call aliases (4)
aS ${/v:@dvalloc} @"$$>a<${SCRIPT_PATH}\dvalloc.wds";
aS ${/v:@call} @"$$>a<${SCRIPT_PATH}\call.wds";
}
r $t19 = 0; (5)
r $t18 = 1; (6)
The init.wds script devises two user-named alias naming conventions:
· Names prefixed with @ denote aliases to the $$>a< command (run a script with arguments). Normally those are scripts that are self-sufficient. (They do not need to preserve UDPRs and do not necessarily call themselves or other scripts.)
· Names prefixed with # designate an alias that can be called with the @call alias. Those scripts can be recursive and can safely assume that all the UDPRs other than those designated as return values will be saved/restored before/after a script is called/returns.
Marker 1 deletes all previously defined aliases. At marker 2, the script's base path is defined. (Note the use of @ to specify a literal string.) At marker 3, we define two user-named aliases prefixed with # defined. These are callable via the @call alias and evaluate to the full script path without the.wds extension. (The call script will append the extension.) For the sake of demonstration, two callable scripts are defined: sigma and pi. At marker 4, we define two user-named aliases prefixed with @. These aliases simply resolve to $$>a< followed by the full script path. The @call alias is what makes calling scripts as a function possible. The @dvalloc is a wrapper around the .dvalloc command. Marker 5 defines the $t19 UDPR, which is used internally by call.wds script to remember the script calls nesting level. The nesting level is used to form an alias that will save all UDPRs per nest level. At marker 6, we define UDPR $t18, which is used internally by call.wds to determine how many UDPRs starting from $t0 should be skipped while restoring the saved UDPRs after a script call (more on that in the following explanation).
Here is the call.wds script:
ad /q ${/v:_tn_} (1)
.catch
{
.if ${/d:$arg1} == 0 (2)
{
.printf "No script to call specified";
.leave;
}
$$ Compute the saved registers alias name of the previous call
aS /x ${/v:_tn_} @$t19; (3)
.block
{
$$ Delete the saved registers alias name of the previous run
ad /q _sr_${_tn_};
}
r $t19 = @$t19 + 1; $$ Increment the nesting level (4)
$$ Compute the saved registers alias name for the current run
aS /x ${/v:_tn_} @$t19; (5)
$$ Save all pseudo-registers
.block
{ (6)
aS /c _sr_${_tn_} "r $t0,$t1,$t2,$t3,$t4,$t5,$t6,$t7,$t8,$t9,
$t10,$t11,$t12,$t13,$t14,$t15,$t16,$t17";
}
$$ Call the script
.catch
{(7)
$$>a<"${$arg1}.wds" ${/f:$arg2} ${/f:$arg3} ${/f:$arg4}
${/f:$arg5} ${/f:$arg6} ${/f:$arg7} ${/f:$arg8} ${/f:$arg9} ${/f:$arg10}
${/f:$arg11} ${/f:$arg12} ${/f:$arg13} ${/f:$arg14} ${/f:$arg15}
${/f:$arg16} ${/f:$arg17} ${/f:$arg18} ${/f:$arg19} ${/f:$arg20};
}
$$ Restore the registers after calling
.block
{
(8)
$$ Compute the saved registers alias name
aS /x ${/v:_tn_} @$t19;
.block
{
$$ Restore all registers except the first ones that
$$ are due to return a value
.foreach /pS @$t18 /s (X "_sr_${_tn_}" ) (9)
{
r ${X}; (10)
}
}
$$ Delete the saved registers alias name
ad /q _sr_${_tn_}; (11)
$$ Decrease the nesting level
r $t19 = @$t19 - 1; (12)
}
}
ad /q ${/v:_tn_}; (13)
This script needs two UDPRs for special purposes. The first is $t19, which is used to store the call nesting level. It is incremented each time @call is used to run a script, and decremented when the script finishes execution. Because $t19 is incremented and decremented, you can create an alias with a unique name per nesting level to store the UDPR values.
The second UDPR is $t18, which is used to designate the count of UDPRs used to return values (starting from $t0). By default, the value 1 indicates that $t0 is the only register to be used as a return value. If the script returns more than one value (for example, in $t0 and $t1), then the caller has to set $t18 to 2 before calling the script. This guarantees that neither $t0 nor $t1 will be reverted back to their original values (the values before the script was called). The call script takes the script name to be called as the first argument, followed by the rest of the arguments ($arg2 through $argN).
Now we briefly explain how the rest of this script works before putting it into action. At marker 1, we delete the user-named alias _tn_ (used to compute a per-nesting-level alias name) before redefining it. Marker 2 checks if a parameter was passed to the script. At marker 3 and 4, we assign to the _tn_ alias the numeric value of the nesting level (note the use of aS /x), and then we increment the nesting level UDPR $t19. At marker 5, we create a temporary alias that has the value of the current nesting level.
At marker 6, we save UDPRs $t0 through $t17 into an alias named _sr_{_tn_} by using aS /c followed by the r command and the list of UDPRs to return their values. For instance, if the nesting level is 2, the saved register's alias name will be _sr_2 and will contain the values of all UDPRs in question. _sr_0x2 will equate to $t0=00000003 $t1=00000000 $t2=00000000 … $t17=00000000.
At markers 7 and 8, the script that was passed into $arg1 is called with the rest of the arguments that were passed. After the script returns, re-compute the _tn_ alias. (The alias could have been overwritten by the called script.)
At markers 9 and 10, we iterate in the current _sr_NESTING_LEVEL alias but skip $t18 tokens (note the /pS switch), and then restore each UDPR with the r command.
At markers 11–13, we clean up the saved registers alias (_sr_NESTING_LEVEL), decrement the nesting level, and delete the temporary name alias.
The next step is to run the init.wds script that will create the appropriate aliases:
0:000> ad /q *; $$><p:\book\scripts\init.wds; al;
Alias Value
------- -------
#pi "p:\book\scripts\pi"
#sigma "p:\book\scripts\sigma"
#test "p:\book\scripts\test"
@call $$>a<"p:\book\scripts\call.wds"
@dvalloc $$>a<"p:\book\scripts\dvalloc.wds"
SCRIPT_PATH p:\book\scripts
Another way to do that is to run WinDbg (or cdb) with the -c command-line switch:
c:\dbg\windbg.exe -c "ad /q *;$$><p:\book\scripts\init.wds;al;" p:\test.exe
You can now tell that you have two aliases for @call and @dvalloc that are scripts that do not require automatic save/restore of UDPRs, and three other scripts that rely on @call to automatically save/restore UDPRs, and they act like “functions.”
The sigma.wds script takes two numeric parameters and returns the sum of terms between the first and second argument, returning the result in $t0:
.for (r $t0=0, $t1=${$arg1}, $t2=${$arg2}; @$t1 <= @$t2; r $t1 = @$t1 + 1)
{
r $t0 = @$t0 + @$t1;
}
To execute sigma.wds, use @call #sigma start_num end_num, as follows:
0:000> @call #sigma 1 4;.printf "The result is %d\n", @$t0
The result is 10
Similarly, the script pi.wds returns the multiplication result of the terms between the first and second argument:
.for (r $t0=1, $t1=${$arg1}, $t2=${$arg2}; @$t1 <= @$t2; r $t1 = @$t1 + 1)
{
r $t0 = @$t0 * @$t1;
}
The dvalloc.wds script is a wrapper around the .dvalloc command. When @dvalloc is called, the result is returned in $t0 so it can be used in scripts:
.catch
{
r $t0 = -1; $$ Set invalid result
.if ${/d:$arg1} == 0
{
.printf "Usage: dvalloc.wds memory-size\n";
.printf "The allocated memory is returned in t0\n";
.leave;
}
$$ Allocate memory and set result into $t0
.foreach /pS 5 (t {.dvalloc ${$arg1}})
{
.if $vvalid(${t}, 1) == 1
{
r $t0 = ${t};
.leave;
}
}
}
After allocating memory with .dvalloc, we tokenize the result and parse out the memory address into $t0.
Both sigma.wds and pi.wds are sample functions that use the $t1 and $t2 UDPRs. That means if a script calls sigma or pi, then $t1 and $t2 should not be modified in any way upon returning from both the functions back to the caller.
You can verify this behavior with the following simple test.wds script:
r $t1 = 0x123;
r $t2 = 0x456;
.printf "Before calling sigma: t1=%x, t2=%x\n", @$t1, @$t2
@call #sigma 1 3
.printf "After calling sigma: the result is t0=%x, t1=%x, t2=%x\n",
@$t0, @$t1, @$t2
The preceding script assigns values to UDPRs $t1 and $t2 and then calls #sigma 1 3, which will modify $t1 and $t2. If @call works as expected, then those UDPRs are restored just after the call:
0:000> @call #test
Before calling sigma: t1=123, t2=456
After calling sigma: the result is t0=6, t1=123, t2=456
Example Debug Scripts
In this section you will make use of various helpful scripts, putting into practice all that you have learned so far.
Getting the Image Base of a Specified Module
One quick way to get the image base of a module is to use the lm (list modules) command with the m switch to list modules matching the specified pattern:
0:000> lm m kernel32
start end module name
749e0000 74b20000 KERNEL32 (deferred)
From the output, you can tell that at the fifth token you have the image base. Thus, the image base can be easily parsed with .foreach by skipping the first tokens, extracting the value of the fifth token, and breaking out of the loop:
r $t0 = -1;
.foreach /pS 4 ( imgbase { lmm ${$arg1}; } )
{
r @$t0 = ${imgbase};
.break;
}
Writing a Basic UPX Unpacker
Writing a UPX unpacker is pretty simple, and there are many ways to do it. The method used here is elaborate in order to exercise various debugger commands. It is assumed that you have basic PE file format knowledge to properly understand the script.
The idea behind the script is as follows:
1. UPX packs the program and moves the original entry point (OEP) away from the .text section, which is the first section.
2. The script calculates the bounds of the first section and starts tracing.
3. If instruction pointer (EIP) is outside of the program image, then the script issues a gu to return to the caller.
4. Tracing continues until EIP is inside the first section. At that point, it is assumed that the program has been unpacked.
Here is the script:
$$ Get image base
$$ Get image base
aS /x IMG_BASE @@c++(@$peb->ImageBaseAddress); (1)
$$ Declare some user-named aliases that equate to UDPRs
aS SEC_START @$t19; (2)
aS SEC_END @$t18;
aS IMG_START @$t17;
aS IMG_END @$t16;
$$ Go to the program entrypoint
g @$exentry
.catch
{
$$ Get pointer to NT headers
(3)
r $t0 = ${IMG_BASE} + @@c++(((_IMAGE_DOS_HEADER *)${IMG_BASE})->e_lfanew)
$$ Now from the IMAGE_NT_HEADERS.FileHeader, get the size of optional header
(4)
r $t1 = @@c++( ((!_IMAGE_NT_HEADERS*)@$t0)->FileHeader.SizeOfOptionalHeader )
$$ Compute the address to the first section
$$ skip signature, size of file headers and size of optional headers
r $t2 = @$t0 + 4 + @@c++(sizeof(ole32!_IMAGE_FILE_HEADER)) + @$t1; (5)
$$ (6) Get first section boundaries
r ${SEC_START} = IMG_BASE +
@@c++(((_IMAGE_SECTION_HEADER *)@$t2)->VirtualAddress);
r ${SEC_END} = IMG_BASE +
@@c++(((_IMAGE_SECTION_HEADER *)@$t2)->Misc.VirtualSize);
$$ Compute the image bounds (7)
r ${IMG_START} = IMG_BASE;
r ${IMG_END} = IMG_START +
@@c++(((_IMAGE_NT_HEADERS *)@$t0)->OptionalHeader.SizeOfImage);
$$ The logic is as follows:
$$ 1. Trace
$$ 2. If IP is outside of image then "gu"
.for (r $t0=0; 1; r $t0 = @$t0 + 1) (8)
{
$$ Trace once more to see where it leads (9)
t;
$$ IP outside image boundaries?
.if (@$ip < ${IMG_START}) or (@$ip > ${IMG_END}) (10)
{
gu;
.continue;
}
$$ IP within the first section?
.if (@$ip >= ${SEC_START}) and (@$ip <= ${SEC_END}) (11)
{
.printf "--- Reach first section ---\n";
u;
.break;
}
}
}
At marker 1, we take the image base of the current running program from the $peb typed pseudo-register by accessing its ImageBaseAddress field using the C++ evaluator, and then store it in an alias called IMG_BASE.
At marker 2, we create a bunch of user-named aliases that correspond to some UDPRs. This is a nice trick to give names to those UDPRs. At marker 3, we assign the address of the _IMAGE_NT_HEADERS to the $t0 UDPR by adding the image base to the value of the field inIMAGE_DOS_HEADER.e_lfanew.
At marker 4, we retrieve the size of the optional headers into the $t1 UDPR. This will be useful to skip over all the PE headers and land in the first image section header.
At marker 5, we compute the address of first image section into the $t2 UDPR. At marker 6, we parse from the IMAGE_SECTION_HEADER both the section virtual address (section start) and the section end (section start + section size).
At marker 7, we compute the program's start and end addresses. The start address is the image base, and the end address is the image base plus the contents of the IMAGE_OPTIONAL_HEADER.SizeOfImage field.
At marker 8, we start looping infinitely using a for loop, $t0 as the counter, and the value 1 as the condition.
At markers 9–11, we use the t command to trace a single instruction. Don't trace if EIP is not within the image's boundaries and stop tracing if the EIP is within the first section's boundaries.
Although this method is too long, it illustrates how to write a more complex tracing script and logic in case the unpacking process is more sophisticated.
The following is a simpler version of the unpacker that searches for a code pattern that is executed just before the program is about to transition to the original entry point (OEP):
$$ UPX unpack w/ pattern
$$ UPX1:0107D7F5 39 C4 cmp esp, eax
$$ UPX1:0107D7F7 75 FA jnz short loc_107D7F3
$$ UPX1:0107D7F9 83 EC 80 sub esp, -80h
$$ UPX1:0107D7FC E9 ?? ?? ?? jmp near ptr word_103FC62
$$ Go to program entry point (not the original entry point, but the packed one)
$$ only if no arguments were specified
.if ${/d:$arg1} == 0
{
g @$exentry;
}
$$ Pattern not found!
r $t0 = 0; (1)
.foreach (addr { s -[1]b @$ip L200 39 c4 75 fa 83 EC}) (2)
{
$$ Pattern found!
r $t0 = 1;
r $t1 = ${addr} + 7; (3)
.printf /D "The JMP to OEP @<link cmd=\"u %x\">%x</link>\n",@$t1,@$t1;
(4)
ga @$t1;
(5)
t; u;
.break;
}
.if $t0 == 0
{
.printf "Could not find OEP jump pattern. Is the program packed by UPX?\n";
}
At marker 1, we use the $t0 UDPR as a Boolean variable to indicate whether the pattern was found.
At marker 2, we search for the pattern starting from the entry point and for at most 200 bytes using the 1 flag with the search command s. This will return just the address where the match occurred. If no match is found, an empty string is returned and thus the .foreach has nothing to tokenize.
At marker 3, we skip seven bytes past the matched pattern location to point to the long relative jump (which jumps back to the OEP). Store that address into $t1.
At markers 4 and 5, we run the program until the JMP OEP instruction is reached (the ga command was used, so a hardware breakpoint is used rather than a software breakpoint), and then we trace once over the JMP OEP instruction and thus reach the first instruction of the unpacked program.
Writing a Basic File Monitor
This example creates a script that illustrates how to use scripts in combination with conditional breakpoints to track all calls to ASCII and Unicode versions of various file I/O API functions: CreateFile, DeleteFile, GetFileAttributes, CopyFile, and so on.
The script is designed to be called once with the init parameter to initialize it and then multiple times as a command to the breakpoints it creates when it initializes.
The following parameters are passed when the script is called from the breakpoint:
· ApiName—Used for display purposes only.
· IsUnicode—Pass zero to specify that this is the ASCII version of the API, and pass one to specify that it is the Unicode version.
· FileNamePointerIndex—The parameter number on the stack that contains the pointer to the filename buffer
· ApiID—An ID of your choice, this parameter is optional. This is helpful if you want to add extra logic when this breakpoint occurs. In this script, CreateFile[A|W] is given the ID 5. Later you check whether this API is triggered, and then check what filename is accessed and act accordingly.
Here is the contents of the bp_displayfn.wds script:
.catch
{
.if '${$arg1}' == 'init' (1)
{
(2)
bp kernelbase!CreateFileA @"$$>a<${$arg0} CreateFileA 0 1 5";
bp kernelbase!CreateFileW @"$$>a<${$arg0} CreateFileW 1 1 5";
(3)
bp kernelbase!DeleteFileA @"$$>a<${$arg0} DeleteFileW 0 1";
bp kernelbase!DeleteFileW @"$$>a<${$arg0} DeleteFileW 1 1";
bp kernelbase!FindFirstFileA @"$$>a<${$arg0} FindFirstFileA 0 1";
bp kernelbase!FindFirstFileW @"$$>a<${$arg0} FindFirstFileW 1 1";
bp kernel32!MoveFileA @"$$>a<${$arg0} MoveFileA 0 1";
bp kernel32!MoveFileW @"$$>a<${$arg0} MoveFileW 1 1";
bp kernelbase!GetFileAttributesA
@"$$>a<${$arg0} GetFileAttributesA 0 1";
bp kernelbase!GetFileAttributesExA
@"$$>a<${$arg0} GetFileAttributesExA 0 1";
bp kernelbase!GetFileAttributesExW
@"$$>a<${$arg0} GetFileAttributesExW 1 1";
bp kernel32!CopyFileA @"$$>a<${$arg0} CopyFileA 0 1";
bp kernel32!CopyFileW @"$$>a<${$arg0} CopyFileW 1 1";
$$ Ignore some debug events (to lessen output pollution)
sxi ld;
$$ Display the list of the newly installed breakpoints
bl;
(4)
.leave;
}
(5)
$$ Display API name
.printf "${$arg1}: >";
(6)
$$ Fetch the file name pointer
r $t0 = poi(@$csp + 4 * ${$arg3});
(7)
$$ Is it a unicode string pointer?
.if ${$arg2} == 1
{
(8)
.printf "%mu<\n", @$t0;
}
.else
{
$$ Display as ASCII SZ (9)
.printf "%ma<\n", @$t0;
}
$$ ApiID parameter set? (10)
.if ${/d:$arg4} == 1
{
$$ ID of CreateFile API? (11)
.if ${$arg4} == 5
{
$$ Grab the name of the file so we compare it
aS /mu ${/v:FILE_NAME} @$t0; (12)
.block
{
(13)
.if $sicmp(@"${FILE_NAME}", @"c:\temp\eb.txt") == 0
{
.leave; (14)
}
}
ad /q ${/v:FILE_NAME};
}
}
$$ Continue after breakpoint
gc; (15)
}
At marker 1, we check whether the script is called with init; if so, then initialize the script (markers 2–4) and exit the script. At marker 2, we create two breakpoints for CreateFileA/W and set the condition to be the script itself, and pass ApiID = 5.
At markers 3 and 4, we add breakpoints for the rest of the APIs without passing the ApiID argument, and then return from the script. At markers 5 and 6, we print the API name then assign into $t0 the pointer of the filename (using the passed parameter index). At markers 7–9, we check if the script is called for the ASCII or Unicode version of the API and then appropriately use the %mu or the %ma format specifier. At markers 10–12, we check if an ApiID was passed and is the CreateFile ApiID.
At markers 12–14, we extract the filename into an alias called FILE_NAME, create a block so that the alias is expanded properly, and then compare the FILE_NAME alias against a desired file path. (Notice the use of @ to indicate literal string expansion.) If the path matches what we are looking for, the script terminates and suspends execution. Finally, at marker 15, the script will resume execution after any of the defined breakpoint is reached.
To use this script, run it with the init parameter first:
0:000> $$>a<P:\book\scripts\bp_displayfn.wds init; g;
Writing a Basic String Descrambler
This script implements a simple descrambling routine. Imagine the C scrambling routine is as follows:
void descramble(unsigned char *p, size_t sz)
{
for (size_t i=0;i<sz;i++, ++p)
{
*p = *p ^ (235 + (i & 1));
}
}
Note
The descrambling routine can be more sophisticated. If the routine involves the use of tables and whatnot, remember that you have access to those tables because the script has full access to the debuggee's memory.
The following is the same routine implemented using the DbgEng's scripting language. Note how it makes use of the @@c++ evaluator to easily mimic the original algorithm:
.catch
{
$$ Take the Source
r $t0 = ${$arg1};
$$ Take the Destination
r $t1 = ${$arg2};
$$ Take the Size
r $t2 = ${$arg3};
.for (r $t3=0; @$t3<@$t2; r $t3 = @$t3 + 1, $t0 = @$t0+1, $t1=@$t1+1)
{
r $t4 = @@c++((*(unsigned char *)@$t0) ^ (235 + (@$t3 & 1)));
eb @$t1 @$t4;
}
$$ Display the descrambled result
db ${$arg2} L ${$arg3};
}
The scrambled memory contents is as follows:
0:000> db 0x4180a4 L 30
004180a4 bb 9e 8a 8f 9f 85 88 8d-87 cc 99 89 9d 89 99 9f ................
004180b4 8e cc 8e 82 8c 85 85 89-8e 9e 82 82 8c ec eb ec ................
004180c4 eb ec eb ec eb ec eb ec-eb ec eb ec eb ec eb ec ................
To descramble, run the script:
0:000> @dvalloc 1; ? $t0
Evaluate expression: 131072 = 00020000
0:000> $$>a<descramble.wds 0x4180a4 0x20000 30
00020000 50 72 61 63 74 69 63 61-6c 20 72 65 76 65 72 73 Practical revers
00020010 65 20 65 6e 67 69 6e 65-65 72 69 6e 67 00 00 00 e engineering…
00020020 00 00 00 00 00 00 00 00-00 00 00 00 00 00 00 00 ................
Using the SDK
So far we have covered how to automate tasks using the scripting facilities provided by the debugging tools. The SDK that ships with the debugging tools provides another way to automate or extend the debugger. It ships with header files, library files to link your extension with, and various examples that show you how to use the DbgEng programmatically.
The SDK is found in the sdk subdirectory where the debugging tools are installed. It has the following directory structure:
· Help—Contains references to the DbgHelp library.
· Inc—Contains the includes needed when using the SDK.
· Lib—Contains the appropriate library files used during the linking build stage. It contains libraries for WOA (Windows on ARM), AMD64, and i386.
· Samples—Contains samples of various examples written using the different frameworks that can be used to write debugger extensions. There are also samples on how to use the DbgEng instead of writing an extension for it.
Although covering the SDK is beyond the scope of this chapter, the following sections briefly discuss how to use the SDK to write DbgEng extensions for the debugger. The material covered should be just enough to give you a head start, making it easy for you to understand the sample extensions and start learning and writing your own.
To begin, you should know that the SDK provides three frameworks with which you can write extensions:
· WdbgExts extension framework—These are the original WinDbg extensions. To interact with the DbgEng, they require exporting a few callbacks in order to work with the WinDbg Extension APIs instead of the debugger client interface. The programmer can later acquire a debugger client interface or other interfaces on demand if more functionality is required.
· DbgEng extension framework—These newer types of extensions can provide extra functionality to the extension writer. The extension commands have access to a debugger client interface instance that enables them to acquire other interfaces and interact further with the DbgEng.
· EngExtCpp extensions—Built on top of the DbgEng extension framework, these extensions are created by subclassing the ExtExtension base class. The ExtExtension class provides a variety of utility functions that enable the extension to perform complex tasks.
The following sections briefly illustrate how to write extensions using the WdbgExts extension framework. Please note that writing extensions using either of the other frameworks is fairly straightforward and can be done by following the SDK samples that ship with the Debugging Tools package.
Concepts
This section describes two methods for accessing the DbgEng APIs:
· Via the debugger interfaces, which can be retrieved using a debug client object instance.
· Via a structure passed to the WbgExts extension initialization callback. The structure contains a set of API function pointers that can be used by the extension.
The Debugger Interfaces
The DbgEng provides seven base interfaces to be used by the programmer. Over time, more functionality has been added, and in order to preserve backward compatibility, new versions of those interfaces have been introduced. For example, at the time of writing, IDebugControl is the first interface version and IDebugControl4 is the latest version of this interface.
Following is the list of interfaces and a brief explanation of their purpose and some of the functions they provide:
· IDebugClient5—This interface provides various useful functions to start or stop a debugging session and set the necessary DbgEng callbacks (input/output/events). In addition, its QueryInterface method is used to retrieve interfaces of the remaining interfaces.
· CreateProcess/AttachProcess—Creates a new process or attaches to an existing one:
· AttachKernel—Attaches to a live kernel debugger.
· GetExitCode—Returns the exit code of a process.
· OpenDumpFile—Starts a debugging session from a dump file.
· SetInputCallbacks/SetEventCallbacks—Sets the input/output callbacks.
· IDebugControl4—This interface provides process-control-related functions:
· AddBreakpoint—Adds a breakpoint.
· Execute—Executes a debugger command.
· SetInterrupt—Signals the DbgEng to break into the target.
· WaitForEvent—Waits until a debugger event occurs. This is similar to the WaitForDebugEvent() Win32 API.
· SetExecutionStatus—Sets the DbgEng's status. This allows the programmer to resume execution, request a step into or step over, etc.
· IDebugDataSpaces4—This interface provides memory and data-related functionality:
· ReadVirtual—Reads memory from the target's virtual memory.
· QueryVirtual—Equivalent to Win32's VirtualQuery(), this function queries the virtual memory of the target's virtual address space.
· ReadMsr—Reads the model-specific register value.
· WritePhysical—Writes physical memory.
· IDebugRegisters2—Provides register introspection (enumeration, information query) and set/get functionality. The DbgEng assigns registers an index. To work with a named register you have to first figure out its index:
· GetDescription—Returns a description of the register (size, name, type, etc.).
· SetValue/GetValue—Sets/gets the value of a register.
· GetIndexByName—Finds a register index given its name.
· IDebugSymbols3—Provides functionality to deal with debugging symbols, source line information, querying types, etc:
· GetImagePath—Returns the executable image path.
· GetFieldName—Returns the name of a field within a structure.
· IDebugSystemObjects4—Provides functionality to query information from the debugged target(s) and the system it runs on:
· GetCurrentProcessId—Returns the DbgEng process id of the currently debugged process.
· GetCurrentProcessHandle—Returns the system handle of the current process.
· SetCurrentThreadId—Switches the current thread given its DbgEng id. This is equivalent to the ˜Nk command.
· IDebugAdvanced4—Provides more functionality not necessarily present in the other interfaces:
· GetThreadContext/SetThreadContext—Gets/sets the thread context.
· GetSystemObjectInformation—Returns information about the desired system object.
In order to use the APIs via the interfaces, you need to have an instance of the IDebugClient (debugger client) interface or any of its derived interfaces. In the following code snippet, the IDebugClient5 interface instance is passed to the CreateInterfaces utility function. The latter then callsQueryInterface repetitively to retrieve the needed interfaces:
bool CreateInterfaces(IDebugClient5 *Client)
{
// Interfaces already created?
if (Control != NULL)
return true;
// Get the debug client interface
if (Client == NULL)
{
m_LastHr=m_pDebugCreate(__uuidof(IDebugClient5),(void**)&Client);
if (m_LastHr != S_OK)
return false;
}
// Query for some other interfaces that we'll need.
do
{
m_LastHr = Client->QueryInterface(
__uuidof(IDebugControl4),
(void**)&Control);
if (m_LastHr != S_OK)
break;
m_LastHr = Client->QueryInterface(
__uuidof(IDebugSymbols3),
(void**)&Symbols);
if (m_LastHr != S_OK)
break;
m_LastHr = Client->QueryInterface(
__uuidof(IDebugRegisters2),
(void**)&Registers);
if (m_LastHr != S_OK)
break;
m_LastHr = Client->QueryInterface(
__uuidof(IDebugSystemObjects4),
(void**)&SystemObjects);
if (m_LastHr != S_OK)
break;
m_LastHr = Client->QueryInterface(
__uuidof(IDebugAdvanced3),
(void**)&Advanced);
if (m_LastHr != S_OK)
break;
m_LastHr = Client->QueryInterface(
__uuidof(IDebugDataSpaces4),
(void**)&DataSpace);
} while ( false);
return SUCCEEDED(m_LastHr);
}
The interface variables are defined like this:
IDebugDataSpaces4 *DataSpace;
IDebugRegisters2 *Registers;
IDebugSymbols3 *Symbols;
IDebugControl4 *Control;
IDebugSystemObjects4 *SystemObjects;
IDebugAdvanced3 *Advanced;
To acquire a debugger client interface (IDebugClient), use either the DebugCreate function or the DebugConnect (connect to a remote host) function. The following example acquires a debugger client interface using DebugCreate:
HRESULT Status;
IDebugClient *Client;
if ((Status = DebugCreate(__uuidof(IDebugClient),
(void**)&Client)) != S_OK)
{
printf("DebugCreate failed, 0x%X\n", Status);
return -1;
}
// Okay, now ready to query for other interfaces…
WinDbg Extension APIs
Debugger extensions receive a pointer to a WINDBG_EXTENSION_APIS structure via the WinDbgExtensionDllInit extension initialization callback routine. The structure has the following API pointers:
// wdbgexts.h
typedef struct _WINDBG_EXTENSION_APIS {
ULONG nSize;
PWINDBG_OUTPUT_ROUTINE lpOutputRoutine;
PWINDBG_GET_EXPRESSION lpGetExpressionRoutine;
PWINDBG_GET_SYMBOL lpGetSymbolRoutine;
PWINDBG_DISASM lpDisasmRoutine;
PWINDBG_CHECK_CONTROL_C lpCheckControlCRoutine;
PWINDBG_READ_PROCESS_MEMORY_ROUTINE lpReadProcessMemoryRoutine;
PWINDBG_WRITE_PROCESS_MEMORY_ROUTINE lpWriteProcessMemoryRoutine;
PWINDBG_GET_THREAD_CONTEXT_ROUTINE lpGetThreadContextRoutine;
PWINDBG_SET_THREAD_CONTEXT_ROUTINE lpSetThreadContextRoutine;
PWINDBG_IOCTL_ROUTINE lpIoctlRoutine;
PWINDBG_STACKTRACE_ROUTINE lpStackTraceRoutine;
} WINDBG_EXTENSION_APIS, *PWINDBG_EXTENSION_APIS;
When the extension receives this structure, it should copy and store it in a global variable, preferably named ExtensionApis. The reason to choose this particular variable name is because the header file wdbgexts.h defines some macros that refer to ExtensionApis to access the API pointers:
extern WINDBG_EXTENSION_APIS ExtensionApis;
#define dprintf (ExtensionApis.lpOutputRoutine)
#define GetExpression (ExtensionApis.lpGetExpressionRoutine)
#define CheckControlC (ExtensionApis.lpCheckControlCRoutine)
#define GetContext (ExtensionApis.lpGetThreadContextRoutine)
…
#define ReadMemory (ExtensionApis.lpReadProcessMemoryRoutine)
#define WriteMemory (ExtensionApis.lpWriteProcessMemoryRoutine)
#define StackTrace (ExtensionApis.lpStackTraceRoutine)
These macros enable extension writers to directly call StackTrace or WriteMemory, for instance, instead of using pExtension.lpStackTraceRoutine or pExtension.WriteMemory.
Apart from being able to use only the functions declared in the WINDBG_EXTENSION_APIS structure, it is also possible to use a whole range of other functions that are based on the ExtensionApis.lpIoctlRoutine function. For example, ReadPhysical() is an inline function that calls IoCtl() with theIG_READ_PHYSICAL control code while passing it the appropriate parameters.
Please refer to the DbgEng help file for a list of functions that you can use inside WdbgExts extensions.
Writing Debugging Tools Extensions
In the previous section you learned the concepts behind the SDK; now you are ready to delve into more details about what a WdbgExts extension looks like and how to write a very basic extension.
A debugger extension is simply a Microsoft Windows DLL. The DLL has to export two mandatory functions needed by the DbgEng and then export as many functions as the extension is providing to the debugger.
The first function that should be exported is WinDbgExtensionDllInit. It is called when the debugger loads your extension:
VOID WinDbgExtensionDllInit(
PWINDBG_EXTENSION_APIS lpExtensionApis,
USHORT MajorVersion,
USHORT MinorVersion)
{
ExtensionApis = *lpExtensionApis; // Take a copy
// Optionally also save the version information
SavedMajorVersion = MajorVersion;
SavedMinorVersion = MinorVersion;
return;
}
Notice that you save the passed lpExtensionApis pointer contents. The passed version information variables denote the Microsoft Windows build type and build number, respectively. Optionally save those variables if you want to check their values in the extension commands later.
The second function that should be exported is ExtensionApiVersion. It is called by the DbgEng when it wants to query the version information from your extension:
EXT_API_VERSION ApiVersion =
{
5, // Major
1, // Minor
EXT_API_VERSION_NUMBER64, // Revision
0 // Reserved
};
LPEXT_API_VERSION ExtensionApiVersion(VOID)
{
return &ApiVersion;
}
Now that the mandatory functions (or callbacks) have been defined, you proceed by declaring the extension commands.
An extension command has the following declaration:
CPPMOD VOID myextension(
HANDLE hCurrentProcess,
HANDLE hCurrentThread,
ULONG dwCurrentPc,
ULONG dwProcessor,
PCSTR args)
The most notable passed arguments are as follows:
· dwProcessor—The index of the current processor
· dwCurrentPc—The current instruction pointer
· args—The arguments passed (if any)
Another preferred way to declare an extension function is to use the DECLARE_API(api_s) macro:
DECLARE_API( test )
{
dprintf("This is a test extension routine");
}
Note
At any time, any extension command can call DebugCreate()and then get any interface it wants in order to gain extra functionality.
The final step is to export the two mandatory functions and the extension commands that you plan to expose to the DbgEng. The usual way is to create a .def file and call the linker with an additional /DEF:filename.def switch. This is what the DEF file for the test extension we wrote looks like:
EXPORTS
; Callbacks provided for the debugger
WinDbgExtensionDllInit
ExtensionApiVersion
; Command callbacks
test
Place the resulting DLL in the debugging tools directory (or in the winext subdirectory) or in the Windows system directory. Use !load extname to load your compiled extension and then !extension_command or !extname.ext_command to execute the extension command.
Useful Extensions, Tools, and Resources
Following is a short list of useful extensions, tools, and resources that can enhance your debugging experience:
· narly (https://code.google.com/p/narly/)—A handy extension that lists /SAFESEH handlers, displays information about /GS and DEP, searches for ROP gadgets, and provides other miscellaneous commands.
· SOS—This extension, which ships with the Windows Driver Kit (WDK), facilitates managed code debugging.
· !analyze—A very useful extension (ships with the DbgEng) that displays information about the current exception or bugcheck.
· VirtualKd (http://virtualkd.sysprogs.org/)—This is a tool that improves the kernel debugging speed when used with VMWare or VirtualBox.
· windbg.info—This website provides a very comprehensive WinDbg/DbgEng command reference and a discussion forum for users.
· kdext.com—This website provides a pair of DbgEng extensions. A notable extension is the assembly syntax highlighting and UI enhancements extension.
· SysecLabs WinDbg Scripts (www.laboskopia.com/download/SysecLabs-Windbg-Script.zip)—A set of scripts that help you inspect the kernel. Especially useful for rootkit hunting.
· !exploitable (http://msecdbg.codeplex.com/)—An extension that provides automated crash analysis and security risk assessment.
· Qb-Sync (https://github.com/quarkslab/qb-sync)—A nifty WinDbg extension by Quarkslab that enables synchronizing IDA Pro's disassembly or graph view with WinDbg.
· Pykd (http://pykd.codeplex.com/)—A Python extension to access the DbgEng.
All materials on the site are licensed Creative Commons Attribution-Sharealike 3.0 Unported CC BY-SA 3.0 & GNU Free Documentation License (GFDL)
If you are the copyright holder of any material contained on our site and intend to remove it, please contact our site administrator for approval.
© 2016-2026 All site design rights belong to S.Y.A.