Test Scoring and Analysis Using SAS (2014)
Chapter 2. Reading Test Data and Scoring a Test
Introduction
This chapter shows you how to read test data from a variety of sources (e.g., text files, CSV files, Excel workbooks) and how to compare the student responses and the answer key to score a test. In addition, you will see how to generate student rosters with or without the inclusion of student names. Finally, you will see how to generate statistics and histograms based on the resulting test scores.
Two popular sources of test data are output from optical mark-sense readers (also called scanners) or from data captured online. The answer key information may sometimes be included in the data file or it may be in a separate location. When a scanner is used, it is a common practice to scan the answer key in first, followed by the student responses. You will see examples of how to read data in different formats and how to process the answer key data, depending on how it is stored.
Reading Data from a Text File and Scoring a Test
The programs presented in this section assume that the answer key is stored in the same file as the student responses. Let's get started:
The "test" you are going to score is a 10-question multiple-choice test with possible answer choices of a, b, c, d, and e. This first sample program assumes the answer key and student responses are stored in a text file (sample_test.txt) located in a folder called c:\books\test scoring. Here is a listing of this file:
Listing of File c:\books\test scoring\sample_test.txt
000000000 abcedaabed
123456789 abcdeaabed
111111111 abcedaabed
222222222 cddabedeed
333333333 bbdddaaccd
444444444 abcedaabbb
555555555 eecedabbca
666666666 aecedaabed
777777777 dbcaaaabed
888888888 bbccdeebed
999999999 cdcdadabed
Notice that the answer key is the first line of the file and that the ID field contains all zeros (you can use any value in the ID field of the answer key or leave it blank). The program presented here ignores the ID field for the answer key. Here is a SAS program that will read data from this text file and produce a listing of student IDs, the raw score (number of items answered correctly), and a percentage score:
Program 2.1: Scoring a Test (Data from a Text File)
data score;
infile 'c:\books\test scoring\sample_test.txt' pad;
array Ans[10] $ 1 Ans1-Ans10; ***student answers;
array Key[10] $ 1 Key1-Key10; ***answer key;
array Score[10] Score1-Score10; ***score array 1=right,0=wrong;
retain Key1-Key10;
if _n_ = 1 then input @11 (Key1-Key10)($1.);
input @1 ID $9.
@11 (Ans1-Ans10)($1.);
do Item=1 to 10;
Score[Item] = Key[Item] eq Ans[Item];
end;
Raw=sum(of Score1-Score10);
Percent=100*Raw / 10;
keep Ans1-Ans10 ID Raw Percent;
label ID = 'Student ID'
Raw = 'Raw Score'
Percent = 'Percent Score';
run;
proc sort data=score;
by ID;
run;
title "Student Scores";
proc print data=score label;
id ID;
var Raw Percent;
run;
We will explain the salient points of the program in a moment, but first, here is a listing of the output:
Output from Program 2.1
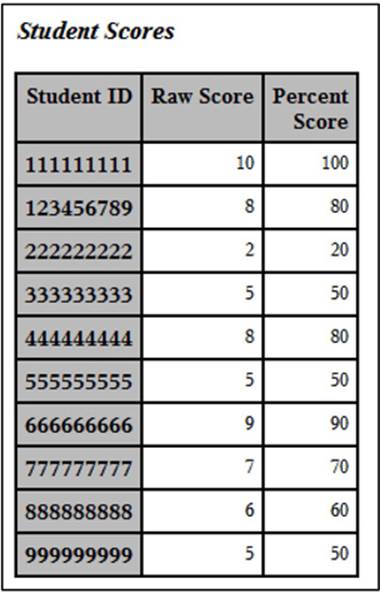
Each student ID is displayed with the raw test score (the number of items answered correctly) and the score displayed as a percentage.
Explanation of Program 2.1
For those SAS programmers who would like to understand the ins-and-outs of the program, read on. Note: This program uses several statements that are a bit beyond the beginning programmer level.
The program is creating a SAS data set called SCORE.
data score;
The INFILE statement tells SAS where to find the raw data file. The PAD option is useful in case there are some short records in the file because this option pads each record with blanks
infile 'c:\books\test scoring\sample_test.txt' pad;
The next three statements create three arrays. Array ANS represents the 10 variables (Ans1-Ans10) that store the student answers. Array KEY represents the 10 answer key variables. Finally, array SCORE represents the 10 score variables: 1=Correct, 0=Incorrect.
array Ans[10] $ 1 Ans1-Ans10; ***student answers;
array Key[10] $ 1 Key1-Key10; ***answer key;
array Score[10] Score1-Score10; ***score array
A RETAIN statement is needed since the answer key is read only once and, without this statement, the 10 key variables would be set back to missing at the top of the DATA step.
retain Key1-Key10;
The first record in the text file contains the answer key—the remaining records contain the student answers. The SAS created variable _N_ counts iterations of the DATA step. When it is equal to 1, you want to read in the answer key values. These values are stored in the 10 variables Key1 to Key10, starting in column 11.
if _n_ = 1 then input @11 (Key1-Key10)($1.);
You now read the student IDs starting in column 1 (in this example, the student IDs are 9 characters long) and the 10 student answers (stored in variables Ans1 to Ans10), starting in column 11.
input @1 ID $9.
@11 (Ans1-Ans10)($1.);
You now want to compare each of the student answers to the answer key. You do this by writing a DO loop. This loop will iterate 10 times, with the variable Item taking on values from 1 to 10. The first time the loop iterates, Item is equal to 1. The logical expression Key[1] eq Ans[1] is true when Ans1 is equal to Key1 and false when Ans1 is not equal to Key1. SAS uses the value 1 for true expressions and 0 for false expressions. Therefore, the value of Score1 will be a 1 when the student answered the question correctly and 0 otherwise. Once the DO loop has completed its 10 iterations, there will be 10 Score variables with values of 1 or 0.
do Item=1 to 10;
Score[Item] = Key[Item] eq Ans[Item];
end;
The raw score is the sum of the 10 Score values.
Raw=sum(of Score1-Score10);
The percentage score is the raw score divided by the number of items on the test (10).
Percent=100*Raw / 10;
You want to keep the answer key values (to be used in programs that follow), the student ID, the raw score, and the percentage score.
keep Ans1-Ans10 ID Raw Percent;
A LABEL statement provides labels for selected variables. These labels will be printed in the output.
label ID = 'Student ID'
Raw = 'Raw Score'
Percent = 'Percent Score';
The RUN statement ends the DATA step.
run;
The SORT procedure sorts the data set in increasing order of the student ID.
proc sort data=score;
by ID;
run;
Finally, PROC PRINT is used to list the contents of the SCORE data set. The LABEL option tells SAS to use the variable labels and not the variable names in the listing.
title "Student Scores".
proc print data=score label;
id ID;
var Raw Percent;
run;
Reading Space-Delimited Data
The next several sections describe how to read test data from a variety of different formats. You will see how to read space- or comma-delimited data and how to read data from an Excel workbook. It goes without saying that you may wish to skip those sections that demonstrate how to read data from sources you will not be using. On the other hand, if you are a SAS programmer, you may find these sections interesting.
Suppose your data file looks like this:
File c:\books\test scoring\spacedlim.txt
a b c e d a a b e d
123456789 a b c d e a a b e d
111111111 a b c e d a a b e d
222222222 c d d a b e d e e d
333333333 b b d d d a a c c d
444444444 a b c e d a a b b b
555555555 e e c e d a b b c a
666666666 a e c e d a a b e d
777777777 d b c a a a a b e d
888888888 b b c c d e e b e d
999999999 c d c d a d a b e d
Here, the first row of data contains the answer key and the remaining rows contain an ID and the student answers. Each of the key values and the student answers are separated by blanks. SAS has the ability to read delimited data (it calls the method list input) and it is quite straightforward. Because blanks are the default delimiter for SAS list input, you simply list the variable names for each of the delimited data values. The next program reads this data file and the resulting data set is identical to the one created by Program 2.1.
Program 2.2: Reading Space-Delimited Data
*Reading Space-Delimited Data;
data read_dlim;
length ID $ 9;
infile 'c:\books\test scoring\spacedlim.txt' missover;
retain Key1-Key10;
array Key[10] $ 1 Key1-Key10;
array Ans[10] $ 1 Ans1-Ans10;
array Score[10] Score1-Score10;
retain Key1-Key10;
if _n_ = 1 then input Key1-Key10;
input ID Ans1-Ans10;
do Item=1 to 10;
Score[Item] = Key[Item] eq Ans[Item];
end;
Raw=sum(of Score1-Score10);
Percent=100*Raw / 10;
keep Ans1-Ans10 ID Raw Percent;
label ID = 'Student ID'
Raw = 'Raw Score'
Percent = 'Percent Score';
run;
To read space-delimited data, you provide a list of the variables on the INPUT statement in the same order as the variables in the file. When using this method of input, you need to specify the length of character variables since, by default, SAS assigns a length of eight bytes for these variables. In this program, the length of the answer and key variables is defined in the ARRAY statements. To specify the length of the ID variable, you use a LENGTH statement.
The INFILE statement tells the program where to find the input data file. The MISSOVER option is useful when you have a line of data that does not contain as many values as you listed on the INPUT statement. With this option in effect, if there are too few data values in the input data, a missing value is assigned to all the remaining variables. In this example, every line of data had an ID and exactly 10 answers. The MISSOVER option was included just in case there was a line of data with fewer than 10 answers.
The remainder of the program follows the logic of Program 2.1.
Reading Comma-Delimited Data (CSV File)
It is probably even more common to have data values separated by commas. These files can be created using Excel. You only need to make a small change to Program 2.2 to read CSV files.
If you add the option DSD to the INFILE statement, SAS will understand that commas are to be considered as data delimiters instead of spaces. Here is an example of a CSV file that has the answer key as the first line and the student IDs and student answers in the remaining lines:
File c:\books\test scoring\Exceldata.csv
a,b,c,e,d,a,a,b,e,d,
123456789,a,b,c,d,e,a,a,b,e,d
111111111,a,b,c,e,d,a,a,b,e,d
222222222,c,d,d,a,b,e,d,e,e,d
333333333,b,b,d,d,d,a,a,c,c,d
444444444,a,b,c,e,d,a,a,b,b,b
555555555,e,e,c,e,d,a,b,b,c,a
666666666,a,e,c,e,d,a,a,b,e,d
777777777,d,b,c,a,a,a,a,b,e,d
888888888,b,b,c,c,d,e,e,b,e,d
999999999,c,d,c,d,a,d,a,b,e,d
Here is the SAS program that reads these data:
Program 2.3: Reading Data from a CSV File
data readCSV;
length ID $ 9;
infile 'c:\books\test scoring\Exceldata.csv' missover dsd;
retain Key1-Key10;
array Key[10] $ 1 Key1-Key10;
array Ans[10] $ 1 Ans1-Ans10;
array Score[10] Score1-Score10;
retain Key1-Key10;
if _n_ = 1 then input Key1-Key10;
input ID Ans1-Ans10;
do Item=1 to 10;
Score[Item] = Key[Item] eq Ans[Item];
end;
Raw=sum(of Score1-Score10);
Percent=100*Raw / 10;
keep Ans1-Ans10 ID Raw Percent;
label ID = 'Student ID'
Raw = 'Raw Score'
Percent = 'Percent Score';
run;
Reading Data Directly from an Excel Workbook
This section will show you how to read data directly from an Excel workbook, without first converting it into a CSV file. The method used has a somewhat fancy name—you are going to use a LIBNAME engine. By appropriately identifying the data source, SAS will read the data almost as if it was contained in a SAS data set rather than in an Excel workbook. To demonstrate how this works, your Excel workbook is shown below:
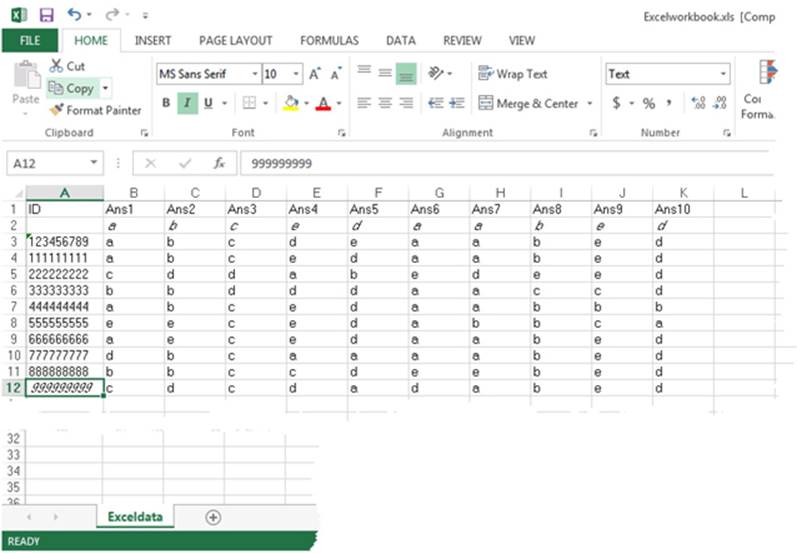
In this workbook, the first row contains the labels ID and Ans1 to Ans10. The next row, starting in the second column (so it lines up with the student answers), is the answer key. Finally, the remaining rows contain the student IDs and the student answers.
Note that the worksheet was named Exceldata, as can be seen in the section at the bottom of the worksheet.
Here is the program to read this worksheet and convert it into the appropriately structured SAS data set:
Program 2.4: Reading Data Directly from an Excel Workbook
*Read Excel Workbook;
libname readxl 'c:\books\test scoring\excelworkbook.xls';
data read;
set readxl.'Exceldata$'n;
retain Key1-Key10;
array Key[10] $ 1;
array Ans[10] $ 1;
array Score[10] Score1-Score10;
if _n_ = 1 then do Item = 1 to 10;
Key[Item] = Ans[Item];
end;
drop Item;
do Item=1 to 10;
Score[Item] = Key[Item] eq Ans[Item];
end;
Raw=sum(of Score1-Score10);
Percent=100*Raw / 10;
keep Ans1-Ans10 ID Raw Percent;
label ID = 'Student ID'
Raw = 'Raw Score'
Percent = 'Percent Score';
run;
You create a library reference (called a libref in SAS terminology) using a LIBNAME statement. LIBNAME statements are routinely used to create permanent SAS data sets. When you use them in that context, you simply name a PC or UNIX folder where you want to create your permanent SAS data set. In this program, you use the LIBNAME statement to point to the Excel worksheet you want to read.
The SET statement does two things: First, it names the libref so SAS knows which workbook to read from. Second, the part following the period is the name of the specific worksheet you want to read. You might expect that this should be "Exceldata$." However, that is not a valid SAS name (SAS names must begin with a letter or underscore, followed by letters, digits, or underscores). These headings automatically become variable names in the SAS data set. Space characters or special characters such as the '$' in the worksheet name are not allowed. In order to include the '$' in the worksheet name, you use a named literal. That is, you place the name in single (or double) quotes followed by an upper- or lowercase 'n'.
The headings of the worksheet are ID and Ans1-Ans10. However, the first line of data in the worksheet contains the answer key, not student answers. Therefore, you need to set the values in the first line of the worksheet to the 10 Key variables. When you are reading the first line of the file, the internal variable _N_ is equal to 1. In that case, you set the 10 Key variables equal to the 10 Ans variables using a DO loop. From that point on, the program logic is the same as described in Program 2.1.
Reading an Answer Key from a Separate File
If you have the answer key stored in a separate file, you need to make a small change to the scoring program in order to score your test. As an example, suppose your answer key is stored as a CSV text file called c:\books\test scoring\key.txt and the student data is stored in the same format as Program 2.1 and called answer.txt. To be sure this is clear, here are the listings of these two files:
File c:\books\test scoring\key.txt
a,b,c,e,d,a,a,b,e,d
File c:\books\test scoring\answer.txt
123456789 abcdeaabed
111111111 abcedaabed
222222222 cddabedeed
333333333 bbdddaaccd
444444444 abcedaabbb
555555555 eecedabbca
666666666 aecedaabed
777777777 dbcaaaabed
888888888 bbccdeebed
999999999 cdcdadabed
Here is one version of the scoring program that will read data from these two files and compute student scores (a brief explanation will follow):
Program 2.5: Program to Read the Answer Key from a Separate File
*Program to read the answer key from a separate file;
data score2;
if _n_ = 1 then do;
infile 'c:\books\test scoring\key.txt' dsd;
input (Key1-Key10)(: $1.);
end;
infile 'c:\books\test scoring\answer.txt' pad;
array ans[10] $ 1 Ans1-Ans10; ***student answers;
array key[10] $ 1 Key1-Key10; ***answer key;
array score[10] Score1-Score10; ***score array 1=right,0=wrong;
retain Key1-Key10;
input @1 ID $9.
@11 (Ans1-Ans10)($1.);
do Item=1 to 10;
Score[Item] = Key[Item] eq Ans[Item];
end;
Raw=sum(of Score1-Score10);
Percent=100*Raw / 10;
keep Ans1-Ans10 ID Raw Percent;
label ID = 'Student ID'
Raw = 'Raw Score'
Percent = 'Percent Score';
run;
On the first iteration of the DATA step, you read the 10 answer key values from the key.txt file. Once you have read the answer key, you use another INFILE statement to switch the input to the student answer file. The remainder of the program is the same as Program 2.1.
Modifying the Program to Score a Test of an Arbitrary Number of Items
The next step towards making the scoring program more useful is to modify it to score a test containing any number of items. To accomplish this goal, you replace the constant value of 10 in Program 2.1 with a macro variable. For those readers who are not familiar with SAS macros, the concept is analogous to the find-and-replace facility in most word processors. In the case of SAS macros, macro variables (variable names that start with an ampersand) are replaced with values, usually supplied in a call to the macro. Question: How do you call a macro? Answer: Shout MACRO! You will see how to call (execute) the macro following the listing.
The following macro scores a test consisting of an arbitrary number of items. To make the macro even more flexible, you can enter the length of the ID as well as the starting position for the answer key and the student answers. Here it is:
Program 2.6: Presenting a Macro to Score a Test of Any Length
%macro score(File=, /*Name of the file containing the answer
key and the student answers */
Length_id=, /*Number of bytes in the ID */
Start=, /*Starting column of student answers */
Nitems= /*Number of items on the test */);
data score;
infile "&File" pad;
array Ans[&Nitems] $ 1 Ans1-Ans&Nitems; ***student answers;
array Key[&Nitems] $ 1 Key1-Key&Nitems; ***Answer Key;
array Score[&Nitems] Score1-Score&Nitems; ***score array
1=right,0=wrong;
retain Key1-Key&Nitems;
if _n_= 1 then input @&Start (Key1-Key&Nitems)($1.);
input @1 ID $&Length_ID..
@&start (Ans1-Ans&Nitems)($1.);
do Item = 1 to &Nitems;
Score[Item] = Key[Item] eq Ans[Item];
end;
Raw=sum (of Score1-Score&Nitems);
Percent=100*Raw / &Nitems;
keep Ans1-Ans&Nitems ID Raw Percent;
label ID = 'Student ID'
Raw = 'Raw score'
Percent = 'Percent score';
run;
proc sort data=score;
by ID;
run;
%mend score;
You don't need to be a SAS programmer or understand how to write SAS macros to use this macro to score tests. All you need to know is how to specify the variables required in the call. To call a SAS macro, you enter a percent sign followed by the macro name, followed by the values needed for the macro variables.
As an example, suppose you want to score a test where the raw data file is called sample_test.txt, stored in a folder called c:\books\test scoring. You have nine-digit ID numbers, the student answers start in column 11, and the test contains 10 items. The macro call looks like this:
*Calling the macro;
%score(File=c:\books\test scoring\sample_test.txt,
Start=11,
Length_ID=9,
Nitems=10)
Notice that this macro call does not end in a semi-colon. When you run this macro, you will obtain the same output as with the non-macro versions described earlier. The advantage of converting the program into a SAS macro is that you don't have to rewrite the program to change the input file name, the length of the ID, the location of the student answers, or the number of items on the test each time you want to score a test.
If you want to see a listing of student IDs, raw scores, and percentage scores, you can use PROC PRINT, like this:
Program 2.7: Using PROC PRINT to List Student IDs and Scores
title "Listing of Student IDs and Test Scores";
proc print data=score;
id ID;
var Raw Percent;
run;
The resulting listing is shown next:
Output from Program 2.7
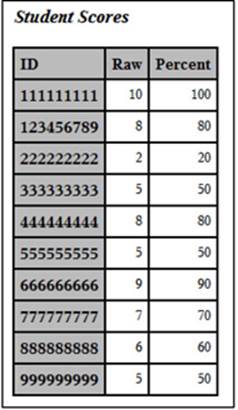
The list of IDs is in order because the macro program included a sort on ID.
Displaying a Histogram of Test Scores
One way to display a histogram of test scores is with PROC UNIVARIATE. This procedure can also output some useful statistics on the distribution of scores. The program shown next produces some commonly used measures of central tendency and dispersion as well as a histogram of test scores:
Program 2.8: Program to Produce Statistics and Histograms of Test Scores
*Program to Produce Statistics and Histograms of Test Scores;
%score(File=c:\books\test scoring\stat_test.txt,
Start=11,
Length_ID=9,
Nitems=56)
title "Test Statistics and Histograms";
proc univariate data=score;
id ID;
var Percent;
histogram / midpoints=30 to 100 by 5;
run;
The %SCORE macro, described earlier in this chapter, was used to score a biostatistics test containing 56 items. (Note that the IDs from the original test were replaced by random digits.) If you include an ID statement with PROC UNIVARIATE, a section of the output that lists the five highest and five lowest values will use the ID variable to identify these observations. You use a VAR statement to specify which variables you want to analyze. Finally, the HISTOGRAM statement produces a histogram. In this example, the range of scores was set from 30 to 100 at intervals of 5 points.
Here are sections of the output, with a short description below each section:
Output from Program 2.8 (Moments)
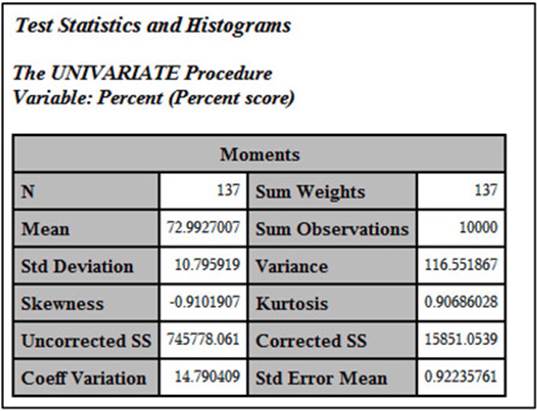
This portion of the output shows you the number of students taking the test (N), the mean, and the standard deviation. The skewness and kurtosis values are useful in deciding if the distribution of scores is normally distributed. Skewness is a statistic that indicates if the distribution is skewed to the right (positive value) or to the left (negative value). A value of 0 indicates that the distribution is not skewed. A normal distribution would have a skewness value of 0. The kurtosis statistic measures if the distribution is too peaked or too flat, relative to a normal distribution. A normal distribution would have a kurtosis value of 0. Most of the other statistics in this table are not of interest in analyzing a test.
Output from Program 2.8 (Basic Statistical Measures)
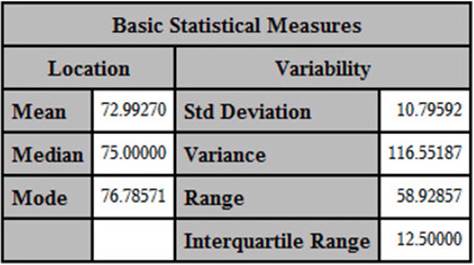
This portion of the output displays most of the common measures of central tendency and dispersion. As you will see in a later chapter on test reliability, larger values for the standard deviation tend to result in tests that are more reliable.
Output from Program 2.8 (Tests for Location)
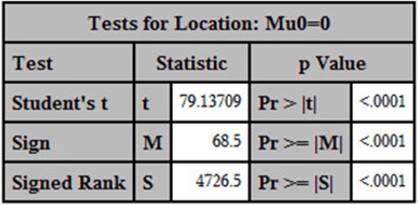
This portion of the output displays statistical tests for the null hypothesis that the mean test score is 0 and, therefore, not useful in this context.
Output from Program 2.8 (Quantiles)
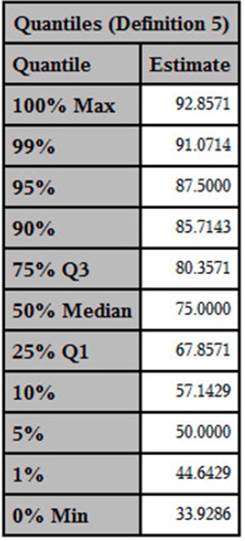
You can use the table of quantiles to give you more information on the distribution of test scores. In this table, you can see that the median score was 75, with the 25th and 75th percentiles equal to 67.8571 and 80.3571, respectively. It also lets you see the highest and lowest scores (91.0714 and 33.9286) on the test.
Output from Program 2.8 (Extreme Observations)
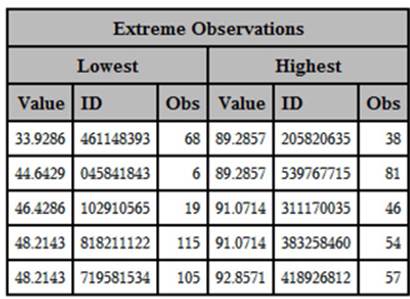
The final tabular output from PROC UNIVARIATE shows you the five highest and five lowest scores on the test, along with the IDs of those students.
Output from Program 2.8 (Histogram)
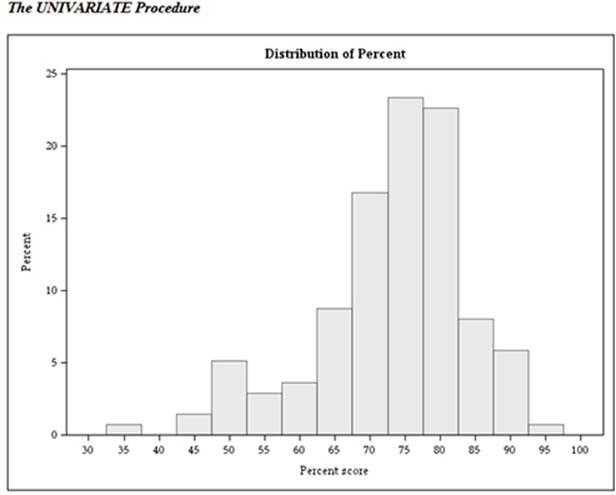
The HISTOGRAM statement produced this rather attractive histogram of test scores. You can change the midpoints easily by choosing different values on the MIDPOINTS option (following the slash on the HISTOGRAM statement).
Matching Student Names with Student IDs
The output from Program 2.1 is useful for posting scores, but you will most likely want a roster showing the student ID, the corresponding student name, and the test scores (and, later, other information). In order to accomplish that goal, you need a file containing student names and IDs. This could be a text file, an Excel worksheet, or some other type of file. For this example, let’s assume you have a text file containing the student name, followed by a comma, followed by the student ID. For example, your file might look something like this:
File c:\books\test scoring\student_name.txt
Fred Flintstone,11111111
Sandy Lynch,12345678
Julia S. Chien,22222222
Jay Pena,33333333
Raul Heizer,44444444
Janet Friend,55555555
Sandy Lowery,66666666
Carl Weber,77777777
Rube Goldberg,88888888
Casey McDonald,99999999
This is a CSV file that you can read using the DSD INFILE option described earlier in this chapter. The program that follows reads the names and IDs from this file and then sorts the file in ID order. The sort is necessary so that you can merge it with the data set containing the student IDs and test scores. Here is the program:
Program 2.9: Creating a SAS Data Set Containing Student Names and IDs
data student_name;
length Name $ 15 ID $ 9 Last_Name $ 10;
infile 'c:\books\test scoring\student.txt' dsd;
input Name ID;
Last_Name = scan(Name,-1," ");
run;
proc sort data=student_name;
by ID;
run;
Since this is a comma-delimited (CSV) file, you use the DSD option on the INFILE statement. Because the Name variable contains both a first and last name, the SCAN function is used to extract the last name (so that it can be used later to provide a roster in alphabetical order by student last name). For those of you who are interested in the programming details, the SCAN function takes a character value and breaks it apart into “words.” Words is in quotes since you can specify delimiters other than blanks when using this function. The first argument of the function is the string you want to parse (take apart); the second argument is which word you want. If you use a negative number for this argument, the function scans from right to left. That is particularly useful when you have a first name, possibly a middle initial, followed by a last name. The right-most word is always the last name. The third argument to the SCAN function is a list of delimiters. In this example, you want to treat blanks as word delimiters. One final word about the SCAN function: If you don’t define a length for the word you are extracting from the character value, SAS assigns a default length of 200. Therefore, whenever you use this function, you want to use a LENGTH statement to assign a length to the extracted word.
You use PROC SORT to sort the student data set in ID order. The BY statement tells the sort which variable or variables you want to use for the sort.
Here is a listing of the student data set:
Output from Program 2.9
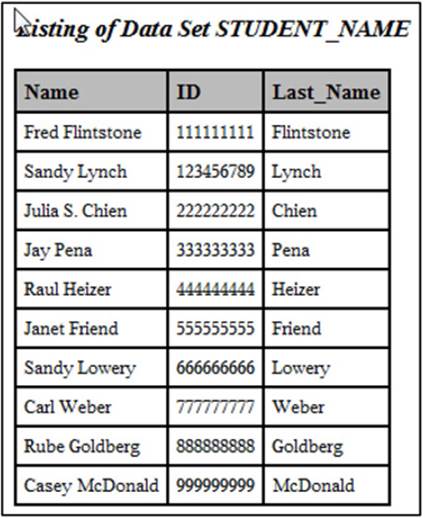
You now have a SAS data set containing the student’s first name, ID, and last name.
You can merge it with the student roster data stored in the data set SCORE. Here is the program:
Program 2.10: Adding Student Names to the Roster
data roster_with_names;
merge score(keep=ID Raw Percent in=in_score) student_name;
by ID;
if in_score;
run;
proc sort data=roster_with_names;
by Last_Name;
run;
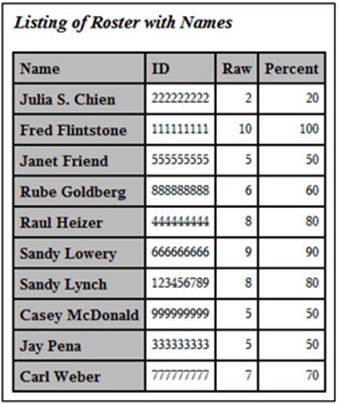
title "Listing of Roster with Names";
proc print data=roster_with_names;
id Name;
var ID Raw Percent;
run;
The DATA step uses a MERGE statement to add the student names associated with each student ID. Because the STUDENT_NAME data set may contain names and IDs of student who did not take the test, you use the IN= data set option to create a temporary variable called IN_SCORE. This variable has a value of true whenever the merge operation finds an ID in the SCORE data set and of false otherwise. The result is a listing of all the students who took the test, along with their names.
Once the merge is completed, you re-sort the data set so that the final listing is ordered by last name. You now have a listing that looks like this:
Output from Program 2.10
Creating a Fancier Roster Using PROC REPORT
Although the report displayed above is fine for most purposes, you can use PROC REPORT to customize the appearance. Here is an example:
Program 2.11: Creating a Fancier Roster Using PROC REPORT
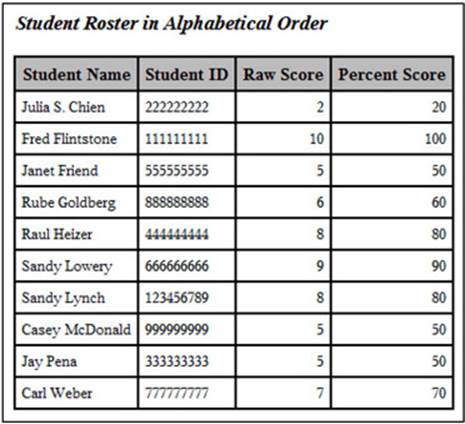
title "Student Roster in Alphabetical Order";
proc report data=roster_with_names nowd headline;
columns Name ID Raw Percent;
define Name / "Student Name" width=15;
define ID / "Student ID" width=10;
define Raw / "Raw Score" width=5;
define Percent / "Percent Score" width=7;
run;
This program produces a more customizable report than the one produced using PROC PRINT. You use a COLUMNS statement to list the names of the variables you want to include in your report and a DEFINE statement for each of these variables. Following a slash on the DEFINE statement, you provide labels and widths. The resulting report is shown below:
Output from Program 2.11
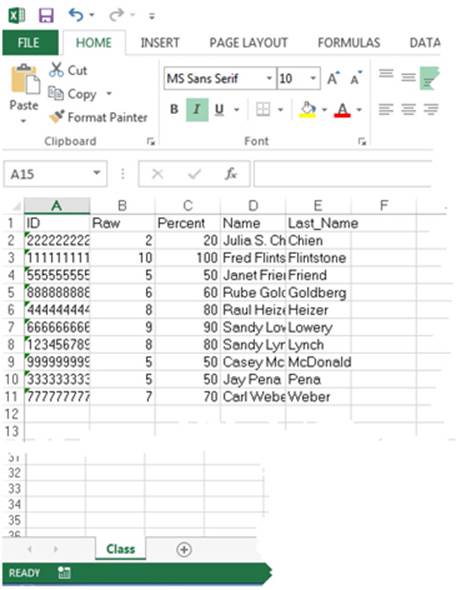
Exporting Your Student Roster to Excel
You may be happy enough to have your student roster in a SAS data set, but you may want to export it to an Excel workbook. You can do this by using the Export Wizard, part of the SAS Display Manager; by using PROC EXPORT; or by using a LIBNAME engine. Here is an example using PROC EXPORT:
Program 2.12: Exporting Your Roster to an Excel Workbook
proc export data= work.roster_with_names
outfile= "c:\books\test scoring\roster.xls"
dbms=excel replace;
sheet="class";
run;
You use the OUTFILE= option to specify the name and location of the Excel workbook, the DBMS= option to specify that you want to export to Excel, and the REPLACE option to overwrite an existing workbook if it already exists. Finally, the SHEET= option lets you enter a name for the specific worksheet you are creating. Below is a picture of the Excel spreadsheet produced by Program 2.12:
Conclusion
You have seen how to read test data from a variety of sources and how to write SAS program to score a test. Because it is inconvenient to write a new program every time you need to score a test, you saw how a SAS macro can be used to automate this process. In Chapter 11, you will see a complete list of test scoring and test analysis macros developed in this book.
You also saw how you can use SAS procedures such as UNIVARIATE, PRINT, and REPORT to display test results. Finally, you saw a way to export test data from a SAS data set to an Excel workbook.
All materials on the site are licensed Creative Commons Attribution-Sharealike 3.0 Unported CC BY-SA 3.0 & GNU Free Documentation License (GFDL)
If you are the copyright holder of any material contained on our site and intend to remove it, please contact our site administrator for approval.
© 2016-2026 All site design rights belong to S.Y.A.