Digital Archaeology (2014)
12. Searching the Network
In ancient civilizations, telecommunications consisted of a runner carrying a printed scroll from the general in the field to the emperor, extolling the successes of the campaign. A high-speed connection was available any time the courier was mounted on a horse. Modern technology has enabled trillions of riders to carry trillions of packages every day. And that is just on a medium-sized corporate network. When crimes are committed on the network, it is a greater challenge to find the culprit and enough presentable evidence to make a case. Instead of just one computer with two or three storage devices, the investigator now is faced with hundreds or even thousands of devices. Where does one begin to look? That is what this chapter is all about.
An Eagle’s Eye View
Suppose for a minute that the president of a medium-sized corporation becomes convinced that one of his executives is about to move over to the competition. If that isn’t bad enough, it is very likely that this woman is in the process of collecting as much information as she can to take with her to her new job. What is the target of the investigator’s search for evidence?
The local area network will consist of several servers and most likely some form of network storage. E-mail communications will be managed by something along the lines of an Exchange server, and there will be Web access to examine. E-mail and the Internet are covered in detail in other chapters of this book, but that still leaves a vast area to search. Most networks of today have remote data centers and disaster recovery sites. Many of a company’s applications are “in the cloud,” meaning that the application—and very likely much of the company’s data—is hosted and managed on the vendors network.
The application service provider (ASP) model allows venders to maintain much more control over their product. Instead of licensing the software, they can now sell the services provided by the software directly to the customer. This benefits the customer because the company sheds the responsibility of maintaining vast arrays of computers needed for the solution, along with the personnel needed to support it. It benefits the vendor because the result is recurring revenue in the form of annualized license fees, annual maintenance contracts, training, and many other sources of income. It becomes a nightmare for the forensics technician who now has multiple networks to consider when looking for data leaks.
Initial Response
The investigation model of a network investigation differs in no way from that of one involving individual computers. Only the processes and tools differ. Therefore, the first step in any network investigation is the first response. The first task is to assess the scope of the problem. And that assumes that a problem actually exists.
The first question to ask any potential victim is “What makes you think you have a problem?” In the example used in the previous section, it becomes necessary to ask the president why he is so convinced the woman is taking information from the corporate network. If he provides a technologically sound and logically coherent answer, there is reason to continue the questioning, and the forensics team should move forward. An answer reflecting little more than paranoid fear requires further triage before extensive resources are committed for a full investigation. If he simply says, “That’s just the sort of thing she would do,” it’s probably not a good idea to book hotel rooms and make airline reservations for the investigative team just yet.
Ask to interview IT personnel, and request traffic logs for the time frame in question. Find out if there has been any evidence that the suspect has transferred files off site. Ways of determining this will be discussed later in the chapter. Ask if the suspect has logged onto the network at any unusual hours, if there has been any remote access activities, or if her e-mail has contained excessive numbers of attachments. If there is time, ask the company’s IT staff to put a protocol sniffer on her network interface and look for unusual FTP traffic. Audit her access to the storage locations where the suspect data is housed, and find out if she’s showing an inordinate interest in researching the company’s history of late.
Assuming that there is sufficient incentive to proceed with the investigation, there is still some triage work to accomplish at this stage. Several questions need to be addressed.
What is the time frame in which the suspected activities occur? Was it an isolated incident involving a single attack or transfer of data? Or has it been an ongoing situation where data may have leaked out over an extended time? A little prodding might be in order here. If there is any possibility of negative publicity or embarrassment, a truthful answer might have to be pried out of executive management.
Are there any other people involved? Is she working alone on this, or does she have help? Even assuming she’s going solo, if there are other people who are aware of her activity, it is possible that they might have information to share. Additionally, it is a good idea to find out whether or not she suspects she is being watched. If she has reason to believe that others are aware of her activities, she is likely to be much more cautious in her behavior.
What network resources are involved? Investigators are going to need to know where the evidence trail might exist. A detailed map of the network would be nice. With many organizations it will also be unlikely. However, any good IT team will be able to give the team a good schematic diagram of the network. What does the network use for storage? Are there any intelligent switches and routers that might have logs that would be useful to examine? Are there ASP systems involved that are going to require cooperation from outside technical staff (and political pressure)?
Is there any evidence that the suspect might be technically astute? If she has a decent understanding of the network and is familiar with the systems involved, then it is more likely that she will be trying to cover her tracks. If she is technically ignorant but is using sophisticated methods to obtain data, then there is evidence that someone else might be involved.
Is the network equipped with an intrusion detection system? If so, do the logs support evidence of any efforts to penetrate the network from the outside? Collect the logs from any such systems, along with proxy server logs, router and switch logs, and remote access server logs for the time frames involved. It’s better to have them and not need them than to need them and not have them. Logs frequently get overwritten over time.
A critical part of the incident response plan is the ability to make certain decisions quickly. Should the team keep the impacted systems connected and active in an effort to identify the perpetrator? Is it more critical to protect sensitive data by either disconnecting or shutting down the targeted systems? Is it possible to conduct covert monitoring of the network connection without imposing unacceptable risk? None of these questions should be answered by the investigative team, but that team is going to need answers very quickly. An effective organization has a response plan in place long before an incident occurs. When this is the situation, response time is significantly faster and risks are reduced. A good response plan focuses on a number of objectives:
• Contact information for IT personnel, management, and digital forensic personnel is immediately available.
• Procedures are in place for analyzing the nature and the extent of an event.
• Tools are available and in place for collecting and preserving information associated with the event.
• Communications lines are available to the response team that won’t be tapped by targets of investigation.
• A method exists for returning targeted systems to normal operation in the shortest time.
• A post-incident review will collect all the necessary facts into a conclusive report.
• Evidence collected will be safely stored, with appropriate chain of custody documented.
Proactive Collection of Evidence
There are two phases involved in collecting evidence. In the event of an investigation into ongoing activity, it is very likely that proactive collection of evidence while the activities are occurring will be feasible. Situations that would suggest such an approach include
• Current and ongoing intrusions
• When there is ongoing theft of data
• Misuse of company resources
• Suspicion of data export
• When internal systems may have been compromised
• When ascertaining whether malicious software has been embedded in the system
• In order to determine how the intrusion was accomplished
The second phase would be post-incident collection of evidence. This is the search for artifacts left over from the event. Virtually every investigation will involve some level of post-incident collection. This phase will be discussed later in the chapter.
In the previous section, the importance of collecting logs was mentioned. In addition to network logs, the user’s local system is likely to be a source of potentially important, but temporary, evidence. If possible, get a snapshot of the suspect system. Depending on the time structure provided by the scope of the investigation, it might be possible to configure the user’s machine and network connections to collect data that contains evidentiary value. Such tools can provide a plethora of information that will be very useful later in the investigation. Some of the items to consider include keyloggers, network auditing tools, and network capture tools. Note that many tools, including the keyloggers and certain types of network capture hardware, are considered to be a form of wiretap, as discussed next, and proper legal authorization must be acquired before putting them to use.
Keyloggers
Keyloggers are either software or hardware devices that record keystrokes and output them as a continual string to a file. Using such a tool allows an investigator to collect passwords as well as record commands issued from the command line. Examples of this tool include Keyghost, which is a small module that plugs into the keyboard and stores up to two million keystrokes in flash memory. Keygrabber Wi-Fi by KeeLog collects up to 2GB worth of keystroke data and sends it to a preconfigured e-mail address. These are only two examples in a long list.
Software keystroke loggers require installation on the host computer and are more likely to be detected by an astute user. The application generally has a very small footprint and creates a plain text file that is store on the local computer or on a network location in a hidden read-only file. Some of the more advanced versions can even capture data that was not typed manually. For example, applications such as Computer Watchdog and KeyCapture don’t simply capture keystrokes. They also record what applications were launched, what files were downloaded, and what file system resources were accessed during each capture session.
Keyloggers, whether software or hardware based, fall under the category of interception devices. This is based on a court decision that “interception occurs when a communication is captured or redirected in any way” (U.S. v. Rodriguez 1992). As such, their use is governed by federal and state law.
In the corporate environment, it generally will not be a problem to insert keystroke loggers into any computer system owned by the company. To be safe, the company should have each employee read and sign a standard policy document that defines what rights the company reserves in this regard. The existence of such a document goes a long way in protecting an organization from charges surrounding the invasion of privacy. United States v. Simons established that the presence of an established company policy, combined with a legitimate business interest in monitoring employee conduct, dispelled any perceived expectation of privacy (U.S. v. Simons 2000).
Different issues surround the tapping of private computers. In United States v. Nicodema S. Scarfo, et al., the court held that the use of a keystroke logger did not violate the ECPA. However, in this case, the software was designed specifically to work only when the computer was not hooked up to the modem. The Fourth Amendment issues raised by the defense were denied by the court as well, stating that keyboard capture was not similar to a “blanket search” (Etzioni 2002).
It should also be noted that there are some exceptions to the laws. Naturally, any court order will allow the use of any interception device. The consent exception specifies that if any one party involved in a communications link is aware of and consents to the interception of the communication, other parties need not be informed (18 U.S.C. § 2511, 2008). The Ordinary Course of Business exception allows the interception of communications through any device used in the performance of day-to-day tasks. A common example of this is the recorded hold message people frequently hear that informs them that their call may be monitored for this or that reason.
System Auditing
Most network operating systems have some fairly sophisticated methods for auditing a wide variety of activities on many levels. This includes login activities for users and a variety of other functions. To enable auditing on a Windows server, do the following:
1. Open Administrative Tools. Local Security Settings.
2. Expand Local Policies (will open the window shown in Figure 12.1).
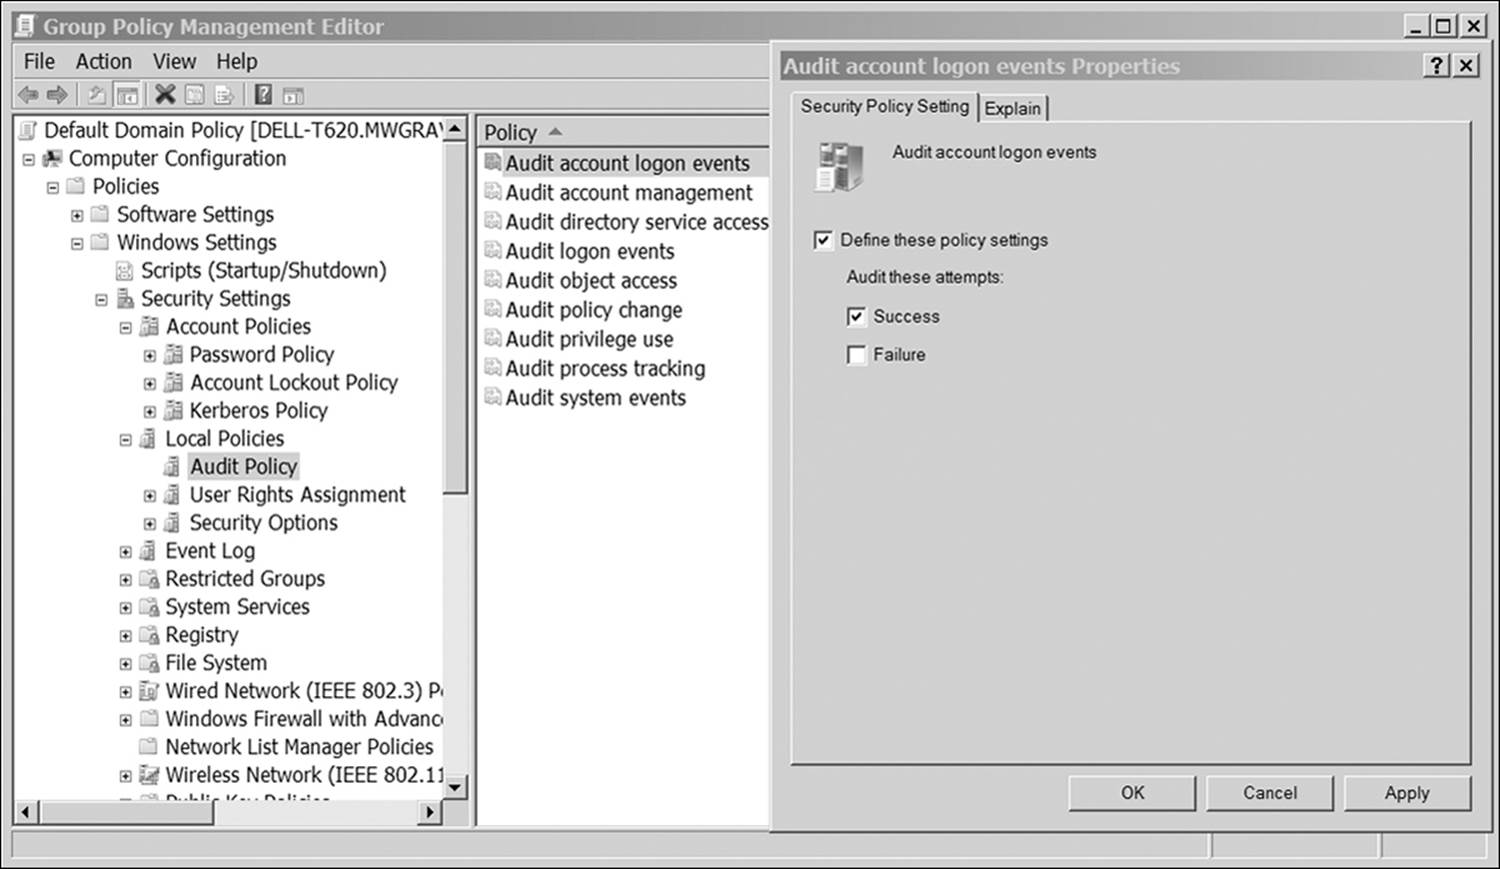
Figure 12.1 Enabling auditing events in Windows server
3. Select Audit Policy.
4. Select the events to be audited.
Audits can be based on success, failure, or both. Some critical activities to audit include
• Access to network objects, including NFS files and folders: This allows the administrator to keep track of who is trying to gain access to sensitive information.
• Login attempts: Lets the administrator know when people are logging into the network.
• Modifications to user account security settings: If a user with appropriate rights is misusing his or her authority to change settings, this will uncover who is doing it and what changes are being made.
• Write access for program files: If unexpected processes are running on the server, this generates a log of when they are running and who the owner of the process is.
• Policy changes: Hackers may attempt to make policy changes to network servers in order to facilitate certain types of attack.
Before setting out to audit the network, a little planning is in order. Decide precisely what information needs to be collected in the process. Audit logs can grow quickly, and selecting unnecessary objects to track only exacerbates the situation. Archive the existing logs and clear them so a fresh slate appears. Keep the old ones so that any evidence of earlier activity is preserved.
Configure the system to audit system events as well. On Windows servers, tracking event messages with the 517 number allows the investigator to see if somebody has altered the actual audit logs. A 519 event indicates that an invalid remote procedure call was attempted on the system. If somebody attempts to change the system time in order to falsify MAC labels on files or e-mail messages, a 520 event will be generated. The investigator can take the time the change was made and use it to frame any suspect activity during the time between the first and last resets.
Network Capture
There are a number of powerful tools available that allow the capture of data packets as they cross the network medium. There can be problems in capturing and analyzing live data when it comes to generating admissible evidence. For one thing, the source of the evidence is not actually in the direct control of the investigator. Packets are being captured over an intermediate device. This brings into question the validity of the data. Since the source of the data cannot be packaged into a forensically sound image, it will be up to the investigator to be able to define the methods used in the capture of data and to defend the integrity of the findings.
When presenting evidence from a single computer system, hard drive, or other static device, it is possible to prepare a primary image of the data source and use copies for all subsequent analysis. Network analysis involves a lot of random data moving back and forth between multiple devices. The investigator must capture all that information, filter out the relevant information, and verify its authenticity.
Verifying Authenticity
Verifying authenticity is the hard part, because there are so many tools a hacker can use to cover his tracks. Additionally some perfectly legitimate processes confuse the legitimacy of network analysis. For example, proxy servers alter the source IP to keep it anonymous to the outside world. Onion routing is a secure transmission method that encrypts data in multiple layers and then bounces it over a series of specialized routers—the onion routers. Each router removes a single layer of encryption, reads the routing information assigned to it, and then strips off the routing information of packets before sending them along to the next router in the path. As such, none of the intermediary routers know the origin or the destination of a packet. Anonymous remailers are mail servers that take SMTP messages, read embedded code that tells them where to forward the message, and then alter the originating IP.
Other techniques are not so legitimate. IP spoofing software strips out information such as the IP address of the original client and replaces it with bogus information. DNS cache poisoning occurs whenever an attacker replaces the IP address of a legitimate machine on the network with that of a device under the attacker’s control. After that, whenever the DNS server gets a request for the legitimate device, the request is forwarded to the hacker’s machine.
All these techniques, along with dozens of others, make it difficult for the investigator to qualify the legitimacy of information gathered during a live capture. The investigator accomplishes this by using well-documented tools and techniques.
Identifying Traffic
The first step is to carefully identify all sources of network traffic being captured. Sources of network activity include
• Ethernet connections
• Wireless network connections (including Wi-Fi hotspots)
• Bluetooth devices
• Router interfaces
• Intranet addresses
• Internet addresses
Once the sources of data have been identified, a network sniffer, such as WireShark, CommView, or OmniPeek, is used to capture and analyze the data. (A Microsoft tool called Network Monitor can also be used; however, it has fewer forensic capabilities than dedicated applications.) Most investigations involve capturing data in a specific time frame, known as the acquisition window. Also, the acquisition will most likely be done on a single segment within the network. A 100MB segment functioning at full duplex (100% capacity) would require approximately 45GB of storage per hour of capture. Networks rarely operate at full capacity. Therefore, an external 2TB drive (approximately $150 at the time of this writing) would store more than 44 hours of capture.
For continuous monitoring of a full network, there are advanced hardware/software turnkey solutions that have very powerful capabilities. A company called Endace manufactures an entire line of hardware solutions dedicated to network capture. One of these, EndaceExtreme, can do continuous capture over a 100GB network, storing capture data into volumes with up to 96TB capacity. Riverbed’s Cascade Shark handles multiple interfaces up to 100GB with a maximum storage capacity of 32TB. Network Instruments’ Observer is limited in capacity to the amount of storage available on the network. This makes the product extremely scalable because storage area network (SAN) or network attached storage (NAS) devices can be continuously added if necessary.
Archiving the results of continuous network monitoring can be very resource intensive. Most solutions are designed to flow data through the system. As storage capacity fills, older data is deleted from the beginning of the archive as newer data appends the file. In the course of an investigation, it is probable that the data capture for a specific acquisition window must be archived, hashed, and stored. For today’s high-speed networks, the amount of space required for such an archive can be quite intimidating to smaller organizations. For example, a gigabit Ethernet working at 65% capacity generates about 81.25MB/sec of data. A 1TB hard disk would be able to store a little under 3.5 hours of network traffic. Table 12.1 lists storage requirements for several network scenarios.
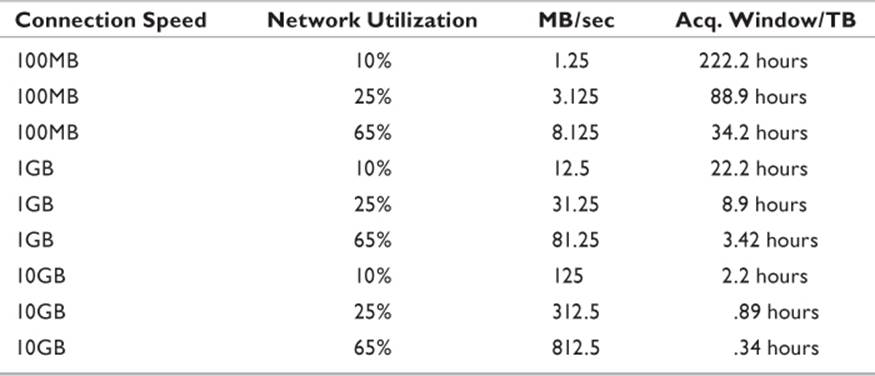
Table 12.1 Storage Requirements for Network Capture
Capturing network traffic solves two problems. Dynamic network traffic is difficult, if not impossible, to analyze forensically in real time. Additionally, the “image” in the network changes every few nanoseconds. A preserved stream of network traffic provides an accurate picture of everything that happened on the network medium during the acquisition window. Multiple examiners can analyze the data, knowing everybody involved is seeing the same thing.
At the same time, it represents a static image of a nonstatic event that occurred between multiple entities. In other words, the network capture collected all of the communications that occurred during that time between every device that was live on the network. Network protocols give a specific device the ability to “ignore” packets not intended for its attention. The investigator uses the tools at her disposal to sift through the collection of data looking for packets specific to a problem. A conversation between network stations can be analyzed. If necessary, timelines can be generated from the time stamps on the collected packets.
Tools such as Wireshark provide the ability to filter the collection of packets based on one or more criteria specified by the investigator. Boolean operators allow a range of options for each filter. For example, if a specific workstation is being monitored, the application can be asked to filter out all packets except those originating from or intended for a specific IP address. Individual sessions between two network entities can be isolated and studied.
Performing a Network Capture
Capturing network data isn’t difficult. Any device with a network interface adapter that can work in promiscuous mode allows the investigator to perform this task. Typically a network interface card (NIC) filters out all packets on the wire intended for another destination, processing only those targeted for the local system. In promiscuous mode, the adapter will process every frame that passes the interface. Windows drivers typically do not have the ability to set the device to this mode. This is done in the settings of the software doing the network capture.
In the following examples, we will be using Wireshark (Figure 12.2) to capture and analyze a packet stream. The first thing is to tell Wireshark to work in promiscuous mode. There are a few other options that need to be configured, so this section will first discuss the Wireshark configuration that will be used for this example (Figure 12.3).
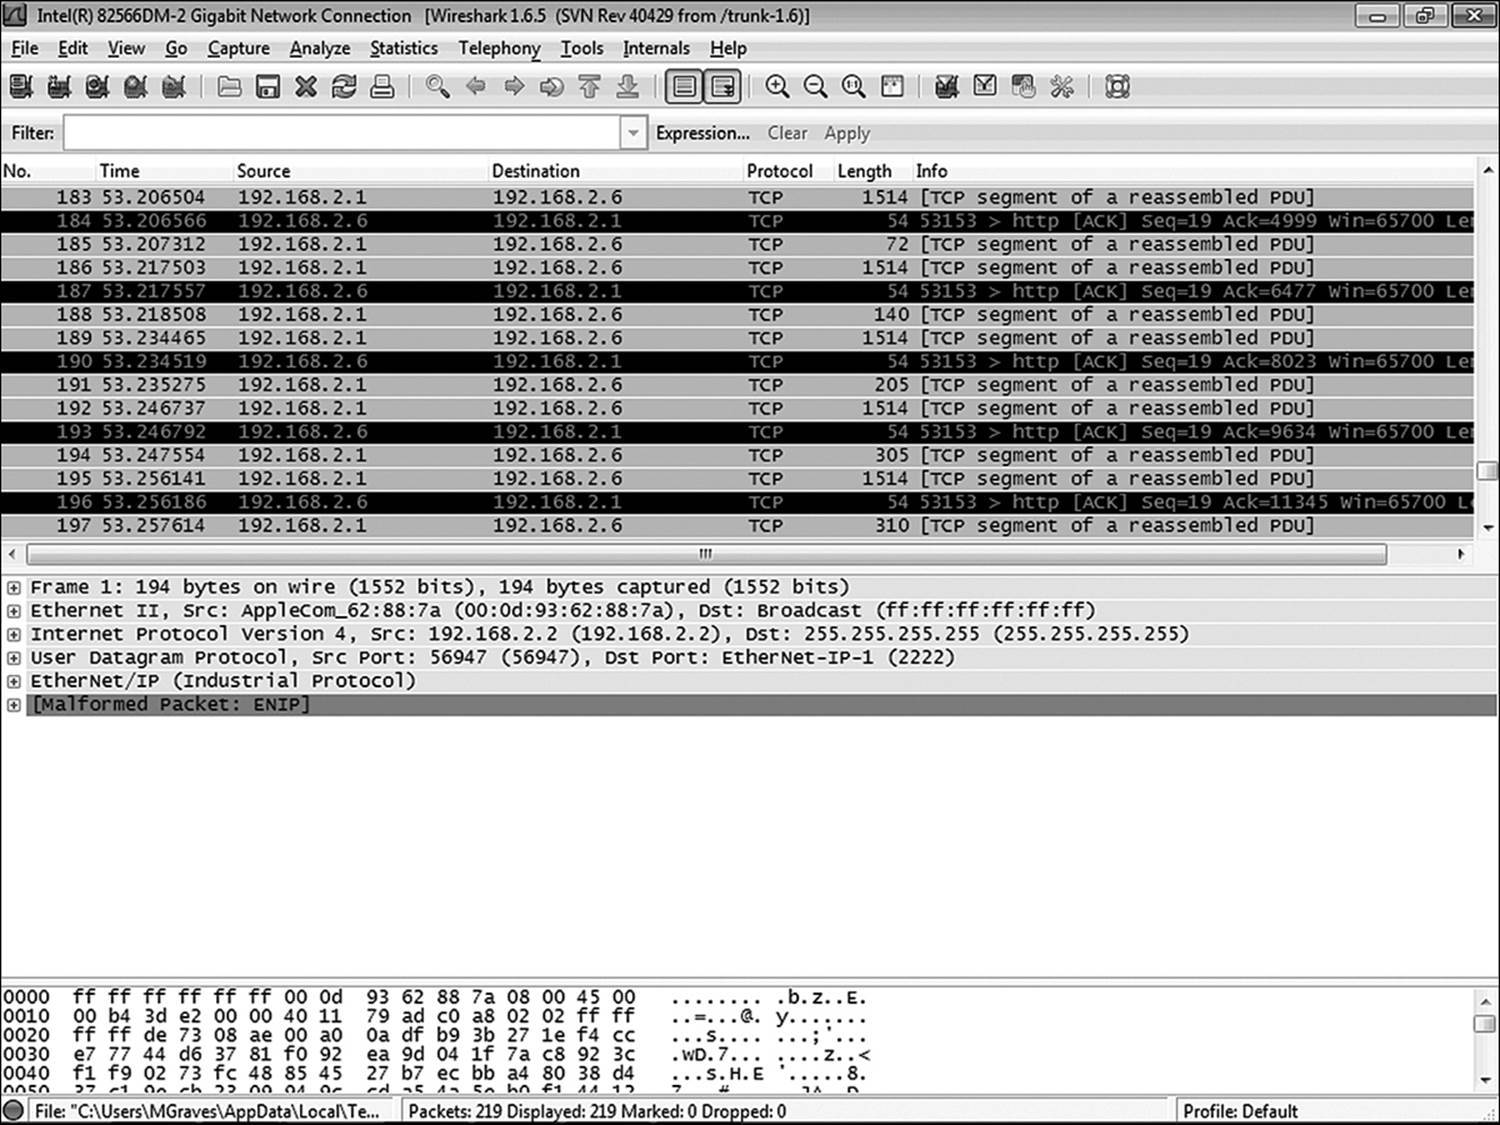
Figure 12.2 Wireshark is a very powerful open-source application that allows the investigator to perform network capture.
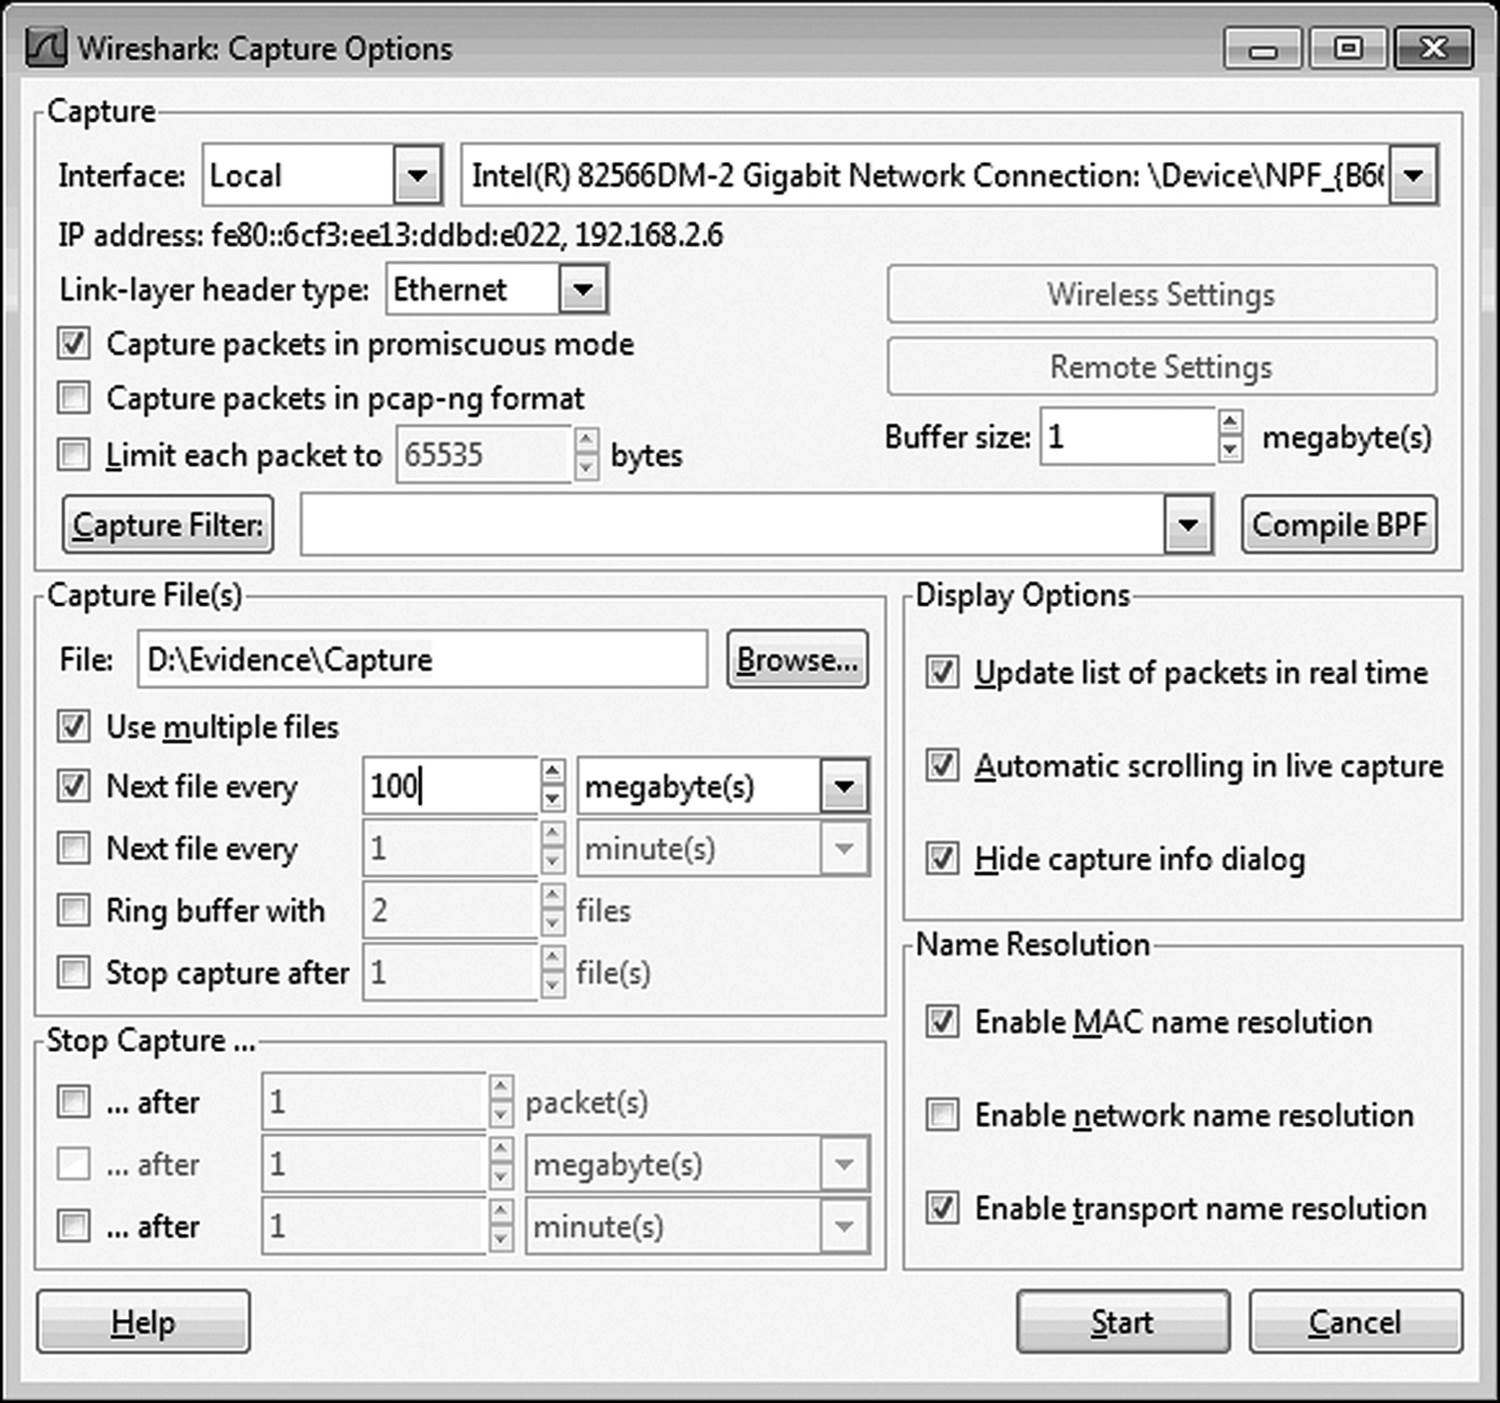
Figure 12.3 Wireshark has several configuration options. Promiscuous mode is set by default and rarely needs to be changed.
First of all, make sure the box labeled Capture in Promiscuous Mode is checked. Without this option, only packets intended for the local machine will be collected. The PCAP-NG option is available if your analysis software supports the file. By default, Wireshark uses the PCAP (Packet Capture). This is the standby file format for storing captured network packets in a file that can be analyzed by various software packages. PCAP-NG (Packet Capture, Next Generation) stores information not collected by PCAP. Among the pieces of information collected are
• Extended time stamp information
• Interface identification information
• A deeper set of capture statistics
• Name resolution information
• Any user comments that have been embedded
Two other settings that should be configured by the investigator appear in this window. The path to the directory where Wireshark should store the file needs to be configured. Otherwise, it will try to store it to the Wireshark directory on the drive where the application is installed. This might not be desirable if really huge files are to be collected or if the host drive is not likely to be available during later analysis.
If it is anticipated that the acquisition window is going to be large, it might be better to capture multiple files rather than a single large file. By default, Wireshark captures everything in a single file. In the example shown in Figure 12.3, the application is configured to start a new file every 100MB. This allows smaller files for analysis in the event of extended capture times.
Once the options are configured, it is time to start capturing data. One of the options for starting a capture is to click the Start button after configuring the options. Otherwise, the investigator can click Capture. Start (or CTRL + E). When enough data has been collected, click Capture. Stop (or press CTRL + E again). Wireshark’s display is divided into two panels. The upper panel is called the packet list pane (A in Figure 12.4). In this window it is possible to scroll through every packet captured or view packets based on the application of any of the many filters available within Wireshark. The lower pane is the packet details pane (B in Figure 12.4). This shows the contents of whatever packet is highlighted in the packet list pane.
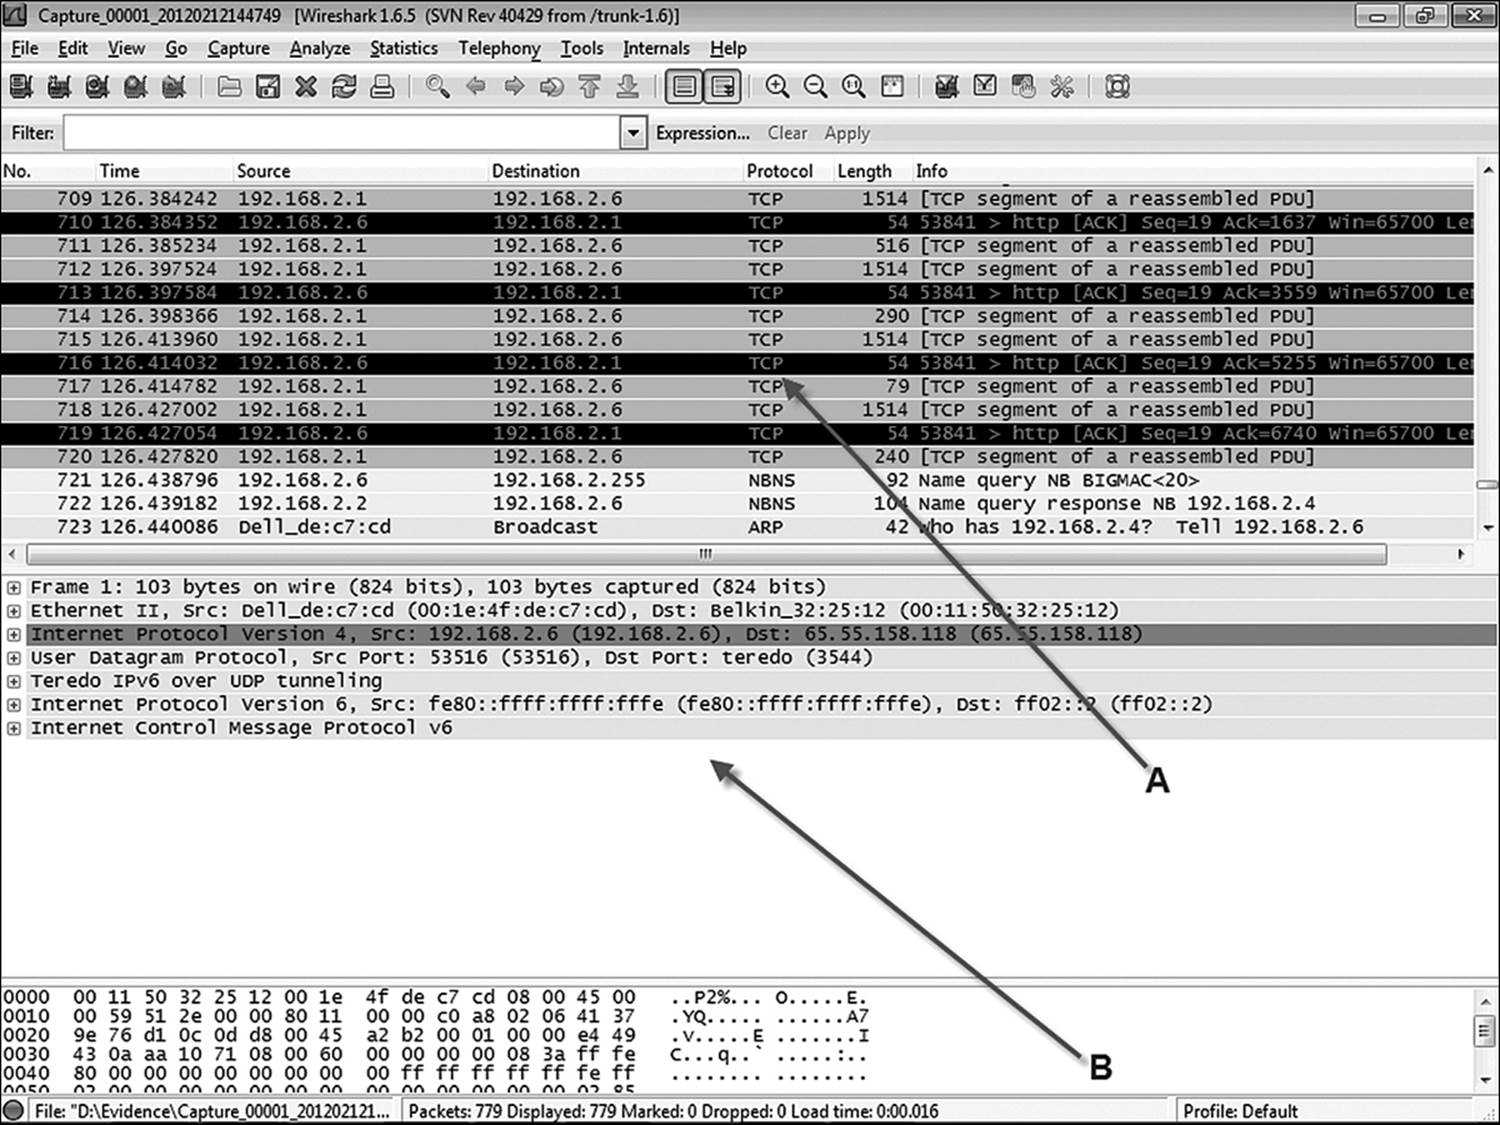
Figure 12.4 A is the Wireshark packet list pane, and B is the Wireshark packet details frame.
Now that the data has been collected, analysis consists of applying the appropriate filter to isolate only those packets relevant to the search. In Figure 12.5, Wireshark has been asked to show only packets that contain the IP address of 192.168.2.2. (Note that the host IP is 192.168.2.6.)
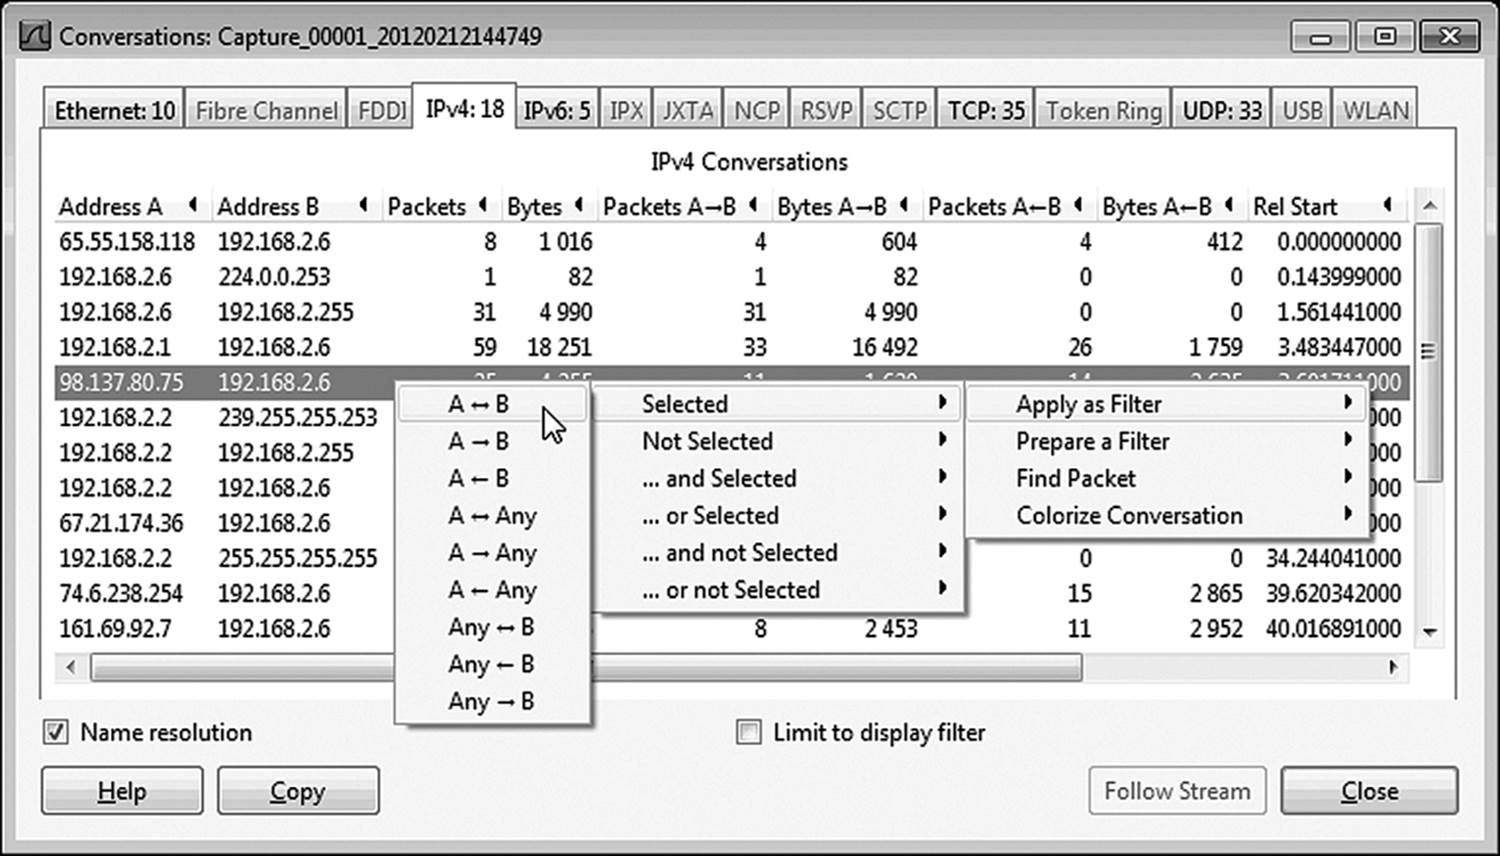
Figure 12.5 Wireshark has the ability to filter out only the packets relevant to a single conversation.
It is also possible to isolate a single conversation between two devices. This is referred to as sessionizing. A conversation is just what it sounds like—the exchange of packets between two devices in the course of completing a single communications session. Click on Statistics. Conversations and the window shown in Figure 12.5 will appear.
Select a specific conversation that is of particular interest, right-click on that selection, and select. In the example shown in Figure 12.5, the option to select a conversation including packets going in either direction between the two specific IP addresses in the selected conversation has been chosen. Other options include
• A ← B: Only packets traveling from the selected source IP to the selected destination IP
• A ↔ B: Only packets traveling from the selected destination IP to the selected source IP
• A → Any: All packets moving from the source IP to any destination or any destination to the source IP
• A ← Any: All packets moving from the source IP to any destination
• A ↔ Any: All packets moving from any destination to the source IP
• Any → B: All packets moving in either direction between any destination and the IP identified as the destination in the selected conversation
• Any ← B: All packets moving from any destination to the IP identified as the destination in the selected conversation
• Any ↔ B: All packets moving from the IP identified as the destination in the selected conversation to any destination
It should be quite evident by now that Wireshark is a very powerful tool for the network forensic investigator. Several entire volumes have been written on how to use Wireshark as a network diagnostics tool and as a forensics tool. A complete discussion would be beyond the scope of this book.
Live Connection Information
If the system is currently logged on and running, there is a lot of information that may be useful that will disappear once the system is shut down. A small batch file can collect some of this vital information into a text file. The batch file is very short and can be run from a removable USB drive. Each command performs a specific function and outputs the results to a text file called netstats.txt. (Note that the batch file should be edited to point the text file to the drive letter specific to the removable USB drive on the local system. Additionally, batch files should always be created in a basic text editor, such as Notepad, and not with word processing tools that add formatting bytes.) The single bracket in the first line creates a new text file called netstats.txt. The following lines all contain double brackets, which append the existing file without overwriting any of the existing data within the file. The file is as follows:
time /T > netstats.txt
date /T >> netstats.txt
ipconfig /all >> netstats.txt
netstat >> netstats.txt
net user >> netstats.txt
net accounts >> netstats.txt
net start >> netstats.txt
net use >> netstats.txt
net session >> netstats.txt
net share >> netstats.txt
net file >> netstats.txt
The first two lines, as is obvious, record the time and date—as configured on the system. If the system time is different from the actual time, it needs to be independently documented. The third line pipes the complete TCP/IP configuration to the text file. The netstat command lists every network connection made to the system over the network adapter. Net user identifies what user ID was used to log onto the system. Net accounts is used to update the network accounts database and to modify password requirements. Without any parameters defined, the command spells out the password policy enforced on the system. The net use command is typically used to connect or disconnect the system to network resources. Used without any parameters, it will return a list of active network connections. Net sessions identifies any currently active sessions on the computer. (Note that this command can also be run from the command line to forcibly disconnect any untrustworthy sessions identified. The syntax for this command is net sessions \\computername/delete.) Net share lists all of the shared resources on the local system. Net file displays all files on the local system currently opened by network clients. As with net session, the command can be used to forcibly close a file open on the system. The syntax is net file 2 /close (where 2 is the identifier of the file, as provided by a previous execution of the net file command).
Post-Incident Collection of Evidence
A great deal of evidence can be collected from a variety of sources after the event has transpired—assuming of course that it hasn’t been overwritten or deleted. There will be a number of files that the investigator will want to acquire while the iron is still hot, so to speak. There is a wide variety of event and application logs that can be a gold mine of information. Additionally, the registry can potentially provide valuable details.
Network operating systems differ in how they collect logs. However, there is a great deal of consistency in what information is collected. It is beyond the scope of this book to cover every platform in detail. Since Windows networks represent the majority of those the investigator will see, this discussion will concentrate on the log files generated by a Windows Server operating system. The different log files generated by a Windows system include system event logs and text logs generated by different services and applications running on the server.
Event Logs
Windows servers, by default, log a wide variety of events. What events are logged is a function of what version of Windows Server is running on the system. A glaring example is that versions prior to Windows 2003 Server did not enable security logging by default. An administrator had to proactively configure this feature, along what logging events to track, on the system. For the most part, all other logs are similar across versions. They can be configured by an administrator to log additional items. Three logs of significance to the investigator are the application log, system log, and security log.
Installation and uninstallation of different applications is logged in the application log (Figure 12.6). Additionally, significant events generated by individual applications will show up here. A good example of this is antivirus programs. They will frequently record the detection of suspected viruses here as well as in their own logs. All program updates will appear here as well. Looking in the application log can indicate when unauthorized software is installed on the system. If a user temporarily disables an application for any reason, this type of event is recorded.
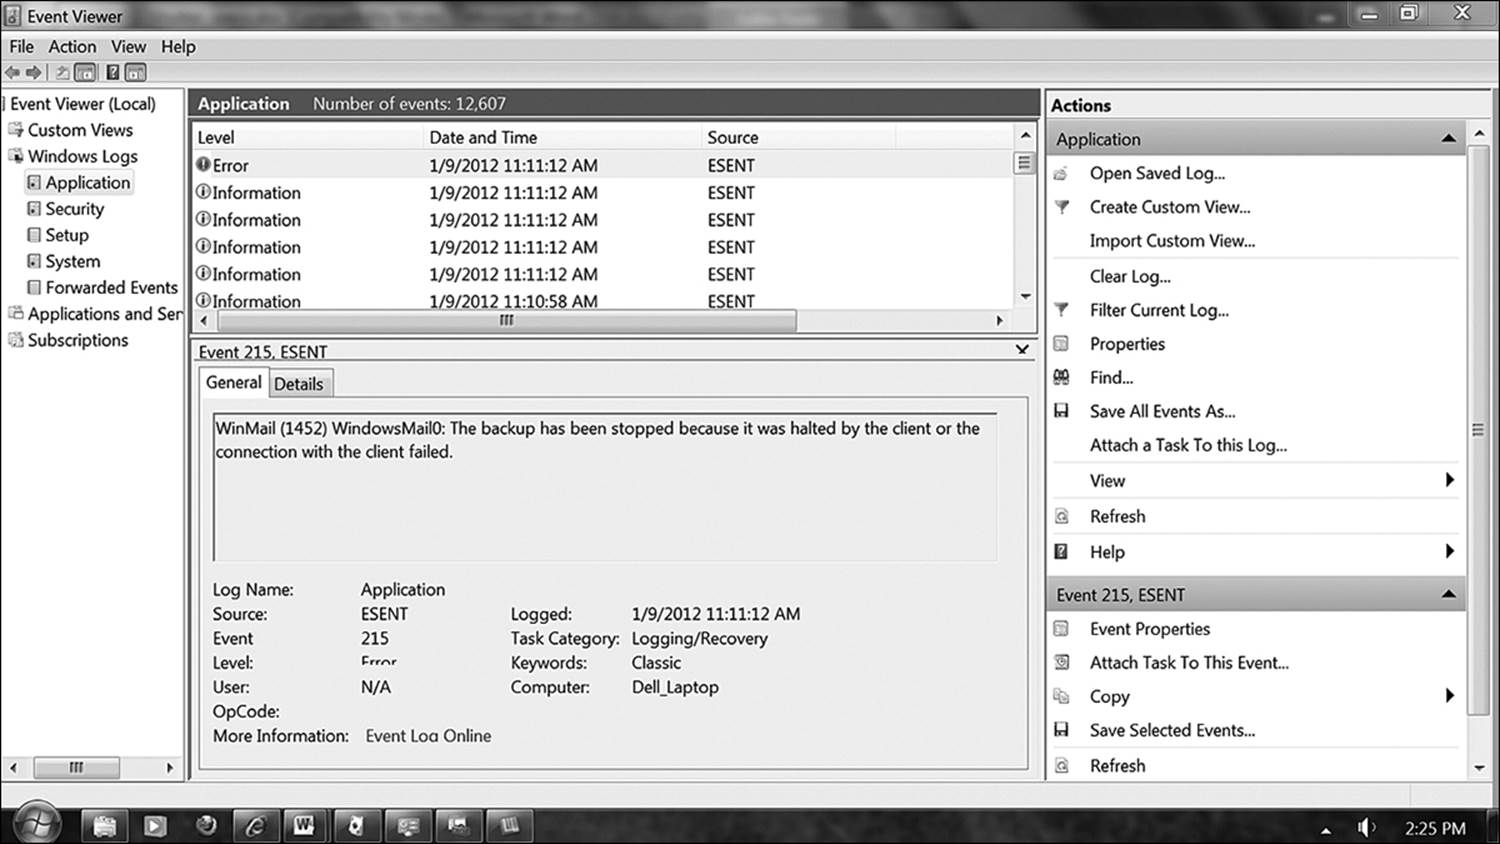
Figure 12.6 The application log talks about successes and failures by applications. In this example, Windows Mail failed because it was opened at a time when there was no network connection available.
The system log (Figure 12.7) records events specific to the day-to-day running of the system. One area of interest to an investigation might be the ability to show when system services are started or stopped. Specific times that these events occur appear here. Also, device drivers that are loaded on the fly (such as USB storage devices) will generate an event. This type of information can be used to confirm the presence of such devices and precisely what time (based on system time) they occurred. If the user tried to falsify the time of an action by changing the system time, the system log will record that as well.
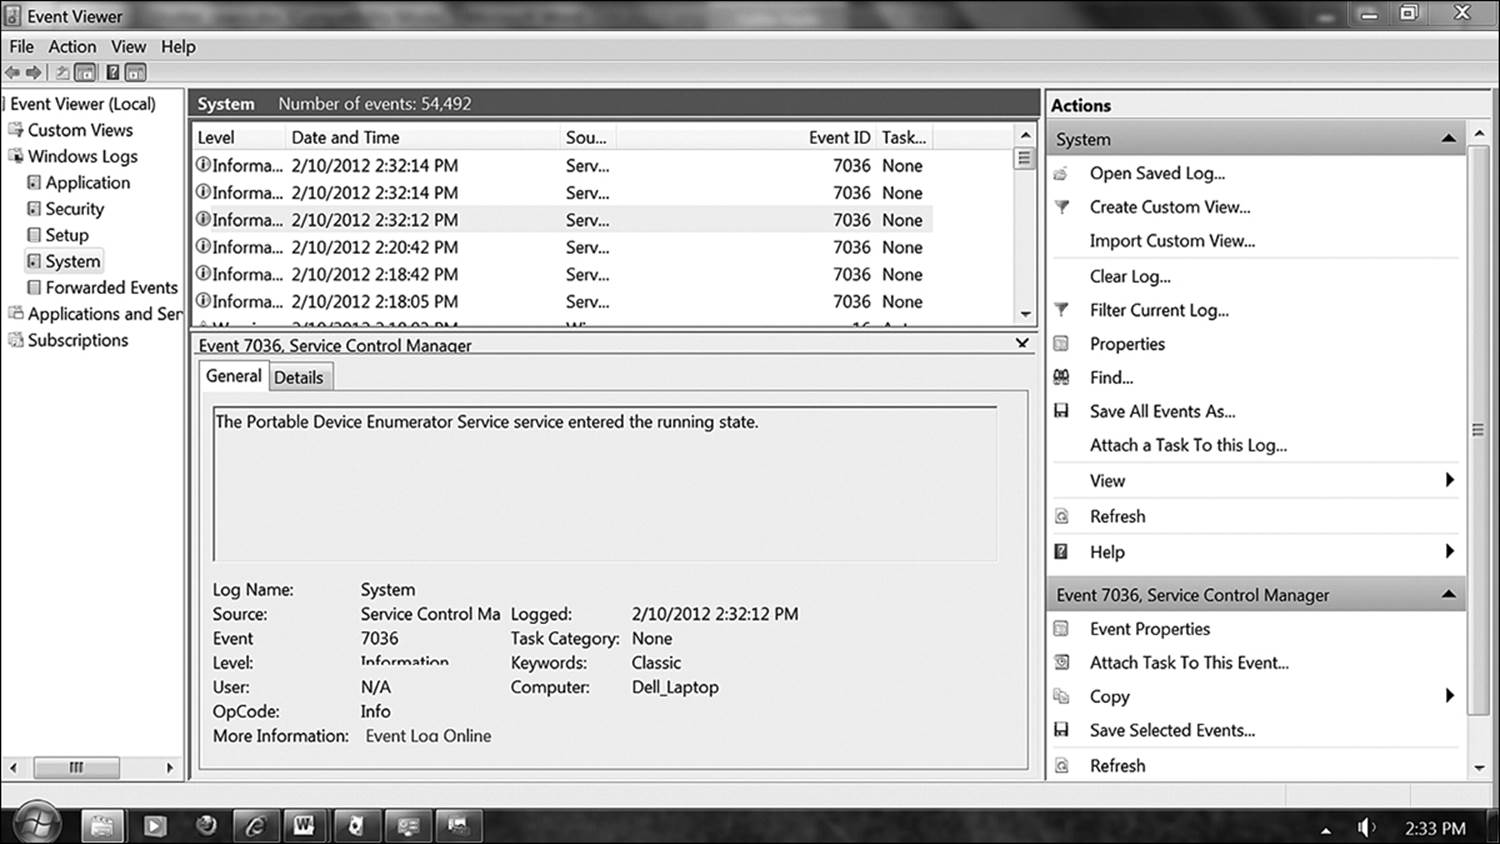
Figure 12.7 The system log records operating system events. This example is one of a successful event providing valuable information. Event viewer is reporting the precise time and date that a portable storage device was inserted into the system.
The security log (Figure 12.8) is the investigator’s playground. All login information for every user who connects to the system is recorded here, whether successful or unsuccessful. If a new account is created, an event is generated. An administrator can configure the system to audit file access as well. A valuable piece of information to be gleaned from this log is the execution of elevated privileges. In this way, all attempts to access resources on the system will be recorded.
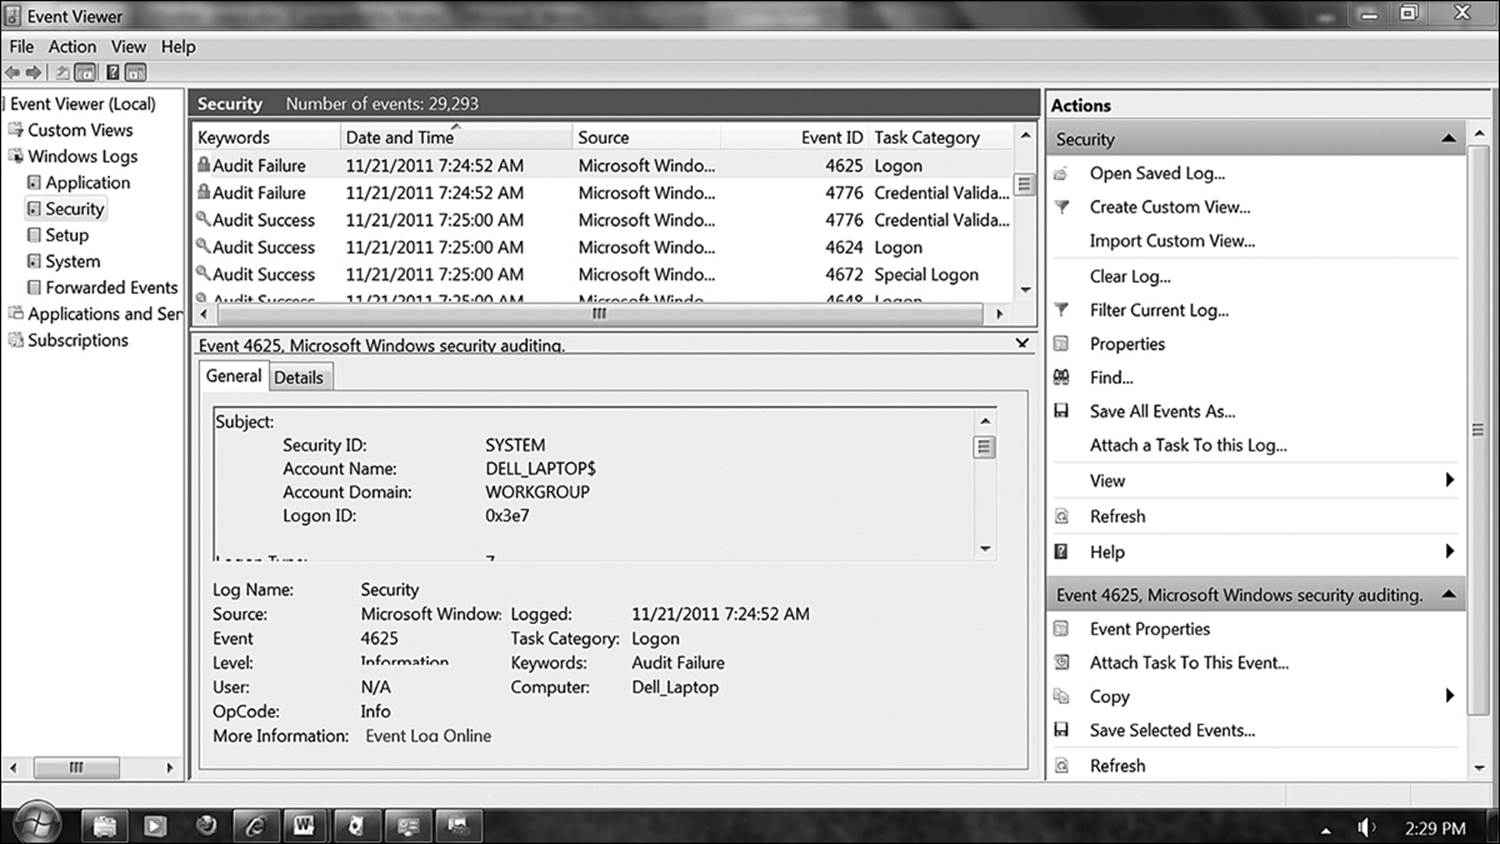
Figure 12.8 The security log tracks events specific to accounts and privileges. Here, Event Viewer reports a failed attempt by a system account to access a network location.
Searching the security log for login information is made easier by searching for specific event types. Knowing event IDs specific to the event helps greatly in searching the logs. For example, the log may contain hundreds of thousands of entries specific to login attempts, but as an investigator you are only interested in log failures. Or perhaps, it is more critical to find the place where an attempt was successful. Table 12.2 lists event codes used by Microsoft operating systems that are specific to logging events.
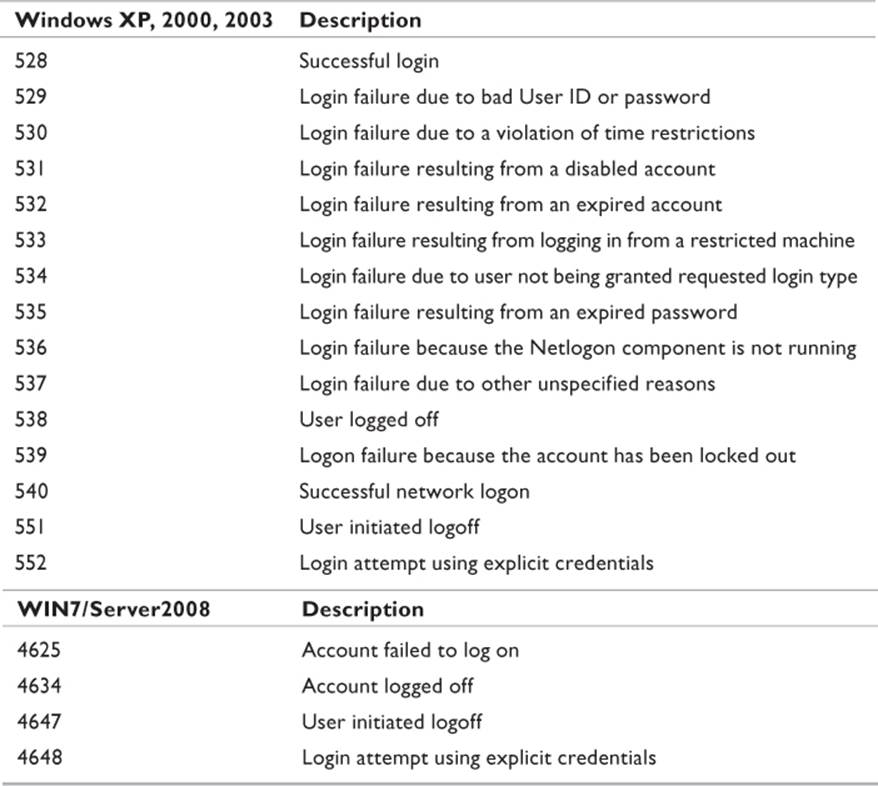
Table 12.2 Microsoft Logging Event IDs
Application Logs
The operating system and many core applications, such as Exchange, SQL Server, and Internet Information Services, maintain relatively detailed histories of activity. Some of these are in text format, while others are in dedicated log formats. Chapter 11, “Web Forensics,” had a detailed discussion of log formats and a number of the significant log files used for Web-based applications. Most, if not all, of the log files discussed in that chapter are also relevant to network forensics. Today’s applications frequently make use of Web-based architecture, and services such as IIS are required for their functionality. Activities relevant to such applications will be found there.
SQL Server is a database engine used by a large number of software products used in many industries. Somebody tapping into the corporate network is very likely in search of information. Information is generally found in the company databases. Three SQL logs of interest to the investigator are
• SQL Server Profiler Log: This file, named log.trc, in the %ProgramFiles%\ Microsoft SQL Server\MSSQL.1\MSSQL\LOG directory, maintains records of events related to database activity. It is generally analyzed through Microsoft’s SQL Server Profiler tool.
• SQL Server Agent Log: This file records errors and warnings relevant to jobs and queries run against the database. This can indicate if somebody is making repeated efforts to access a database. It is called SQLAGENT.OUT and is located in the %ProgramFiles%\Microsoft SQL Server\MSSQL.1\MSSQL\LOG directory.
• SQL Server Error Log: Typically, this file is used for troubleshooting SQL problems. However, since somebody hacking a system tends to create problems, this is a good place to find out if unusual activity related to the databases is going on. The file is named simply ERRORLOG and is located in the %Program-Files%\Microsoft SQL Server\MSSQL.1MSSQL\LOG\ERRORLOG directory.
On a DNS server, the DNS logs can be of interest as well. The logs will tell the investigator what domains were queried from inside the network. The caveat here is that the administrator must have previously enabled DNS logging. This option is not enabled by default when DNS is configured. The DNS debug log file will be found in %systemroot%\System32\DNS\DNS.log. DNS logs can be read in a simple text editor. However, for more powerful search and analysis, one of the log file analysis tools discussed in Chapter 11 will be more appropriate.
Antivirus logs may contain information pointing to attempts to insert malware into the system. The activity logs are the files of interest. Typically, the manufacturer expects these files to be viewed from the client application. From a forensic standpoint, this is the least desirable method. Many of the log file parsers discussed in Chapter 11 will open files from common vendors, such as Norton or McAfee.
Locations of the files vary with the manufacturer and the version. The following is a list of file locations used by Symantec and McAfee. A popular antivirus software used by consumers is AVG Antivirus and has been included here as well.
• Symantec Antivirus Corporate Edition
• WIN2000/XP2003: %SystemDrive%\Documents and Settings\All Users\Application Data\Symantec\Symantec AntiVirus Corporate Edition\7.5\Logs
• WIN98/ME: %SystemDrive%\Program Files\Symantec_Client_Security\Symantec AntiVirus\Logs
• McAfee Antivirus
• Host Intrusion Files: C:\Documents and Settings\All Users\Application Data\McAfee\Host Intrusion Prevention\. Folder containing log files pertaining to attempted intrusions.
• Desktop Protection Files: C:\Documents and Settings\All Users\Application Data\McAfee\DesktopProtection. Folder containing log files pertaining to local resources.
• AccessProtectionLog.txt: C:\Documents and Settings\All Users\Application Data\McAfee\DesktopProtection\AccessProtectionLog.txt. Logs attempts to access protected resources.
• BufferOverflowProtectionLog.txt: C:\Documents and Settings\All Users\Application Data\McAfee\DesktopProtection\BufferOverflowProtectionLog.txt. Of little use to the investigator. Records events that result in buffer overflows.
• EmailOnDeliveryLog.txt: C:\Documents and Settings\All Users\Application Data\McAfee\DesktopProtection\EmailOnDeliveryLog.txt. Records events triggered by scanning incoming e-mails and their attachments.
• OnAccessScanLog.txt: C:\Documents and Settings\All Users\Application Data\McAfee\DesktopProtection\OnAccessScanLog.txt. Records events triggered when external objects such as file downloads or Web documents are accessed.
• AVG Antivirus
• Message Queue: C:\Documents and Settings\%USER%\Application Data\AVG7\QUEUE
• Activity Log: C:\Documents and Settings\%USER%\Application Data\AVG7\Log\
Router and Switch Forensics
An important part of the network forensics report is the path data took in and out of the network. Routers and layer 3 switches all maintain important log files that can be used to trace traffic. Additionally, there is the possibility that volatile information may exist in the devices that will be of importance. Viewing or acquiring any of this information requires directly accessing the device. Therefore, a significant degree of cooperation is needed from the IT staff. Unless the investigator is specifically trained in the administration of these devices, it is recommended that the task of collecting information be left to the professional network administrator.
Following are a few rules for you (or the network administrator) to follow:
• If at all possible, access the device through the console. Do not access a router or switch over a network connection unless it is completely isolated.
• Enable logging on the terminal software used to engage the device before making the connection. This will record the console session, along with all commands issued throughout the process. With Hyperterm, this is done by selecting Transfer. Capture Text.
• Take screenshots of each activity run. Record actual time and router time for each activity (if there is a difference).
• Make a record of all volatile information, as this will not be retained after the session is completed.
Typically, routers use the Trivial File Transfer Protocol (TFTP) while others use the File Transfer Protocol (FTP). Many routers, including the Cisco brand that dominates the industry, support both protocols. Make sure that you understand which protocol is configured on the router and use the right one. It is not an acceptable practice to make any changes to the router configuration before or after collecting the information needed.
Information retrieved from routers comes in two forms. The volatile information is that which would be permanently lost if the device lost power. It is typically stored in active memory and not in flash RAM. However, there are some files stored in flash that are overwritten whenever an orderly shutdown occurs. Therefore, these files are considered volatile as well. Nonvolatile information is that which is permanently stored in flash memory. Powering the system down will not alter the contents of the files, nor erase them.
Router Interfaces
As mentioned in the previous section, a router should never be accessed across the network. There are ways of connecting to a router that are safe for the investigator, although they require direct access. The Console Port exists as a direct RJ-45 or serial connection (depending on the age and model of the router). Some Cisco models are RJ-45 (Figure 12.9) on one end and DB-9 serial on the other. TTY or auxiliary ports exist on some routers and are holdovers from the days of analog modems. These are most frequently DB-9 connectors as well, so more than just a visual examination will be required in order to interface with the device.
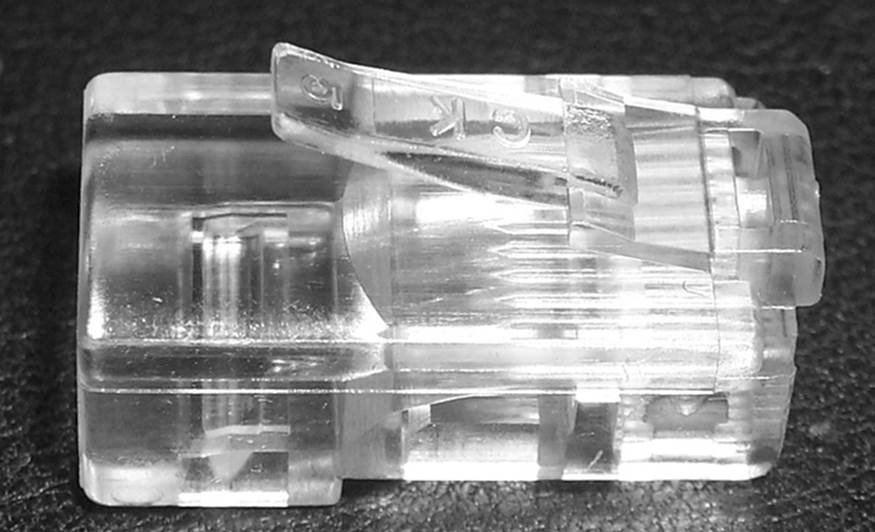
Figure 12.9 RJ-45 terminal
Connections over these interfaces are done with Telnet, which is a command-driven communications application. This of course requires that the investigator be familiar with Telnet commands. Telnet commands are executed from Microsoft’s HyperTerminal (Figure 12.10). Many lower-end devices, such as those used for DSL or ISDN connections, interface with a server via a USB port.
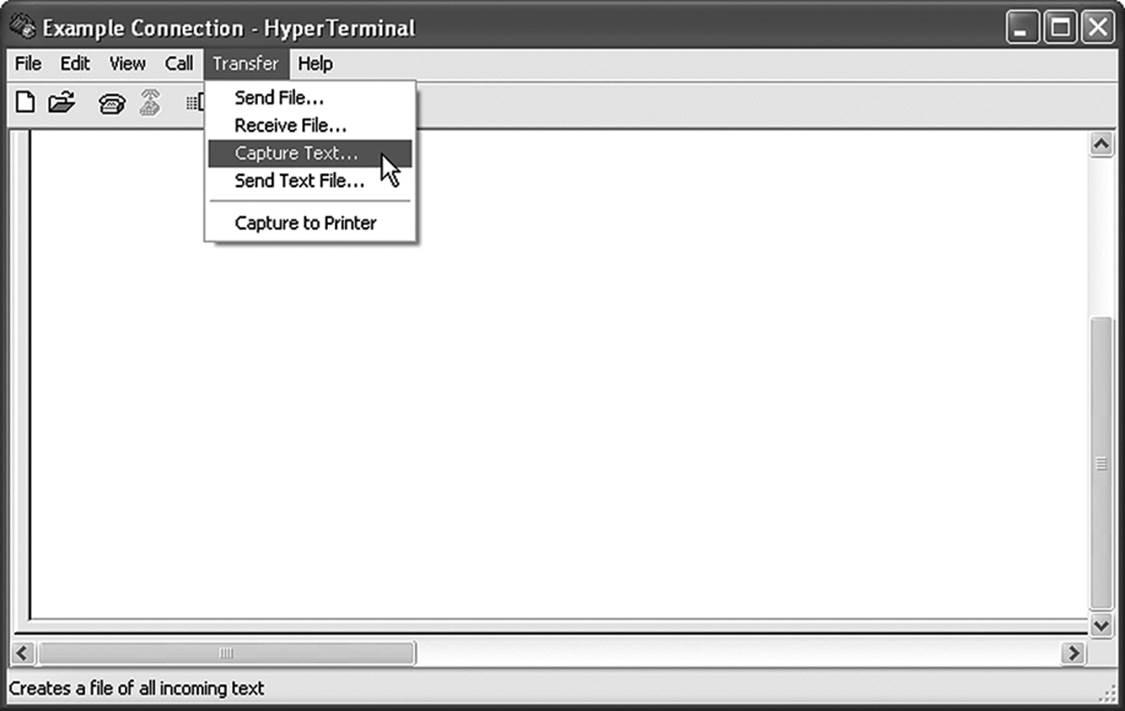
Figure 12.10 Telnet connection from HyperTerminal
Collecting Volatile Information
Rarely does the volatile information collected from routers provide direct evidence of an intrusion or a crime. What it does do is provide the framework to support (or argue) claims that the router was properly configured and not compromised by external forces.
Whenever possible, the volatile information should be copied to files and archived. Typically, this is possible by using the copy command on the router. Information to be collected includes
• Router OS version
• Router logs
• Time of initial contact based on the router’s clock
• Copy of the startup configuration
• Copy of the running configuration
• Routing tables in memory
• List of interfaces
• Copy of the access lists
• Open sockets
• NAT translation tables
A good tool for collecting information from Cisco routers is the Cisco Router Evidence Extraction Disk (CREED), developed by Jesse Kornblum of the U.S. Air Force. The tool was designed as a bootable floppy diskette, so a laptop with a floppy disk drive (increasingly rare) or an external floppy drive will be needed. To use the tool, boot a laptop computer to the CREED disk. Connect the computer to the router, going from the serial port on the computer to the router’s console port. Once the computer is completely booted, removed the CREED diskette and put in a blank MS-DOS formatted diskette. At the command prompt, type acquire. Log into the router (this will require the administrative password in order to enter privileged mode). The program will then run the following commands against the router and copy the results to a text file on the blank floppy diskette (Shaikh 2008):
# terminal length 0
# dir /all
# show clock detail
# show ntp
# show version
# show running-config
# show startup-config
# show reload
# show ip route
# show ip arp
# show users
# show logging
# show interfaces
# show ip interfaces
# show access-lists
# show tcp brief all
# show ip sockets
# show ip nat translations verbose
# show ip cache flow
# show ip cef
# show snmp users
# show snmp groups
# show clock detail
# exit
Another Cisco-specific tool is the Router Audit Tool, regretfully known as RAT. RAT is best used against the router by the network engineer, as it must be run against an established baseline. Having some knowledge of the network’s infrastructure is necessary because the utility will interpret certain differences between the baseline and the running configuration to be vulnerabilities, when they are in fact intentionally configured parameters.
Collecting Nonvolatile Information
Most routers have two places where nonvolatile information is stored. The flash RAM that has been discussed earlier is a place where data can be permanently stored. Typically, the router will have its operating system installed here. Nonvolatile Random Access Memory (NVRAM) is another repository of permanently stored information, as well as nonvolatile session information. An example of the latter is that on startup, the router copies the configuration data loaded into RAM to a file in NVRAM.
There are several commands to run against the router at this point. Again, the examples below are based on Cisco routers. Different OS versions will have varying commands, but all should have a similar command set. As mentioned when discussing the collection of volatile information, make sure that logging is enabled on the terminal software in use.
• #show history: This command displays the last ten commands issued to the router. The network administrator can determine if those were legitimately issued commands.
• #copy startupconfig tftp: The router will use the TFTP protocol to copy the permanently configured startup configuration from flash RAM to the TFTP server configured on the router. Compare this configuration to the running configuration collected from volatile memory to see if any changes have been made since the router was last started. Be very careful not to copy the running configuration to the startup configuration or vice versa before making copies. Doing so could potentially overwrite evidentiary material.
• #dir slot 0: This command displays a directory of files on the first flash disk.
• #dir slot 1: This command displays a directory of files on second flash disk (if available).
• #show users: This command displays a list of all users currently connected to the device.
Note that if any files are to be copied from nonvolatile memory to the evidence file directory, the verify /md5 command should be run against the file before it is copied, and then an MD5 hashing utility run against the copy to verify the integrity of the file.
Analyzing the Data
In itself, router data provides little meaningful information. What it does provide is corroboration for conclusions fueled by other evidence discovered in the course of investigation. For example, if it is important to establish that a particular user went to a specific Web site, the investigator can use the DNS logs to indicate that the user prompted a DNS query when he typed the URL into the browser’s address bar. The router logs can pinpoint the time that a network connection was made to that address.
When looking for evidence of an outside attacker, router logs can provide information that proves certain events took place. A hacker trying to gain access to a secure network will go through several phases of an attack. The first step consists simply of information gathering. Much of the information about an organization’s network is freely available. A WHOIS query can provide potential attackers with information about domain names, assigned IP address ranges, names of administrators, and a great deal more. Figure 12.11 is a WHOIS query of the author’s Web site.
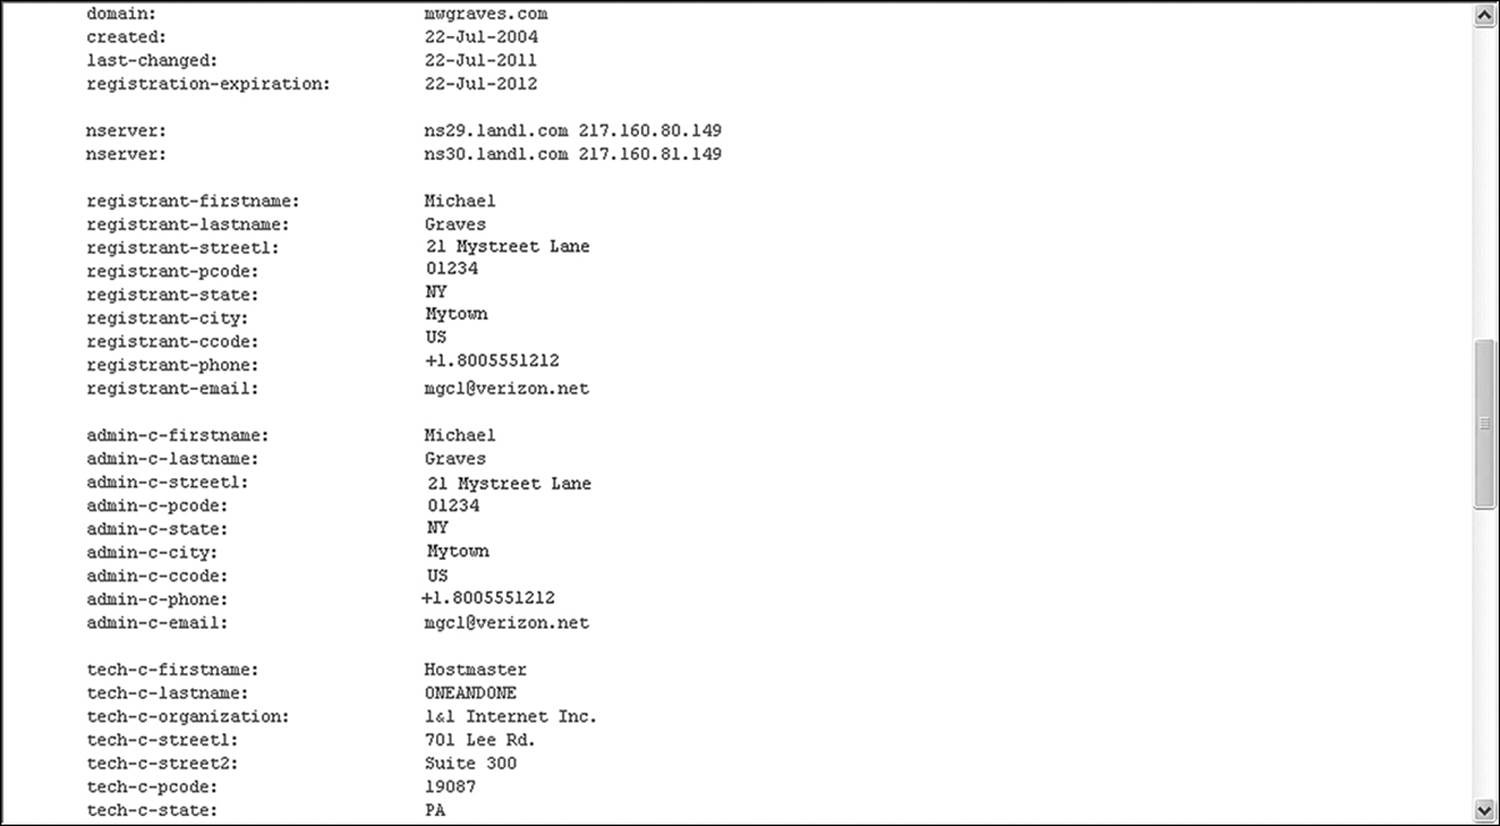
Figure 12.11 A WHOIS query of the author’s Web site. For reasons of privacy, some information has been altered.
Far too often, information gathering is nontechnical and finding the artifacts left behind are beyond the means of the digital investigator. Much of the information used to penetrate the tightest security is gained through social engineering, and more often than one might expect, simple dumpster diving. People are often easily beguiled into handing out information over the telephone to callers posing as trusted vendors or customers. Employees have been known to carelessly discard sensitive materials without first destroying them. In most states, once that information hits the dumpster, it is free for the taking, and any expectation of privacy goes by the wayside. The Supreme Court decided in California v. Greenwood (1988) that articles left in trash disposal bins were readily accessible to all.
The next steps taken by the attacker involve probing the network for vulnerabilities. Tools such as NMAP can quickly scan a block of network addresses (for example, 192.168.2.1/24) looking for open, closed, or unfiltered (subject to firewall rules) TCP/IP ports. A secured router will detect such a scan and stop responding to the probe after a certain number of queries. However, the persistent hacker can simply script the application to try a few ports, wait a set number of milliseconds (or seconds or minutes), and try again. The investigator can find evidence of these attempts in the logs.
Once weaknesses have been found, the attacker now looks for ways to exploit them. Hackers have hundred of tools at their disposal, the same way artists have brushes and canvases of different variety. There is even a commercial suite of penetration tools available over the Internet called Metasploit. This package includes a collection of exploits that can be used against individual computers or network interfaces. Since the processes of scanning and exploiting both involve a lot of traffic, router logs are likely to keep records of some of the failures, and even the successes. The trick is to search for anomalous activity on the interface. Excessive UDP or incoming ICMP traffic is generally a good sign that somebody is collecting information on the system.
Once an attacker gains access to the system, she wants an easy way back in for her next visit. Who wants to go through all that trouble again? Check the logs for evidence that extended privileges were invoked in the time frame under investigation. If an attacker succeeds in accessing administrative-level control of the system, it is a simple matter to either create a new account with extended privileges or to promote an existing account. (This will be in the server logs, and not the router logs). Other attackers may drop a rootkit onto the system.
The last thing the attacker does is to cover all tracks and try to keep anyone from knowing the system has been breached. The perfect hack is the one that is never detected. A wide variety of antiforensic techniques are employed by hackers and by criminals to hide evidence, destroy evidence, or obfuscate evidence. This will be the subject of Chapter 15, “Fighting Antiforensics.”
Chapter Review
1. Why is it necessary to ascertain a particular time frame in which an incident occurred as part of the initial response procedure?
2. What information can you collect from a keylogger that would be difficult, if not impossible, to determine any other way?
3. Explain the difference between standard mode and promiscuous mode on a network interface card.
4. Two options for configuring a network sniffer are to capture data exchanged between two specific points and to capture data between one specific point and any other nod on the network. Explain why you would choose to use one mode over the other.
5. Since information extracted from router or switch interfaces do not provide specific evidence of a particular crime in most cases, what use is the information collected from those devices?
Chapter Exercises
1. Open the Event Viewer on a Windows-based computer, and select the application log. On the top menu, click Action. Filter current log.
a. In the dialog box that opens, make sure that only Critical and Error are selected. Click OK. Make a note of what errors are reported, and copy down the Event ID for that message.
b. Now use the tool to filter only by the ID you selected. To do this, copy the Event ID into the field labeled “Includes/Excludes Event IDs:”
c. In your browser, browse to Microsoft’s Technet site at http://technet.microsoft.com and do a search for Event ID xxxx, where the x’s represent the number of the ID you located.
2. Download a copy of Wireshark (available at the time of this writing at www.wireshark.org/download.html). Install the application on your machine according to the instruction, and configure it to perform a capture of your IP address to anywhere. Spend some time looking at the different types of data you collect.
References
California v. Greenwood, 486 U.S. 35, 39 (1988).
Etzioni, A. 2002. Implications of select new technology for individual rights and public safety. Harvard Journal of Law and Technology 15(2):280.
Shaikh, A. 2008. CREED (Cisco Router Extraction Disk). Anish Shaikh’s TechFactor. www.anishshaikh.com/2008/03/creed-cisco-router-evidence-extraction.html (accessed February 20, 2012).
United States v. Rodriguez, 968 F.2d 130, 136 (2nd Cir. 1992).
United States v. Simons, 206 F.3d 392, 398 (4th Cir., Feb. 28, 2000).