Pragmatic Enterprise Architecture (2014) Strategies to Transform Information Systems in the Era of Big Data
PART III Information Systems
Abstract
This part enters into the main territory of enterprise architecture for information systems which is as rich in technology specialties as the IT ecosystem is diverse. Most organizations fail to recognize the need for diverse specialization within architecture because they fail to understand the depth of complexity and the costs associated with mediocrity within each area of specialization. They also believe that a general practioner, which we will call a solution architect, is qualified and appropriate to address the complexities across a wide array of technology areas. In reality, this is equivalent to staffing a medical center primarily with general practioners that act as the specialists. A healthy organization maintains top specialists with which the general practioners can participate in getting expertise that is in alignment with a future state vision that reduces complexity and costs.
Keywords
information systems architecture
enterprise architecture
business architecture
operations architecture
systems architecture
control systems architecture
cross-discipline capabilities
solution architect
subject matter expert
stakeholders
Legal
Compliance
Auditing
Chief Customer Officer
outsourcing partners
customers
investors
shareholders
regulators
enterprise architects
hedgehog principle
architectural standards
technology portfolio management
TPM
organizing technologies into portfolios
architecture ROI framework
application impact
infrastructure impact
personnel impact
vendor impact
operational workflow impact
business impact
after tax implications
net present value
NPV
internal rate of return
IRR
personnel severance costs
airfare
lodging
enhanced technology portfolio management
technology categories
technology subcategories
technology metadata
reporting architecture
OLTP
online transaction processing
OLAP
online analytical processing
business intelligence
nonstatistical analysis
data mining
predictive analytics
operational data store
ODS
DW
data warehouse
data mart
DM
GIS
geographic information system
Big Data
mashup technology
data warehouse architecture
BI Architecture
rollups
aggregates
dimensions
MOLAP
ROLAP
HOLAP
WOLAP
DOLAP
RTOLAP
CEP
complex event processing
NLP
natural language processing
data visualization
cluster diagrams
terrain maps
architectural drawings
floor plans
shelf layouts
routes
connectivity diagrams
bubbles
histograms
heat maps
scatter plots
rose charts
cockpit gauges
radar diagrams
stem and leaf plots
predict behavior
longitudinal analysis
survey sampling models
stimulus-response predictive models
statistical methods
nonstatistical models
neural networks
neural nets
polynomial
Big Data architecture
structured data
unstructured data
semistructured data
velocity
volume
frequency of updates
variety
concurrent users
OldSQL
New SQL
SQL
free space
query language
ACID
atomicity
consistency
isolation
durability
node
symmetric multiprocessing
SMP
massively parallel processing
MPP
asymmetric massively parallel processing
AMPP
Hadoop
DFS
distributed file system
MapReduce
Apache Software Foundation
ASF
FOSS
IP
GFS
HDSF
GPFS
BigTable
NoSQL
Hbase
R Language
R Programming Language
Sqoop
Hive
Pig
Impala
FSF
free software foundation
CRAN
Comprehensive R Archive Network
R extensions
Luisi Prime Numbers
competing Hadoop frameworks
Cloudera
Hortonworks
MapR
IBM
Microsoft
Intel
Syncsort
SAS
Big Data is use case driven
document management/content management
knowledge management
graph DB
online transaction processing systems
data warehousing
real-time analytics
algorithmic approaches
batch analysis
advanced search
relational database technology in Hadoop
novelty discoveries
class discoveries
association discoveries
document management
content management
government archival records
business document management
IT document management
customer document management
Basho Riak
MarkLogic
MongoDB
Cassandra
Couchbase
Hadoop HDFS
Hadoop HBase
KYC
AML
SAP Hana
HP Vertica
Greenplum
Teradata
lifetime value
LTV
forecasting
Fair Isaac’s
HNC
Ward Systems
SAS complex event processing
algorithm based
matrix vector multiplication
relational algebraic operations
selections and projections
union
intersection and difference
grouping and aggregation
reducer size and replication rates
similarity joins
graph modeling
Netezza
NewSQL
e-Commerce
Akiban
Clustrix
Google Spanner
NuoDB
SQLFire
VoltDB
batch analytics
HDFS
address geocoding
linear measures event modeling
routing
topological
cartography
Neo4j
PostGIS
Oracle Spatial
Geotime
search and discovery
Lucidworks
Solr
Splunk
relational database technology in Hadoop
Splice Machine
Citus Data
use case driven
life cycle
ad hoc deployment
Big Data deployment
metadata
Big Data ecosystem
use case planning
business metadata
use case requirements
internal data discovery
external data discovery
inbound metadata
ingestion metadata
data persistence layer metadata
outbound metadata
lifecycle metadata
operations metadata
data governance metadata
compliance metadata
configuration management metadata
team metadata
directory services metadata
ecosystem administrator metadata
stakeholder metadata
workflow metadata
decommissioning metadata
metadata summary
There is no magic
Big Data accelerators
parallel and distributed processing
reduced code set that eliminates large amounts of DBMS code
fewer features
compression
proprietary hardware
SOA
OOA
LDA
CPU
LZ77
LZ78
Huffman
columnar
Big Data the future
quantum computing
code breaking
cryptography
prime number generation
traveling salesman problem
labeling images and objects within images
identifying correlations in genetic code
testing a scientific hypothesis
machine learning for problem solving (aka self-programming)
adiabatic
AQC
gate model
D-Wave
qubit
quantum error correction
quantum processor
titanium
niobium
Columbian
Kelvin
Tesla
Josephson junction
Boolean SAT
SAPI interface
compiler
client libraries
frameworks
applications
mashup architecture
data virtualization layer
cross data landscape metrics
data security
data visualization styles
self-service
LDAP
compliance architecture
treaty zone
business compliance
IT compliance
ISO 17799
ISO 27000
COSO
Committee of Sponsoring Organizations of the Treadway Commission
OFAC
Office of Foreign Assets Control
Treasury department
United and Strengthening America by Providing Appropriate Tools Required to Intercept and Obstruct Terrorism
Section 314(a)
USA PATRIOT Act
Office of Federal Contract Compliance Programs
OFCCP
Equal Employment Opportunity Act
EEOA
Financial Stability Board
FSB
Global Financial Markets Association
GFMA
Bank Secrecy Act
BSA
Regulation E of the Electronic Fund Transfer Act
EFTA
Dodd-Frank
Securities and Exchange Commission
SEC
Federal Trade Commission
FTC
Office of the Comptroller of the Currency
OCC
Commodity Futures Trading Commission
CFTC
International Swaps and Derivatives Association
ISDA
Sarbanes Oxley
SOX
Basel II
Solvency II
Blocked Persons List
Targeted Countries List
Denied Persons List
Denied Entities List
FBI’s Most Wanted
Debarred Parties List
Global Watch List
Politically Exposed Persons
PEP
anti-money laundering
know your client
suspicious activity report
SAR
CIP
DTCC
NSCC
DTC
SWIFT
CICI
LEI
CFTC Interim Compliant Identifier
National Securities Clearing Corporation
Customer Identification Program
Society for the Worldwide Interbank Financial Telecommunication
Legal Entity Identifier
RIM
legal hold
records information management
Governance Risk and Compliance
GRC
XBRL
10-Q
10-K
20-F
8-K
6-K
legal compliance
HR compliance
financial compliance
application portfolio architecture
APM
applications architecture
business rules
workflow architecture
business capabilities
BPMN
workflow automation
BPM technology
application architecture
singular application
first-generation language
second-generation language
third-generation language
fourth-generation language
drag-and-drop self-service
array language
vector language
assembly language
command line interfaces
compiled language
interpreted language
data manipulation language
object-oriented language
scripting language
procedural language
rules engine
requirements traceability
error handling
software reuse
application architecture design patterns
integration pattern
distribution pattern
tier pattern
procedural pattern
processing pattern
usage pattern
analytical pattern
interactive pattern
data communication pattern
message dissemination pattern
resource sequence pattern
pipeline pattern
pipe and filter
event-driven pattern
blackboard pattern
MV pattern
integration architecture
hub and spoke
ESB
service-oriented architecture
enterprise service bus
extract transform and load
ETL
FTP
file transfer protocol
B2B
B2C
partner integration
life cycle architecture
software development life cycle
data centric life cycle
DCLC
DGLC
DLC
merger and acquisition life cycle
MALC
data center consolidation life cycle
DCCLC
corporate restructuring life cycle
CRLC
outsourcing life cycle
OSLC
insourcing life cycle
ISLC
operations life cycle
OLC
SDLC
ISO/IEC 12207
inception
high-level analysis
detail analysis
logical design
physical design
build
validation
deployment
post-implementation
logical data architecture
data requirements
data analysis
data profiling
conceptual data modeling
logical data modeling
physical data modeling
data discovery
data acquisition
data cleansing
data standardization
data integration
user acceptance
production
data governance life cycle
identifying data points
populating business data glossary
conceptual data architecture
business designated access rights
legal and compliance oversight
secure canned reporting data points
report and querying
production to nonproduction data movement
AGLC
architecture governance life cycle
analyze business direction
analyze business pain points
analyze types of technological issues
analyze all business initiative types
assess business alignment
initial architecture review
postmortem architecture review
divestiture life cycle
identify scope of business being divested
identify divested business capabilities
identify shared operations
automation supporting divested capabilities
identify dedicated operations
detach general ledger
identify unstructured data of divested areas
identify RIM data
define RIM business data
safeguard RIM data
validate RIM reporting
identify legal holds
safeguard legal hold data
validate legal hold reporting
downsize business operations
downsize automation
decommission
downsize IT operations
mergers and acquisitions
identify business scope being acquired
identify business organization impact
identify acquired automation
analyze overlapping automation
identify legal holds
compare data landscapes
identify automation impact
identify development environment impact
implement automation strategy
identify IT organization impact
general ledger integration
right-size business operations
right-size automation
right-size IT operations
data center consolidation
insourcing life cycle
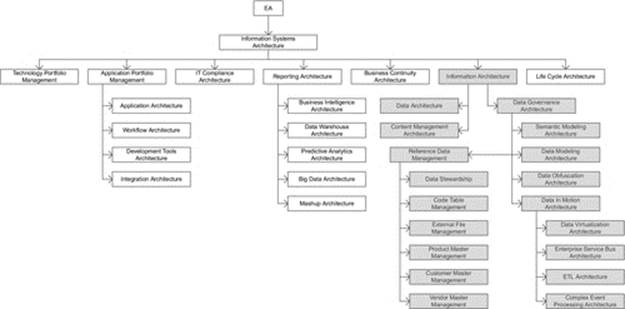
DIAGRAM Information systems architecture overview.
3.1 “Information Systems” Architecture and Governance
The global operating model for information systems architecture is one where there are various distinct architectural disciplines that require architectural standards, frameworks, and services to deliver the following:
- align the many technical disciplines across IT with the strategic direction of the business,
- provide representation of stakeholder interests across a large number of application development teams,
- identify opportunities to executive management,
- manage complexity across the IT landscape,
- exploit the synergies across the various architectural disciplines of enterprise architecture,
- optimize the return of business investment into automation,
- act as an accelerator to the automation activities across each life cycle of the enterprise,
- continually illustrate architecture’s return on investment.
Traditionally, information systems architecture has been simply referred to as enterprise architecture, without acknowledgment of there being a distinct set of architectural disciplines that belong to business architecture and operations architecture, or the distinction between information systems architecture and control systems architecture, or realization that there are a number of cross-discipline capabilities that span the aforementioned.
One may wonder why so many categories of architectural disciplines are valuable. After all, there are plenty of solution architects that are already assigned to application teams around the country and/or globe.
To understand this question more thoroughly, it is first important to look at the skill sets of solution architects and what their focus has been throughout their career, and what it is now.
Before the name “solution architect” came into fashion, solution architects would have been recognized the best and brightest programmer analysts and developers that implemented many of the applications within a large enterprise. Since solution architects are among the few that understand the majority of the critical application systems across the enterprise, they are valuable resources that cannot be readily replaced. In fact, it can take years to replace a typical solution architect as their accumulated knowledge of application systems is usually not documented to the extent that would be necessary to guide a substitute in a reasonable time frame.
Of the various roles across IT, solution architects have general to intermediate knowledge of many topics within technology. In fact, a typical solution architect can provide a fairly informative perspective on the widest variety of technologies of any type of resource across most any organization. So why not leverage solution architects to fill the role of enterprise architects? The answer can best be conveyed through a simple story.
A new management regime is introduced into a large enterprise. They reasonably set new business principles to leverage the economies of scale in negotiating with vendors for software licenses. They become aware of the fact that there are hundreds of different tools that are used for reporting and business intelligence (BI) purposes. However, they notice that none of these tools support the new Big Data space of technology.
A team of the top dozen solution architects from across the company are assembled, as well as two members from enterprise architecture that are subject matter experts (SMEs) in information architecture, itself an immensely vast architectural discipline.
Management proposes that a list of several Big Data technologies should be assembled for consideration to determine the best technology choice for the enterprise as a global standard.
[Rather than picking on specific vendors and products, as this is certainly not the intention of this book, we will give fictitious product names, although we will try to associate a few characteristics to them that are realistic from a high-level perspective where they are necessary to serve the purposes of this discussion.]
The team of solution architects schedule length daily meetings across a period of several months. The two enterprise architects divide their time so that only one of them has to be present for each given meeting, and they dial into the meetings when their schedule permits. It is also fair to state that the goal of the two enterprise architects is to have a good collaborative series of meetings with their architectural brethren.
Unlike the well-facilitated meetings, these meetings were loosely facilitated, often driven by who could call out the loudest. The two enterprise architects stated the importance of getting requirements from the various stakeholders, although no requirements were ever collected from any of the lines of business. To obfuscate the fact that requirements were not available, the team adopted a resolution to state to management specific phrases like, “What we are hearing from the business is that they want, or would like, to be able to do deep analytics.”
After many hours of meetings, the team elected the path that they wanted to take. It is a path that many architecture review boards commonly take, and if it is good enough for architecture review boards that make technology decisions every time they convene, then it must be an industry best practice. This is the approach where a team of generalists decide to leverage the feature list of every major product from its marketing materials, and capture it in a spreadsheet to be used as the master set of evaluation criteria.
Quite the feature list was assembled from scouring the marketing materials of the major Big Data products. In a number of cases, the features seemed to conflict with one another, particularly because some of the products had vastly different architectures, but why quibble over details. The weeks flew by.
Now that the feature list, which was being loosely used as business requirements, was assembled, the team proceeded to the next step of matching the candidate products to the master feature list to determine which products had more features than other products. However, not all products matched up to features on the basis of a clear yes or no. Some products partially had some of the features, and it had to be determined how much to award each product. More weeks flew by.
Finally, all of the products were mapped to the master feature list, with their varying degrees noted in the scoring system. However, a simple count of features that a given product had seemed somewhat unfair. Certainly, some features in this long list were more important than others, so now it had to be determined how much weight to assign each feature. More weeks flew by.
Eventually, the team had a new weighted score for each of the products. It should be noted that the weightings did not alter the relative ranking of the products, although it did bring some of them closer together in total score. Now many months later, the solution architects were quite pleased with their accomplishment, which selected the most expensive product from among the candidate products. But what did the enterprise architects think of it?
In fact, the enterprise architects could have saved 9 months off the process and countless man hours of effort because it was obvious to them that the outcome had to be the biggest, most mature, most expensive product of the bunch. It should always make sense that the most expensive product would have the most features and would have been the one that had been around the longest to build up those features. Newer products generally have to be less expensive to get market share, and they take years to accumulate a litany of features. But was the most expensive product the right choice from the perspective of a SME in information architecture?
The best choice from the perspective of the information architecture SMEs was actually the least expensive product, which ironically did not even make the top three in any of the scorings performed by the solution architects, and was summarily dismissed. However, it was less expensive by a factor of nearly 20 to 1 over a 5-year period ($5MM versus $100MM).
In fact, from a software internals perspective, it had the most efficient architecture, least complicated to install, setup and use, required less expensive personnel to manage, administer, and utilize it, with a significantly shorter time to deployment. It was also more suitable to be distributed across the many countries, many of which had medium to small data centers, and small budgets.
In all fairness to the solution architects, they played by the rules they were given. The actual recommendation from the two enterprise architects was to select two products. What we had found from being on conference calls with reference clients of the various products was that the least expensive product accomplished the job better than the most expensive one about 95% of the time. There were, however, 5% that needed some feature of the most expensive product. Clients indicated that the technology footprint for the most expensive product was therefore limited to the few areas that required those features, and that represented significant savings.
It is also fair to say that this author was very lucky to have been familiar with much of the internal design of the various products. However, it was that subject matter expertise that made it obvious early on as to which product a SME in the architectural discipline of database technology would select.
The point we make is a simple one. There is a benefit to having an SME in any of the architectural disciplines that represent areas of technology that are either already in use or will be in use across the IT landscape. Enterprise architects are SMEs in one or more particular areas of technology, as compared to a solution architect who is an expert in one or more applications and a generalist in the many technologies that those applications use.
Still another area of benefit has to do with the various corporate stakeholders from across the organization. These include the heads of departments such as Legal, Compliance, Auditing, and Chief Customer Officer, as well as external stakeholders such as outsourcing partners, customers, investors and regulators.
Since it is unrealistic to expect each stakeholder to interact with many solution architects, not to mention the fact that they may all have different interpretations of the various stakeholder interests, it is up to the few enterprise architects to incorporate the interests of the various stakeholders into the standards and frameworks of the architectural discipline in which they are an SME.
Equally as important, there are valuable synergies among architectural disciplines that offer opportunities of incorporating improved standards and frameworks that materialize simply from having enterprise architects who are SMEs in their respective discipline explain their disciplines to and collaborate with one another. This leads to added data security and data privacy benefits, such as easy and automatic data masking for ad hoc reporting.
Therefore, in the modern information systems architecture, technology challenges are addressed by instantiating the architectural disciplines that correspond to the areas of technology in use, or are planned to be in use, around the globe. Although the number of pertinent architectural disciplines for any company will vary, approximately 30 disciplines form a basic set that we discuss below. In addition, the specific architectural disciplines that may need to be instantiated at a given point in time can vary depending upon the technologies in use and the activities that are in progress or soon to start across the enterprise.
The operating model for information systems architecture is one where the expert defines the scope of their architectural discipline, and then identifies the hedgehog principle that drives the particular discipline, and a small number of additional metrics-driven principles that provide the ability to measure efficacy of the architectural discipline across the IT landscape.
Each SME must also determine the current state, future state, and a transition plan to get from the current state to the future state. Each SME must also present their discipline to their peers of SMEs for the other architectural disciplines. Each SME would identify the standards and frameworks that they propose and why, develop and refine these artifacts, and then mentor local governance boards, solution architects, and application development teams across the IT community.
Although this will be addressed in more detail later, local governance boards, solution architects, and application development teams should jointly participate in a process that determines whether designs and implementations are in compliance with the standards and frameworks, and to request exceptions, as well as a process to escalate requests for exceptions when it is believed that the exception should have been granted and/or the standard changed.
That said, even though architectural standards would be developed with the objective of controlling costs across the enterprise, there must still be a process in place to request exceptions to evaluate opportunities for improvement. If an exception does not violate the interests of another stakeholder and is clearly advantageous cost-wise over the potential life of the design, then the exception should be approved. Likewise, if the standard can be improved to better control costs or protect the interests of stakeholders across the enterprise, then the process to update the standard should be engaged.
We will now discuss a set of candidate architectural disciplines to be evaluated for inclusion into a modern information systems architecture practice.
3.1.1 Technology Portfolio Management
Technology portfolio management (TPM) is the discipline of managing the technology assets of an enterprise in a manner that is somewhat analogous to managing a portfolio of securities, whose focus is to optimize present and future value while managing risk.
At the onset, this is somewhat more challenging than one might expect as financial securities have consistent measurement criteria and technology products do not, at least not without a good amount of work as no industry standard has yet been established.
The challenge is that consistent measurement is only possible when comparing technologies that belong to the same area of technology and provide the same or overlapping capabilities. The development of standard categories is only beginning to emerge with tools for administrating TPM, such as the typical TPM tools. That said, the small number of categories that have been identified out of the box by the typical TPM tools is simply not granular enough to support the needs of large organizations, as the high-level categories should correspond directly with the architectural discipline that is most closely aligned to its core capability.
Once allocated to their associated architectural discipline, the subcategories, and in some cases, the sub-subcategories of technologies are best determined by the SME responsible for the particular architectural discipline.
For example, the subcategories for many operations and infrastructure components can be any combination of the hardware environment categories, such as mainframe; mid-range application server, database server, network server, or security server.
An example within the architectural discipline of workflow automation, technologies can be categorized as business process modeling notation (BPMN) tools, business process modeling (BPM) technologies, or workflow automation (WFA) tools, which we will discuss in the section that addresses the architectural discipline of workflow automation.
One approach to begin managing a portfolio of technology is to first develop an inventory of technologies in use across your company. This is not always easy as there may be technologies purchased and administered by business that may not be apparent to IT personnel. A thorough review of procurement contracts globally and incoming annual maintenance fees to accounts payable are typically required.
As the list of technologies is being assembled from across the globe, a variety of information associated with each technology can be gathered, noting that much of this information can further evolve repeatedly over time. The basic information that one would start with should include information from the last point in time payment was effected.
This should include exact name of the product, the name of the vendor, a vendor supplied product identifier, the product versions purchased, when each version was acquired, the platforms it was acquired for, and date of last update to the records of this product, and a high-level statement of the product’s capabilities.
One should also analyze each application system and the particular technologies that support them in production, as well as the technologies that support them in the development and deployment life cycle. To do so however, there needs to be a clear understanding of the distinction in definition between an application and a technology.
To do this we must first be careful with the use of terms. The term “business capability” refers to the business functions that are performed within a given department using any combination of manual procedures and automation. A department receives a “request” corresponding to a “business capability” that it is responsible to perform, such as the business capability for accepting and processing a payment, or the business capability of effecting a payment.
Just as business departments perform business capabilities, IT departments perform business capabilities as well, such as the business capability of a Help Desk providing advice and support to users for personal computer equipment and software.
A given business capability may be performed manually, with automation, or using a combination of manual operations with automation. The automation itself, however, may be an application, such as a funds transfer application which executes business rules specific to the business capability of funds transfer, or a technology, such as the Internet which executes generic capabilities of the particular technology.
As such, the business rules of an application must be maintained by an application development team. The application development team can be within the enterprise either onshore or offshore; it may be outsourced to a vendor.
So here’s the critical distinction that we are making. A technology does not contain business-specific business rules that support a business capability, whereas an application does contain business-specific business rules. Therefore, there are numerous software products that are technologies, such as rules engines, spreadsheets, and development tools (e.g., MS Access). These are simply technologies. However, once business rules are placed within a given instance of such a technology, then that instance becomes an application, which should be managed and maintained by an application development team as a production asset.
So to clarify, once a spreadsheet contains complex formulas that is used to support a business capability, that instance of that spreadsheet is an application that should be tested, its source should be controlled, it should be backed up for recovery purposes, and it should be considered as an inventory item in a disaster recovery (DR) plan.
However, if the spreadsheet is simply a document or a report, such as any word processing document like an MS Word file or Google Doc that do not contain business rules, then those instances are simply electronic documents and cannot be classified and managed as an application.
This means that the each application must also be analyzed to determine the specific technologies that ultimately support the automation needs of a given business capability. This includes network software, database software, operating systems, and security software, as well as the various types of drivers that integrate different components together.
Also included should be document management systems, and the development and testing tools, as well as monitoring tools that support the development as well as maintenance process for supporting automation upon which business capabilities rely.
3.1.1.1 Organizing Technologies into Portfolios
Portfolios of technologies represent a way to group technologies so that they are easier to manage. In general, the better the framework of portfolios, the more evenly distributed the technologies should be into those portfolios.
Organizing technologies into portfolios may be approached either bottom up, by first identifying the inventory of technologies and then attempting to compartmentalize them into portfolios, or top down. Once an inventory of technologies has been established, no matter how large it may be, the process of identifying the portfolio that they belong to may be conducted.
The number of technologies can be large; we have seen it even in the thousands. Although a number of classification schemes can be used to identify portfolios, the approach that we have seen that has been best for us is to classify them into portfolios that most closely match the a particular architectural discipline.
It is important to classify technologies into portfolios that correspond directly with architectural disciplines for a number of reasons. First and foremost is that there is a major difference in the result of managing technologies using a team of generalists, such as by individual solution architects, versus having an SME managing the portfolio in which they are expert.
This approach has been the best we’ve seen for managing a large portfolio of existing technologies, and when it comes to the selection of new technologies, or the selection of a future state set of technologies, it is also best.
As discussed earlier, a team of generalists, who know a great deal about many architectural disciplines, but no one discipline to the extent that they could be considered an expert, will repeatedly demonstrate a propensity to select the most expensive technology for any given capability. The approach that they take can be quite methodical, although flawed.
The approach of most generalists is to begin by getting a list of the leading technologies for a given capability from a major research company. Depending upon how this list is used, this can be the first misstep for a couple of reasons.
First, the criteria that research companies use are necessarily a best guess as to what the important characteristics are to an average enterprise, although it is difficult to define what an average enterprise may be. Unless your enterprise meets the criteria of being close to the average, it will not likely be as pertinent to your organization as you might like. Your enterprise may have particular strategies and technology direction that can easily outweigh the criteria used by an average organization.
Second, one must frequently take into account the relationship that research companies have with vendors, as some vendors represent large cash streams to the research company who sometimes hire research companies for consulting services. The advice of these firms may not be intentionally slanted at all, but we have seen at least one situation where the recommendation of a major research company was the result of deception, negligence, or incompetence.
Unfortunately, generalists are at an unfair disadvantage to detect questionable research, whereas an SME will tend to spot it immediately.
The next potential misstep performed by generalists is that they tend to use the product feature list from marketing literature as a substitute for requirements and evaluation criteria. This has a number of problems associated with it. While the evaluation criteria itself may not conform to the evaluation criteria most appropriate for your enterprise, the potentially bigger issues are that the feature list identified within the marketing literature is likely to be slanted toward the evaluation criteria used by the research company, and the evaluation criteria of the research company may actually be influenced by the vendor to favor themselves during the product evaluation process while working with the research analyst.
The final potential misstep performed by generalists is that they may not understand the all-in costs of a technology over the life of the technology. Introductory discounts and prices can distort the true cost structure, and the business benefits ofthe technology are often not realized due to tool complexity and hidden costs.
Vendor marketing personnel are the best at what they do. They are familiar with many of the financial ROI analysis approaches used by large organizations. Although most technical people do not enjoy performing a detailed financial analysis of a technology that is under evaluation, it is extremely important that this step is performed carefully in an impartial manner.
3.1.1.2 Architecture ROI Framework
When it comes to analyzing the all-in cost of each vendor technology, the SME will already have valuable insight into what other customers have experienced with a given technology, why and what the costs and benefits are. Even armed with that knowledge, it is still advisable for the SME to make use of a framework to evaluate the various aspects from an architectural perspective using an architecture ROI framework.
An architecture ROI framework can contain a number of categories with which to evaluate costs and benefits. Foremost, the appropriate SMEs should determine each technology’s compatibility with the application strategy, technology strategy, and data strategy. If the technology is not compatible with strategy of the enterprise, the technology can be rejected and the architecture ROI need not be performed.
If, however, the technology is compatible with the strategy of the enterprise, then we recommend that the architecture ROI framework minimally addresses the following with the minimum of a 3-year projection:
- application impact
- costs include new application licensing, maintenance, implementation, and decommissioning
- savings include decommissioned application license reduction, reallocation, and maintenance
- infrastructure impact
- costs include new infrastructure purchases, maintenance, installation and setup, decommissioning
- savings include decommissioned infrastructure reduction, reallocation, annual charges, and infrastructure avoidance
- personnel impact
- costs include additional employees, time and materials consultant labor, SOW costs, travel expenses, training costs, conference fees, membership fees, and overtime nonexempt charges
- savings include employee hiring avoidance, employee attrition, employee position elimination, consultant hiring avoidance, consultant personnel reduction, training avoidance, travel expense avoidance, conference fee avoidance, and membership fee avoidance
- vendor impact
- costs include hosting fees, service subscription fees, usage fee estimates, setup fees, support fees, appliance fees, and travel
- savings include hosting fee reduction, service subscription fee reduction, usage fee reduction, appliance fee reduction, and travel expense reduction
- operational workflow impact
- costs include increased rate of inbound incidents/requests, estimated increase in processing time, and average incident/request cost increase
- savings include decreased rate of incoming incidents/requests, estimated decrease in processing time, and average incident/request cost decrease
- business impact
- costs include estimated business startup costs, estimated losses from periodic loss of business capabilities, estimated loss from customer dissatisfaction, and estimated exposure from regulatory noncompliance
- savings include value of additional business capabilities, value of improved customer satisfaction, and value of enhanced regulatory reporting
Additionally, each cost and benefit should have a visual illustration of a 3- to 5-year projection associated with it, such as in the cost illustration in red, and savings illustration in green, shown in Figure A.
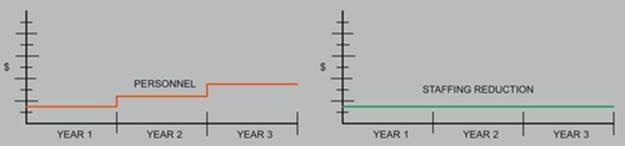
FIGURE A 3-year cost-benefit projection example.
Once the figures have been reasonably verified, then it is time to prepare subtotals for each category followed at the end by a grand total chart to depict the net costs and savings of all categories, showing an architecture ROI cost, as illustrated in Figure B.
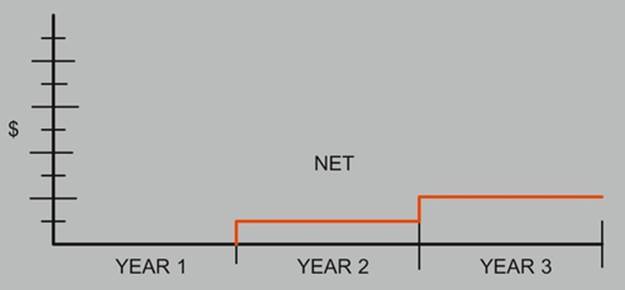
FIGURE B Net cost and savings.
The assumption associated with the architecture ROI framework is that it does not consider:
- after tax implications,
- net present value (NPV) to account for the future value of money,
- internal rate of return (IRR) to compare two or more investments,
- personnel severance costs as negotiated by HR,
- the distinction between airfare and lodging rates, and
- subjective measures of earnings and capital assumptions.
At this point, the architecture ROI is ready to go to finance to be included into their financial framework.
In conclusion, one or few experts will select technologies that will provide the greatest business value, as it is more likely to satisfy the capabilities actually required, to be less complex, be a vendor whose core capability more closely corresponds to what is needed to satisfy the pertinent business capability, and to have a better understanding of the all-in cost over the life of the technology.
Another important reason to classify technologies into portfolios that correspond directly with architectural disciplines is that it is much easier to identify a point of responsibility for a given technology that can perform the role and add real value to the users of the particular technology.
Once the appropriate portfolios for classifying technologies have been determined, it is a straightforward process to allocate those technologies that have a clear focus. It should be noted that some technologies have such a number of capabilities such that they begin to spread into multiple architectural disciplines. When this occurs, it is important to take note which capabilities a technology was acquired and approved for. Identifying which capabilities that a technology is to be used for is another role that experts within architectural disciplines are well suited for.
3.1.1.3 Enhanced TPM
After each technology has been allocated to the most appropriate architectural discipline, there are a few of basic steps to follow that will help with managing the content of that portfolio. Depending upon the particular architectural discipline, technologies can be further organized in useful ways.
If we consider the architectural discipline “Content Management Architecture” as an example, the technologies that could be allocated to that discipline can be organized into enterprise content management systems (aka document management systems) may include:
- Web content management systems,
- mobile content management,
- collaboration management,
- component content management,
- media content management (e.g., audio, video), and
- image management systems.
By organizing technologies of a portfolio by further allocating them in a diagram into such technology categories, it now becomes easy to visually illustrate technologies by these technology categories to readily depict gaps, overlaps, and oversaturation of technologies within each technology category of the particular portfolio.
The characteristics used to create technology subcategories within each portfolio are best determined by the SME that manages the particular architectural discipline. To speak to it generally however, the characteristics of the subcategories used should provide a good distribution of the technologies that have been allocated to the specific architectural discipline.
When the technologies belonging to a particular portfolio have been organized in such a manner, the SME is better positioned to identify technology strategy that is optimal for the particular portfolio.
Now that the various technologies have been organized into subcategories within their associated architectural discipline, it is time to consider technology metadata and metrics. Since all architectural disciplines need to acquire many of the same metadata about their respective technologies, it is best to develop a shared process and repository developed by the architectural discipline TPM.
As one would expect, products that have a high concentration of adoption within a line of business are not readily subject to a change in technology direction, whereas technologies that have few users and instances within a line of business can be subject to a rapid change of technology direction.
Basic metadata can include vendor name, technology name, supported hardware and operating system environments, approved usage, whether there are any special considerations for failover or DR, and the degree to which it is compatible with each line of business application strategy, technology strategy, and data strategy.
Basic metrics can include licenses purchased, licenses consumed, annual maintenance fees, cost of additional licenses, lines of business that use the technology, the level of experience across the users, degree of user training required, number of outstanding product issues, the frequency of product patches and new releases, and the number of hours consumed to provide administration for the product.
With this information, the SME can take into consideration, the costs associated with the potential disruption of each potential change to determine the most beneficial future state for the organization within each line of business. It then becomes possible to develop a roadmap to achieve the intended future state which optimizes business value, ultimately affecting the competitiveness of the company within the marketplace, as these practices accumulatively influence the infrastructural costs of the enterprise.
Additionally, publishing these artifacts as part of a policy of full transparency is the best way to illustrate the direction and strategy of technology within each technology portfolio. Imparting knowledge of the future state roadmap and the supporting metrics of a technology portfolio communicates all of the necessary information in the appropriate context as opposed to generalists assigning a status of buy, hold, or divest to each technology to drive toward the future direction with minimal knowledge and a lack of gathered information.
One last interesting topic to consider in TPM is to understand the circumstances when technologies drive the application strategy and when applications drive the technology strategy.
Although there are always exceptions, it is much more common to see a particular line of business drive the entire IT infrastructure relative to their line of business because applications for a given line of business have mostly evolved on some platforms more than in others. For example, an Investments line of business within an insurance company is far more likely to be Windows and Microsoft centric than IBM mainframe or Oracle centric, whereas HR within a large company is more likely to be Oracle UNIX centric than Microsoft centric. Once the suite of applications within a given line of business determines the dominant applications and their associated environments, the technology stack simply follows their lead.
In contrast, there are still occasions when technology leads the selection of applications and environment. This may help to explain IBM’s motivation to get into the Big Data space so that IBM hardware can play more of a central role in the high-end Hadoop world within large enterprises.
3.1.2 Reporting Architecture
Developing reports in the early years of IT was rather easy, especially since the volume of data available in a digital form at that time was relatively low. As the volume of information increased soon, it became valuable to report on historical data and the depiction of trends, statistics, and statistical correlations.
It was not long before reports went from batch to online transaction processing (OLTP) reporting, with applications generating reporting journals, which were simply flat file records generated during normal processing to support easy reporting afterward. The earliest advancements in the analysis of larger amounts of data were propelled by the business advantages that could be had within the most competitive industries, such as among the advertising and financial investment firms.
Soon new terms emerged; some of these terms emerged out of necessity, as the term “reporting” would prove too general and extremely ineffective within Internet search engines. Hence, a variety of more specific terms entered the language.
These included:
- statistical analysis,
- online analytical processing (OLAP),
- BI,
- nonstatistical analysis (e.g., neural networks),
- data mining,
- predictive analytics (aka forecasting models),
- operational data stores (ODS),
- data warehouse (DW),
- data marts (DM),
- geographic information systems (GIS), and more recently,
- Big Data, and
- mashup technology.
New techniques using hardware were developed in an attempt to deal with the ability of the already existing hardware to process large amounts of data.
These included the emergence of:
- approximately a dozen levels of a redundant array of independent disks (RAID),
- solid state drives,
- vector processing,
- parallel processing,
- supercomputers,
- multiprocessing,
- massively parallel computing (MPP),
- massively parallel processing arrays (MPPA),
- symmetric multiprocessing (SMP),
- cluster computing,
- distributed computing,
- grid computing,
- cloud computing, and
- in memory computing.
To further advance the handling of larger quantities of data, file access methods and file organizations gave way to database technologies, with a variety of database types, such as:
- transactional,
- multidimensional,
- spatial, and
- object oriented.
Alongside these technologies came a variety of database architectures, such as:
- hierarchical,
- network,
- inverted list,
- relational,
- columnar-relational hybrids, and
- true columnar (where relational database management system overhead is eliminated).
Although this can seem overly complex initially, it is not difficult to understand any reporting software architecture as long as you begin at the foundation of the technology, which is to first establish a good understanding of the I/O substructure and its performance specifications. Performance specifications vary with the type of operation, but they basically consist of two types of access, which are sequential access and random access.
From the foundation you build up to understanding programs that access the data, called access methods, as well as the way that they organize data on storage media, called file organizations.
Once access methods and file organizations are understood, then you are ready to understand the types of indexes, database architectures, and the architectures of database management systems including how they manage buffers to minimize the frequency with which the CPU must wait for data to move to and from the storage devices through the I/O substructure.
An expert in this discipline should be able to accurately calculate how long it will take to do each type of report by estimating the amount of time it takes for each block of data to traverse through the various parts of the I/O substructure to the CPU core. In this manner an expert can tell if a given technology will be sufficient for the particular type of report and quantity of data.
3.1.2.1 Data Warehouse Architecture
Before the volume of data grew beyond the capacity of standard reporting technologies data was read directly from their associated production transaction system files and databases. As data volume grew a problem emerged in that reporting and transactional activity shared the same production files and databases. As this resource contention grew, the need to replicate data for reporting purposes away from transactional systems grew.
When transactional systems were relatively few, replication of data for reporting was first implemented with the generation of files that could each would be used to create a particular report. With the growth in number of these files a more consolidated approach was sought, and from that the concept of the data warehouse emerged as a means to support many different reports.
As the variety of transaction system grew, along with the volume of data and number of reports, so did the complexity of the data warehouse. Soon more than one data warehouses were needed to support reporting requirements.
The complexity of creating and maintaining additional data warehouses creates opportunities for data inconsistencies across data warehouses. This led the industry to conclude that manageable collections of transaction systems should have their data integrated into ODS where it should be easier to resolve data inconsistencies because they were from similar transaction systems. Once the first wave of consolidation issues had been resolved then multiple ODSs could be further consolidated into a data warehouse.
With numerous transaction systems acting as the source of data bound for data warehouses, ODSs served as an intermediate step that could act as a mini-data warehouse for a collection of related transaction systems. These mini-data warehouses were easier to implement because the database designs of related transaction systems tended to be less disparate from one another than more distantly related transactions systems. Additionally, a number of reports could be supported from the layer of ODS databases, thereby reducing the load and complexity placed upon a single consolidated data warehouse.
With the emergence of an ODS layer, the data warehouse could return to its role of supporting the consolidated reporting needs of the organization that any could only be otherwise supported using a combination of one or more ODSs. In this approach, ODSs would house the details associated with their collection of transaction system databases, and the data warehouse would house the details associated with the collection of the ODS layer.
Needless to say, housing such a large accumulation of detail data from across several transaction systems poses a major challenge to database technologies that were designed to best address the needs of transaction processing.
Using database technology designed for transactional processing, the ability to read the detail data necessary to calculate basic totals and statistics in real time was soon lost. Data warehouses needed either a new technique to support the types of reports that focused on data aggregation, or it needed a new breed of hardware, software and databases that could support analytical processing, and a new breed of hardware, software and database technologies were born.
Data warehouse architecture deals with an array of complexities that occur in metadata, data and databases designs.
In metadata, issues include anomalies such as:
- ambiguously named fields,
- multiple terms that mean the same thing,
- one term that has multiple meanings,
- terms that do not represent an atomic data point such as compound fields,
- terms that have incorrect, missing, or useless definitions.
In data, issues include anomalies such as:
- sparseness of data where few values were populated for specific fields,
- invalid data like birth dates in the future,
- invalid or inconceivable values like a month of zero,
- partial loss of data due to truncation,
- invalid formats like alphabetic characters in a numeric field,
- invalid codes like a state code of ZZ,
- one field populated with data belonging to a different field like surname in first name,
- application code is required to interpret the data.
In individual databases, issues include anomalies such as:
- children records with no association to parent records
- children associated with the wrong parent
- duplicate records having the same business data
- schema designs that do not correctly correlate to the business
- indexes that point to incorrect rows of data
- loss of historical data
In multiple databases, issues include anomalies such as:
- inconsistent code values for the same idea like New Jersey = “99” or “NJ”
- incompatible code values for the same idea like New Jersey = Northeast US
- non matching values for the same fields like the same person having different birth dates
- incompatible structures that intended to represent the same things
The process of untangling metadata, data, and database issues may require tracing the data back to the online forms and batch programs that populated the values to be able to decipher the source and meaning of the data, often requiring knowledge of data discovery techniques, data quality expertise, data cleansing, data standardization and data integration experience.
3.1.2.2 BI Architecture
BI architecture is generally a discipline that organizes raw data into useful information for reporting to support business decision making, frequently using forms of data aggregation, commonly referred to as online analytical processing (OLAP).
OLAP comprises a set of reporting data visualization techniques that provide the capability to view aggregated data, called aggregates (aka rollups), from different perspectives, which are called dimensions. As an example aggregates, such as “sales unit volumes” and “revenue totals” may be viewed by a variety of dimensions, such as:
- “calendar period,”
- “geographic region,”
- “sales representative,”
- “product,”
- “product type,”
- “customer,”
- “customer type,”
- “delivery method,” or
- “payment method.”
The choice of aggregates and dimensions is specified by the user, and the results are displayed in real time.
To deliver results in real time however, the initial approach to support data aggregation techniques was somewhat primitive in that all of the desired aggregates and dimensions that would be needed had to be predicted in advance and then precalculated typically during batch process usually performed overnight. This also means that although the responses were in real time, the data was from the day before and would not include anything from today until the next day.
Since unanticipated business questions cannot be addressed in real time, there is sometimes the tendency to overpredict the possible aggregates and dimensions and to precalculate them as well. This technique has grown to such an extent that the batch cycle to precalculate the various aggregates by the desired dimensions has become so time consuming that it frequently creates pressure to extend the batch window of the system.
Data mart load programs literally have to calculate each aggregate for each dimension, such as totaling up all of the “sales unit volumes” and “revenue totals” by each “calendar period,” “geographic region,” “sales representative,” “product,” “product type,” “customer,” “customer type,” “delivery method,” “payment method,” and every combination of these dimensions in a long running overnight batch job.
Precalculated aggregates were stored in a variety of representations, sometimes called data marts, star schemas, fact tables, snowflakes, or binary representations known as cubes.
The feature that these approaches had in common was that dimensions acted as indexes to the aggregates to organize the precalculated results. A number of books have been written on this approach where they will also refer to a number of OLAP variants, such as MOLAP, ROLAP, HOLAP, WOLAP, DOLAP, and RTOLAP.
In contrast, the new breed of hardware, software, and databases approaches this problem now in new ways. The two major approaches include a distributed approach to have many servers working on the many parts of the same problem at the same time, and an approach that simply compresses the data to such an extent that the details of billion rows of data can be processed in real time on inexpensive commodity hardware, or trillions of rows of data in real time at a somewhat higher cost on mainframes.
As a result, physical data marts and the need to precalculate them are no longer necessary, with the added advantage that these new technologies can automatically support drill-down capabilities to illustrate the underlying detail data that was used to determine the aggregated totals.
The new breed of specialized hardware is typically referred to as an appliance, referring to the fact that the solution is an all included combination of software and hardware. Appliance solutions are higher priced, often significantly so in the millions of dollars, and have higher degrees of complexity associated with them particularly in areas such as failover and DR. That said, BI architecture encompasses more than just the capabilities of data aggregation.
BI can be expansive encompassing a number of architectural disciplines that are so encompassing themselves that they need to stand alone from BI architecture. These include topics such as data mining, data visualization, complex event processing (CEP), natural language processing (NLP), and predictive analytics.
Data mining is an architectural discipline that focuses on knowledge discovery in data. Early forms of data mining evaluated the statistical significance between the values of pairs of data elements. It soon grew to include analysis into the statistical significance among three or more combinations of data elements.
The premise of data mining is that one ever knows in advance what relationships may be discovered within the data. As such, data mining is a data analysis technique that simply looks for correlations among variables in a database by testing for possible relationships among their values and patterns of values. The types of relationships among variables may be considered directly related, inversely related, logarithmically related, or related via statistical clusters.
One challenge of data mining is that most statistical relationships found among variables do not represent business significance, such as a correlation between a zip code and a telephone area code. Therefore, a business SME is required to evaluate each correlation.
The body of correlations that have no business significance must be designated as not useful so that those correlations may be ignored going forward. The correlations that cannot be summarily dismissed are then considered by the business SME to evaluate the potential business value of the unexpected correlation.
Hence, examples of some potentially useful correlations may include the situations, such as a correlation between the numbers of times that a customer contacts the customer service hotline with a certain type of issue before transferring their business to a competitor, or a correlation among the value of various currencies, energy product prices, and precious metal commodity prices.
An active data mining program can cause business executives to reevaluate the level of importance that they place upon information when it is illustrated that valuable information for decision making lays hidden among vast quantities of business data. For example, data mining could discover the factors that correspond to the buying patterns of customers in different geographic regions.
Data visualization is an architectural discipline closely related to BI architecture that studies the visual representation of data, often over other dimensions such as time. Given the way that human brain works, taking data that exists as rows of numbers into different visual patterns across space, using different colors, intensities, shapes, sizes, and movements, can communicate clearly and bring to attention the more important aspects. Some of the common functions include drill downs, drill ups, filtering, group, pivot, rank, rotate, and sort. There are hundreds of ways to visualize data and hundreds of products in this space, many of which are highly specialized to particular use cases in targeted applications within specific industries.
A partial list of visual representations includes:
- cluster diagrams,
- terrain maps,
- architectural drawings,
- floor plans,
- shelf layouts,
- routes,
- connectivity diagrams,
- bubbles,
- histograms,
- heat maps,
- scatter plots,
- rose charts,
- cockpit gauges,
- radar diagrams, and
- stem and leaf plots.
3.1.2.3 Predictive Analytics Architecture
Predictive analytics is another architectural discipline that encompasses such a large space that it is worthy of its own discipline. Predictive analytics encompasses a variety of techniques, statistical as well as nonstatistical, modeling, and machine learning. Its focus, however, is identifying useful data, understanding that data, developing a predictive or forecasting capability using that data, and then deploying those predictive capabilities in useful ways across various automation capabilities of the enterprise.
Usually, the breakthroughs that propel a business forward originate on the business side or in executive management. There are a handful of factors that can lead to breakthroughs in business, where competitive advantages in technology can suddenly shift to one company within an industry for a period of time until the others catch up.
The basic types of competitive breakthroughs involve innovations in products, processes, paradigms, or any combination of these. Breakthroughs in paradigms are the most interesting as for the most part they facilitate a different way of looking at something. Some of the companies that have done particularly well involving breakthroughs in paradigms are companies such as Google, Apple, Facebook, and Amazon.
In a number of cases, however, a breakthrough in paradigm can be caused by mathematics, such as the mathematical developments that eventually led to and included the Black-Scholes options pricing model, which is where most agree that the discipline of quantitative analysis emerged.
The ability of a statistical model to predict behavior or forecast a trend is dependent upon the availability of data and its correct participation in the statistical model. One advantage that statistical models have to offer is their rigor and ability to trace the individual factors that contribute to their predictive result. Statistical methods however require individuals to be highly skilled in this specialized area.
The architectural discipline of predictive analytics is deeply engrained in statistics and mathematics, with numerous specialty areas.
Some examples of a specialty area include:
- longitudinal analysis, which involves the development of models that observe a particular statistical unit over a period of time,
- survey sampling models, which project the opinions and voting patterns of sample populations to a larger population, and
- stimulus-response predictive models, which forecast future behavior or traits of individuals.
While knowledge of statistical methods is essential for this discipline, it should not be without knowledge of nonstatistical methods, such as neural network technology (aka neural nets).
Neural networks are nonstatistical models that produce an algorithm based upon visual patterns. To be useful, numerical and textual information are converted into a visual image. The role of the algorithm is ultimately to classify each new visual image as having a substantial resemblance to an already known image.
Similar to statistical models, the ability of a neural network to predict behavior or forecast a trend is dependent upon the availability of data and its participation in the nonstatistical model to properly form the “visual image.”
Neural nets are essentially complex nonlinear modeling equations. The parameters of the equations are optimized using a particular optimization method. There are various types of neural nets that use different modeling equations and optimization methods. Optimization methods range from simple methods like gradient descent to more powerful ones like genetic algorithms.
The concepts of neural networks and regression analysis are surprisingly similar. The taxonomy of each is different, as is usually the case among the disciplines of artificial intelligence.
As examples, in regression analysis, we have independent variables; in neural networks, they are referred to as “inputs.” In regression analysis, you have dependent variables; in neural nets, they are referred to as “outputs.” In regression analysis, there are observations; in neural nets, they are referred to as “patterns.”
The patterns are the samples from which the neural net builds the model. In regression analysis, the optimization method finds coefficients. In neural nets, the coefficients are referred to as weights.
Neural network “training” results in mathematical equations (models) just like regression analysis, but the neural network equations are more complex and robust than the simple “polynomial” equations produced by regression analysis. This is why neural networks are generally better at recognizing complex patterns.
That said, it should also be noted that it is often a trial-and-error process to identify the optimum type of neural network and corresponding features and settings to use given the data and the particular problem set. This tends to drive the rigorous statistician insane. Although early neural networks lacked the ability to trace the individual factors that contributed to the result, which also drove many a statistician insane, modern neural networks can now provide traceability for each and every outcome.
Early neural nets required highly specialized personnel; however, the products and training in this space have become user friendly for business users and even IT users to understand and use.
An early adopter of neural nets was American Express. Early on credit card applications were evaluated manually by clerical staff. They would review the information on the credit card application and then based upon their experience judge whether or not the applicant was a good credit risk.
The paradigm breakthrough that AMEX created was that they envisioned that the data on credit card applications could be converted to digital images that in turn could be recognized by a neural network. If the neural net could learn the patterns of images made by the data from the credit card applications of those that proved good credit risks, as well as patterns corresponding from bad credit risks, then it could potentially classify the patterns of images made by the data from new credit card applications as resembling good or bad credit risks correctly, and in a split second.
AMEX was so right. In fact, the error rate in correctly evaluating a credit card application dropped significantly with neural nets, giving them the ability to evaluate credit card applications better than any company in the industry, faster, more accurately, and at a fraction of the cost. At that time, AMEX was not a dominant global credit card company, but they rapidly became the global leader and continue to endeavor to maintain that status.
Regardless of the particular technique that is adopted, the use of predictive analytics has become essential to many businesses. Some insurance companies use it to identify prospective customers that will be profitable versus those that will actually cause the company to lose money.
For example, predictive analytics have been successfully deployed to determine which customers actively rate shop for insurance policies. If customers attain an insurance policy and then defect to another carrier within a relatively short period of time, then it ends up costing the insurance company more than they have made in profits for the given time period.
Today, retailers use predictive analytics to identify what products to feature to whom and at what time so as to maximize their advertising expenditures. Internet providers use predictive analytics to determine what advertisements to display, where it should be displayed, to whom. There are numerous applications across many industries, such as pharmaceuticals, health care, and financial services.
3.1.2.4 Big Data Architecture
The term “big data” means different things to different people. In its most simple form, big data refers to sufficient amounts of data that it becomes difficult to analyze it or report on it using the standard transactional, BI, and data warehouse technologies. Many of the “big data”-specific technologies, however, require significant budgets and usually require an extensive infrastructure to support. As such, it is critical for enterprise architecture to oversee it with the appropriate business principles to protect the interests of the enterprise.
In the context of control systems, big data is generally understood as representing large amounts of unstructured data. In this context, the true definition of unstructured data refers to the types of data that do not have discrete data points within the data that can be designed to map the stream of data such that anyone would know where one data point begins and ends after which the next data point would begin.
In a control system, the concept of a “record” housing unstructured data is different, as it represents a specific continuum of time when the data was recorded. In contrast, a record within an information system context will typically represent an instance of something.
In the context of information systems, big data is generally understood to be structured data and semistructured data, which is often referred to as unstructured data, as there are few examples of true unstructured data in an information system paradigm.
That said, it is important to clearly define what is meant by structured, unstructured, and semistructured data.
Structured data is the term used when it is clear what data elements exist, where, and in what form. In its most simple form, structured data is a fixed record layout; however, there are variable record layouts, including XML that make it clear what data points exist, where, and in what form.
The most common form of structured data is file and database data. This includes the content of the many databases and files within an enterprise company where there is a formal file layout or database schema. This data is typically the result of business applications collecting books and records data for the enterprise.
The next most common form of structured data refers to the content of machine generated outputs (e.g., logs), that are produced by various types of software products, such as application systems, database management systems, networks, and security software. The ability to search, monitor, and analyze machine generated output from across the operational environment can provide significant benefit to any large company.
Unstructured data is the term used when it is not clear what data elements exist, where they exist, and the form they may be in. Common examples include written or spoken language, although heuristics can often be applied to discern some sampling of structured data from them.
The most unstructured data does not even have data elements. These forms of unstructured data include signal feeds from sensors involving streaming video, sound, radar, radio waves, sonar, light sensors, and charged particle detectors. Often some degree of structured data may be known or inferred with even these forms of unstructured data, such as its time, location, source, and direction.
Semistructured data is the term used when it is clear that there is some combination of structured and unstructured data, which often represents the largest amount of data in size across most every enterprise. As an example, I have frequently seen as much 80% of the data across all online storage devices within a financial services company be classified as semistructured data.
The most common forms of semistructured data include electronic documents, such as PDFs, diagrams, presentations, word processing documents, and spreadsheet documents, as distinct from spreadsheets that strictly represent flat files of structured data. Another common form of semistructured data includes messages that originate from individuals, such as e-mail, text messages, and tweets.
The structured component of the data in semistructured data for files is the file metadata, such as the file name, size, date created, date last modified, date last accessed, author, total editing time, and file permissions. The structured component of the data in e-mails includes the e-mail metadata, such as the date and time sent, date and time received, sender, receiver, recipients copied, e-mail size, subject line, and attachment file names, and their metadata.
The unstructured component of the data in semistructured data refers to the content of the file and/or body of the message. This form of unstructured data, however, can be transformed into structured data, at least in part, which is discussed in more detail within the discipline of NLP architecture, where automation interprets the language and grammar of messages, such as social media blogs and tweets, allowing it to accurately and efficiently extract data points into structured data. Opportunities to strategically convert the unstructured component of semistructured data to structured data provide significant competitive advantages.
Big data deals with any combination of structured, unstructured, and semistructured data, and the only thing in common between the ways that big data deals with extremely large volumes of data is that it does not rely upon file systems and database management systems that are used for transaction processing.
Regarding the more precise definition of big data, it is the quantity of data that meets any or all of the following criteria:
- difficult to record the data due to the high velocity of the information being received,
- difficult to record the data due to the volume of information being received,
- difficult to maintain the data due to the frequency of updates being received—although this tends to eliminate MapReduce as a viable solution,
- difficult to deal with the variety of structured, unstructured, and semistructured data,
- difficult to read the necessary volume of data within it to perform a needed business capability within the necessary time frame using traditional technologies,
- difficult to support large numbers of concurrent users running analytics and dashboards,
- difficult to deal with the volume of data in a cost-effective manner due to the infrastructure costs associated with transaction processing technologies.
3.1.2.4.1 OldSQL vs. NoSQL vs. New SQL
3.1.2.4.1.1 OldSQL
The term OldSQL refers to the traditional transactional database management systems, regardless of their particular architecture (e.g., hierarchical, such as IMS, network, such as IDMS, inverted list, such as Adabas, or relational, such as SQL Server, DB2, Oracle, and Sybase). In relation to one another, all of these databases are forms of polymorphic data storage. This simply means that although the data is stored using different patterns, the information content is the same.
These products have developed from traditional file access methods and file organizations, such as IBM’s DB2 database management system, which is built upon VSAM.
These OldSQL databases were designed to handle individual transactions, such as airline reservations, bank account transactions, and purchasing systems which touch a variety of database records, such as the customer, customer account, availability of whatever they are purchasing, and then effect the purchase, debiting the customer, crediting the company, and adjusting the available inventory to avoid overselling. Yes, if you were thinking that airline reservation systems seem to need help, you are correct although the airlines intentionally sell a certain number of additional seats than they have to compensate for some portion of cancellations and passengers that do not show up on time.
OldSQL databases have dominated the database industry since the 1980s and generally run on elderly code lines. The early database management systems did not have SQL until the emergence of SQL with relational databases. The query language of these early transaction systems was referred to as data manipulation language (DML) and was specific to the brand of database. These codes lines have grown quite large and complex containing many features in a race to have more features than each of their competitors, which all now feature SQL as a common query language.
A longer list of transaction database features includes such things as:
- SQL preprocessors,
- SQL compilers,
- authorization controls,
- SQL query optimizers,
- transaction managers,
- task management,
- program management,
- distributed database management,
- communications management,
- trace management,
- administrative utilities,
- shutdown,
- startup,
- system quiescing,
- journaling,
- error control,
- file management,
- row-level locking,
- deadlock detection and management,
- memory management,
- buffer management, and
- recovery management.
As one can imagine, having large numbers of sophisticated features means large amounts of code that takes time to execute and manage lists of things like locks that all contribute to overhead that can slow a database down, such as having to maintain free space on a page to allow for a record to expand without having to move the record to another page, or to add another record to the page that is next in sort sequence or naturally on the same page due to a hashing algorithm.
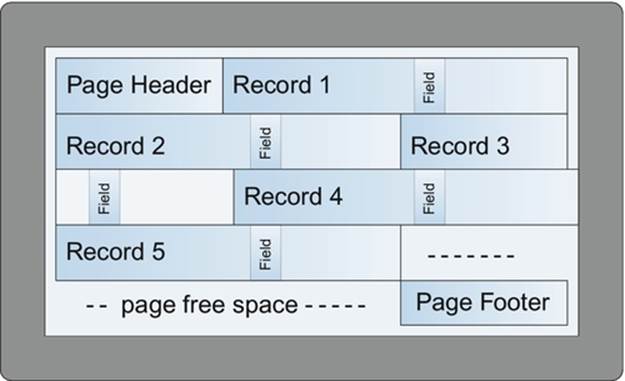
DIAGRAM OldSQL database page with free space.
3.1.2.4.1.2 NoSQL
A number of nontraditional database and BI technologies have emerged to address big data more efficiently. At a high level, these new breed of database management system architectures often take advantage of distributed processing and/or massive memory infrastructures that can use parallel processing as an accelerator.
Interestingly, they are called NoSQL because they claim that the SQL query language is one of the reasons why traditional transactions systems are so slow. If this were only true, then another query language could be simply developed to address that problem. After all, SQL is merely a syntax for a DML to create, read, update, and delete data.
Vendors of NoSQL database products are slowly moving their proprietary query languages closer and closer to SQL as the industry has caught on to the fact that speed and query language are unrelated. To adjust to this, the term NoSQL now represents the phrase “not only SQL.”
The aspects that do slow down OldSQL include:
- many extra lines of code that get executed to support many features that are specific to transaction systems,
- row-level locking and the management of lock tables,
- shared resource management, and
- journaling.
Aside from stripping away these features, NoSQL databases usually take advantage of parallel processing across a number of nodes, which also enhances recoverability through various forms of data redundancy.
Aside from SQL, there is another unfounded excuse given for the poor performance of OldSQL transaction databases, namely, “ACID.” I am often amazed at how frequently ACID compliance is often falsely cited as something that hinders performance.
To explain what ACID is in simple terms, if I purchase a nice executive looking leather backpack from Amazon to carry my 17 inch HP laptop through the streets of Manhattan, and Amazon only has one left in stock, ACID makes sure that if someone else is purchasing the same backpack from Amazon that only one of us gets to buy that backpack.
To briefly discus what each letter in ACID stands for:
- Atomicity refers to all or nothing for a logical unit of work,
- Consistency refers to adherence of data integrity rules that are enforced by the database management system,
- Isolation refers to the need to enforce a sequence of transactions when updating a database, such as two purchasers both trying to purchase the last instance of an item, and
- Durability refers to safeguarding that information will persist once a commit has been performed to declare successful completion of a transaction.
The topic of big data is rather vast much like big data would imply. Some of the topics it includes are the following:
- infrastructure design of multinode systems
- where each node is a server, or
- SMP,
- MPP, or
- asymmetric massively parallel processing (AMPP) systems, which is a combination of SMP and MPP.
- large-scale file system organization,
- large-scale database management systems that reside on the large-scale file system,
- data architectures of Hadoop or Hadoop like environments,
- metadata management of the file system and database management system,
- distributed file system (DFS) failures and recovery techniques,
- MapReduce, its many algorithms and various types of capabilities that can be built upon it.
MapReduce is an architectural discipline in itself. Some of the topics that a MapReduce Architect would have to know include:
- maps tasks,
- reduce tasks,
- Hadoop Master controller creating map workers and reduce workers,
- relational set operations,
- communication cost modeling to measure the efficacy of algorithms,
- similarity measures,
- distance measures,
- clustering and networks,
- filtering, and
- link analysis using page rank.
And then of course, it has close ties to various other architectural disciplines, such as reporting architecture, data visualization, information architecture, and data security.
3.1.2.4.1.3 NewSQL
NewSQL is the latest entrant of database management system for OLTP processing. These modern relational database management systems seek to provide the same scalable performance of NoSQL systems for OLTP workloads while still maintaining the ACID guarantees of a traditional database system.
As for features that give NewSQL high performance and usefulness, NewSQL:
- scales out to distributed nodes (aka sharding),
- renders full ACID compliance,
- has a smaller code set,
- includes fewer features, and
- supports transactional processing.
3.1.2.4.2 Big Data—Apache Software Foundation
The focus of big data has recently moved to the software frameworks based on Hadoop, which are centrally managed by a U.S.-based nonprofit corporation incorporated in Delaware in June 1999 named Apache Software Foundation (ASF). The software available from ASF is subject to the Apache License and is therefore free and open source software (FOSS).
The software within the ASF is developed by a decentralized community of developers. ASF is funded almost entirely from grants and contributions, and over 2000 volunteers with only a handful of employees. Before software can be added to the ASF inventory, its intellectual property (IP) must be contributed or granted to the ASF.
The ASF offers a rapidly growing list of open source software. Rather than listing them, to give an idea as to what types of open source offering they have, consider the following types of software and frameworks:
- access methods,
- archival tools,
- Big Data BigTable software,
- BPM and workflow software,
- cloud infrastructure administration software,
- content management/document management software,
- database software,
- documentation frameworks,
- enterprise service bus (ESB) software,
- file system software,
- integration services,
- job scheduling software,
- machine learning/artificial intelligence software,
- search engines,
- security software,
- software development software,
- version control software,
- Web software, and
- Web standards.
A handful of companies represent the major contributors in the ASF space. They all base their architectures on Hadoop which in turn are based upon the Google’s MapReduce and Google File System (GFS) papers.
Hadoop, or more formally Apache Hadoop, as a term refers to the entire open source software framework that is based in the Google papers. The foundation of this framework is a file system, Hadoop Distributed File System (HDFS). HDFS as a file system is fairly rudimentary with basic file permissions at the file level like in UNIX, but able to store large files extremely well, although it cannot look up any one of those individual files quickly. It is important to be aware of the fact that IBM has a high-performance variant of HDFS called GPFS.
On top of HDFS, using its file system is a type of columnar database, HBase, which is a type of NoSQL database analogous to Google’s BigTable, which is their database that sits on top of the GFS. HBase as a database is fairly rudimentary with an indexing capability that supports high-speed lookups. It is HBase that supports massively parallelized processing via MapReduce. Therefore, if you have hundreds of millions of rows or more of something, then HBase is one of the most well-known tools which may be well suited to meet your needs. Yes, there are others, but that’s the topic for yet another book.
To focus on the Apache Foundation, the number of software components and frameworks that are part of the Apache Software Framework (ASF) that integrates with HDFS and HBase is roughly 100. We will not go through these, except for the few that are most important in our view. However, first let’s ask the question, “Do we need a hundred software components and frameworks, and are the ones that exist the right ones?” The way to understand this is to first follow the money. To do this, we should look at how companies make money from software that is free.
The pattern for this model is Red Hat in November 1999 when it became the largest open source company in the world with the acquisition of Cygnus, which was the first business to provide custom engineering and support services for free software.
A relatively small number of companies are developing software for the ASF in a significant way so that they can position themselves to provide paid custom engineering and support services for free software. Many of the software components in the ASF open source space are not what large enterprises tend to find practical, at least not without customization.
When one of these companies illustrates their view of the Hadoop framework, we should not be surprised if the components that are more prominently displayed are components that they are most qualified to customize and support or include software components that they license. Hence, the big data software framework diagram from each vendor will, for practical purposes, look different.
There are also a relatively large number of companies, which are developing licensed soft-ware in this space, sometimes only after the software enters a production environment. Instead of vying for paid custom engineering and support services, the goal of these companies is to sell software in volume.
If we now return to the question, “Do we need a hundred software components and frameworks, and are the ones that exist the right ones for a large enterprise?” the answer may resonate more clearly.
First, of the roughly 100 components of the ASF, there are ones that are extremely likely to be more frequently deployed in the next several years, and those that are likely to decline in use.
We will begin by defining a handful of candidate ASF components:
- R Language—a powerful statistical programming language that can tap into the advanced capabilities of MapReduce,
- Sqoop—provides ETL capabilities in the Hadoop framework (though not the only one),
- Hive—a query language for data summarization, query, and analysis,
- Pig—a scripting language for invoking MapReduce programs, and
- Impala—provides a SQL query capability for HDFS and HBase.
Let’s speculate regarding the viability of a sampling of the ASF:
Let’s being with “R.” The “R Programming Language” was created at the University of Auckland, New Zealand. It was inspired by two other languages “S” and “Scheme” and was developed using C and FORTRAN. “R” has been available as open source under the GNU General Public License (aka GNU GPL or GPL) and Free Software Foundation (FSF), which are organizations distinct from the ASF. The GPU offers the largest amount of free software of any free or open source provider.
To provide an example of what R Language looks like, let’s create the following real life scenario with a little background first.
Prime numbers are taught to us in school as being whole numbers that cannot be factored with other whole numbers (aka integer) other than the number 1 or itself. In other words, if we take a whole number such as the number 18, it is not a prime number simply because it can be factored as 9 times 2, or 3 times 6, which are all whole numbers. In contrast, the number 5 is a prime number because it cannot be factored by any whole number other than 1 or 5. Using this definition, the list of prime numbers begins as 1, 2, 3, 5, 7, 11, 13, 17, and 19. That said, some include the number 1, some exclude it. This is where prime number theory basically begins and ends, although I disagree that it should end here.
In my view, there is a second rule involving prime numbers that is not yet recognized, except for by myself. To me, prime numbers are not only whole numbers that cannot be factored with other whole numbers other than by the number 1 or itself, but prime numbers also represent volume in three-dimensional space whose mean (aka average) is always an integer (Luisi Prime Numbers).
Hence, primes in my view are a relationship among spatial volumes of a series of cubes beginning with a cube of 1 by 1 by 1. It also excludes all even numbers as being nonprimes, thereby eliminating the number “2.” Visually in one’s mind the sum of the volume of each prime divided by the number of cubes is always a simple integer.
To provide an example of what R language looks like, let’s code for the mean of primes, which can be stated in pseudo code as the AVERAGE (first prime**3, second prime**3, and so on to infinity) is always a simple integer.
To go one step further, let’s say that this new mathematical theory intends to say that any other number added on the end of the sequence that is the next “potential” prime number will only have a remainder of zero when the number added to the prime number series is the next prime number in the sequence. Since this is my theory, I choose to call these numbers “Luisi Prime Numbers,” which can be useful when we discuss NP-complete and NP-hard problems.
Although “Mersenne Prime Numbers” are among the largest presently known prime numbers, the Luisi Prime Numbers are a major improvement over Mersenne Prime Numbers as Mersenne Prime Numbers are simply based on testing for a prime that is the number two raised to some exponential power and subtracting one from it. The first four Mersenne Prime Numbers are “3” (based on 22 − 1), “7” (based on 23 − 1), “31” (based on 25 − 1), and “127” (based on 27 − 1), which miss all the prime numbers in between one less than a power of two such as 11, 13, 17, 19, 23, and so on.
I could begin to test out the basic theory easily enough with R Language as follows:
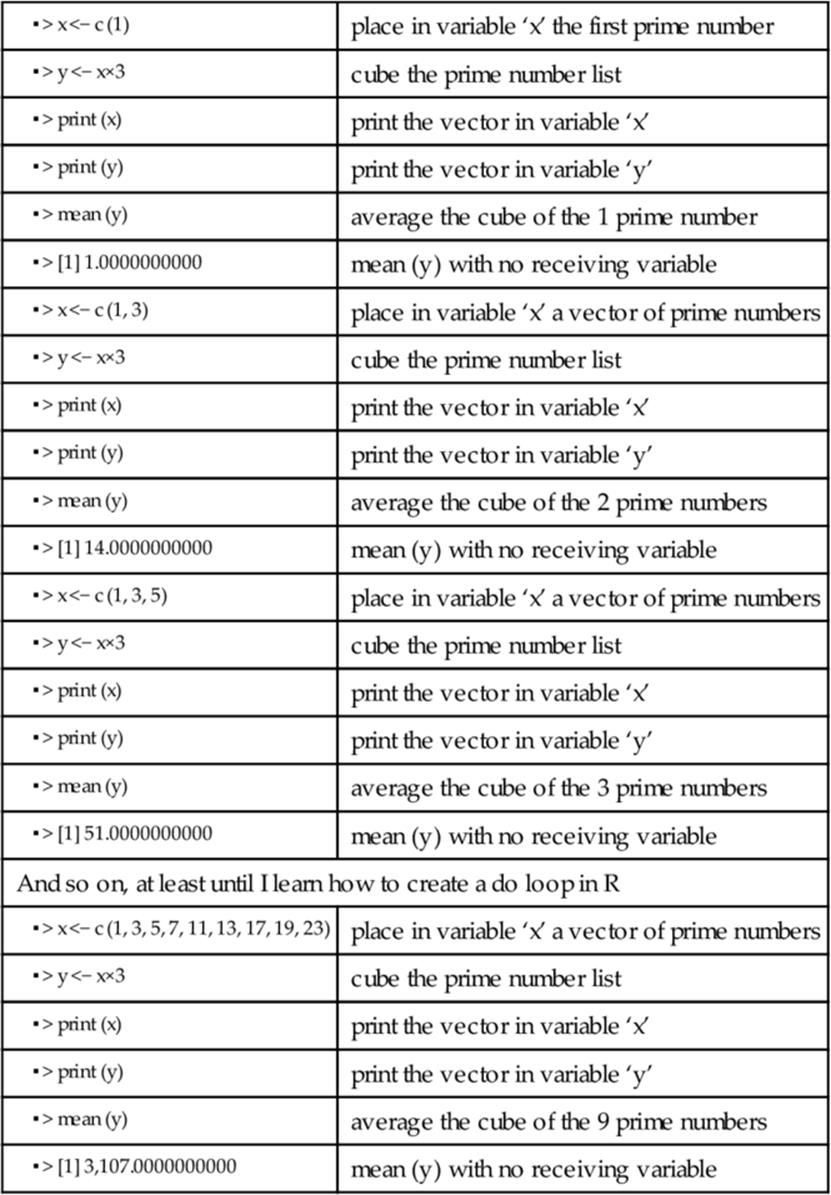
As is the practice for certain types of open source software, a company named Revolution Analytics began offering support for the R programming language and additionally developed three paid versions, including:
- Enhanced Open Source,
- Enterprise Workstation, and
- Enterprise Server.
The popularity of R grew rapidly in the analytics community, and it now uses a large library of R extensions that have been assembled under “The Comprehensive R Archive Network (CRAN),” with an inventory presently in excess of 5500 R extensions.
In my opinion, “R” will enjoy increased use within the industry. Although it is not obvious or intuitive how to use R as a programming language in the short term, once the developer understands it, it is an extremely efficient way to develop software that takes advantage of the powerful capabilities of MapReduce.
Next are the ETL capabilities of “Sqoop.” A strong competitor to Sqoop is the ETL product space, which has an attractive distributed architecture for their conventional ETL and has an open source version in both the Hadoop and conventional space.
Last are “Hive,” “Pig,” and “Impala.” These components have a variety of limitations pertaining to their access and security capabilities as well as runtime restrictions involving available memory, but new versions are on the way. There are also emerging products that use a free license preproduction and licensed in production, that support full SQL, including insert, update, and delete capabilities as well as support for data security using “grant” and “revoke.”
Since support is necessary for any set of automation that supports important business capabilities, particularly in a large enterprise, it should be clear that the option for technology to be free is realistically not an option, except for the small company or home user.
3.1.2.4.3 Competing Hadoop Frameworks
I should note that this is among the few chapters where vendor names are used. To remain vendor agnostic, the names are being used simply for a historical perspective, without any preference shown for any vendor over another and purely with a journalistic perspective.
For the most part, there are six major competing frameworks in the Hadoop space and then a myriad of additional companies that offer products within these or similar frameworks. Of the six major frameworks, they include the following.
3.1.2.4.3.1 Cloudera
Although Yahoo developed Hadoop in 2006, the first company to form after Yahoo developed, it was Cloudera in 2009. It was formed by three engineers, one each from Google, Yahoo, and Facebook.
Cloudera has a framework that features their licensed components and the open source components that they are competent to support and customize for other organizations.
The way Cloudera depicts their framework, they organize their components into five major groups:
- Cloudera Support,
- Cloudera Navigator,
- Cloudera Manager,
- Cloudera Distribution including Apache Hadoop (CDH), and
- Connectors (e.g., Microstrategy, Netezza, Oracle, Qlikview, Tableau, Teradata)
(See the most current version of the diagram on www.cloudera.com).
3.1.2.4.3.2 Hortonworks
Two years later, 2011, the next one that formed was Hortonworks. Hortonworks received over 20 engineers from the Hadoop team of Yahoo and partnered with Microsoft, Informatica, and Teradata. One of their differentiators from the other frameworks is that Hortonworks is the only one that is staunchly open source.
Due to the fact that Hortonworks has a framework that features only open source components, all of their revenue comes from support, customization, and consulting services of the Apache Foundation stack. The Hortonworks approach is to provide all of their contributions involving the Hadoop framework to the Apache Foundation to support and customize these products and frameworks for other organizations. As a result, Hortonworks version of Hadoop is the trunk version of Hadoop.
The way Hortonworks depicts their framework, they organize their components into five major groups:
- Hortonworks Operational Services,
- Hortonworks Data Services,
- Hortonworks Core,
- Hortonworks Platform Services, and
- Hortonworks Data Platforms (HDP)
(See the most current version of the diagram on www.hortonworks.com).
3.1.2.4.3.3 MapR
Around the same time in the same year, 2011, the company MapR formed as a team with EMC and Amazon to distribute an EMC-specific distribution of Apache Hadoop. A specific distribution refers to the fact that a branch has been taken off the trunk, which is a version of Hadoop has been selected which becomes a stable version of Hadoop off of which MapR may develop additional components.
In theory, even though a branch has been selected off the trunk, the ability to take a new more current branch of Hadoop always exists and it should always be compatible.
The differences seen in the MapR framework are due to the MapR specifically licensed software components that they have developed.
The way MapR depicts their framework, they organize their components into three major groups:
- Apache Projects with fifteen Apache Foundation open source components,
- MapR Control System, and
- MapR Data Platform
(See the most current version of the diagram on www.mapr.com).
MapR offers three different versions of Hadoop known as M3, M5, and M7, with each successive version being more advanced with more features. While M3 is free, M5 and M7 are available as licensed versions, M7 having the higher price point.
3.1.2.4.3.4 IBM
By November 2011, IBM announced its own branch of Hadoop called IBM BigInsights within the InfoSphere family of products.
The way IBM depicts their framework, they organize their components into six major groups:
- Optional IBM and partner offerings,
- Analytics and discovery,
- Applications,
- Infrastructure,
- Connectivity and Integration, and
- Administrative and development tools
(See the most current version of the diagram on www-01.ibm.com/software/data/infosphere/biginsights/).
The IBM BigInsights framework includes:
- Text analytics—providing advanced text analytics capabilities,
- BigSheets—providing a spreadsheet like interface to visualize data,
- Big SQL—providing a SQL interface to operate MapReduce,
- Workload Optimization—providing job scheduling capabilities,
- Development tools—based on Eclipse, and
- Administrative Tools—to manage security access rights.
The framework offered by IBM has fewer open source components depicted as compared to licensed components as IBM is in the process of integrating a number of their products into the Big Data ecosystem to provide enterprise grade capabilities, such as data security using their Infosphere Guardium product to potentially support data monitoring, auditing, vulnerability assessments, and data privacy.
3.1.2.4.3.5 Microsoft
The fifth framework is that of Microsoft’s HDInsight. This framework is unique in that it is the only one that operates in Windows directly instead of Linux. (See the most current version of the diagram on www.windowsazure.com/en-us/documentation/services/hdinsight/?fb=en-us.)
HDInsight supports Apache compatible technologies, including Pig, Hive, and Sqoop, and also supports the familiar desktop tools that run in Windows, such as MS Excel, PowerPivot, SQL Server Analysis Services (SSAS), and SQL Server Reporting Services (SSRS), which of course are not supported in Linux.
In the interest of full disclosure, we should note that Microsoft SQL Server also has various connectors that allow it to access Hadoop HBase on Linux through Hive.
3.1.2.4.3.6 Intel
The sixth framework is that of Intel’s distribution of Apache Hadoop, which is unique for it being built from the perspective of its chip set. Intel states in its advertising that it achieves:
- up to a 30-fold boost in Hadoop performance with optimizations for its CPUs, storage devices, and networking suite,
- up to three and a half fold boost in Hive query performance,
- data obfuscation without a performance penalty, and
- multisite scalability.
3.1.2.4.3.7 Summary
All six are outstanding companies. As for architectural depictions, if you view their respective framework diagrams, they all share a common challenge. They all demonstrate an inconsistent use of symbols and diagramming conventions.
If these diagrams were drawn using a consistent set of symbols, then they would communicate the role of each component relative to each other component and more rapidly understood.
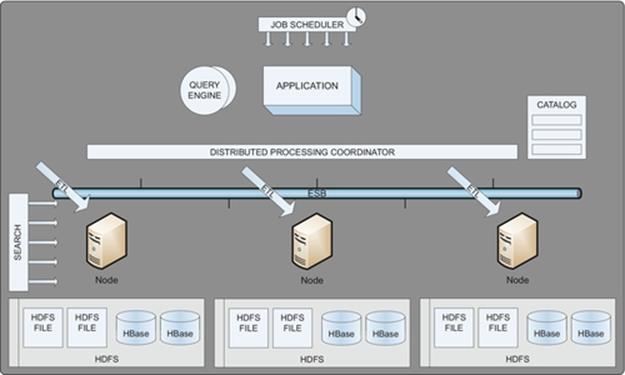
DIAGRAM Generic Hadoop framework using a consistent set of symbols.
In any event, these are the basic types of components that each framework contains. From here, one can color code the Apache Foundation components that are available through free open source licenses versus the components that are available through other open source providers and/or paid licenses.
It is important to note that companies should choose carefully which framework they will adopt. The reason for this is that if you choose a framework with proprietary components, any investment that you make in those proprietary components is likely to be lost.
When in doubt, the best choice is to not choose a framework or employ proprietary components until the implications have been determined and a strategic direction has been set. Each vendor offering proprietary components within their big data framework has an attractive offering. The ideal solution would be to have the ability to integrate combinations of proprietary components from each of the vendors, but presently that option is not in alignment with the marketing strategy of the major vendors.
There are also products and vendors that operate under the covers to improve the performance of various components of the Hadoop framework. Two examples of this class of component are Syncsort for accelerating sort performance for MapReduce in Hadoop and SAS for accelerating statistical analysis algorithms, both of which are installed on each node of a Hadoop cluster.
3.1.2.4.4 Big Data Is Use Case Driven
As one can already sense, there are perhaps an unusually large number of products within the big data space. To explain why this is the case, we only need to look at the large variety of use case types that exist. As one would expect, certain use case types are best handled with technologies that have been designed to support their specific needs.
The common use case types for big data include, but are not limited to:
- Data discovery,
- Document management/content management,
- Knowledge management (KM) (aka Graph DB),
- Online transaction processing systems (NewSQL/OLTP),
- Data warehousing,
- Real-time analytics,
- Predictive analytics,
- Algorithmic approaches,
- Batch analysis,
- Advanced search, and
- Relational database technology in Hadoop.
3.1.2.4.4.1 Data Discovery Use Case Type
Data discovery falls into one of three basic types of discovery, which include:
- novelty discoveries,
- class discoveries, and
- association discoveries.
Novelty discoveries are the new, rare, one-in-a-million (billion or trillion) objects or events that can be discovered among Big Data, such as a star going supernova in some distant galaxy.
Class discoveries are the new collections of individual objects or people that have some common characteristic or behavior, such as a new class of customer like a group of men that are blue-collar workers but also particularly conscious of their personal appearance or hygiene, or a new class or drugs that are able to operate through the blood-brain barrier membrane utilizing a new transport mechanism.
Association discoveries are the unusual and/or improbable co-occurring associations, which may be as simple as discovering connections among individuals, such as can be illustrated on Linked-in or Facebook.
Big Data offers a wealth of opportunity to discover useful information among vastly large amounts of objects and data.
Among the entrants for this use case type are included any of the technologies that have either some variant of MapReduce across a potentially large number of nodes or certain architectures of quantum computing.
3.1.2.4.4.2 Document Management/Content Management Use Case Type
Document management is a type of use case that usually requires a response to a query in the span of 3-5 seconds to an end user, or a response in hundreds of milliseconds to an automated component which may deliver its response directly to an end user or a fully automated process. The use case type of document management/content management refers to an extensive collection of use cases that involve documents or content that may involve structured, unstructured, and/or semistructured data.
These can include:
- government archival records
- official documents of government agencies
- legislative documents of congress
- content generated by politicians and staff
- government contracts
- business document management
- loan applications and documents
- mortgage applications and documents
- insurance applications and documents
- insurance claims documents
- new account forms
- employment applications
- contracts
- IT document management
- word processing documents
- presentation files
- spreadsheet files
- spreadsheet applications
- desktop applications
- standards documents
- company policies
- architectural frameworks
- customer document management
- diplomas
- copies of birth certificates
- marriage, divorce, and civil union certificates
- insurance policies
- records for tax preparation
Once the specific use case(s) of document management/content management have been identified, then one has the ability to start listing requirements. Basic document requirements start with simple things, such as the maximum size of a document and the number of documents that must be managed but it continues into an extensive list that will determine the candidate Big Data products that one may choose from.
Potential document management/content management requirements include:
- maximum document size
- maximum document ingestion rate
- maximum number of documents
- file types of documents
- expected space requirements
- maximum concurrent users retrieving documents
- document update/modification requirements
- peak access rate of stored documents
- number of possible keys and search criteria of documents
- local or distributed location of users
- multi-data center
- fault tolerance
- developer friendly
- document access speed required
In fact, the potential list of requirements can extend into every nonfunctional type of requirement listed in the nonfunctional requirements section discussed later in this book.
Needless to say, there are many Big Data products in the space of document management/content management, each with their own limits on document size, number of keys, index ability, retrieval speed, ingestion rates, and ability to support concurrent users.
Among the entrants for this use case type are included:
- Basho Riak,
- MarkLogic,
- MongoDB,
- Cassandra,
- Couchbase,
- Hadoop HDFS, and
- Hadoop HBase.
The use case of document management however can become much more interesting.
As an example, let’s say that your organization has millions of documents around the globe in various document repositories. It is also rather likely that the organization does not know what documents it has across these repositories and cannot locate the documents that they think they have.
In this type of use case, there are big data tools that can crawl through documents that can propose an ontology for use to tag and cluster documents together into collections. If done properly, these ontology clusters can then be used to give insight into what documents actually represent so that it can be determined which documents are valuable and which are not.
3.1.2.4.4.3 KM Use Case Type (aka Graph DB)
Imagine the vast storage available within Hadoop as a clean white board that not only spans an entire wall of a large conference room, but as one that continues onto the next wall. To a great extent, Hadoop is such a white board, just waiting for Big Data architects to create an architecture within that massive area that will support new and/or existing types of use cases with new approaches and greater ease.
KM is a use case type that itself has many use case subtypes. To illustrate the extremes, let’s say the continuum of KM ranges from artificial intelligence use cases that require massive amounts of joins across massive amounts of data to collect information in milliseconds as input into various types of real-time processes, to use cases that require even more massive amounts of knowledge to be amassed over time and queried on demand within minutes. It is this latter end of the KM continuum that we will explore now.
This use case subtype begins with the ingestion of documents and records from around the globe into the bottom tier (aka Tier-1), including files, documents, e-mails, telephone records, text messages, desktop spreadsheet files, desktop word processing files, and so on.
Each one of the files ingested will create a standard wrapper around each part of discrete content consisting of a header and footer that houses metadata about the content, such as its:
- source,
- frequency of extraction,
- object type,
- file type,
- file format,
- schema for structured data,
- extraction date, and
- ingestion date.
This bottom level of the Hadoop architecture framework can accommodate any number of documents, and with the metadata wrappers around them, they can be easily searched and indexed for inspection by applications that are driven by artificial intelligence techniques or by human SMEs. The essential point of the wrappers is that the metadata within those wrappers has oversight by a data dictionary that ensures metadata values are defined and well understood, such as file types and so on.
Another important way to think about the bottom layer of the architecture is that this layer houses “data,” as opposed to “information,” “knowledge,” or “wisdom.”
In contrast, the middle layer of this Hadoop framework (aka Tier-2) houses “information.” It houses information one fact at a time in a construct that is borrowed from the resource description framework (RDF), called “triples.” Triples are a subset of the RDF, which is a type of rudimentary data model for metadata that houses knowledge, in this particular case gleaned from the “data” collected in the bottom layer (see the below diagram).
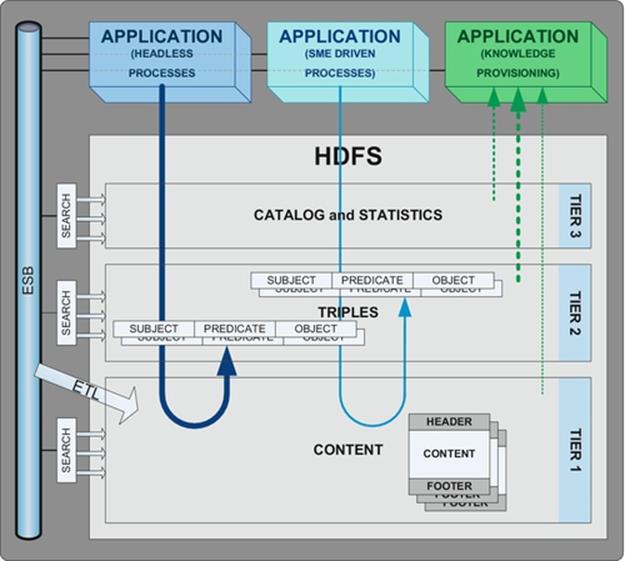
DIAGRAM Hadoop 3-tier architecture for knowledge management.
Triples belong to a branch of semantics and represent an easy way to understand facts that are composed of three parts.
Each triple includes one:
- subject,
- predicate, and
- object.
The “subject” of the triple is always a noun. Rules must be established to determine the setoff things that are permissible to use as a “subject.” The subject can be something as simple as a person or organization, or it may include places or things, as in a noun is a person place or a thing.
The “predicate” of a triple is always a trait or aspect of the “subject” expressed in relationship to the “object,” which is another noun. The set of permissible predicates must be appropriately managed to ensure that they are consistent, defined, and well understood. Rules must also be established to determine the setoff things that are permissible to use as an “object.”
This represents a collection of use cases that are closely aligned to intelligence gathering activities on individuals and organizations. The resulting KM capabilities offer a variety of commercial and government capabilities.
Imagine the applications for triples, such as:
- “Jim” “knows” “Peter”
- “Peter” attends “downtown NYC WOW”
- “Fred” “attends” “downtown NYC WOW”
- “Peter” “makes-shipments-to” “Jim”
- “Peter” “owns” “Firearms Inc.”
Although triples can be stored in HDFS, they can also be stored in HBase, or any other Big Data database using any effective technique or combination of techniques for accelerating storage and retrieval. There are competitions (e.g., IEEE) for being able to manage and effectively use billions of triples.
The top level of our Hadoop architecture contains our catalog and statistics about the other two layers of the architecture. It can reveal how many triples exist, how many times each predicate has been used including which ones have not been used, and so on. As such, the top level (aka Tier-3) contains knowledge about our information (Tier-2) and our data (Tier-1).
At a high level, this architectural framework supports the ingestion of data, while simultaneously building information about the data using “headless” processes and SMEs, for use by business users to ask questions about the information being gleaned by the “headless” processes and SMEs.
3.1.2.4.4.4 Data Warehousing (DW) Use Case Type
Data warehousing is a type of use case that usually requires a response to a query in the span of 3-5 seconds to an end user. The use case type of data warehousing refers to an extensive collection of use cases that involve content that usually involves structured data but may also involve unstructured, and/or semistructured data.
These can include use cases found within the industry sectors of:
- financial services industry
- insurance underwriting
- loan underwriting
- insurance fraud detection
- insurance anti-money laundering (aka AML) detection
- know your customer (aka KYC)
- global exposure
- science-based industries
- pharmaceutical development
- pharmaceutical testing
- pharmaceutical market research
- genetics research
- marketing
- customer analytics
- merger and acquisition (M&A) decision making
- divestiture decision making
- direct and mass marketing campaign management
- customer analytics
- government
- material management
- intelligence community
- human disease management
- livestock disease management
- agricultural disease management
Once the specific use case(s) of data warehousing (DW) have been identified, then one has the ability to start listing specific requirements. Similar to document management, the requirements for basic data warehousing also begins with simple things, such as the number of source systems, the topics of data, the size of the data, and the maximum number of rows, but it also continues into an extensive list that will determine the candidate Big Data products that one may choose from.
Potential data warehouse requirements include:
- maximum space required
- maximum data ingestion sources
- maximum data ingestion rate
- identifying the optimal source for each data point
- data quality issues of each source
- data standardization issues of each source
- data format issues of each source
- database structure issues of each source
- data integration issues of each source
- internationalization (e.g., Unicode, language translation)
- index support
- drill downs
- sharding support
- backup and restorability
- disaster recoverability
- concurrent users
- query access path analysis
- number of columns being returned
- data types
- number of joins
- multi-data center support
In fact, the potential list of requirements for data warehousing can also extend into every nonfunctional type of requirement listed in the nonfunctional requirements section discussed later in this book.
Needless to say, there are many Big Data products in the space of data warehousing on both the Hadoop and non-Hadoop side of the fence, each with their own limitations on data size, number of keys, index ability, retrieval speed, ingestion rates, and ability to support concurrent users.
3.1.2.4.4.5 Real-Time Analytics Use Case Type
Real-time analytics is a type of use case that usually requires a response to a query in the span of 1-5 seconds to an end user, or a response in milliseconds to an automated component which may deliver its response directly to an end user or a fully automated process. The use case type of real-time analytics refers to an extensive collection of use cases that involve content that usually involves structured data but may also involve unstructured and/or semistructured data.
These can include use cases found within the industry sectors of:
- financial services industry
- investment risk
- operational risk
- operational performance
- money desk cash management positions
- securities desk securities inventory (aka securities depository record)
- financial risk
- market risk
- credit risk
- regulatory exception reporting
- trading analytics
- algorithmic trading (i.e., older versions of algorithmic trading)
- real-time valuation
- government
- intelligence
- homeland security
- human disease management
- marketing
- opportunity-based marketing
- dynamic Web-based advertising
- dynamic smartphone-based advertising
- dynamic smartphone-based alerts and notifications
- social media monitoring
Once the specific use case(s) of real-time analytics have been identified, then one has the ability to start listing specific requirements for the applicable use cases. Similar to document management and data warehousing, the requirements for basic real-time analytics begin with simple things, such as the number of source systems, the volume of data, the size of the data, and the maximum number of rows, but it also continues into an extensive list that will determine the candidate Big Data products that one may choose from.
Potential real-time analytics requirements include:
- types of real-time data analytics
- number of concurrent dashboards
- number of concurrent pivots
- number of concurrent data mining requests
- number of concurrent advanced analytics
- maximum space required
- maximum data ingestion sources
- maximum data ingestion rate
- identifying the optimal source for each data point
- number of additional metrics to be generated
- temporal requirements for additional metrics to be generated
- data quality issues of each source
- data standardization issues of each source
- data format issues of each source
- database structure issues of each source
- data integration issues of each source
- internationalization (e.g., Unicode, language translation)
- index support
- drill downs
- sharding support
- backup and restorability
- disaster recoverability
- concurrent users
- query access path analysis
- number of columns being returned
- data types
- maximum number of joins
- multi-data center support
Again, the potential list of requirements for real-time analytics can also extend into every nonfunctional type of requirement listed in the nonfunctional requirements section discussed later in this book.
There are many Big Data products in the space of real-time analytics, although at present they are mostly on the non-Hadoop side of the fence, each with their own limitations on data size, ingestion rates, retrieval speed, costs, and ability to support concurrent users.
In fact, the usual suspects in this use case type include:
- SAP Hana,
- HP Vertica,
- Greenplum, and
- Teradata.
3.1.2.4.4.6 Predictive Analytics Use Case Type
Predictive analytics is a type of use case that usually requires a response to a query in the span of milliseconds or nanoseconds to an automated component which may deliver its response directly to an end user or a fully automated process when the predictive analytic is fully operationalized.
The use case type of predictive analytics refers to an extensive collection of use cases that involve some set of predictive data points that are being rendered to a statistical or nonstatistical mathematical model, or high-speed CEP engine.
These can include use cases found within the industry sectors of:
- financial services industry
- capital markets fraud detection
- wholesale banking fraud detection
- retail banking fraud detection
- market risk forecasting
- market opportunity forecasting
- operational defect forecasting
- marketing
- customer lifetime value (LTV) scoring
- customer defection scoring
- customer lifetime event scoring
- government
- terrorist group activity forecasting
- terrorist specific event forecasting
- engineering and manufacturing
- equipment failure forecasting
- commerce
- open source component forecasting
- 3D printer component design forecasting
- employee collusion forecasting
- supplier collusion forecasting
- customer collusion forecasting
Once the specific use case(s) of predictive analytics have been identified, one has the ability to start listing specific requirements for the applicable use cases. Similar to prior use case types, the requirements for predictive analytics begins with simple things, such as the number of sources, the volume of data, the size of the data, and the maximum number of rows, but again it continues into an extensive list that will determine the candidate Big Data products that one may choose from.
Potential predictive analytics requirements include:
- transaction rates within the operational system
- learning set size
- learning set updates
- traceability
- integrate ability
- deploy ability
Again, the potential list of requirements for predictive analytics can also extend into every nonfunctional type of requirement listed in the nonfunctional requirements section discussed later in this book.
There are many Big Data products in the space of predictive analytics; they are mostly on the non-Hadoop side of the fence, each with their own limitations on operational execution speeds, learning rates, result accuracy, and result traceability.
As a sampling among the entrants for this use case type include:
- Fair Isaac’s HNC predictive models offering,
- Ward Systems,
- Sybase CEP engine, and
- SAS CEP and statistical package offering.
3.1.2.4.4.7 Algorithm-Based Use Case Type
Algorithm based is a type of use case that does not require real-time or near real-time response rates.
The use case type of algorithm-based Big Data refers to an extensive collection of use cases that involve some set of advanced algorithms that would be deployed by quants and data scientists.
These can include use cases found across industries (e.g., science-based industries, financial services, commerce, marketing, and government) involving the following types of algorithms:
- matrix vector multiplication,
- relational algebraic operations,
- selections and projections,
- union, intersection, and difference,
- grouping and aggregation,
- reducer size and replication rates,
- similarity joins, and
- graph modeling.
If these sound strange to you, and there are many more that are even more unusual, I would not worry, as these terms are generally used by experienced quants and/or data scientists.
The types of candidate requirements that one encounters in this specialized area are generally the set of formulas and algorithms that will support the required function.
Some options for this use case type include:
- IBM Netezza for hardware-based algorithms,
- Hadoop HDFS for advanced MapReduce capabilities, and
- Hadoop HBase also for advanced MapReduce capabilities.
3.1.2.4.4.8 Online Transaction Processing (NewSQL/OLTP) Use Case Type
Online transaction processing (NewSQL/OLTP) is a type of use case that usually requires a response to a query in the span of 1-3 seconds or milliseconds to an automated component which may deliver its response directly to an end user or a fully automated process.
The use case type of NewSQL OLTP refers to a collection of use cases that involve some set of transaction processing involving Big Data volumes of data and/or transaction rates.
These can include use cases found within the industry sectors of:
- e-Commerce
- global Web-based transaction systems
- global inventory systems
- global shipping systems
- consumer Products and Services
- in-home medical care systems
- marketing
- RFID supply chain management
- Opportunity-based marketing
- smartphone and tablet transaction systems
- Google glasses applications
- government
- military logistics
- homeland security
Additional nonfunctional requirements can include:
- peak transactions per second
- maximum transaction lengths
- system availability
- system security
- failover
- DR
- complex transaction access paths
- internationalization (e.g., Unicode and language translation)
- full text search
- index support
- sharding support
The potential list of requirements for NewSQL OLTP can also extend into any number of nonfunctional type of requirement listed in the nonfunctional requirements section discussed later in this book.
There are several Big Data products in the space of NewSQL OLTP.
Among the candidates for this use case type are:
- Akiban,
- Clustrix,
- Google Spanner,
- NuoDB,
- SQLFire, and
- VoltDB.
3.1.2.4.4.9 Batch Analytics Use Case Type
Batch analysis is a type of use case that usually requires a response to a query in minutes or hours.
The use case type of batch analysis refers to a collection of use cases that involve volumes of data reaching into the petabytes and beyond.
These can include use cases found within the industry sectors of:
- financial industry
- financial crime
- anti-money laundering
- insurance fraud detection
- credit risk for banking
- portfolio valuation
- marketing
- customer analytics
- market analytics
- government
- terrorist activity forecasting
- terrorism event forecasting
- science-based
- genetic research
- commerce
- employee collusion detection
- vendor collusion detection
- customer collusion detection
The batch analysis type of use case is often the least costly type of use case as it often has fixed sets of large amounts of data with ample time for Big Data technologies to work the problem.
That said, the potential list of requirements for batch analytics can also extend into any number of nonfunctional type of requirement listed in the nonfunctional requirements section discussed later in this book.
There are several Big Data products in the space of batch analytics.
Among the candidates for this use case type are:
- Hadoop HDFS, and
- Hadoop HBase.
3.1.2.4.4.10 GIS Use Case Type
GIS is a type of use case that ranges from batch to real time.
The use case type of GIS refers to a collection of use cases that involve Big Data volumes of data reaching into the terabytes of geographical information and beyond.
This can include use cases involving:
- address geocoding
- warrant servicing
- emergency service
- crime analysis
- public health analysis
- liner measures event modeling
- road maintenance activities
- roadway projects
- traffic analysis
- safety analysis
- routing
- evacuation planning
- towing services
- snow removal services
- refuse removal services
- police, fire, and ambulance services
- topological
- cell phone tower coverage
- elevation data
- orthophotography
- hydrography
- cartography
- hazardous materials tracking
- taxable asset tracking (e.g., mobile homes)
The GIS type of use case includes nonfunctional requirement types, such as:
- user friendliness
- ACID compliance
- full spatial support (i.e., operators involving physical proximity)
- near
- inside
- between
- behind
- above
- below
- flexibility
That said, the potential list of requirements for batch analytics can also extend into any number of nonfunctional type of requirement listed in the nonfunctional requirements section discussed later in this book.
There are several products in the space of GIS analytics.
Among the candidates for this use case type are:
- Neo4j,
- PostGIS
- open source
- geographic support
- built on PostgreSQL
- Oracle Spatial
- spatial support in an Oracle database
- GeoTime
- temporal 3D visual analytics (i.e., illustrating how something looked over time)
3.1.2.4.4.11 Search and Discovery Use Case Type
Search and Discovery is a type of use case that usually requires a response to a query or many subordinate queries in the span of 1-3 seconds or milliseconds.
The use case type of Search and Discovery refers to a collection of use cases that involve some set of searching involving Big Data volumes of data.
These can include use cases found across industries involving:
- Web site search
- internal data source identification and mapping
- external data source identification and mapping
- discovery (i.e., searching for data categories across the data landscape of a large enterprise)
- e-discovery
There are few competitors in this space, including:
- Lucidworks (i.e., built on Solr with an enhanced GUI for common use cases)
- Solr
- Splunk (i.e., for machine generated output)
3.1.2.4.4.12 Relational Database Technology in Hadoop Use Case Type
In contrast to the technique of a relational database management system operating outside Hadoop, such as SQL Server Polybase with access to data within HDFS using something like Hive, Pig, or Impala, a relatively recent type of use case is that of supporting a full relational database capability within and across a Hadoop cluster.
This use case type is particularly interesting as it facilitates real-time queries over extremely large relational databases to be deployed across a Hadoop cluster in HDFS, using MapReduce behind the scenes of a standard SQL interface.
There are few competitors in this space as well including:
- Splice Machine (full SQL), and
- Citus Data (append data only).
The architecture of this class of product is that it essentially requires software on each node of the Hadoop cluster to manage the SQL interface to the file system.
There are several advantages of this use case type especially where full SQL is supported, including:
- use of existing SQL trained personnel,
- ability to support extremely large relational database tables,
- distributed processing that leverages the power of MapReduce,
- a full complement of SQL capabilities, including
- grant and revoke,
- select, insert, update, and delete
3.1.2.4.4.13 Big Data Is Use Case Driven—Summary
The most important point I hope you take away here is that approaching Big Data tool selection from the tool side, or trying to make one product support the needs of all use cases, is clearly the wrong way to address any problem.
It would be like a pharmaceutical company suggesting on television that you try a particular drug that they manufacture for any and every aliment you have, when you need to begin by consulting a physician with the symptoms and then work toward a potential solution that meet your particular set of circumstances, such as not creating a conflict with other medications you may already be taking.
Unfortunately, the tool approach is too frequently adopted as people have a tendency to use the one or few tools that they are already familiar or enamored with. As architects, we should never bypass the step of collecting requirements from the various users, funding sources, and numerous organizational stakeholders.
Those who adopt a tool as their first step and then try to shoehorn it into various types of use cases usually do so to the peril of their organization. The typical result is that they end up attempting to demonstrate something to the business that has not been properly thought through. At best, the outcome is something that is neither as useful and as cost-effective as it could have been, nor as useful an educational experience for the organization that it could have been. At worst, the outcome represents a costly exercise that squanders organizational resources and provides management with a less than pleasant Big Data technology experience.
That said, there is much value in exercising a variety of Big Data tools as a means to better understand what they can do and how well they do it. New products in the Big Data space are being announced nearly every month and staying on top of just the marketing information perspective of each product requires a great deal of knowledge and energy. More important than the marketing materials however is the ability to understand how these products actually work and the ability to get the opportunity to experiment with the particular products in which the greatest potential utility exists to meet your needs.
If you have a Big Data ecosystem sandbox at your disposal, then you are in luck within the safety of your own firewalls, but if you are not fortunate enough to have a Big Data ecosystem sandbox at your disposal, then the next best thing or possibly better is to be able to rent resources from a Big Data ecosystem sandbox externally to your enterprise, such as from Google, Amazon, or Microsoft, where you may be able to rent access to whatever Big Data product(s) you would like to experiment with using your data in a secure environment.
3.1.2.4.5 Organizing Big Data into a Life Cycle
The landscape of Big Data tools is reminiscent of when DOS commands were the only command interface into the world of the personal computer. At that time, humans had to mold their thinking to participate in the world of the computer, whereas Finder and Windows eventually molded the computer to what humans could instinctively understand so that it could interact more effectively in our world.
Although the landscape for Big Data will continue to rapidly evolve into the near future, its proper deployment will continue to be anything but trivial for some time into the future. Before we get into what a proper deployment model looks like, let’s first look at an “ad hoc” deployment model.
3.1.2.4.5.1 Ad hoc Deployment
Each ad hoc deployment is actually quite simple, at least initially. It generally begins with the identification of a possible use case.
The use case that is chosen is usually an interesting one that advertises to solve some problem that could not previously be solved, such as the challenge of consolidating customers across an area of an insurance company, where the number of insurance policy applications makes it particularly labor intensive to consolidate each additional few million customers on a roadmap to a hundred million customers.
A popular big data database tool is chosen, such as MongoDB or Cassandra, and a partial solution is achieved within a 6-month time frame with relatively low cost and effort. We all know the way this story continues. It is increasingly difficult and expensive to compete the customer consolidation effort, so folks lose interest in that project and then start looking for the next ad hoc big data project.
This ad hoc process is repeated for either the same use case in other countries and for new use cases, all of which also achieve partial solutions within short time frames with relatively low cost and effort. As we advance forward in time, we find ourselves with numerous partially completed efforts cluttering the IT landscape, with each delivering great business benefit to small pockets of customers and business users across that as an aggregate are ultimately inconsequential to the overall capabilities and efficiency of the organization.
3.1.2.4.5.2 Big Data Deployment
Big Data deployment should be driven by a set of principles that serve to help frame the discussion.
Big Data deployment principles include:
- deployment of big data technologies follow a defined life cycle
- metadata management is a consideration at each step of the life cycle
- iterations of a big data life cycle generate lessons learned and process improvement
- projects involving Big Data must adhere to the same ROI standards as any other
- deployments of Big Data require the same if not additional governance and oversight
- Big Data should leverage shared services, technologies, and infrastructures
- operational frameworks should quarantine business users to only “approved” use cases
Now that we have a basic set of principles to help provide considerations for the deployment of Big Data, we will organize our discussion into sections for:
- Plan,
- Build, and
- Operate.
3.1.2.4.5.3 Big Data Deployment—Plan
The “Plan” phase of Big Data begins with business selecting the business use case type(s) that they need to advance the business in the direction they wish to go or to address specific a business pain point. Either way, they will need to quantify the business value of what they wish to accomplish.
Associated with business use case type(s), there are a list of technologies that specialize within that area of Big Data. Although the list of technologies is constantly evolving with new licensed and open source possibilities, that list should be reassembled every couple of months.
If products that have been incorporated into the Big Data ecosystem are no longer the better choice, a retirement plan will have to be developed to decommission it from the ecosystem. Given the fact that Big Data technologies are so volatile, the process of decommissioning products should become a core competence of every organization that does not wish to accumulate an inventory of young yet obsolete products, and its associated infrastructure.
At this juncture, the business in partnership with enterprise architecture must identify the nonfunctional requirement types that must be provided for use case types under consideration distinct from the nonfunctional requirement types that are merely nice to have (see the section 8.1.1).
Given the nonfunctional requirement types that are unambiguously required, candidate technologies will be disqualified as unable to support mandatory nonfunctional requirement types. The product or products that remain should be fully eligible to address the particular Big Data use case types. If more than one product is eligible, then they should all continue through the process to the ROI assessment.
In the event that new Big Data technologies must be introduced into the ecosystem, the architecture team should develop frameworks to incorporate the new Big Data technology into the ecosystem, and the operations area should be consulted to begin determining the new support costs for the eligible technologies.
The activities up to this point are supported by the business area, enterprise architecture, and operations staff as part of the services that they provide, and may not be a formal project.
By this time however, a project with a project manager should be formed encompassing the following activities under a modest planning budget:
- specific business use cases are determined by business analysts
- business value is determined for each business use case by business
- business requirements are recorded by business analysts
- candidate systems of record are identified as potential data sources
- specific business users and/or business user roles are identified for each use case
- interests of various stakeholders are incorporated into standards
- enterprise architecture
- compliance
- legal
- chief data officer
- assess the capacity of the environment
- operations provides costs and schedules for
- adding capacity to an existing Big Data technology or
- standing up a new technology
- business analysts identify specific sources of data to support each use case
- assess whether
– data will be fully refreshed each time
– data will be appended to existing data
– data will be updated
– data will be deleted
- eligible technologies undergo an architecture ROI assessment
- stakeholders assess the implications of the particular combination of data sources
- legal
- auditing
- compliance
- chief data officer
- data owner
- approval to leverage data from each data source for each use case is acquired
- legal
- auditing
- compliance
- chief data officer
- data owner
- detailed nonfunctional requirements are recorded by business analysts
- enterprise architecture presents product recommendation
- vendor management determines cost associated with
- product licensing and/or open source support
- training
- architecture ROI is leveraged to complete the ROI analysis
- business ROI
- finance ROI
- product selection is finalized
- business management
- IT management
- identify funding requirements for
- build phase
– software costs (e.g., licenses and/or open source support agreements)
– hardware costs
– data owner application development (AD) support
• data extraction
• data transport to landing zone
– Big Data application development (AD) team support
• determine whether files will be encrypted
• determine whether files will be compressed
• metadata data quality checks
• column counts
• field data types and lengths are present
• file data quality checks
• record counts and check sums
• special character elimination
• row-level data quality checks
• metadata row-level validations
• prime key validations
• prime foreign key validations
• foreign key validations
• column data quality checks
• data profiling
• data cleansing
– domain values
– range and min-max edits
• data standardization
– reference data lookups
• data reformatting/format standardization
• data restructuring
• data integration/data ingestion
– testing and migration team support
– Big Data architecture support
– Big Data operations setup
– helpdesk setup
– business support costs
- operate phase
– ongoing operations support
– ongoing helpdesk support
– business operational costs
- future decommission phase
- present the project to the planning board
- funding assessment
- funding approval
- funding rejection
- returned for re-planning
3.1.2.4.5.4 Big Data Deployment—Build
The “Build” phase of Big Data begins with an overall project manager coordination multiple threads involving oversight and coordination of the following groups, each led by a domain project manager:
- operations—operations project manager,
- vendor(s)—vendor project manager(s),
- business—business project manager,
- data source application development teams—data source AD team project manager(s),
- Big Data application development team—Big Data AD team project manager, and
- test/migration team—test/migration team project manager.
The operations team supports the creation of a development, user acceptance test (UAT), and production environment with the capacity required to support the intended development and testing activities. Prior to production turnover operations will test system failover, and the various other operational administrative tasks that fall to them.
Vendors support the architecture, design, and implementation of the products they support, including installation and setup of the software in the development, UAT, production environment, and the training and mentoring of business users and IT staff in the use and administration of the product, and participate in the testing of operational procedures for the administration of the system.
Business supports the business analysts and the Big Data AD team in their efforts to profile the data so that data cleansing, data standardization, data reformatting, and data integration decisions can be made to best support the needs of the business for their use cases. During this process, business will also identify the metadata and metrics about process that will help accomplish their objectives. The business will also test the set of administrative functions that they are responsible for to support their use cases.
Ultimately, business must evaluate the extent to which data quality checks of each type should be performed based upon the use case, its business value, and business data associated with each use case.
The data source AD team(s) support the identification of required data within their source systems and then develop the software to extract the data either as a one-time effort or in accordance with the schedule of extracts to meet the needs of one or more specific use cases that have been approved. The data is then transported to the required location for additional processing by the Big Data AD team.
The Big Data AD team coordinates the receipt of data from the various data owners and works with the business and business analysts to profile and process the data for ingestion into the Big Data product set in the development environment. Once the appropriate metadata and metrics are also identified and collected, this AD team will conduct unit testing to ensure that the various components of data and technology can perform their function. When unit testing is complete, the data and software are passed to the test and migration team as a configuration of software and data. The Big Data AD team will also test the set of administrative functions that they are responsible for to support the Big Data capabilities.
The test and migration team accepts the data and software from the Big Data AD team and identifies the components as a configuration that will undergo user acceptance testing and then migration to production. Prior to this however, the test migration team works with the business and business analysts to develop a test plan that will ensure that all of the components operate together as they should to support each and every use case.
The configuration management components of the Big Data project include:
- software products that are used including their versions
- applications including
- Java code
- Flume interceptors
- HBase coprocessors
- user-defined functions
- software syntax
- parameters and associated software product or application
- programming code and associated software product or application
- data transformation code
– file-level cleansing
– field-level cleansing and edits
– data standardization
– reformatting and restructuring
- inbound data sources and outbound data targets
- file names
- schemas including their versions
- approved business use cases
- complete description of each use case
- description of permissible production data
- individual approver names and dates
Once the system has been tested by business users and possibly business analysts in the user acceptance environment, the test results are reviewed by the various stakeholders. Included within these tests are test cases to confirm the appropriate nonfunctional requirements of the Big Data application have been met, such as security, usability, and data obfuscation requirements.
These overall lists of stakeholders that must render their approval include:
- business management,
- business users who participated in testing each use case
- IT development management,
- legal,
- auditing,
- compliance,
- chief data officer,
- data owner(s) of the sourced data,
- test and migration management, and
- IT operations management
3.1.2.4.5.5 Big Data Deployment—Operate
The “Operate” phase of Big Data begins with the “go live” decision of the stakeholders, where the various components of the configuration are migrated from the configuration management folders representing UAT environment to the production environment including the data used in UAT. Once migrated, an initial test is performed in production to test the production infrastructure including startup and shutdown, job scheduling capabilities, and the administrative functions that each respective area is responsible for.
If critical issues arise, the system may remain unavailable for production use until at least the critical issues are resolved.
When successful, the data used for testing will be removed and a full complement of production data will be introduced using the normal operational processes associated with production. At this point, the production system is made available for production operation for use by the business.
3.1.2.4.5.6 Big Data Deployment—Summary
The important thing to note after following a proper Big Data deployment plan is that the appropriate stakeholders have confirmed that the compliance and regulatory needs have been met, and that the proper audit controls have been put in place.
At this point, if there is an audit from a regulator, everyone has performed the due diligence required of them, including the approval of specific use cases, use of specific data sources, and most importantly the combination of specific data sources and data for use in specific use cases.
There are quite a number of considerations and complexities when establishing Big Data development, integration test, UAT, and production environment, and few vendors with a handle on this space that would be suitable for a financial services company or large enterprise with rigorous regulatory oversight and mandates across the globe.
3.1.2.4.6 Metadata of a Big Data Ecosystem
There are 20 basic topic areas of metadata that pertain to Big Data, and within those, there are hundreds of metadata data points.
The basic topic areas of Big Data include:
- use case planning/business metadata,
- use case requirements metadata (e.g., data and applications),
- internal data discovery metadata/locating the required data across the enterprise,
- external data discovery metadata/locating the required data from external data providers,
- inbound metadata,
- ingestion metadata,
- data persistence layer metadata,
- outbound metadata,
- technology metadata,
- life cycle metadata,
- operations metadata,
- data governance metadata,
- compliance metadata,
- configuration management metadata,
- team metadata (e.g., use case application team, technology provisioning application team, data provisioning application team)
- directory services metadata,
- ecosystem administrator metadata,
- stakeholder metadata,
- workflow metadata, and
- decommissioning metadata.
As a sampling of the metadata contained within, let’s explore the first several topics of metadata.
3.1.2.4.6.1 Use Case Planning/Business Metadata
The use case planning/business metadata category of metadata encompasses the information about the use case beginning with the business concept and the anticipated business benefit. As such, it would discuss its informational requirements with suggestions as to which lines of business may be able to supply data from within the organization, and suggestions as to which data providers may be able to meet its data requirements from outside the organization.
External sources may include any combination of sources, such as:
- academic organization,
- administrative jurisdiction (e.g., states, provinces),
- specific company with whom an agreement to provide data has been negotiated,
- data reseller whose primary business is reselling data,
- industry group,
- international organization (e.g., United Nations)
- treaty zone,
- national government,
- news organization, and
- social media source (e.g., Facebook, Twitter).
3.1.2.4.6.2 Use Case Requirements Metadata
The use case requirements category of metadata encompasses the information about the data sources identified and the candidate technologies that support the type of use cases desired.
Regarding data sources, the metadata identifies the specific sources from which the necessary data is available to be sourced. For many use cases, the degree to which data source availability exists or has been identified will determine the viability of the use case at this point in time.
Regarding the candidate technologies, the metadata identifies the minimum and desired set of capabilities that technologies will have to provide to facilitate the processing of the data and its associated data volumes and data velocity. For many use cases, the degree to which technology availability exists or has been specifically identified will also determine the viability of the use case at this point in time.
3.1.2.4.6.3 Internal Data Discovery Metadata
The internal data discovery metadata category of metadata encompasses the information about data discovery across the data landscape. Although effective technologies exist in this space, the most frequent method for identifying locations from across the enterprise is manually supported by collaboration and word of mouth.
3.1.2.4.6.4 External Data Discovery Metadata
The external data discovery metadata category of metadata encompasses the information about data discovery outside the organization across the data landscape. For this category of data discovery, a complete product has not yet emerged, although the parts of such a product in fact are available for integration.
At present, the most only method for identifying locations external to the enterprise is manually supported by research into companies and online data providers from across the Internet.
3.1.2.4.6.5 Inbound Metadata
The inbound metadata category of metadata encompasses the information about the data being transported to the Big Data ecosystem.
This begins with the transport mechanism, such as whether it is over an ESB, ETL product, file transport protocol (FTP), utility, developed program, or physically carried medium (e.g., tape, cartridge, drive). It also includes every useful piece of information that will be needed to process the file once received, such as the file name(s), encryption or decompression algorithm, and a long list of details that will be required about the file (e.g., file type, file format, delimiting character) including the taxonomy of the file name that may incorporate many of the metadata characteristics within its taxonomy.
3.1.2.4.6.6 Ingestion Metadata
The ingestion metadata category of metadata encompasses the information about the “process” used to accept the data being delivered to the Big Data ecosystem.
This metadata involves a wealth of metadata surrounding “initial profiling,” data cleansing, data standardization, data formatting, data restructuring, data integration, and file readiness. It is useful to collect a variety of metrics on the raw data for analysis and subsequent reporting to help facilitate business awareness and their data governance activities.
3.1.2.4.6.7 Data Persistence Layer Metadata
The data persistence metadata category of metadata encompasses the information about the data landed into the Big Data ecosystem.
This metadata contains a collection of data points such as the:
- file name(s) of the landed data and its taxonomy,
- HDFS Hive directory,
- HDFS pathname,
- HDFS table name,
- HDFS staging directory,
- HDFS raw directory,
- received date,
- temporal requirements (aka history),
- applicable compression algorithm,
- file splittability,
- archive begin date,
- file permissions, and
- data sensitivity profile.
3.1.2.4.6.8 Outbound Metadata
The outbound category of metadata is a topic area of metadata that assumes a particular architectural framework where the Big Data space accumulates source data from within the enterprise as well as from external sources with the intent to extract it into a quarantined use case production container. The container can be of any style of Big Data, including any of the traditional Big Data, Hadoop based, or any of the other open source or proprietary technologies, such as those that perform high-speed joins across large numbers of tables or ones that perform complex algorithms in a sophisticated appliance solution.
3.1.2.4.6.9 Technology Metadata
The technology category of metadata encompasses a wealth of Big Data technology-related metadata for each of the products that are part of the development, integration test, quality assurance, and production ecosystem.
Sample technology metadata can overlap and extend the information that is typically captured as part of a technology portfolio practice:
- product name,
- product version/release,
- origin of source code,
- support agreement,
- document name for standards governing development use,
- document name for standards governing its operation,
- component list of reusable functions under management,
- product limitations,
- product run book, and
- product run time parameters.
3.1.2.4.6.10 Life Cycle Metadata
The life cycle category of metadata encompasses information about the various life cycle environments and the metadata associated with the approvals to promote data, programmed components, and product versions.
The level of maturity of operational metadata that will be needed depends largely on the regulatory requirements of your particular organization’s industry.
Sample life cycle metadata may include:
- test plans and their versioning,
- test results and their versioning,
- test team approvals by component,
- architectural approvals,
- business approvals,
- operations approvals,
- helpdesk approvals,
- PMO approvals,
- compliance approvals, and
- audit approvals.
3.1.2.4.6.11 Operations Metadata
The operations category of metadata encompasses information about operations readiness. The level of maturity of operational metadata that will be needed depends largely on the regulatory requirements of your particular organization’s industry.
Sample operations metadata may include:
- equipment delivery dates,
- equipment installation dates,
- equipment setup dates,
- environment readiness dates,
- product installation dates,
- product setup dates,
- job scheduling planning dates,
- job scheduling setup dates,
- failover testing dates,
- DR testing dates,
- use case application installation guides, and
- use case application operation guides.
3.1.2.4.6.12 Data Governance Metadata
The data governance category of metadata encompasses information about the data governance program. Even though this area of metadata is often omitted, from the perspective of usefulness, this is the single most important area of metadata to get right. Correspondingly, when one looks at any of the numerous initiatives that fail, it is almost guaranteed that this area of metadata, along with the use case planning metadata, is generally nowhere to be found. The most obvious reason for this is that there is little that can be achieved from analysis of data that the data scientist or data analyst does not understand.
Sample data governance metadata may include:
- business data glossary entry names for each inbound schema data point,
- business data glossary entry names for each subsequently derived data point,
- business metadata percent completeness for each business data glossary entry,
- data source evaluation(s),
- data lineage, and
- data steward associated with each data source.
3.1.2.4.6.13 Compliance Metadata
The compliance category of metadata encompasses information pertinent to the various areas of scope overseen by compliance, such as human resource compliance, legal compliance, and financial compliance.
Sample compliance metadata may include:
- data sensitivity associated with individual data points used in combination for a use case,
- regulatory jurisdiction(s),
- information input to compliance,
- compliance assessment of input,
- compliance decision, and
- compliance decision date.
3.1.2.4.6.14 Configuration Management Metadata
The configuration management category of metadata encompasses the basic information that identifies the components of each Big Data environment and each use case and application.
Sample configuration management metadata may include:
- required Big Data technology ecosystem,
- source files,
- data transport components,
- initial data profiling components,
- data cleansing components,
- data standardization components,
- data standardization code table components,
- data reformatting components,
- data restructuring components,
- data integration components,
- product versions,
- customized product components,
- source code of developed programs and product syntax, and
- product run time parameters.
3.1.2.4.6.15 Team Metadata
The team metadata category of metadata encompasses the application development team that is associated with the use case, technology provisioning, and data provisioning.
The use case application development team is the team focused on the business problem and is responsible for understanding it and addressing it more than any other development team.
The technology provisioning team is the Big Data team that is focused on managing and supporting the technology portfolio across the Big Data ecosystem, which may entail a large number of technologies and products involving traditional Big Data, Hadoop-based Big Data, and specialized proprietary technologies.
The data provisioning application development team is each application development team associated with the applications that originate or process the data downstream from where it originates.
3.1.2.4.6.16 Directory Services Metadata
The directory services metadata category of metadata encompasses the permissions aspects of the data, applications, and products within each environment of the life cycle.
At its basic level, it consists of the IT user groups, users, and assignments of users to user groups, as well as use case owner groups, use case owner users, and assignments of use case owner users to the use case owner user groups.
At a more advanced level, it consists of the history and attrition of users and approvers, user recertification, and approver recertification metadata.
3.1.2.4.6.17 Ecosystem Administrator Metadata
The administrator metadata category of metadata encompasses the various aspects related to sustaining the life cycle environments at an agreed-to service level that facilitates development and production activities.
Sample configuration management metadata may include:
- ensuring product and technology licensing coverage, including freeware licenses,
- product and technology maintenance agreement coverage,
- evaluating and applying software upgrades,
- applying hardware upgrades and configuration modifications,
- ensuring backups of data and software,
- restoring backed up data and software when required,
- incident tracking and problem management, and
- providing support to users within the various environments for system-level services.
3.1.2.4.6.18 Stakeholder Metadata
The stakeholder metadata category of metadata encompasses the tracking of designated owners and approvers that have interests that must be represented and protected. This includes identification of individuals that must provide budgets and approvals.
Sample stakeholder metadata may include:
- use case owners,
- compliance,
- legal,
- auditing,
- architecture,
- operations,
- use case application development teams,
- business data owners,
- data owner application development teams, and
- Big Data ecosystem application development team.
3.1.2.4.6.19 Workflow Metadata
The workflow metadata category of metadata encompasses the various types of information related to the processes that must be performed and adhered to.
Sample workflow metadata may include:
- services catalog that services may be requested from,
- requests for services,
- process steps,
- inputs to process steps,
- outputs from process steps,
- department originating each request,
- contact person submitting the request,
- request date time,
- request approvals from either business or IT,
- group assigned to service support the request,
- individual assigned to support the request,
- estimated hours of labor to complete the request,
- estimated completion date,
- actual hours of labor to complete the request,
- actual completion date,
- requestor approval and request closure,
- reopening of closed requests,
- requests that failed to complete and the reason associated with the failure,
- request reassignment date,
- request cancellation date, and
- request modification date.
3.1.2.4.6.20 Decommissioning Metadata
The decommissioning metadata category of metadata encompasses the information associated with retire any combination of the following:
- Big Data ecosystem,
- use case,
- a particular use case application,
- a particular quarantined production area,
- Big Data technology or product,
- data file source, and
- data file instance.
The information collected will include backups of the items being decommissioned to the extent required by records information management (RIM) guidelines and regulatory requirements associated with the particular organization.
3.1.2.4.6.21 Metadata Summary
The topic of Big Data metadata is somewhat large, and it is best to grow into the various metadata maturity levels over time, starting with the metadata required on day one, which can vary significantly depending upon the regulatory oversight required of your organization. Additionally, there are various methods for collecting metadata using automation that can accelerate any Big Data initiative.
The best approach to navigate these topics appropriately for the industry in which your organization belongs is to engage SMEs in this space, of which there are a few excellent choices of vendors who have SMEs that address these topics.
3.1.2.4.7 Big Data—A Little Deeper
Whether the Big Data approach is based upon Hadoop or a proprietary data persistence layer, the speed with which they offer their various capabilities is dependent upon solid architectural techniques and some permutation of the same five fundamental accelerators.
For example, use case types that employ reference data in their processing must replicate reference data on each node to keep them from going out to a shared resource.
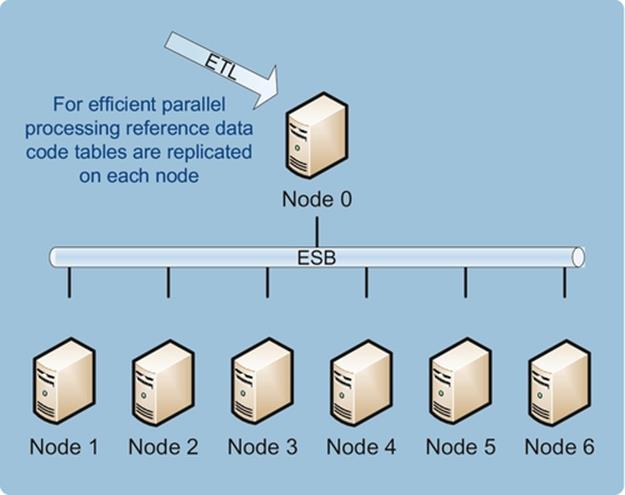
DIAGRAM Parallel processing requires reference data replication.
In total, the five fundamental Big Data accelerators include:
- parallel and distributed processing,
- reduced code set that eliminates large amounts of DBMS code,
- fewer features than OldSQL transaction databases that reduce the work being performed,
- compression, and
- proprietary hardware that perform algorithms on processors that are co-located on the data persistence layer.
To illustrate what we mean, we will take one of these and drill it down in simple steps to a level that most enterprise information architects never thought possible.
3.1.2.4.7.1 Compression—Background
Compression is not only a large topic, but it is also more fundamental to the Big Data accelerators than the others for a simple reason.
Computers are comprised of three fundamental components, which are one or more CPUs, memory, and a bus, which is a circuit that connects two different parts together where in this case it is the bus that connects the CPU to the memory. More than most components, the essential factors in determining computer speed are the CPU speed and the speed of the bus.
One obvious way to make computation faster is to make faster CPUs and bus circuits. As the components of computers shrink in size to the molecular and atomic level, the physical limitations of designing faster CPUs and bus circuits are approaching nature’s limit for the speed of light.
However, another obvious way to make computing faster is the ability to pass far fewer bits of data and machine instructions through the bus to the CPU. Due to the way computer technology has boot strapped each new technology on top of older technologies, for the most part today’s computers pass thousands of times more bits through the bus to the CPU than is absolutely necessary to perform each calculation. Hence, the concept of “least number of bits” (LNBs) as a totally new and comprehensive architecture.
Its scope spans compression optimal concepts across all hardware and software. For software, this includes the operating system, the executables (aka binaries) that are run on the operating system, data, metadata, network and bus traffic, and any content that must travel over a bus to interact with each CPU. The concept of compression within each of these areas is essentially the same, which is to reduce the size of these artifacts, whether executables, data, or metadata so that they take up less space.
The techniques to achieve compression vary by type of artifact, and the ability to compress an artifact is largely determined by whether the artifact is being compressed individually in isolation to everything around it, or jointly with respect to its ecosystem where compression across the components of the ecosystem is being coordinated to be optimized.
For example, an advanced form of application architecture called process normalization can significantly reduce the number of lines of code in large information systems. However, process normalization itself leverages other disciplines such as a well-formed logical data architecture (LDA) and an appropriate combination of service-oriented architecture (SOA) and object-oriented architecture (OOA). When combined, an SOA focus is applied to user functions and an OOA focus is applied to system services, such as data services involving data persistence layers.
Another important point about compression is that its optimization is not always about achieving an artifact of the smallest size.
Optimization with respect to compression is the overall result that achieves the LNBs summed up (in total instructions plus data) having to be presented to the CPU to achieve a defined unit of work.
This definition takes into consideration the additional overhead of compression and decompression algorithms, as well as any mathematics that are performed as an alternative to executing I/O operations.
Since this is a topic of an entire book on its own, we will take the reader on a brief journey into the topic of “data compression” as an introduction to these concepts.
3.1.2.4.7.2 Data Compression—Background
The topic of data compression is generally poorly understood even among data experts with a lifetime of experience.
The notion of compression that is assumed by many is the type of data compression that one gets from eliminating repeating bytes of characters, which in its most simple form are data strings or fields containing repeating blanks (e.g., hexadecimal “40”), zeros (e.g., hexadecimal “F0”), or low values (e.g., hexadecimal “00”). The early commercial compression tools available for personal computer used a form of data compression that is far more effective by using an algorithm called LZ77 (and later LZ78) and Huffman coding.
The basic concept behind Huffman coding is simple. It creates a b-tree of the alphabet that is to be compressed using a form of encoding and represents its characters in a binary tree based upon the frequency with which these characters occur within streams of data (see the below diagram).
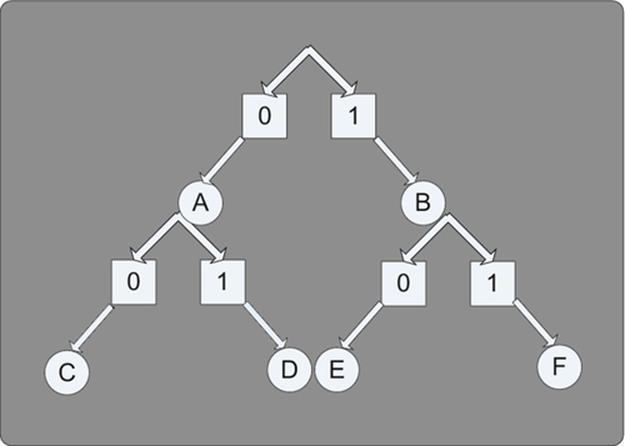
DIAGRAM Huffman table concept.
Using the Huffman Table Concept diagram, letters would be encoded in binary as follows:
- Alphabet character “A” = Binary “0,”
- Alphabet character “B” = Binary “1,”
- Alphabet character “C” = Binary “00,”
- Alphabet character “D” = Binary “01,”
- Alphabet character “E” = Binary “10,” and
- Alphabet character “F” = Binary “11.”
The algorithms would encode streams of characters into an encoded (and usually compressed) output stream and decode the encoded stream into an uncompressed stream.
3.1.2.4.7.3 Data Compression—Columnar Databases in a Relational DBMS
If we recall the format of the OldSQL database page, depending upon the size of the page, the length of each record, and the amount of free space that was designated during the initial database load, only a certain number of records would be able to fit on the same page.
Let’s assume one of the most common database page sizes of 4K (i.e., 4096 bytes) and a hypothetical record size of 750 bytes. This would give us five records per page totaling 3750 bytes with 346 bytes left over for the database page header, page footer, and free space.
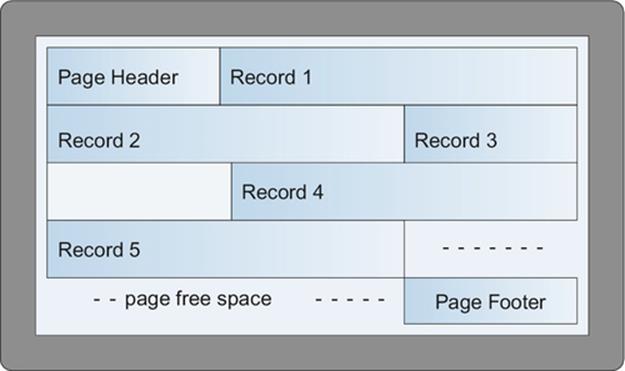
DIAGRAM OldSQL database page with five records.
In this scenario, let’s also assume that there are some number of fields on each record, where one field is State Code.

DIAGRAM State code and household income amount field per record.
If this was a Big Data database with 120 million households in the USA, then we would have to read a 4K page for every five State Codes and Household Income Amount fields. To do the arithmetic that would be 120,000,000 divided by 5 pages, or 24 million 4K pages that would have to be read. This amounts to 98,304,000,000 bytes, which we will round up to 100 gigabytes for ease of calculation purposes.
There are various architectures of columnar databases. The most basic form of columnar database, which is also the one that takes the least amount of software development to achieve a columnar database, is one that leverages the infrastructure of an existing relational database management system.
In this basic form of columnar database, the rows of a table are redesigned tohouse an array of only one field. In the example below, the row has been redesigned to house an array of 10 fields representing the same column of data.
For drawing purposes, we have illustrated an array of 10 columns per row. With five rows per page, this allows us to store 50 fields on each database page.
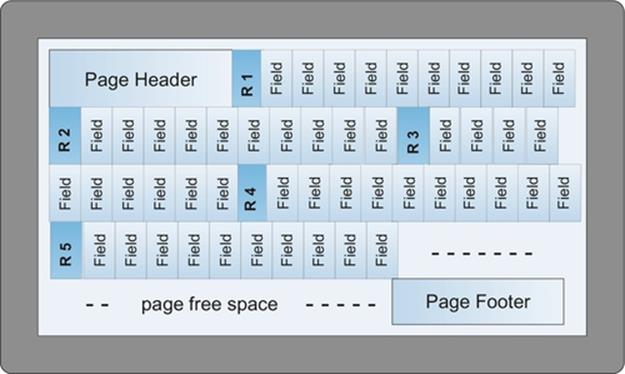
DIAGRAM Columnar database implemented in a relational DBMS.
More realistically though, if the field was a two-character State Code, then we should be able to store 375 State Codes per row, or 1875 State Codes per 4K page instead of our original 5.
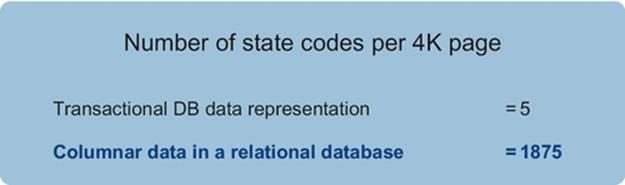
DIAGRAM Two-character state codes in a columnar-relational DB.
From a high-level perspective, the columnar approach in a relational database is 375 times more efficient (i.e., 1875/5) because the I/O substructure only had to render one 4K page to get 1875 State Code values, whereas it only acquired 5 State Codes after reading a 4K page when it was a standard OldSQL transaction database.
3.1.2.4.7.4 Data Compression—Columnar Databases in a Columnar DBMS
As we already know, when one designs a database management system from the ground up, it can take advantage of clearing away any excess infrastructural components and vestiges of transactional database management technology, or even the file access method and file organization technology and conventions that it is built upon. If we draw our diagram again with only columns one after another, we can now accommodate additional columns per page.
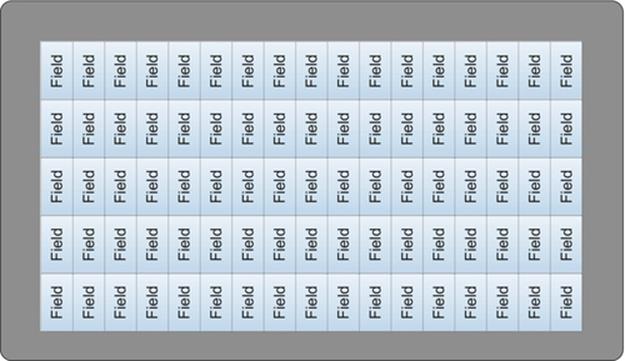
DIAGRAM Columnar database implemented in a columnar DBMS.
Again, more realistically though, if the field was a two-character State Code, then we should be able to store 2048 State Codes per 4K page instead of our original 5 per page.
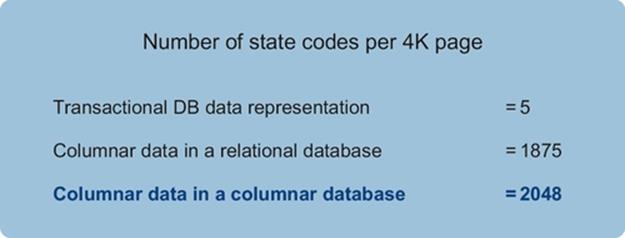
DIAGRAM Two-character state codes per 4K page.
From a basic architectural perspective, the columnar approach in a columnar database is 409 times more efficient (i.e., 2048/5) because the I/O substructure only had to render one 4K page to get 2048 State Code values, whereas it only acquired 5 State Codes after reading a 4K page when it was a standard OldSQL transaction database.
This initial perspective on a columnar database will serve as our starting point as we drill deeper into data compression in the context of columnar databases.
3.1.2.4.7.5 Data Compression—Summary
There are a myriad of additional techniques to consider when optimizing the compression of data into what can mathematically be referred to as the LNB format (aka hyper-numbers, hyper-compression). While many of basic techniques do not require profiling the data, a number of extremely effective techniques require advanced data profiling to determine the true LNB storage strategy to employ.
The concepts of LNB and its ensuing branch of mathematics first began as a means to address what are called NP-complete problems, where the NP stands for nondeterministic polynomial time. The concept of NP-complete however is quite simple.
NP-complete represents all mathematical formulas, including any computational algorithms, where (a) it can be mathematically proved that the formula or algorithm will determine the correct results, (b) when the results are determined, the accuracy of those results can be proved in a reasonably short span of time, but (c) to execute the formula or algorithm on even the fastest computers to get the accurate result set will take a greater span of time than one has, which in many cases would be billions of years after the sun is expected to go supernova.
The most famous NP-complete problem is the traveling salesman problem (TSP). Given n number of cities and the length of roadway between each city, determine the shortest path that can be traversed to visit all n cities. Although challenging to a computer, there are algorithms using a number of concepts from LNB that can solve these problems where n can be as large as many thousands. The greater the number of LNB concepts deployed on NP-complete problems, the greater the ability to calculate accurate results in a reasonable span of time.
For example, 1 join of 15 tables containing a million rows per table can fully occupy a dedicated mainframe computer for days when using conventional database technologies, whereas the same or smaller computing platform reasonably architected using LNB concepts will perform a join across 30 tables containing a hundred million rows per table in seconds, such as on a Windows Intel box. This difference in performance is made possible by the extremely few number of bits traveling through the bus and CPU from data, metadata, and machine instructions. The total bits required to get the correct result set are several magnitudes less when employing an LNB architecture.
When advanced compression is combined with the other four fundamental Big Data accelerators, then the resulting computational performance pushes even deeper into realm of transforming NP-complete problems into those that can be completed in a short span of time.
This is an area of great specialization, and given the huge value to industries such as capital markets, and the defense industry there are surprisingly few companies that specialize in data compression and encoding, where among the few there are a couple of boutique companies in the USA and one in Europe.
3.1.2.4.7.6 Big Data—Summary
Big Data is still in its infancy.
New products and new versions of existing products are being introduced every month and will continue until the combination of the database acceleration techniques is exploited to their logical conclusion and combined together, including:
- parallel and distributed processing,
- reduced code sets using “process normalization,”
- the right DBMS features,
- advanced data compression and encoding,
- new hardware architectures including servers, CPUs, networks, I/O substructures, and
- highly compact and innovative software infrastructures (e.g., operating systems, security software packages, job schedulers, configuration management software, etc.).
3.1.2.4.7.7 Big Data—The Future
The future for Big Data will likely be one that merges with advanced compression technologies, such as LNB (aka hyper-numbers, hyper-compression) to optimize computing platforms.
Possibly, the future Big Data product will be a type of parallel LNB database built on a normalized LNB set of instructions with LNB hardware customization built into LNB parallel processing smart phones and tablets simultaneously switching between multiple LNB carriers, cellular towers, and storage in the cloud.
The final Big Data product will be rearchitected from the ground up capable of supporting all use case types, driven by the principles and concepts of LNB information theory, which is yet another book for a niche audience. Hopefully, this information architecture-based science will be taught among universities as a routine part of building the foundation of our future workforce.
However, the future of Big Data is also likely to be paired with a big calculation capability that leverages quantum computing.
3.1.2.4.8 Quantum Computing—A Lot Deeper
3.1.2.4.8.1 Quantum Computing—The Present
As we mentioned earlier, there are certain types of problems that get classified as being NP-complete for their lengthy span of computation time, often because the number of possible results is extremely large, such as 2 to the power of n, where only one or few results are the optimal result.
Sample use cases for types of problems requiring a lengthy span of computation time using conventional computers that can be approached more effectively on a quantum computing platform include:
- cryptography (aka code breaking)
- prime number generation
- TSP patterns
- labeling images and objects within images
- NLP capabilities including extracting meaning from written or verbal language
- identifying correlations in genetic code
- testing a scientific hypothesis
- machine learning for problem solving (aka self-programming)
A quantum computing platform is fundamentally a different type of information system in that it is probabilistic. This means that answer it returns has a probability of being correct or incorrect. The accuracy of the answer can sometimes be confirmed using a conventional computer and the accuracy may also be confirmed by issuing the same question multiple times to determine if the same result set occurs. In quantum computing, the more frequently the same result set is returned, the higher the confidence level of the result.
3.1.2.4.8.2 Quantum Computing—System Architecture
At present, there are two competing system architectures for quantum computing; there is the gate model (aka quantum circuit) and adiabatic quantum computing (AQC). Although they are different architectures, they have been shown mathematically shown to beequivalent in that both architectures will operate correctly. From a practical perspective, the only difference that results is efficiency. As such, an AQC can be used to perform the same function that a gate model can perform efficiently, although it may take the AQC a longer span of time to generate the results than one would achieve using the best conventional computer.
The gate model is a design that is optimal for code breaking, particularly an algorithm known as Shor’s algorithm. The existing gate model implementations have few qubits and gates demonstrated, and the growth rate of qubit and gate implementations from year to year is linear. It has a complete error correction theory, which it apparently needs as it is more susceptible to decoherence. In quantum mechanics, decoherence means a loss of ordering of phase angles of electrons which determine its state and ultimately the internal value of its associated qubits giving the appearance of a wave function collapse, which for all practical purposes is simply information loss.
In contrast, AQC is optimal for discrete combinatorial optimization problems also known as NP-complete, as well as the problems that are more difficult to check which are referred to as NP-hard problems. Let’s take a moment to discuss a basic area of nomenclature from mathematics.
First we should define a few terms. These terms may seem complicated but don’t pass out as they are truly simple.
Any algorithm or formula has two basic properties: One is the effort or length of time it takes to solve a given problem to determine an answer using a formula, and the other is the effort or length of time it takes to check or verify the accuracy of an answer.
In this context, a problem that one can solve within a reasonable duration of time is labeled with the letter “P” to represent the term “polynomial time.” Problems labeled as “P” are considered as being easy problems.
In contrast, a problem that one cannot solve within a reasonable duration of time is labeled with the letters “NP” to represent the term “nondeterministic polynomial time.” These problems are so complicated to solve that it can take billions or trillions of years for a computer to solve them.
However, once an answer has been determined, if one is able to check the answer within a reasonable duration of time, then it is labeled “NP-complete.” However, if an “NP” problem is difficult to check in a reasonable duration of time, then it is labeled “NP-hard.”
For example, imagine we have quickly identified “Luisi Prime Numbers” up to primes that are 900 digits in length. To test each prime number with a check that attempts to divide the prime number by a series of integers can take quite some time.
AQC opens problem solving to a wide variety of use cases involving real world problems. The existing AQC implementations involve up to a 128 qubit (D-Wave One) called a “Rainier 4” and 512 qubit version (D-Wave Two) called a “Vesuvius 3,” the first commercially available quantum computer systems. AQC has low susceptibility to decoherence, and although it does not yet have a complete theory of quantum error correction, it has not needed one to this point.
With respect to quantum computing, Rose’s law is the quantum computing equivalent regarding the number of qubits per processor doubling every year to Moore’s law for conventional computers regarding the number of transistors on integrated circuits doubling every 2 years.
3.1.2.4.8.3 Quantum Computing—Hardware Architecture
Approaching the hardware architecture in a top-down manner, we begin with a shielded room that is designed to screen out RF electromagnetic noise. Other than shielded power lines, the only path for a signal to enter and exit the room are digital optical channels to transport programming and information in and computational results out.
The present commercially available quantum computer system is a black cube measuring approximately 10′ × 10′ × 10′ sitting in the shielded room.
The majority of the 1000 cubic feet are part of the high-tech cooling apparatus (e.g., dry dilution refrigerator) that uses a closed liquid Helium system to achieve temperatures that are approximately 100 times colder than interstellar space. Although it can take hours to initially achieve the necessary operating temperature, once cooled the temperature is maintained within its operating range for months or years. The same helium is condensed again using a pulse-tube technology, thereby making helium replenishment unnecessary.
The deployment model is considered to be a cloud computing model because the system can be programmed remotely from any location via an internet type connection. Each quantum computer system has its own conventional computer outside the shielded room to provide job scheduling capabilities for multiple other systems and users.
When programming and data enter the room on the fiber optic channel, it is transitioned into low-frequency analog currents under 30 MHz and then transitioned again to superconducting lines at supercooled temperatures with low-frequency filters for removing noise. The I/O subsystem inside the quantum processor is constructed of superconducting materials, such as the metals tin (Sn), titanium (Ti), and niobium (Nb) (aka columbium (Cb)) when operating between 80 and 20mK, where 20 mK is the ideal for performance that can be achieved in a cost-effective manner. 20 mK is 20,000 of one Kelvin degree. This is colder than the temperature of interstellar space (aka temperature of the cosmic background radiation in interstellar space) which is approximately 2.75 K (i.e., 2750 or 2730 mK warmer than a quantum processor).
The quantum processor is additionally shielded with multiple concentric cylindrical shields that manage the magnetic field to less than 1 nanoTesla (nT) for the entire three-dimensional volume of the quantum processor array of qubits.
The qubit (aka Superconducting QUantum Interference Device (SQUID)) is the smallest unit of information (a bit) in a quantum transistor that contains two magnetic spin states having a total of four possible wave function values (i.e., “−1−1,” “−1+1,” “+1−1,” “+1+1”), double that of a conventional computer bit (i.e., “0,” “1”).
Qubits are physically connected together using two couplers that envelop the qubit on four sides and are also manufactured of superconducting materials. According to the quantum computing manufacturer, qubits are analogous to neurons and couplers are analogous to synapses, where programming tutorials show how to use the brain-like architecture that help solve problems in machine learning. The other significant part of the circuitry that surrounds each qubit is numerous switches (aka Josephson junctions) with over 180 Josephson junctions per qubit in each three-dimensional quantum chip.
3.1.2.4.8.4 Quantum Computing—Software Architecture
The emergence of quantum computing hardware introduces the need for quantum computing software that effectively leverages this new advancement in quantum computing hardware technology. As one would expect, programming any computer at the machine language level, never mind a quantum computer, is difficult and quite limiting. Although the quantum computing software framework is still evolving, at present it is represented in the following diagram.
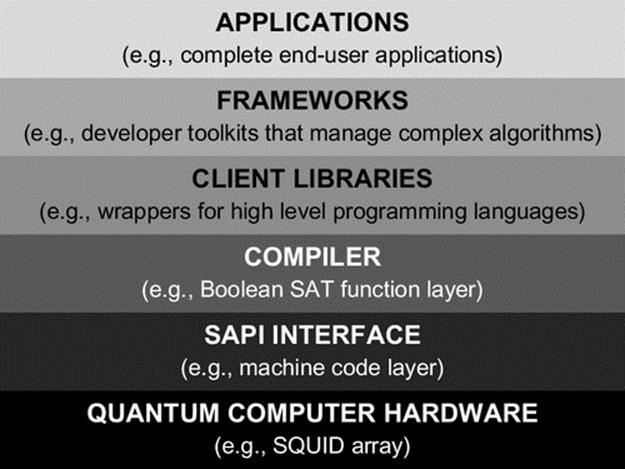
DIAGRAM Quantum computing software framework.
3.1.2.4.8.5 Quantum Computing Hardware Layer
Discussing this framework bottom-up, we begin with the quantum computer hardware layer. This layer contains an array of qubits ready to receive initialization from a machine language program. This process represents the setting of each qubit to one of its four possible values. The next step is introduction of the function. The function is essentially a mathematical formula that represents the energy state of the system for which you have programmed a Boolean SAT (aka Boolean satisfiability).
SAT was the first documented example of an NP-complete problem where there are no known algorithms that can solve the particular problem in a reasonable span of time using conventional computers.
In this step, a Boolean expression is constructed using variables and basic operators, such as AND, OR, and NOT, to represent the desired optimization function.
The next step is the annealing process. This is a slow step, where the slower the better as slower tends to yield the optimum result as opposed to near optimal result. Once you have let the appropriate amount of time elapse, which can vary depending upon the number of variables and the Boolean SAT formula, you will want to acquire the result. In this step, you inspect the values of the qubits as that represents the result set.
You may wonder whether you have given it enough time, whether the answer is correct, and how you might be able to test the result.
Results are typically tested using the conventional computer, and confidence in the result being optimal is achieved by running the same question again to see how often you get the same result set. While quantum computing is not necessarily fast in the same terms that we think about conventional computing in, depending on the characteristics of the problem, they can save you more than billions or trillions of years.
3.1.2.4.8.6 SAPI Interface
The system application program interface (API) is the machine code layer of the quantum computer that communicates directly to the quantum computer hardware. Learning QC machine language is extremely difficult even for the scientists who have an intimate understanding of the underlying quantum physics.
Programming at this level is required when new functions, fundamental physics, or QC computer science experiments are being explored or implemented.
3.1.2.4.8.7 Compiler
The compiler layer facilitates the implementation of Boolean SAT formulas without requiring any knowledge of machine code, QC physics, or QC hardware. As such, this layer allows the user to focus solely on the problem they are solving in terms of bit strings and mathematics. It is not a compiler in the way the term is used in conventional computing.
3.1.2.4.8.8 Client Libraries
For most developers, this is the most natural layer to start with. This layer allows the use of the same standard high-level programming languages that are found in conventional computers. This layer can be used to more easily implement the Boolean SAT formulas and work with the bit strings.
3.1.2.4.8.9 Frameworks
Complex functions that have been previously developed can be reused by wrapping the client library code into functions that comprise a toolkit for developers that have been bundled into easy to use libraries, such as supervised binary classification, supervised multiple label assignment, and unsupervised feature learning.
3.1.2.4.8.10 Applications
This is the layer where an end user would interact using a graphical user interface (GUI) with the applications that have already been developed for their use.
3.1.2.4.8.11 Quantum Computing Summary
Useful tutorials and books are already emerging for quantum computing programming. From an enterprise architecture perspective, quantum computing has many applications for various types of enterprises and in certain industries should be considered as an additional participant within the computing ecosystem if it is not already a part of your enterprise.
3.1.2.5 Mashup Architecture
Big data comes from a large variety sources across the Internet (e.g., Twitter feeds, RSS feeds), Intranet, a variety of external data providers, and a variety of internal data providers persisted in various types of transactional database, data warehouses, and traditional and Hadoop big data repositories. The counterpart to big data sources and repositories is the capability to visualize this data across any of these sources and persistence platforms, and hence the term “mashup” is born.
The term “mashup” refers to an interactive Web environment where data from various sources may be selected and combined by a business end user using drag-and-drop capabilities into the presentation style of their choice. It is the newest breakthrough in enterprise reporting offering several compelling advantages.
3.1.2.5.1 Data Virtualization Layer
The first capability that makes “mashup” technology distinct from “portal” technology is that it has a data virtualization layer on its front end that allows it to source data simultaneously from data sources from around the enterprise from within the firewall, from files and feeds that are externally located outside the firewall, such as from the servers of business partners, and from anywhere on the Internet, and then combine any combination of those feeds into a visualization.
3.1.2.5.2 Cross Data Landscape Metrics
The second capability that makes “mashup” technology a long-term direction is its ability to report on reports from across the IT landscape.
Few realize the fact that there are often tens of thousands or even hundreds of thousands of reports across a large enterprise. If we look at the number of reports that exist within a large enterprise and compare that number to the number of reports that are currently in use, or even just compare it to the number of users across the entire enterprise, we see an interesting relationship we call the “iceberg phenomenon.”
The iceberg phenomenon occurs as the number of reports that are in use stay relatively proportional to the overall number of users across the enterprise, while the number of reports that fall out of use continues to grow, thereby forming the underwater portion of the iceberg.
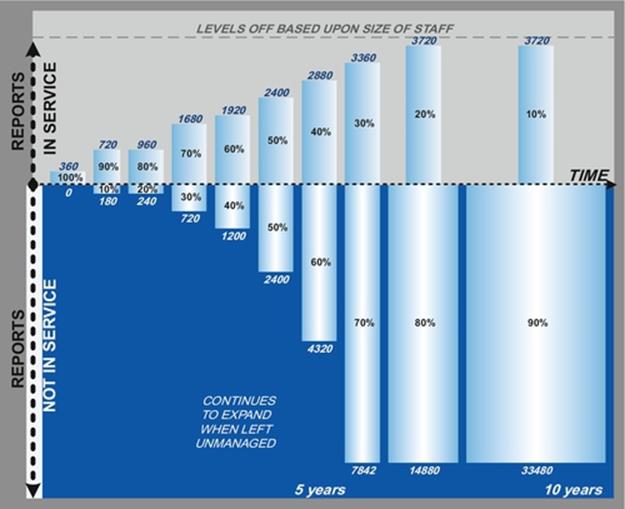
DIAGRAM Iceberg phenomenon results from report duplication, falling out of use due to user attrition, changes in needs, lack of report traceability, and lack of report true ups.
A good “mashup” technology will eliminate the pressure on business users to develop countless desktop database application reports and spreadsheet reports that can violate business compliance guidelines involving the presence of production data outside the production environment. When this occurs, the number of reports can rapidly grow beyond tens of thousands, each using disparate data sources, some originating their own production data not in production, with all lacking testing procedures, source code control and data security, as desktop reporting tool files can be attached to an e-mail.
The alternative for business users prior to the emergence of mashup technology was a time-consuming process of working with business analysts to design a report, determine the data points needed, locate these data points from across the data landscape, scrub the data to make it usable for reporting, integrate the same data originating from more than one source, and format the final output with the appropriate totals and statistics.
The capabilities of mashup start with self-service reporting for nontechnical users, end user-defined dynamic data mashups, dashboards, scorecards, what-if and ad hoc reporting, drill-down reporting with personalized views based on role, group, and other selections, with the option for scheduled execution, and the generation of report files exported into controlled document repositories.
3.1.2.5.3 Data Security
The third capability that makes “mashup” technology distinct from “portal” technology is that it has a variety of data security capabilities built into it. This begins with having an LDAP lookup capability built into it, with the ability either to pass the permissions to the data sources or, our favorite, to apply the data permissions dynamically for any ad hoc query where the permissions are controlled by business owners with oversight from legal and regulatory compliance.
3.1.2.5.4 Wealth of Visualization Styles
The fourth capability that makes “mashup” technology distinct from “portal” technology is that “mashup” provides a full complement of presentation styles, such as charts, graphs, maps, and reports immediately available out of the box without requiring time consuming and costly IT development support.
Most reporting products focus on the interests of the individuals creating and consuming the reports. While this is an important part of the task, the key differentiator to “mashup” technology is that it addresses the interests of many additional stakeholders besides those creating and consuming reports, such as:
- information and data security architecture—to manage ad hoc access to data
- information architecture—to understand which data is being used and not used
- business compliance—to understand who uses what production data and to ensure that it is sourced from a production environment
- legal—to understand which individuals may be involved in legal holds (LHs)
- executive management—to readily understand what data is available to them for decision making
3.1.2.5.5 End User Self-service at a Low Cost
The fifth aspect of mashup technology distinct from other reporting and BI tools is its low cost structure and high self-service as its core characteristic. Mashups generally support a large number of users after a rapid implementation using just a Web browser for end users and developers. It should have a low learning curve with simplicity for end users and advanced capabilities for data scientists.
So now that we know what is meant by the term “mashup,” mashup architecture offers us a glimpse into how architectural disciplines themselves can meet the needs of other architectural disciplines and fit into their architectural frameworks.
As an example, mashup architecture is also one of the key components of a forward-thinking data governance framework that empowers business users to become self-reliant to support a majority of their informational needs.
The components of the data governance framework are further explained in the sections that address the 10 capabilities of data governance. Likewise, the components of data virtualization are further explained in the section 4.1.9.1, which also resides within the disciplines of information architecture.
3.1.2.6 Compliance Architecture
Internal and external big data sources of data, persistence layers, and mashup technologies to visualize and report on that data can lead the legal and compliance departments to wish for a simpler way of life.
Depending upon whether an organization is public or private, the jurisdictions in which an enterprise operates and where it is domiciled it may be subject to economic treaty zone, national (aka federal), state (aka province), and local legislation, regulatory oversight, financial oversight, and financial reporting requirements.
In response, these requirement organizations have had to establish a variety of corporate officers and departments to focus on some area of responsibility. Within the business departments, this is largely performed by departments responsible for legal, business compliance, financial reporting, and the various communications departments, such as regulatory communications with the Office of the Comptroller of the Currency (OCC) if the enterprise has been incorporated under the banking charter in the USA. These areas then engage with the sources of regulation, understand the requirements, and then take action within and across the enterprise to ensure that compliance is attained so that:
- the brand and reputation of the organization are protected,
- financial penalties are not incurred by the enterprise,
- business operations are not restricted or ceased, and
- officers of the company do not become subject to criminal penalties.
Regardless of which area of compliance is involved, the challenge comes down to being able to influence the activities of many individuals across the many departments among the various lines of business of the enterprise. Moreover, these individuals must understand how to incorporate this influence into their daily and cyclical activities.
While the level of maturity for monitoring activities across business departments is often high, the ability of these stakeholders to monitor and influence the many activities of IT is less mature, even when an IT compliance function has been put in place.
While most architects have awareness of many of these requirements, most IT developers across various application development teams are focused on technology and not the regulations, never mind the flow of modifications that stream from each source within each jurisdiction of the enterprise.
Some of the standards and frameworks include:
- ISO 17799
- ISO 27000
- Committee of Sponsoring Organizations of the Treadway Commission (COSO)
Compliance architecture is a discipline that collaborates with the other various architectural disciplines, such as information architecture and application architecture, to address the various requirements from the various stakeholders across the various jurisdictions. This is usually implemented by including guidance within the standards and frameworks of the pertinent architectural disciplines.
To help give some context as to the scope, let’s begin with sources of compliance restrictions to address topics ranging from anti-terrorism to nondiscrimination.
These include, but are certainly not limited to:
- Office of Foreign Assets Control (OFAC) within the Treasury department,
- United and Strengthening America by Providing Appropriate Tools Required to Intercept and Obstruct Terrorism—specifically Section 314(a) USA PATRIOT Act,
- Office of Federal Contract Compliance Programs (OFCCP),
- Equal Employment Opportunity Act (EEOA),
- Financial Stability Board (FSB),
- Global Financial Markets Association (GFMA),
- Bank Secrecy Act (BSA),
- Regulation E of the Electronic Fund Transfer Act (EFTA),
- Dodd-Frank,
- Securities and Exchange Commission (SEC),
- Federal Trade Commission (FTC),
- OCC,
- Commodity Futures Trading Commission (CFTC),
- International Swaps and Derivatives Association (ISDA),
- Sarbanes Oxley (SOX),
- Basel II, and
- Solvency II.
To help give some context as to what specifically can be involved, let’s begin with lists of customer and vendor restrictions to address economic sanctions, embargos, terrorists, and drug traffickers.
These include, but are certainly not limited to:
- Blocked Persons List,
- Targeted Countries List,
- Denied Persons List,
- Denied Entities List,
- FBI’s Most Wanted,
- Debarred Parties List,
- Global Watch List, and
- Politically Exposed Persons (PEP).
Anti-money laundering/know your client (AML/KYC), which is a part of client activity monitoring, pertains to regulations that require organizations make a reasonable attempt to be aware of who their customers are and any customer transactions that may be attempting to hide the sources of illegally acquired funds, requiring a suspicious activity report (SAR) to be filed for transactions of $10,000 and over.
The Customer Identification Program (CIP), introduced by Dodd-Frank, is a requirement to know who the counterparties are on a swap contract. The DTCC, which is a holding company established in 1999 to combine the Depository Trust Corporation (DTC) and the National Securities Clearing Corporation (NSCC), along with SWIFT, which is the Society for the Worldwide Interbank Financial Telecommunication, is implementing Legal Entity Identifier (LEI) and its immediate predecessor the CFTC Interim Compliant Identifier (CICI), which are intended to uniquely identify counterparty entities.
The requirement for LEI began in Dodd-Frank and assumed that the SEC would regulate the security-based swaps, and the CFTC would regulate all other types of swaps, such as:
- interest rate swaps,
- commodities swaps,
- currency swaps, and
- credit default swaps.
Compliance architecture also includes RIM. These are categories of data, almost data subject area like, some pertaining to particular lines of business and some pertaining to common topics such as HR. In RIM, each category is associated with a description and a corresponding retention period that it must be held for prior to its proper disposal. It is the responsibility of the enterprise to safeguard and retain a reporting capability on RIM data for the corresponding retention period to be able to support inquiries from either the government or regulators. Depending upon the category of data, the number of years can vary usually somewhere between 2 and 12 years.
Another topic within the scope of compliance architecture is LHs. LHs involve the protection of all paper and electronic records pertaining to litigation that has been filed, as well as any litigation involving matters that have a reasonable expectation of being filed. The financial penalties for improper management of such data can range into the hundreds of millions of dollars.
There are numerous other topics that must be addressed by compliance architecture, enough for several books. Additional topics include the large area, such as LHs, Governance Risk and Compliance (GRC) architecture, and XBRL financial reporting to the SEC, which includes Forms 10-Q, 10-K, 20-F, 8-K, and 6-K to be transmitted to the SEC.
This is why compliance architecture is a distinct architectural discipline, potentially requiring further specialization into legal compliance architecture, HR compliance architecture, and financial compliance architecture.
As an example for the qualifications of a compliance architect, on our team in a top-10 bank, the individual held a Juris Doctorate (JD) from Georgetown University.
3.1.2.7 Application Portfolio Architecture
Application portfolio architecture (aka applications architecture with a plural) is a discipline that was commonly created early on as a part of an enterprise architecture practice. Sometimes, application portfolio architecture is combined with the discipline of TPM. Perhaps this occurred as a result of confusion over the distinction between an application and technology, or maybe it occurred due to the potentially strong bonds that technologies and applications can have with one another.
To briefly recap the distinction between a technology and an application, a technology does not contain business rules that support a business capability, whereas an application does. There are numerous software products that are technologies, such as rules engines, spreadsheets, and development tools (e.g., MS Access) that we classify simply as technologies. However, once business rules are placed within any given instance of such a technology, then that specific instance of a rules engine, spreadsheet, or MS Access file is an application, which should be maintained by an application development team.
So to clarify, once a spreadsheet contains complex formulas that are used to support a business capability, that instance of that spreadsheet should formally transition into becoming an application.
As an application it should be tested, its source code should be controlled in a production repository, it should be backed up for recovery purposes, and so on. However, if the spreadsheet is simply a document or report, in a manner similar to any word processing document like an MS Word file or Google Doc, which does not contain business rules, then those instances are simply “electronic documents” that should not be classified as an application. At most, depending upon what role they play, they should be classified as production reports.
Application portfolio architecture has a “macro” and a “micro” application portfolio management (APM) perspective, and both are important. The more common of the two is the “micro” perspective, which involves the maintenance of an application inventory with all of its relevant information. In the micro view, each application stands alone. In a more mature state, it links to the technology portfolio to illustrate which technologies a given application is dependent upon.
The less common perspective is the “macro” view of applications. In this view, applications are associated with the business capabilities they support in their current state, as well as a number of alternatives from which a future state can be chosen. In its more mature state, the current state of the application portfolio and alternatives by business capability has been assessed for their relative cost-benefit risk analysis over time.
As many in enterprises have observed, costs of applications tend to grow over time as the maintenance of software grows more complex, and licenses for older packages and their supporting technologies correspondingly increase in cost as the vendor’s customer base declines.
Unless an application can eventually be retired as part of its normal end of life, the choices are to maintain the increasing cost of maintenance, or replace the application or potentially consolidate the application with others that will provide a lower lifetime cost.
When managed properly, this architectural discipline provides any enterprise a way to accurately project automation costs for a given line of business to facilitate advanced planning of business direction and budgeting.
3.1.2.7.1 Workflow Architecture
Usually, a department with a large enterprise is a collection of related business capabilities that as an aggregate have an overall annual budget allocated to it and every large enterprise will have quite a number of departments. Operational workflows within each department represent the activities that conduct and support business for the organization.
Depending upon the department and the particular business capability, a workflow may be completely manual, completely automated, or comprised of a combination of manual activities and automation. Whether processes are manual or automated, competitive advantages stem from the design of better operational processes.
Workflow processes can be improved incrementally, even with the most subtle change. Although the business advantages to identifying, collecting, and illustrating information regarding operational processes are high, few companies pay any attention to it unless it represents a high-volume process that is core to their business.
It is no surprise then that the companies that collect and analyze data about their operational processes as a matter of normal operating procedure tend to grow most rapidly through acquisition by demonstrating a high degree of competence at integrating acquired businesses into their existing operational workflows. The reason they are so effective is that they already know a great deal about their existing workflows because of the metrics that they’ve collected. Without those metrics, and without an in-depth understanding of their workflows, management can only guess at what to do and how well it worked.
The discipline of workflow architecture is comprised of three major areas. The first is BPMN, which forms a foundation for the remaining areas.
3.1.2.7.1.1 Business Process Modeling Notation
BPMN is a standardized notation that graphically represents processes modeling the operational workflow and potentially encompassing the business rules that get performed within the operational workflow, regardless of whether those business rules are manual or automated, potentially generating workflow automation or BPM technology syntax for either simulation purposes or implementation. The role of BPMN therefore is to document workflows.
Using this notation, one may document workflows that represent the current operational processes, proposed operational processes, or transitional processes. They may pertain to manual processes, automated processes, or the integration of manual and automated processes.
Depending upon the workflow documented and the particular product used to document the workflow, if the resulting BPMN syntax meets the criteria of workflow automation, then it may be forward engineered into workflow automation or BPM technology. However, if the BPMN syntax meets the criteria of BPM technology, then it can only be forward engineered into BPM technology, whereas the differences pertain to scope, which we shall soon see.
3.1.2.7.1.2 Workflow Automation
The second major area of workflow architecture is workflow automation, which standardizes the operational steps of a business or IT department within software to mirror the steps of an operational workflow excluding business rules. Operational workflows include requests entering a department, the transfer of request activities, including signature cycles, through to the eventual completion of the request.
The first characteristic that defines workflow automation is that it is restricted only to aspects of the workflow. The best way to understand this is with an example.
Let’s select a particular department that is found in all major companies, regardless of industry, products and services, such as a data services department (e.g., enterprise data management). A data services department typically receives requests for a variety of services from application development teams. To name just a few, some of these services include requests for a new database to support a new application, a change to an existing database design, or an increase in size to accommodate a substantially larger number of data records than previously anticipated.
In its manual form, the person making the request of data services walks over to the person that handles this type of request for them. Occasionally, instead of walking over the requester sometimes phones, sends e-mail, or sends a paper document through interoffice mail.
Once received within data services, the person handling the request sends a message to the requestor regarding the amount of time it will take the various participants to do and when it can be fit into their respective work schedules.
The individual making the request then takes note of the time it will take and when it will be scheduled, and then either approves or enters into a discussion to have the request supported sooner.
When the work is actually performed, the tools that are used by data services include a CASE tool, where the department’s naming and database design standards will be applied, and a DBMS product, within which the physical database will be created or altered where the department’s physical design standards will be applied.
The data services contact then notifies the person the request originated with that their activities have been completed and that they can check it to determine if everything appears to be working properly.
In the example above, the business rules performed by data services were conducted in the CASE tool and DBMS product, where all of the other activity is operational workflow. What is interesting is that there are almost an infinite number of possible operational workflows, depending upon how the manager of the data services department wants to organize the staff members of the department and the sequence in which they perform their work. What don’t change, no matter which operational workflow is used, are the business rules that are performed by the department using the CASE tool and DBMS product.
As such, if the manager of the data services department were to document the operational workflow using BPMN, then the documented workflow could be automated using a WFA tool (e.g., Service-now.com) to result in something like the following.
In its automated form, the person making the request of data services enters their request into the data services workflow application. The request then shows up on the summary screen of data services outstanding requests.
Someone in data services assigns the request to them and returns an estimated number of hours and an estimated completion date that goes back to the requestors screen for their approval.
Once the approval is returned to data services, the work activities are performed in the appropriate software applications, tools, and products, and then the requestor is notified upon completion. The requester validates the work and closes the request as complete.
In this scenario, the WFA tool kept metrics of all requests coming into the department, from whom, with a record of who in data services satisfied the request, tracking the duration and completion dates and tracking whether the estimates were accurate.
The department manager can see what his department was doing, what work was in the pipeline, what his department had accomplished, how many times his department got it right, and how many requests required rework. Perhaps most importantly, the manager sees what percentage of his resources are being consumed by other departments and could compare the funding he received from those departments.
3.1.2.7.1.3 BPM Technology
The third major area of workflow architecture is BPM technology, which is a technology involving multiple architectural disciplines that constitute a robust application development environment. BPM technology automates both workflow automation and its associated business rules often as a way to integrate applications that reside across disparate technological environments, thereby coupling workflow automation to the applications involved.
There are a number of issues that arise with BPM technologies that do not occur with workflow automation, starting with recoverability of BPM technology applications as it often requires synchronization across multiple application databases and BPM technology databases, files, and queues.
The first reason why workflow architecture must govern BPMN, workflow automation, and BPM technology is that use of the wrong technology can significantly raise the complexity and infrastructural costs of automation. The second reason is that the guiding principles of these three areas are completely different from one another.
Examples of guiding principles for BPMN include: processes are assets of the business requiring management as such, process models provide business value even when they remain manual, and distinctions exist between operational workflow and their associated business rules.
Examples of guiding principles for workflow automation include: workflows are defined and repeatable, operational metrics are collected in an unintrusive manner, operational workflows and their efficiency are rendered transparent with automation, and BI on operational metrics provide operational radar.
Examples of guiding principles for BPM technology include: BPM technologies provide competitive advantages when the circumstances are appropriate, and they must balance the needs of business architecture, APM, TPM, application architecture, database architecture, and DR⁎ architecture.
Workflow architecture is frequently faced with the use of several BPM technologies and sometimes multiple WFA tools, although frequently without its associated foundation of BPMN documentation.
3.1.2.7.2 Application Architecture
In any discussion of application architecture (i.e., application architecture in its singular form), it is important to remind ourselves to maintain the important distinction between applications and technologies mentioned in the TPM and application portfolio architecture sections; technologies do not contain business rules, whereas applications do.
As such, application architecture (i.e. application architecture with a singular application) refers to the manner in which an application is put together.
This includes:
- the degree to which an application employs modules to package it capabilities
- how business requirements are packaged into the modules of the application
- how technical requirements are packaged into modules of the application
- how error handling is integrated into the application’s framework
- whether and how performance monitoring may be integrated into the application
The way requirements are packaged and packages organized depends largely on the type of application, influencing the potential number of software layers and objects, functional grouping, and tiers, such as a graphics tier, application tier, data virtualization, and database tier.
For information systems, there are a number of common application types, such as portals, Web applications, online transaction processing applications, batch applications, workflow automation applications, BPM technology applications, simulations, games, and autonomic computing applications, some overlapping and most making use of databases. Among these types of applications, a variety of application architectures and types of programming languages exist.
One way to classify types of programming languages is to group them into one of the five “generations of programming languages,” such as:
- machine language (i.e., first-generation language),
- assembly languages (i.e., second-generation language),
- Cobol, Fortran, PL/I (i.e., third-generation language),
- MS Access, PowerBuilder (i.e., fourth-generation language), and
- mashup technologies (e.g., drag-and-drop self-service).
A richer although rather overlapping taxonomy for the types of programming languages consists of approximately 50 programming language types, such as array (aka vector), assembly languages, command line interfaces, compiled languages, interpreted languages, DMLs, object-oriented languages, scripting languages, procedural languages, and rules engines. These types of programming languages then have numerous subtypes and architectures of their own.
For example, rules engine types include data governance rules engines, data manipulation rules engines, business applications, reactive rules engines, BPM rules engines, CEP rules engines, game rules engines, and business rule management system and reasoning rules engines.
Rather than getting overly directed toward the large number of details of these different information systems application types and their application architectures, we will discuss why they need architecture and the resulting frameworks that each should have.
3.1.2.7.2.1 Requirements Traceability
Depending upon the needs of the company, the first priority for application architecture is software maintainability, particularly since the investment that a company makes in software development is so high. That said, requirements traceability is perhaps one of the largest contributors to improved software maintainability, but oddly it is among the least likely to occur in software architectures among large companies that do not see themselves as having a core competency of software development and technology.
In fact, business requirements are rarely treated as the valuable asset they truly are. Too frequently, business requirements are poorly documented, and consequently, poorly labeled and organized within the applications that implement them. Without traceability back to requirements, it becomes obvious why the many resulting automation lines of code are overly labor intensive to adjust as requirements change and new requirements are added.
To understand this in terms of real cost through staffing levels, approximately 10,000 lines of code represent the upper limit that a typical developer can maintain, which are based upon estimates from the U.S. Government. To maintain an application developed by someone else, the developer must first understand how the original developer approached the packaging of requirements and their organization. This translates into the fact that every one million lines of code must be maintained by a staff of a hundred developers.
Depending upon the technologies involved and the annual cost of a developer, the cost per developer can be anywhere between 80,000 and 180,000 per year. Given the fact that a typically large enterprise can have many millions of lines of code, this translates to hundreds of developers whose cost must be added to the price of the products and services offered by the enterprise.
Error handling—Regarding one aspect of application architecture, it is often said that error handling represents nearly half of all application code. A standard approach to error handling can be established for each type of application architecture commonly used within the enterprise. Some application types include batch, OLTP, and Web based. When application architecture establishes standards and reusable frameworks for basic capabilities, such as error handling and application security, it acts as an accelerator to both development and maintenance.
Software reuse—This brings us to the most challenging aspect of application architecture, software reuse. Government agencies and universities have attempted several times to create repositories of software specifically for reuse.
In fact, many companies, universities, and government agencies have studied at great depth the topic of software reuse in information systems. When viewed from the perspective of control systems or electronics, the notion of software reuse seems relatively simple. However, unlike control systems that associate software capabilities to the tangible world, information systems are often far too nonstandard in its architecture. The most significant difference, however, is that control systems associated with particular types of mechanical devices, such as anemometers and other sensors, encounter nearly identical structured and unstructured data.
To begin, software components must be architected first to be reusable. In fact, any naming convention for software modules that do not share the same rigorous LDA cannot overcome the reality that the software parts are by definition incompatible. One of the things we will learn from the discipline of data architecture is that the only glue that can hold software modules together is the data. That said, then how can application architecture address the challenge of software reuse?
Of the infinite number of ways that applications may be architected, there are three methods that can achieve true software reuse. To discuss these, let’s assume for a moment that we have dozens of application systems that support the same business capabilities.
Let’s also assume that we accumulated, through several acquisitions of smaller companies, an inventory of purchased and homegrown applications dependent upon a variety of older technologies.
Each of these information system applications is likely to have database designs that do not resemble one another. In addition, aside from some differences within the business requirements themselves, probably every characteristic that makes up an application’s architecture is probably vastly different, such as:
- the degree to which an application employs modules to package it capabilities
- how business requirements are packaged into the modules of the application
- how technical requirements are packaged into modules of the application
- how error handling is integrated into the application’s framework
- whether and how performance monitoring may be integrated into the application
To attain reuse in information system applications, architects and developers must employ a level of standardization that they are not used to. Part of the challenge is mindset, as even today, most people consider software development an art form as opposed to an engineering discipline. However, to achieve reuse in an information system, a variety of frameworks are required.
The first and most important framework is the LDA, which we will discuss in detail separately. The critical thing to know about an LDA is that it encompasses every category of data that any application must deal with. As a framework, it fully addresses the data perspective of operational workflows, transactions, business data, and data analytics.
The second most important aspect are the frameworks of the application architecture itself. This means that the application design patterns chosen must be standardized into frameworks as well. Although a somewhat technical subject to discuss in a book intended to include a business user audience, we will touch upon application design patterns in the next section.
The third most important consideration is the interfaces that support various services across a variety of other architectural disciplines.
The fourth most important aspect is the frameworks of the system infrastructure, including the operating system environments and possible programming languages.
Hence, software reuse within the information systems paradigm only becomes attainable once each of these four areas has been addressed as rigorous engineering disciplines.
3.1.2.7.3 Application Architecture Design Patterns
Each major application type (e.g., batch, OLTP, and Web based) may employ almost any combination of architectural design patterns, most of which have names. Among the most common and/or useful design patterns to be aware of are:
- integration pattern—identifies whether the application is a silo application, is fully integrated into a unified framework of applications and shared databases, or stand alone but sharing common subsystems (aka subsystem interface pattern)
- distribution pattern—identifies whether the application is nondistributed, distributed, peer-to-peer (P2P) distributed (e.g., pure, hybrid, or centralized peer to peer), grid, and/or running in the cloud inside or outside the firewall
- tier pattern—identifies whether the application is single tier, two tier, three tier, or four tier, where these may be any combination of presentation layer, application layer, data virtualization layer, and data layer
- procedural pattern—identifies whether the application is unstructured, structured, object-oriented (OO), service-oriented architecture (SOA), 4-GL, rule-based (expert system), statistical model, or nonstatistical model (neural network)
Object-oriented procedural patterns employ what is called the “Law of Demeter” or “Principle of Least Knowledge,” which is a layered architecture that does not permit a program to reach further than an adjacent layer of the architecture, and hence it is said that each program can only talk to its friends.
- processing pattern—identifies whether the application is single-threaded or belonging to one or more of several parallel processing styles (e.g., tightly coupled parallel processing (e.g., SMP), loosely coupled parallel processing (e.g., MPP, grid computing)
- usage pattern—identifies whether the application is consumer to consumer (C2C), consumer to business (C2B), business to business (B2B), business to employee (B2E), business to government (B2G), government to citizen (G2C), government to business (G2B), government to government (G2G), or local usage
- analytical pattern—identifies whether the application is statistical, neural network, or simply multidimensional; however, neural networks as an example have at least two dozen design patterns associated with them, each tending to be useful for different types of problems, types, and distributions of data
- interactive pattern—(aka synchronous versus asynchronous) identifies whether the application is conversational, which waits for a response, or pseudo-conversational, which does not wait, but instead starts a new instance of a task to handle the response if and when it arrives
- data communication pattern—identifies whether the application transmits data using a push approach, such as an ESB that transmits data as it occurs; a pull approach, such as with extract, transform, and load (ETL) that transmits data in a batch on demand or scheduled; or a hybrid approach, such as using ETL within an ESB
- message dissemination pattern—identifies whether the application sends information directly to a predetermined recipient or subscribing recipients, or indirectly through publishing or broadcasting
- resource sequence pattern—identifies whether the application’s processing sequence intentionally orders the locking of shared resources in a particular sequence as a means to proactively prevent the possibility of a deadly embrace across logical units of work
- pipeline pattern (aka pipe and filter)1—identifies whether the applications, whether multiprocessor pipeline or single processor “pseudo” pipeline, are patterns architected as a series of queues that enter their respective routines
The queues that messages travel on are referred to as pipes, and the processes that reside at the end of each pipe are referred to as filters. Each filter process messages sequentially in a first-in-first-out fashion, although parallelism can be achieved by instantiating more than one filter for a given inbound pipe.
These patterns are typical in operating systems, such as MVS, UNIX, VM/CMS, and Windows, as well as “mini-operating systems” such as OLTP environments, such as CICS and IDMS/Central Version, but are a pattern that is used among other types of applications.
For additional messaging patterns and subpatterns, refer to Enterprise Integration Patterns: Designing, Building, and Deploying Messaging Solutions by Gregor Hohpe and Bobby Woolf.2 Although nearly 700 pages, it is well written, organized, and comprehensive for this architectural niche.
- event-driven pattern—identifies whether the application triggers processes implicitly or explicitly when events come into existence
Explicit invocations occur when a process invokes a subsequent process directly, whereas implicit invocations occur when a process stores data in a shared location or transmits a message for other processes to detect on their own
- MV patterns—are a family of applications consisting of MVC (model-view-controller), MVP (model-view-presenter), MVVM (model-view-view-model), HMVC (hierarchical-model-view-controller), and PAC (presentation-abstraction-control) that organize responsibility for different user interface elements within an application, such as in a shopping cart application, to facilitate independent development, testing, and maintenance of each component
- blackboard patterns—are applications where a deterministic strategy is not known for approaching a problem; thus, the framework is to invoke a diverse set of processes to render partial solutions to a problem into a shared buffer, which is then monitored by one or more other processes that attempt to recognize a solution to the overall problem from the information continually evolving within the buffer
One of the most advantageous approaches to application architecture is to blend different architectural patterns, such as SOA for the front end and OO on the back end to achieve an application with an optimum set of characteristics.
3.1.2.7.4 Integration Architecture
As the number of application systems, environments, and technologies grew that had to communicate with one another, so emerged the discipline of integration architecture.
The discipline of integration architecture essentially involves the touch points that exist between different components, whether they are software to software, hardware to hardware, or software to hardware. Integration architecture (aka middleware) isresponsible for standards and frameworks pertaining to communications and interfaces between application systems, operating system environments, and technologies.
The original and most simple approach to integrating applications is called a point-to-point architecture, where application systems directly communicate to other application systems as necessary. As the number of application systems increase, so does the complexity of having many interconnections.
The first integration architecture to significantly reduce the number of connections was the hub and spoke architecture where each application system had a connection to a shared hub, which acts as a traffic cop to direct communications between application systems. Due to scalability issues, however, federated architectures and distributed architectures (aka peer to peer) were developed to better load balance.
Fast forward to today, and we have SOAs that have loosely bound applications attached to an ESB with application services exposed as Web services, rules engines, and extract transform and load (ETL) products riding inside the ESB and being scheduled by job schedulers outside the ESB.
The Web services aspect of SOA came when IBM and Microsoft agreed upon a communication standard. Shortly after the emergence of Web services, ESB became the agreed-upon standard for the industry, such as for messaging and BPM technologies mentioned in workflow architecture.
Integration architecture is organized into a number of domains.
They include:
- user integration, which connects a user to applications through networks,
- process integration, which connects workflow processes to other workflow processes,
- application integration (aka service integration), which connects applications to other applications, potentially across disparate technology environments,
- data integration, which performs data movement such as with ESB, ETL or FTP, and
- partner integration, which includes business to business (B2B) and business to customer (B2C) communications.
As such, integration architecture faces a variety of challenges in dealing with communications protocols, which often vary depending upon the type of platform.
3.1.2.7.5 NLP Architecture
Contrary to the expectation of many industry experts, NLP has emerged to demonstrate significant commercial value for a variety of use cases including:
- monitoring social media in real time,
- providing initial or alternative support for customer inquiries,
- accurately identifying structured data from previously unstructured contract files,
- performing language translations of Web-based text messages and company documents,
- scoring essays on exams more consistently and accurately than human experts, and
- providing a hands free voice command interface for smartphones.
NLP provides the ability to monitor countless tweets from Twitter, e-mail messages from customers, Facebook messages, and other electronic social media in real time so that automation can route issues to a human for immediate corrective action.
Significant quantities of structured data can be identified from tens of thousands of unstructured data, such as contracts, in seconds, as opposed to an expensive and time-consuming process to manually determine the answer to simple questions like, “What contracts over $50,000 will be expiring over the next 6 months in the Americas?”
In addition to identifying structured data, NLP can translate documents and text messages from and to any language in real time. When augmented with image recognition, NLP can digitize paper-based schematics, architectural diagrams, maps, and blueprints, into structured content, thereby making their contents machine searchable and usable.
NLP architecture is the discipline responsible for global standards and frameworks pertaining to the capabilities of NLP. At present, there are many commercially available NLP products, utilities, and services that may be incorporated into applications of various types.
As a result, depending upon the characteristics of the component, NLP architecture is a discipline that augments application architecture, application portfolio architecture, and TPM.
3.1.2.8 Life Cycle Architecture
As an architectural discipline, life cycle architecture acts as an accelerator to a variety of activities across the enterprise. It provides one of the most compelling arguments that demonstrate how enterprise architecture is not just about software development, never mind enterprise architecture being just about TPM and APM.
A life cycle is a series of stages or steps through which something passes from its origin to its conclusion. In IT, the first life cycle to emerge was the software development life cycle (SDLC), which oddly enough only addresses the creation or maintenance of an information system and excludes its shutdown.
The easiest way to begin understanding life cycle architecture is to first consider a life cycle that everyone knows, such as the SDLC. Examples of the 10 major life cycles are outlined in the coming sections to provide some ideas as to what to include as life cycles and what their content should be.
However, it is important to note that each enterprise would typically choose which life cycles and which steps are most appropriate to address the priorities of their organization, and that these are offered with the intent to stimulate a constructive conversation.
Once the steps and substeps of a life cycle have been agreed upon, then the various architectural disciplines that support that step and substep can be mapped to it for facilitate deployment of subject matter expertise to assist within the various life cycles of the enterprise.
The life cycles that we will address are the most common ones that are needed, which I have added to over the years which are:
- SDLC,
- data centric life cycle (DCLC),
- data governance life cycle (DGLC),
- architecture governance life cycle (AGLC),
- divestiture life cycle (DLC),
- merger and acquisition life cycle (MALC),
- data center consolidation life cycle (DCCLC),
- corporate restructuring life cycle (CRLC),
- outsourcing life cycle (OSLC),
- insourcing life cycle (ISLC), and
- operations life cycle (OLC).
3.1.2.8.1 Software Development Life Cycle
There are many versions of the SDLC. Perhaps the most exacting is the ISO standard ISO/IEC 12207, which is an international standard comprised of 43 processes, and more than 95 activities, and 325 tasks.
At its highest level, ISO/IEC 12207 consists of six core processes, which are:
- acquisition,
- supply,
- development,
- operation,
- maintenance, and
- destruction.
One reason we will not review this particular standard is that outside of the defense industry, it would appear that it is generally not in use. The main reason that we will not cover it is that it fails to address the basic activities that are required to support many of the most basic and mainstream business activities.
A basic and useful form of the SDLC can be summarized in nine stages. It consists of:
- inception—which includes the scope and business justification,
- identify scope
- identify business justification
- high-level analysis—which determines high-level business requirements, pertinent architectural frameworks, conceptual data model, and cost estimates,
- identify high-level business requirements
- identify applicable architecture standards and frameworks
- further develop the associated conceptual data model
- gather estimates from SDLC participants/service providers
- evaluate business justification for approval and justification
- detail analysis—which identifies detail business requirements, business data glossary terms in scope, and sources of data to support those business glossary terms,
- identify and organize business requirements
- define business data glossary entries that are in scope
- enhance data points in the conceptual data model
- business approves business requirements
- logical design—establishing a logical data model, operational workflow, user interface and report design, and application architecture,
- using the conceptual data mode develop the logical data models
- design user interfaces and reports
- develop application design and data flow including interfaces
- conduct logical design review
- physical design—developing the physical data model and data movement code, and specifications for the application, system software and hardware,
- develop physical data model and any ETL specifications
- develop application, GUI and report specifications
- develop software and hardware specifications
- develop manual operational workflow
- build—generating the necessary code, software installs, and infrastructure,
- develop code and implement DDL and ETL
- implement application
- install software and hardware
- validation—migrating and testing,
- migrate to integration environment and test
- migrate to QA environment and test
- deployment—conducting a production readiness test and production cutover, and
- conduct production readiness test
- conduct interdisciplinary go/no go evaluation
- post-implementation—which evaluates the production cutover and determines lessons learned
- conduct postmortem for lessons learned
3.1.2.8.2 Data Centric Life Cycle
The next issue that emerges then is what happens if you use the SDLC on something other than developing a software application. The answer is, even though the SDLC is well suited to supporting the development stages of an application system, in contrast it is poorly suited as the life cycle for other major categories of activities that require project teams. The first one we will discuss is the life cycle of data warehouses with their related artifacts, such as ODSs and data marts.
Unlike the development of application systems, which are driven by business requirements that become transformed into business rules that automate business processes, the development of data warehouses is data centric efforts that identify and collect information to support operational reporting, ad hoc reporting, and BI.
The stages to develop data warehouses are referred to as the DCLC. In contrast to the collection of business rules in the SDLC, the DCLC identifies categories of use cases and the categories of data that are necessary to support those use cases.
As such, the categories of use cases may pertain to different forms of risk reporting, general ledger activity, regulatory compliance, or marketing. In response to those categories of use cases, the categories of data and their associated data points are necessary to scope data requirements. The primary architectural artifacts needed to support this step are the LDA and its associated conceptual data models.
To briefly describe it now, the LDA is a business artifact that is an inventory of every business context of data across the enterprise, referred to as business data subject areas (BDSAs). Each BDSA has a corresponding conceptual data model, which is only instantiated for those business areas when the need presents itself.
The LDA is discussed further in the section 4.1.2. However, the point is that there is a least one other life cycle that is required to address the development of data centric systems, such as data warehouses and ODSs.
To summarize in a manner consistent with the SDLC previously outlined, the 11 stages of the DCLC include:
- data requirements—determining use cases and the categories of data,
- identify business stakeholders
- evaluate scope
- determine business drivers
- identify types of use cases
- data analysis—evaluating the data sources,
- evaluate existing and prospective internal data sources
- research free and paid external data feeds
- allocate sources and feeds to type of use cases
- validate allocation with business stakeholders
- data profiling—analyzing the data quality of the data points required,
- profile each source
- compare profile to logical data model to confirm its appropriate use
- apply ontology to intended use
- identify global reference data and associated data codes
- logical data architecture—classifying each data point to the business context of the LDA and collecting the business metadata of each data point,
- determine business context within the LDA
- identify related data points
- determine business metadata
- publish updated LDA
- conceptual data modeling—allocating each business data glossary item to its associated conceptual data model,
- incorporate glossary items into the conceptual data models
- establish any additional similar or related data glossary items
- validate data glossary item business context
- publish updated conceptual data models
- logical data modeling—incorporating conceptual data model updates into the logical data models,
- incorporate conceptual data model updates
- support preexisting application views
- conduct peer model review
- publish updated logical data models
- physical data modeling—implementing logical data model updates into physical designs,
- implement logical data model updates
- gather transaction path analysis
- incorporate physical design requirements
- conduct peer model review
- publish updated physical data models
- data discovery—locating the sources of the data
- identify data origins
- data source assessment
- selection of the best data source(s)
- data acquisition—extraction of the data into a landing zone
- extract selected data to landing zone
- data cleansing—(aka data scrubbing) cleansing data based upon data profiling specifications,
- profile the extracted data
- develop data cleansing specifications
- cleanse data and retain history
- record data quality metrics
- data standardization—standardize the codes for all data in the landing zone,
- develop data standardization specifications
- apply code table values from the global reference data master
- record standardization metrics
- data integration—standardizing and integrating scrubbed data into the ODS layer,
- develop data integration specifications
- create ODS layer databases in development
- integrate data into development while masking sensitive data
- record data integration metrics
- user acceptance—business user testing,
- migrate to QA
- business user testing without masking
- production—cutting over to production and monitoring data warehouse metrics
- retest and perform a go/no evaluation
3.1.2.8.3 Data Governance Life Cycle
It was easy to understand the differences between the SDLC and DCLC because there are many instances of application systems and data warehouses within large companies that we already had familiarity with. However, now that we have provided an overview of the SDLC and data centric development life cycle, the life cycle needed to support a data governance program, which we call a DGLC, has yet another focus, even though it shares a number of steps with the DCLC.
As we shall learn in the data governance section, the focus of our DGLC is to shift the business users’ dependence upon IT to self-reliance, self-service, and self-control in every aspect that is appropriate to empower business. Therefore, in contrast to the other life cycles we’ve already discussed, the DGLC has the majority of its participation from business users.
To summarize in a manner consistent with the prior life cycles, the 15 stages of the DGLC include:
- identifying data points—determining business usage and industry name,
- determine business usage
- determine business industry name
- populating business data glossary—identifying business synonyms, business owner, regulatory controls, external standards mapping, and sample values,
- identify business synonyms used by business stakeholders
- determine owing business department and business trustee
- record the proper business definition and business purpose
- identify associated business capabilities
- determine related regulatory requirements
- determine data sensitivity
- identify external standards mapping (e.g., MISMO, ACORD)
- identify sample business values or full set of domain values
- logical data architecture—classifying each data point to the business context of the LDA and collecting the business metadata of each data point,
- determine business context within LDA
- identify related business data points
- determine business metadata
- publish updated LDA
- conceptual data modeling—business-driven allocation of each business data glossary item to its associated conceptual data model and developing conceptual data models,
- incorporate glossary items into conceptual data models
- create any similar and related data items
- validate data glossary item business context
- publish updated conceptual data models
- logical data modeling—IT incorporating conceptual data model updates into the logical data models,
- incorporate conceptual data model updates
- support preexisting application views
- conduct peer model review
- publish updated logical data models
- physical data modeling—IT implementing logical data model updates into physical designs,
- implement logical data model updates
- gather transaction path analysis
- incorporate physical design requirements
- conduct peer model review
- publish updated physical data models
- data cleansing—(aka data scrubbing) cleansing data based upon data profiling specifications,
- identify origin of data
- extract data to landing zone
- profile the data in the landing zone
- develop data cleansing specifications
- cleanse data content and retain history
- record data quality metrics
- data standardization—standardize the codes for all data in the landing zone,
- develop data standardization specifications
- apply code table values from the global reference data master
- record standardization metrics
- data integration—standardizing and integrating scrubbed data into the ODS layer,
- develop data integration specifications
- create ODS layer databases in development
- integrate data into development masking sensitive data
- business designated access rights—designating ad hoc reporting access rights for each department based upon their business need,
- designate access rights for departments and roles
- legal and compliance oversight—validating and overriding access rights as necessary,
- validate access rights
- designate access rights overrides
- user acceptance—business user testing in a secure environment that resembles production,
- migrate to QA
- business user testing
- production—cutting over to production and monitoring data warehouse metrics,
- migrate to production
- production use
- secure canned reporting data points—designating business data glossary terms to canned reports,
- canned report data point analysis
- ad hoc report data point obfuscation
- reporting and querying—controlling canned report access and distribution, and
- canned report dissemination
- production to nonproduction data movement—masking sensitive data departing from the controls of production that safeguard the data
- mask sensitive data departing from production through ETL controls
Needless to say for data governance purposes, these stages may be performed iteratively with collections of data points by business area or individually by data point in any order.
3.1.2.8.4 Architecture Governance Life Cycle
The AGLC (aka foundation architecture) is a life cycle that identifies which architectural disciplines are necessary to instantiate or that are no longer needed at a given point in time. The AGLC accomplishes this by analyzing business direction, business strategy, pain points of the business, initiatives that span the enterprise, and the needs of stakeholders across the company and compares this to the architectural disciplines that are already in existence.
The steps of the AGLC include:
- analyze business direction—analyze the hedgehog concept of each line of business and the overall enterprise,
- identify business direction
- identify pain points
- map pain points to their corresponding architectural discipline
- analyze business pain points—inventory the pain points and prioritize them for greatest impact while in alignment with business strategy,
- prioritize pain points and evaluation metrics
- construct business case for remediation and financial approval
- analyze types of technological issues—categorize each new technology into an existing architectural discipline or identify the possibility of encountering the need for a new architectural discipline,
- categorize new technologies into architectural disciplines for SME evaluation
- analyze all business initiative types—categorize each business initiative to identify the possibility of encountering the need to modify an existing life cycle or create a distinct life cycle,
- evaluate initiatives across the enterprise to identify its corresponding life cycle
- modify existing life cycles or develop new life cycles as required
- assess business alignment—periodically analyze each architectural discipline to determine if it is in alignment with the hedgehog concept of each line of business and the overall enterprise
- depending upon technology gaps define new architectural discipline
- staff architectural discipline
- define the scope and touch points of the architectural discipline
- identify the hedgehog principle of the architectural discipline
- identify and assess current state
- determine future state
- identify metrics to compare current and future state
- identify stakeholders and identify their interests
- develop standards and frameworks
- develop transition plan
- socialize artifacts of the architectural discipline to solution architects
- initial architecture review—implement the AGLC prior to entering any other life cycle
- review the type of initiative
- identify the initial architectural standards and frameworks for the initiative
- postmortem architecture review—assess architecture participation in each initiative
- review the results of the initiative
- evaluate the role of architectural artifacts in the initiative
- identify the metrics to be evaluated
- identify ways to improve efficacy
3.1.2.8.5 Divestiture Life Cycle
Large global enterprises frequently acquire and divest itself of lines of business. The DLC addresses the steps that should be routinely considered when performing a divestiture.
The following illustrates the steps that are important to perform when implementing a divestiture in the USA.
The steps of the DLC include:
- identify scope of business being divested—determine which lines of business are being sold and those being decommissioned without transferring to another entity,
- identify the impacted departments
- identify the managers of the affected areas
- identify divested business capabilities—determine which specific business capabilities are involved in each sale or business decommissioning,
- identify internal business capabilities impacted
- identify external business capabilities impacted
- identify shared operations and automation supporting divested capabilities—determine which areas of operations and automation support will experience decreased volume,
- identify tier 0 infrastructure components in use by each business capability
- identify shared applications
- identify shared databases and files
- identify shared software infrastructure
- identify shared hardware infrastructure
- identify dedicated operations and automation supporting divested capabilities—determine which areas of operations and automation will be transferred or decommissioned,
- identify dedicated applications
- identify dedicated databases and files
- identify dedicated software infrastructure
- identify dedicated hardware infrastructure
- detach general ledger—remove general ledger feeds from decommissioned applications,
- identify general ledger feeds to decommission
- decommission divested application general ledger feeds
- identify unstructured data of divested areas—determine what unstructured data is associated with the business areas, operations and automation being divested,
- identify servers and personal devices used by business personnel
- identify document repositories supporting business operations
- identify document repositories supporting business users
- identify RIM data—determine what the RIM requirements are for the business areas, operations and automation being divested,
- identify applicable RIM data categories
- map RIM data categories to divested dedicated databases
- map RIM data categories to divested shared databases
- define RIM business data—define the collections of data across the data landscape that are within scope of RIM,
- identify required business data glossary capabilities
- implement required business data glossary capabilities
- safeguard RIM data—ensure that RIM data will be retained and protected for the required retention period,
- develop plan to safeguard RIM data
- implement plan to safeguard RIM data
- validate RIM reporting—develop and test common use cases for RIM reporting to validate RIM reporting capabilities,
- identify common use cases
- identify SLAs from stakeholders
- develop tests for common use cases
- implement tests for common use cases
- identify LHs—facilitate the documentation of and document each legal hold with the identifiers necessary to locate associated files and documentation for Legal,
- identify existing LHs
- identify pending LHs
- record legal hold search criteria
- safeguard legal hold data—identify files that contain the identifiers associated with each legal hold and safeguard those files without altering their file metadata,
- safeguard pertinent structured data
- safeguard pertinent unstructured data
- validate legal hold reporting—develop and test common use cases for legal hold reporting to validate legal hold reporting capabilities,
- identify the common use cases
- identify SLAs from stakeholders
- develop tests for common use cases
- implement tests for common use cases
- decommission/downsize business operations—decommission the operational workflows that provide capabilities being divested of,
- decommission dedicated business operations
- downsize shared business operations
- decommission/downsize physical facilities
- decommission/downsize automation—decommission or downsize the automation systems following the standards and procedures for an automation shutdown for automation being divested of, and
- decommission applications
- decommission databases
- decommission/downsize software infrastructure
- decommission/downsize hardware infrastructure
- decommission/downsize IT operations—decommission or downsize the IT operations associated with the systems being divested of
- decommission dedicated IT operations
- downsize shared IT operations
- downsize tier 0 infrastructure components
- decommission/downsize physical IT operations facilities
3.1.2.8.6 Mergers and Acquisitions Life Cycle
Companies that make merger and acquisition a core competency demonstrate a competitive advantage to meet the expectations of executive management appropriately without delay.
The steps of the MALC include:
- identify business scope being acquired—determine which lines of business are being acquired,
- identify business capabilities overlapping with existing capabilities
- identify new business capabilities
- identify business organization impact—determine which acquisitions and mergers will be merged into the acquiring business operation versus into the acquired business operation versus standing up a new business operation,
- identify existing departments with existing capabilities adding business volume
- identify existing departments adding new business capabilities
- identify new departments for new business capabilities
- identify business infrastructure and equipment requirements
- identify impact to business continuity capabilities
- identify business facility requirements
- identify acquired automation—determine what automation needs to come with the acquisition,
- identify acquired applications
- identify acquired databases
- identify acquired business data glossaries
- identify acquired conceptual data models
- identify acquired logical data models
- identify acquired physical data models
- identify acquired software infrastructure
- identify acquired hardware infrastructure
- analyze overlapping automation—determine what automation overlaps and which ones do not,
- evaluate existing versus acquired databases
- evaluate existing versus acquired applications
- evaluate existing versus acquired document repositories
- identify LHs—determine what LHs will be transferred in with the acquired lines of business,
- identify existing LHs
- identify pending LHs
- record legal hold search criteria
- safeguard legal hold data—identify files that contain the identifiers associated with each LH and safeguard those files without altering their file metadata,
- safeguard pertinent structured data
- safeguard pertinent unstructured data
- safeguard pertinent document repository data
- validate legal hold reporting—develop and test common use cases for legal hold reporting to validate legal hold reporting capabilities,
- identify common use cases
- identify SLAs from stakeholders
- develop tests for common use cases
- implement tests for common use cases
- compare data landscapes—evaluate the data landscape of the acquired lines of business and compare it to the data landscape of the enterprise,
- identify existing versus acquired data glossaries
- identify existing versus acquired conceptual data models
- identify existing versus acquired logical data models
- identify existing versus acquired physical data models
- identify automation impact—determine the automation integration strategy for each acquired automation system within each line of business acquired,
- complete and consolidate business data glossary content
- complete and consolidate conceptual data models
- develop integration strategy
- identify impact to technology portfolio
- identify impact to application portfolio
- identify impact to hardware infrastructure
- identify impact to DR
- identify development environment impact—compare the development and maintenance infrastructure of the acquired automation systems with those already existing within the enterprise,
- identify impact to development infrastructure
- identify impact to integration test infrastructure
- identify impact to QA infrastructure
- identify impact to production infrastructure
- implement automation strategy—implement the integration strategy of automation systems and stand up any additional automation systems that are not subject to integration,
- integrate data into the selected application databases
- negotiate licenses per technology portfolio impacted
- run automation in parallel per integration strategy
- identify IT organization impact—determine skills required and conduct a skills assessment to select the combination of best skills among the acquired and acquiring application development organizations,
- right-size departments with added business volume
- instantiate new departments
- instantiate new business capabilities
- general ledger integration—integrate the financials from each new automation system with the general ledger of the enterprise,
- identify chart of accounts for new business capabilities
- integrate new data feeds into the general ledger
- test general ledger integration
- right-size business operations—determine skills required and conduct a skills assessment to select the combination of best skills among the acquired and acquiring business organizations,
- right-size business operational facilities
- decommission extraneous business operations
- right-size automation—determine skills required and conduct a skills assessment to select the combination of best skills among the acquired and acquiring application development teams, and
- right-size application infrastructure
- right-size database services infrastructure
- right-size hardware infrastructure
- right-size IT operations—determine skills required and conduct a skills assessment to select the combination of best skills among the acquired and acquiring IT operations organizations
- right-size IT operations
- right-size IT operations facilities
3.1.2.8.7 Data Center Consolidation Life Cycle
DCCLC is distinct from MALC for a couple of reasons. First, during the merger and/or acquisition, the business strategy had not included data center consolidation, probably because the lines of business were sufficiently disparate from the existing lines of business that consolidation did not a significant consideration. Second, there is a strong likelihood that the data centers acquired in the merger and acquisition process are geographically located within 50 miles of the business they support.
After a handful of merger and acquisitions of disparate businesses, it becomes apparent that the economics of consolidating multiple data centers have become worthy of being actionable. The first issue for consolidating the data centers of these disparate businesses is to determine the business strategy that everyone must be mindful of as they plan the consolidation.
While data center consolidations are going to differ significantly from one another, the issues to consider are relatively common to the majority of them.
3.1.2.8.7.1 Primary Strategic Considerations
There are a number of basics to consider that will determine the scope of the consolidation.
Some of the ones from a high-level perspective include whether:
- to maintain flexibility to be able to divest of a business unit or line of business without facing a massive effort to separate the automation of that business unit out of a consolidated data center operation,
- to address the maturity level of data center operations across the organization as consolidation is planned,
- to consider capabilities that potentially should be consolidated in an outsourced mode as opposed to in-house consolidation,
- to consider capabilities that potentially should be consolidated in an insourced mode as opposed to continued outsourcing,
- there are services provided by data center operations that should not be delivered by operations, and
- there are services not provided by data center operations that should be delivered by operations.
While the list of strategic considerations is being assembled, there are two additional fundamental activities that can proceed in parallel, which include:
- data center inventory, and
- business capability inventory.
The data center inventory is an inventory of hardware (e.g., number of servers of each type and capacity) and software (e.g., corporate HR systems), including the metrics for their utilization so that a baseline of capabilities and service level can be defined, below which one should not venture without good reason.
The business capability inventory is an inventory of every business capability by business and IT department that identifies what “tools” and “applications” are used to support those business capabilities and the underlying data center infrastructure that supports those “tools” and “applications.”
As examples, “tools” include technologies that of themselves are not business specific in that they do not contain business rules, such as Internet connectivity to get to external services, whereas “applications” are business specific in that they do contain business rules, such as the general ledger application that contains the chart of accounts.
Associated with an application are usually a database management system, networks, network servers, application servers, database servers, and security servers, such as the active directory server, which represents high complexity and high risk.
The reason that the data center and business capability inventory are done together is that it is important for these two different perspectives to meet somewhere in the middle to enable the various strategic considerations that the business leaders may elect to act upon.
As one speaks with department heads and their management team to inventory business capabilities, one can usually solicit input from them on opportunities and risks. Ultimately as input into a good plan, all opportunities and risks should be analyzed for ROI and presented for consideration by business leaders.
3.1.2.8.7.2 Secondary Strategic Considerations
A variety of secondary considerations should also be evaluated in a data center consolidation.
Some of the ones from a high-level perspective include whether:
- to consider the consolidation of applications on application servers, and databases on database servers to take advantage of excess capacity and leverage potentially expensive software licenses
When the opportunity presents itself to do this on a large scale, and it often does, one of the steps to consider is to evaluate the transaction path analysis (TAPA) profiles of applications and databases to identify good versus poor “server roommate” applications and databases.
- “what-if-scenarios” should determine the ideal target state and transitional steps to get there to help create awareness of the level of effort and trade-offs of different target states
At a minimum, it is valuable to float a few different target states with which to solicit feedback that can be most valuable. Using a more robust approach, it is often valuable to model different target states for their ability to support various use cases, such as another merger acquisition and DR scenario.
- opportunities for content management clean-up using a “tiered storage” capability to reposition data that is infrequently accessed to less expensive storage where there are tools to sort and eliminate files and documents that are redundant or no longer relevant to anyone
This is one of the low-hanging fruits scenarios of the Big Data space where data can be off-loaded for analysis and disposal as rapidly as it can be determined that it is not required for regulatory data retention requirements, LHs, or other uses.
- shared services can be organized into services that require no knowledge of the business, some knowledge, or specific business knowledge
Shared services may require a significant degree of business-specific domain knowledge (e.g., data administrators), including application-specific domain knowledge (e.g., solution architects), or they may require virtually no knowledge of the business domain.
These characteristics participate as business drivers for determining which services should be:
- in the data center
– with a business SME
– without a business SME
- in the development organization
– business analysts
– IT Plan organization
– IT Build organization
Ultimately, if the shared service must be within the physical proximity of business users, whether business user is defined as resources on the manufacturing floor or in office buildings, then it should probably not be located within a centralized or regional data center.
Once a DCCLC has been conducted, it then serves as a template for future data center consolidations that can occur with each new merger and acquisition.
3.1.2.8.8 Corporate Restructuring Life Cycle
Companies that restructure to meet the changing economy and business direction as a core competency demonstrate a competitive advantage for meeting expectations of their investors.
The steps of the CRLC including their substeps are:
- identify executive management objectives—understand the business objectives and hedgehog concept of executive management,
- identify management’s perceptions of the brand
- identify management’s objectives for each line of business
- identify management’s objectives for the capital structure of the enterprise
- identify management’s objectives for the organizational structure of the enterprise
- identify management’s objectives for the operational cost structure of the enterprise
- evaluate executive management objectives—evaluate the existing assets of the enterprise compared to the assets ideally required to achieve executive management’s hedgehog concept,
- gather current state metrics
- identify core competencies
- identify hedgehog concept
- identify opportunities
- formulate target state alternatives
- evaluate target state alternatives—develop and evaluate alternative target states and the transition plans for each,
- identify business risks
- identify costs
- identify tangible and intangible benefits
- select optimal alternative
- identify target state metrics
- develop communications plan—given the selected target state and transition plan develop the communications plan,
- customer relations
- public relations
- employee relations
- regulator relations
- investor relations
- implement communications plan—once approved implement the communications plan to the various constituents such as employees and investors,
- conduct communications plans
- gather feedback
- evaluate effectiveness
- invoke appropriate life cycles—identify and deploy teams responsible to execute the required life cycles, such as:
- DLC
- mergers and acquisitions life cycle (MALC)
- ISLC
- OSLC
- OLC
- develop consolidated plan—integrate the plans from the various life cycles into one consolidated plan,
- collect outputs from each life cycle
- determine target state to achieve the hedgehog concept
- develop talent transition plan—develop the talent transition plan from the consolidated plan of life cycles,
- evaluate existing talent
- identify target state talent
- identify gaps
- develop plan to bridge the gap
- develop facilities transition plan—develop the facilities transition plan from the consolidated plan of life cycles,
- evaluate existing facilities
- identify target state facilities
- develop automation transition plan—develop the automation transition plan from the consolidated plan of life cycles,
- evaluate existing automation
- identify target state automation
- identify gaps and overages
- develop plan to achieve target state automation
- develop consolidated implementation plan—develop a consolidated implementation plan of talent, facilities, and automation,
- consolidate life cycle outputs
- consolidate plans
- identify metrics for target state over time
- execute consolidated transition plan—execute the consolidated implementation plan and monitor actuals to the consolidated implementation plan,
- execute consolidated plan
- collect metrics for target state over time
- evaluate actual versus target metrics—assess the metrics collected before and after implementation to determine if target metrics were met, and
- assess metrics for target state over time
- identify success targets met, target shortfalls, and target overages
- postmortem—evaluate why metrics were not met, met, or exceeded
- conduct post mortem
- record lessons learned
3.1.2.8.9 Outsourcing Life Cycle
Companies outsource in the belief that they will save money, which makes sense when demand for the areas outsourced fluctuate significantly, when skills are located elsewhere geographically, or when additional time zone coverage can be readily attained.
The steps of the OSLC including their substeps are:
- determine intended business value of outsourcing—understand the specific motivations for outsourcing and begin assessing its business value,
- list the expected benefits
- identify reasons to expect each
- identify expected value to be derived
- scope outsourcing initiative—understand the intended scope of outsourcing including identification of which business capabilities from among which lines of business,
- identify the potential scope of the outsourcing initiative
- identify the applicable business strategy
- determine degree of alignment to business strategy
- define the scope that best aligns with the business strategy
- define metrics-driven business objectives—determine business metrics of the future state,
- list the business objectives
- identify the metrics that most reliably measure each
- define metrics-driven IT objectives—determine IT metrics of the future state,
- list the IT objectives
- identify the metrics that most reliably measure each
- identify sources of increased cost for outsourcing—determine areas of increased cost and coordination overhead that would result from outsourcing,
- list additional communications costs
- list redundant oversight costs
- list transition costs
- list vendor personnel training costs
- list process refinement costs
- list knowledge loss costs
- list personnel reduction costs
- list facility right-sizing costs
- list temporary parallel operating costs
- list stranded infrastructure costs
- estimate increased costs and timing—estimate the increased costs and timing associated with each area of increased cost,
- identify budgets impacted by outsourcing
- determine amount of each budget impact
- determine timing of each budget impact
- assess current state—determine the business and IT metrics of the current state,
- collect metrics preoutsourcing
- analyze current state metrics
- assess technical debt owed to automation for quick and dirty maintenance
- assess nonextensible IT architectures
- assess overall complexity of IT landscape
- compare current state versus intended future state—compare and evaluate the assumptions of current and future states,
- estimate expected metrics of future state
- estimate timing of expected metrics in the future state
- identify risks in achieving the future state
- develop realistic projections of current and future state
- identify competing vendor interests—identify the competing interests and potential conflicts of interest between outsourcing vendors and the enterprise,
- identify leading vendors
- evaluate frameworks of each vendor
- identify vendor interests with regard to each framework
- identify vendor interests conflicting with your own
- conduct risk mitigation planning—conduct risk mitigation planning for each competing interest and potential conflicts of interest between outsourcing vendors and the enterprise,
- assess risks in achieving future state
- assess risks in managing competing vendor interests
- develop an incremental outsourcing plan
- determine degree of staff augmentation
- determine degree of project outsourcing
- determine degree of function outsourcing
- vendor selection—select the best vendor based upon their ability to meet required terms and conditions within the outsourcing agreement,
- select top three vendors
- add internal team as an additional credible vendor
- negotiate to start slow and build slowly
- negotiate insourcing terms for each item to be outsourced
- determine critical SLAs
- evaluate vendors for their ability and willingness to meet your objectives
- identify vendor agreement with the most favorable terms and conditions
- compare internal versus negotiated outsourcing options—compare the option of an internal solution to the best outsourcing option based upon terms and conditions and cost,
- reevaluate total cost of outsourcing
- evaluate ability of negotiated terms to meet objectives
- evaluate comparable investments using an internal solution
- determine whether to execute outsourcing agreement
- implement outsourcing agreement—implement the best agreement for the enterprise, and
- organize to implement the provisions of the agreement
- measure and track costs and savings
- identify lessons learned of favorable and unfavorable lessons
- remedy outsourcing issues/process improvement—remedy both anticipated and unforeseen issues with the agreement or implementation of the agreement
- identify outsourcing issues
- determine if SLAs on both sides are being adhered to
- enforce the agreement where possible
- plan for a balanced renegotiation for both sides
- evaluate insourcing options
- renegotiate and implement an improved agreement
3.1.2.8.10 Insourcing Life Cycle
Companies elect to insource in the belief that they will improve service or save money, such as when an outsourcing provider fails to deliver a sufficient level of service.
The steps of the ISLC including their substeps are:
- determine intended business value of insourcing—understand the specific motivations for insourcing and begin assessing its business value,
- list the expected benefits
- identify reasons to expect each benefit
- identify expected value to be derived
- scope insourcing initiative—understand the intended scope of insourcing including identification of the specific business capabilities,
- identify the potential scope of insourcing
- identify the applicable business strategy
- determine the degree of alignment to business strategy
- redefine scope to fully agree with business strategy
- define metrics-driven business objectives—determine business metrics of the future state,
- list the business objectives
- identify the metrics that most reliably measure each
- define metrics-driven IT objectives—determine IT metrics of the future state,
- list the IT objectives
- identify the metrics that most reliably measure each
- assess prior state prior to insourcing—evaluate the current state prior to insourcing and collect pertinent metrics,
- collect metrics pre-insourcing
- analyze current state metrics
- assess technical debt owed to automation for quick and dirty maintenance
- assess nonextensible IT architectures
- assess overall complexity of IT landscape
- identify sources of increased costs for insourcing—determine areas of increased cost and coordination overhead that would result from insourcing,
- list facility costs
- list staffing costs
- list training costs
- list equipment acquisition costs
- list transition costs
- list process refinement costs
- list parallel operating costs
- estimate increased costs and timing—estimate the increased costs and timing associated with each area of increased cost,
- identify budgets impacted by insourcing
- determine amount of each budget impact
- determine timing of each budget impact
- identify sources of insourcing benefits—determine the source for each insourcing benefit anticipated by management,
- list of vendor payments
- list of personnel managing the vendor
- list of communications costs involving the vendor
- refine business and IT objectives—refine the business and IT objectives based upon the metrics of the detailed cost-benefit analysis,
- refine metrics-driven business objectives
- refine metrics-driven IT objectives
- compare current state to future state—using a metrics-driven approach compare the current state to the proposed future state,
- estimate expected metrics of future state
- estimate timing of expected metrics of future state
- estimate value of benefits and timing—estimate the value of the benefits and the timing associated with each area of benefit,
- determine amount of each expected benefit
- determine timing of each expected benefit
- conduct risk mitigation planning—assess and mitigate the risks associated with the insourcing plan,
- assess risks in achieving future state
- develop risk mitigation plan
- develop insourcing plan—develop the consolidated plan to in source the targeted business capabilities,
- determine degree of staff augmentation reduction
- determine degree of project insourcing
- determine degree of function insourcing
- determine internal support services and vendor transition costs—estimate the necessary internal support services and vendor transition costs associated with the plan,
- identify transition components from vendor
- negotiate transition support costs with vendor
- identify internal support costs
- compare negotiated insourcing to existing outsourcing option—compare the terms and conditions of the negotiated insourcing plan with those of the existing outsourcing plan and any other negotiated agreements for outsourcing plans,
- reevaluate total cost of insourcing
- evaluate ability of negotiated terms to meet objectives
- evaluate a comparable investment using another external solution
- determine whether to execute the insourcing agreement
- implement insourcing agreement—implement the desired insourcing agreement, and
- organize to implement the provisions of the agreement
- measure and track costs and savings
- identify lessons learned whether favorable or unfavorable
- remedy insourcing issues/process improvement—remedy both anticipated and unforeseen issues with the agreement or implementation of the agreement
- identify insourcing issues
- determine that SLAs of service providers and consumers are being adhered to
- enforce SLAs where possible
- plan for a balanced negotiation for the internal department supporting the business capabilities that have undergone insourcing
- reevaluate insourcing and outsourcing options
- renegotiate and implement an improved internal agreement
3.1.2.8.11 Operations Life Cycle
Companies elect to establish new data centers as primary or secondary centers to support their primary and backup site requirements to support the business needs of the enterprise for the automation they rely upon.
The steps of the OLC including their substeps are:
- evaluate business requirements—identify the near and long-term requirements of data center capabilities,
- determine internal user logistical profile
- determine external vendor logistical profile
- determine regulator logistical profile
- determine B2B logistical profile
- determine customer logistical profile
- determine logistical profile of additional data centers
- determine network and communications profile
- determine candidate data center location risks—identify the various location risks that should be taken into consideration for each candidate data center,
- evaluate environmental threat profiles
- evaluate local industrial hazards
- evaluate geopolitical threat profiles
- evaluate availability of skilled resources
- evaluate availability of land, facilities, and business services
- evaluate availability of communications services and providers
- evaluate power reliability
- evaluate availability of local resources and services (e.g., fire department)
- evaluate weather profile
- determine candidate data center risk mitigation costs—determine the mitigation costs associated with each candidate data center,
- determine cost to protect against environmental threats
- determine cost to protect against industrial hazards
- determine cost to protect against geopolitical threats
- determine cost of addressing skilled resource availability
- determine cost of addressing availability of land, facilities, and business services
- determine cost of addressing availability of communications services
- determine cost of addressing power reliability
- determine cost of rendering resources and local services deficiencies
- estimate climate control costs
- evaluate surroundings—evaluate the specifics of the immediate surroundings of each candidate data center,
- determine nearest flood plain details
- determine nearest flight path details
- determine nearest hazardous shipping lane details
- determine nearest water main details
- determine nearest well water details
- determine preferred site—select the most beneficial data center site,
- evaluate purchase costs
- evaluate improvement costs
- evaluate cost of taxes, fees, and permits
- evaluate potential tax relief
- project development of the local area over time
- estimate future value
- determine compliance requirements—determine any business or regulatory compliance issues,
- determine compliance requirements
- determine SAS 70 Type II solution and cost
- determine LEED solution and cost
- determine PCI solution and cost
- determine HIPPA solution and cost
- determine SCIF solution and cost
- determine environmental controls—identify the required environmental controls associated with the particular site,
- determine programmable logic controller requirements
- determine redundant equipment requirements
- determine high sensitivity (HSSD) requirements
- determine gas fire suppression requirements
- determine single grounding system requirements
- determine support service requirements—identify the necessary support services that must be developed,
- determine remote hands service requirements
- determine rack and stack requirements
- determine cabling requirements
- determine technical assistance command center requirements
- determine on-site operations staff requirements
- determine access controls—identify the access controls that must be developed,
- determine defensible perimeter requirements
- determine traffic bollard/car trap requirements
- determine gated entry requirements
- determine guard service requirements
- determine digital video surveillance requirements
- determine customer access list requirements
- determine building compartment requirements
- determine visitor tracking requirements
- determine mantrap system requirements
- determine biometric screening requirements
- determine equipment cage and fence requirements
- determine infrastructure architecture—develop the standards and frameworks that must be adhered to for the infrastructure,
- determine storage architecture
- determine telephony video architecture
- determine desktop architecture
- determine mobile device architecture
- determine application server architecture
- determine database server architecture
- determine operational utilities architecture
- determine database operational utilities architecture
- determine virtualization architecture
- determine network architecture—develop the standards and frameworks that must be adhered to for networking and communications,
- determine local area network architecture
- determine wide area network architecture
- determine firewall architecture
- determine file transfer architecture
- determine security architecture—develop the standards and frameworks that must be adhered to for security,
- determine physical security architecture
- determine application security architecture
- determine database security architecture
- determine server security architecture
- determine NAS security architecture
- determine network security architecture
- determine directory services architecture
- determine job scheduling architecture—develop the standards and frameworks that must be adhered to for job scheduling,
- determine job scheduling software architecture
- determine job scheduling testing and simulation architecture
- determine job scheduling production architecture
- determine system recovery architecture—identify the backup and recovery services standards and frameworks that should be adhered to,
- determine failover architecture
- determine DR architecture
- determine technical services architecture—identify the necessary technical services standards and frameworks that should be adhered to,
- determine problem management architecture
- determine release management architecture
- determine service-level agreement architecture
- determine alerts monitoring architecture
- determine change management architecture
- determine configuration management architecture
- determine testing architecture
- determine deployment architecture
- determine help desk architecture
- determine infrastructure applications architecture—identify the necessary infrastructure applications architecture standards and frameworks that should be adhered to, and
- identify infrastructure categories
- determine requirements for each infrastructure category
- determine applications to support required capabilities
- determine systems performance architecture—identify the necessary system performance standards and frameworks that should be adhered to
- identify system performance categories
- determine requirements for each performance category
- determine systems performance architecture
1 This is an architectural style that divides a larger processing task into a sequence of smaller, independent processing steps, referred to as “filters,” which are connected by channels, referred to as “pipes.” Each filter exposes a very simple interface receiving inbound messages from an inbound pipe, then processes the data, and then generates a message on an outbound pipe. The pipe connects one filter to the next, until the processing is complete. There are a number of architectural subpatterns based on pipeline patterns, such as the aggregator subpattern, which is a special filter that receives a stream of messages and correlates the ones that are related, aggregates information from them, and generates an outbound message with the aggregated information. In contrast, a splitter subpattern is a special filter that separates messages into subsets that can be routed to distinct outbound pipes.
2 For a more complete list of messaging patterns and subpatterns of architectural subtypes, refer to Enterprise Integration Patterns: Designing, Building, and Deploying Messaging Solutions by Gregor Hohpe and Bobby Woolf, 2004, published by Addison-Wesley, ISBN: 0-321-20068-3.