Pragmatic Enterprise Architecture (2014) Strategies to Transform Information Systems in the Era of Big Data
PART IV Information Architecture
Abstract
This part separates one of the most important areas of specialization, information architecture, from the rest of the vast area of enterprise architecture so as to provide it the appropriate degree of focus and attention. Information architecture is the brain and central nervous system of any large organization and as such should be called out as a distinct set of disciplines with its own philosophy and mindset. While arguably the most important part of an organization's ecosystem, information architecture is among the most difficult for the general population to understand due to the need to intimately understand the business as well as a vast array of IT areas of specialization involving data architecture, reference data, master data, data governance, data stewardship, data discovery, data in motion, and a variety of associated disciplines that reside in operations architecture, business architecture, and the main body of enterprise architecture in the previous major section.
Keywords
Information architecture
data architecture
data governance
business data glossary architecture
data ownership architecture
data access rights architecture
ETL data masking architecture
canned report access architecture
data stewardship
data discovery
semantic modeling
architecture governance component registry
data governance dashboard
data obfuscation architecture
data modeling architecture
reference data management—product master
reference data management—code tables
reference data management—external files
data in motion architecture
data virtualization architecture
ETL architecture
ESB architecture
CEP architecture
content management architecture
master data management
MDM
logical data architecture
LDA
code tables
external files
operational workflow
reference data
activity data
initial business setup
conducting business
analyzing business
business data glossary
business metadata
identifying the source of data
extracting data to a landing zone
data profiling
data standardization
data integration
data ownership
data access rights
sensitive data
masked
encrypted
canned report with variable data
canned report with fixed data
treaty zone
jurisdictional level
authority document level
data steward level
data discovery architecture
data landscape
Big Data
ontology
document management
taxonomy of legislative jurisdictions
administration
document development
approval process
production use
metrics
data obfuscation
data access restrictions
data masking
data encryption
data at rest
DAR
data in motion
DIM
protection of business communications
SSN
data modeling
conceptual data model
logical data model
physical data model
normalization
1NF
2NF
3NF
4NF
5NF
6NF
7NF
DKNF
BCNF
weaknesses or normalization
abstraction
rules of data abstraction
class words
1AF
2AF
3AF
4AF
transaction path analysis
TAPA
reference data management
product master management
metadata
code tables management
ISO
International Organization for Standardization
external files management
A.M Best
Bank of Canada
Bank of England
Dun & Bradstreet
Equifax
Experian
Fitch
Moody’s
Morningstar
United Nations
ETL
ESB
CEP
FTP
XML
data streaming
data virtualization
ODS
data warehouse
extract transform and load
ETL CASE tool
enterprise service bus
SOAP
service-oriented architecture protocol
complex event processing
content management
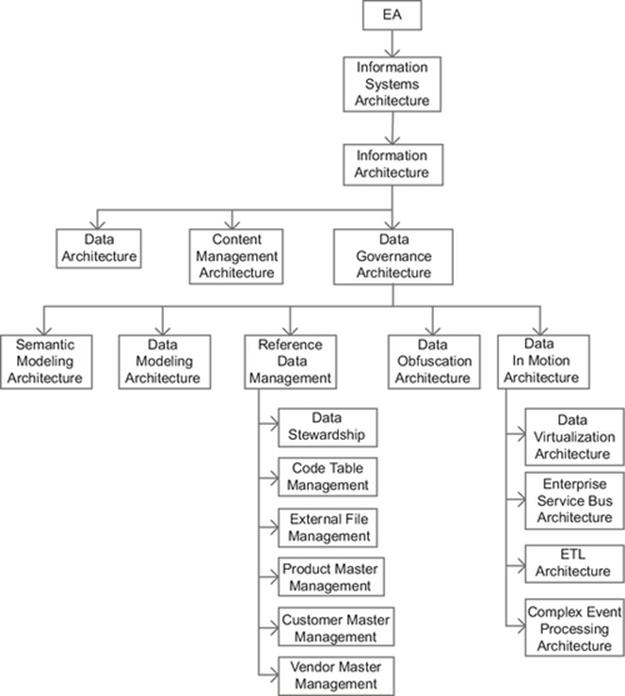
DIAGRAM Information architecture overview.
4.1 Information Architecture
Information architecture is the foundation of information systems architecture that also represents a significant number of the architectural disciplines of information systems architecture.
To begin, every enterprise has assets. As examples, it has employees, customers, IT facilities, business facilities, and financial assets. However, the most significant asset of most large enterprises is its data.
The reason for this is that the data asset of each and every company defines its individuality. A company’s data reflects its particular marketing efforts, business activities, customer interactions, product sets, employees, and financial history.
An enterprise can have its:
- employees lured to other firms,
- customers attracted away by competitors,
- data centers demolished by meteors,
- buildings lost in storms and fires, or
- capital consumed in a single catastrophic event.
An enterprise can also:
- hire new employees,
- build a new customer base,
- construct a new data center,
- acquire new buildings with leases, and
- raise new capital through investors or by borrowing.
However, if an enterprise loses or destroys its information in every location it is kept, then there is no external source from which it can be reacquired.
Information architecture is responsible for knowing everything about the data assets of the enterprise. Due to the extensive breadth and depth of information, information architecture has the greatest breadth and depth of any set of frameworks within any of the architectural disciplines.
The first contributing factor is that the number of business data points within businesses. These are the number distinct items of data that each have their own business definition that for a large enterprise can number in the millions, such as the following sample from a small segment of the employee onboarding process:
- prospective employment candidate resume received date,
- prospective employee interview date,
- prospective employee reference check date,
- prospective employee former employer verification date,
- prospective letter rejection letter date,
- prospective employee offer letter date,
- prospective employee offer letter acceptance date,
- prospective employee intended start date,
- prospective employee pre-hire medical date,
- prospective employee background check date, and
- employee start date.
The above data points are a sampling of dates that do not begin to address the hundreds of data points involved in the other types of data point involving that segment of onboarding and the many hundreds of data points involved in the following onboarding activities:
- assigned work space,
- assigned HR representative,
- assigned furniture,
- assigned equipment,
- assigned telephone number,
- assigned conference calling number,
- employee badge,
- supervisor,
- assigned fire drill station assembly area,
- benefit options,
- associated budgets,
- travel expense reimbursement,
- relocation,
- job training,
- compliance training,
- access to physical compartments,
- access to software applications,
- access to servers, and
- access to network components.
The architectural disciplines that are part of information architecture include:
- data architecture,
- data governance,
- business data glossary architecture,
- data ownership architecture,
- data access rights architecture,
- ETL data masking architecture,
- canned report access architecture,
- data stewardship,
- data discovery,
- semantic modeling,
- architecture governance component registry,
- data governance dashboard,
- data obfuscation architecture,
- data modeling architecture,
- reference data management (RDM)—product master,
- RDM—code tables,
- RDM—external files,
- data in motion (DIM) architecture,
- data virtualization architecture,
- ETL architecture,
- ESB architecture,
- CEP architecture, and
- content management architecture.
Within each of these disciplines, there are a variety of technologies that for the most part are far from inexpensive. These require subject matter experts to match the needs of the organization with the most appropriate technologies, standards, and frameworks.
Within information architecture also exists data life cycle management (DLM) (aka information life cycle management (ILM)). This is a policy-based approach to managing the flow of an information system’s data through its life cycle from creation to the time it becomes obsolete and must be properly disposed of.
As such, information architecture must ensure the inclusion of DLM policies into the appropriate information architecture frameworks, namely, data governance standards and frameworks. It should be noted that policy-based approaches are generally not successful unless their content is incorporated into the appropriate data governance standards and frameworks. DLM must also be coordinated with records information management (RIM) and legal hold (LH) in collaboration with areas such as content management architecture.
4.1.1 Master Data Management
In this section, we see that there are over 20 distinct architectural disciplines that comprise information architecture. As you probably noticed, these architectural disciplines were neither named master data management (MDM) nor had MDM participating in any part of their name.
MDM is a term that has been given a variety of different meanings and varying scope that as a term it has become relatively ineffective for communicating clearly.
As examples of what may be found within the scope of MDM:
- some variations on logical data architecture (LDA) (i.e., part of data architecture),
- all aspects of data governance,
- data glossaries of all types,
- occasionally data ownership,
- occasionally data access rights (i.e., data security),
- data masking—usually restricted to batch ETL from Production to a test environment,
- aspects of data stewardship,
- aspects of data discovery,
- occasionally semantic modeling,
- occasionally data mining,
- occasionally content management,
- some aspects of metadata—of which there are many,
- RDM—although MDM has numerous definitions for it including party and product master,
- occasionally data resellers, data concentrators, and data enhancement vendors,
- sometimes RIM and data archival,
- sometimes continuity management and disaster recovery (DR),
- sometimes LHs,
- occasionally data virtualization,
- increasingly ESB architecture,
- increasingly CEP architecture,
- all aspects of data quality—including data standardization, and
- most aspects of data profiling—the term “most” was used because there are aspects of data profiling for advanced data compression that MDM does not consider.
The variety of capabilities that participate under the umbrella of MDM is larger than the topics related to data that are not part of MDM (e.g., physical data modeling). Products marketed within the MDM space range between bundled offerings that are “all encompassing” and extremely expensive, both from a licensing and internal cost perspective, to offerings that are clearly focused and well priced for the value they deliver.
Even though a substantial portion of this book addresses topics that belong to MDM, the only reason that this section was added, with the name “MDM,” is to address the fact that someone will ask how an entire book about enterprise architecture could have missed the topic of MDM.
MDM is a term that has been given a variety of different meanings and varying scope that as a term it has become relatively ineffective for communicating a particular idea that anyone would immediately understand.
As examples of what may be found within the scope of MDM:
- some variations on LDA (i.e., part of data architecture),
- all aspects of data governance,
- data glossaries of all types,
- occasionally data ownership,
- occasionally data access rights (i.e., data security),
- data masking—usually restricted to batch ETL from production to a test environment,
- aspects of data stewardship,
- aspects of data discovery,
- occasionally semantic modeling,
- occasionally data mining,
- occasionally content management,
- some aspects of metadata—of which there are many,
- RDM—although MDM has numerous definitions for it including party and product master,
- occasionally data resellers, data concentrators, and data enhancement vendors,
- sometimes RIM and data archival,
- sometimes continuity management and DR,
- sometimes LHs,
- occasionally data virtualization,
- increasingly ESB architecture,
- increasingly CEP architecture,
- all aspects of data quality—including data standardization, and
- most aspects of data profiling—the term “most” was used because there are aspects of data profiling for advanced data compression that MDM does not consider.
The variety of capabilities that participate under the umbrella of MDM is larger than the topics related to data that are not part of MDM (e.g., physical data modeling, name and address standardization, and match and merge). Products marketed within the MDM space range between bundled offerings that are “all encompassing” and extremely expensive, both from a licensing and internal cost perspective, to offerings that are clearly focused and well priced for the value they deliver.
Even though a substantial portion of this book addresses topics that belong to MDM, the only reason that this section was added, with the name “MDM,” is to address the fact that someone will ask how an entire book about enterprise architecture could have missed the topic of MDM.
My advice on MDM is to first distill out the disciplines related to it and address them one at a time including those processes that support their governance, starting with:
- LDA
- business data glossary
- RDM
- code tables reference data—(e.g., country codes) including all codes that may be shared across applications or may be useful for business analytics and reporting including all forms of product and customer segmentation
- files that serve as reference data—(e.g., pricing feed) including all externally acquired files that can be used to support marketing, pricing, or risk analysis
- LDA reference data subject areas—(e.g., chart of accounts, customer, product, vendor, distribution channel) including any data that can be shared across the organization
The goal is to standardize all information with which management may want to analyze the business activity, such that the data representing the same concepts all reference the same names and codes. When done properly, it becomes possible to correctly determine inventory levels, costs, margins, and profitability across what may have previously been disparate collections of data that don’t match.
That said, when asked to kick off an MDM initiative, the following information is useful to gather from business and IT resources before one engages the appropriate architectural disciplines.
4.1.1.1 Business Perspective
- Is there a chief customer officer (CCO) role in the organization?
- Is procurement centralized?
- Is product development centralized?
- What is the desired business direction of the organization?
- What is the business strategy for moving the organization in the desired business direction?
- What is necessary for the business strategy to be successful?
- How would you define the concept of “your biggest competitor”?
- What company would you consider to be your biggest competitor(s)?
- What would you say is their core competency?
- What is the core competency of your organization?
- What core competencies are necessary to implement your organization’s business strategy?
- What is necessary to hone the necessary core competencies?
- What data informs and drives the necessary core competencies?
- Where does the data that informs and drive these necessary core competencies originate?
- What business capabilities do you have insight into?
- What would are the biggest business pain points in these business capabilities and why?
- Given the desired business direction what pain points are likely to emerge?
- What data enters the organization from your business areas?
- What business capabilities outside your own use data from other business areas?
- What data originates from your business area?
- What business capabilities outside your own use data originated in your business area?
- What data does your area use that enters the organization from a different business area?
- What data does your area use that originates in a different business area?
- What data that originated within your area does your area update?
- What data that originated elsewhere does your area update?
- What is the definition of customer including any classification schemes for customers?
- Is there a customer hierarchy across the organization?
- What is the definition of product including any classification schemes for products?
- Is there a product hierarchy across the organization?
- Are products uniquely and consistently identified across the organization?
- What is the definition of vendor including any classification schemes for vendors?
- Is there a vendor hierarchy across the organization?
- What is the process for handling LHs?
- After customer, product, and vendor what would you say is the next most important data?
- What percent of staff are primarily maintaining or developing new reports?
- What percent of staff are primarily monitoring and maintaining data quality?
- What is the overall budget used for developing new reports for your area of the business?
- What is the overall budget used to maintain data quality within your area of the business?
4.1.1.2 Business IT Perspective
- What infrastructure is used to support each business capability within your area?
- What external software applications are used to support each business capability in your area?
- What internal software applications are used to support each business capability in your area?
- What software products (MS Excel) are used to support each business capability in your area?
- What software products have business rules to support each business capability in your area?
- For each business capability what types of reports, ad hoc queries, and data analysis are used?
- What types of reports, ad hoc queries, and analysis are produced for executive management?
- What types of reports, ad hoc queries, and analysis are produced for internal oversight?
- What types of reports, ad hoc queries, and analysis are produced for regulatory bodies?
- What business metadata exists for report content and who maintains it?
- What is being done to remediate any lack of business metadata?
- What data quality issues if any would you say impede any of these types of reports?
- What efforts are being made to address data quality issues?
- What is the process for decommissioning business automation?
- To what degree (%) do data models have meaningful business definitions?
- To what degree (%) have data model business definitions been validated by business?
4.1.1.3 IT Perspective
- What is an LDA and is there one for the organization?
- What life cycle does the PMO use for data centric data warehouse initiatives?
- What life cycle does the PMO use for data centric data governance initiatives?
- What information architecture disciplines are you aware of within the organization?
- What data governance architecture disciplines are you aware of within the organization?
- What RDM disciplines are you aware of within the organization?
- What reporting architecture disciplines are you aware of within the organization?
- What reporting technologies are you aware of within the organization?
- What data stewardship disciplines are you aware of within the organization?
- Is DIM architecture restricted to ETL, ESB, and CEP, and which brands of each?
- Is there an ETL CASE tool in place?
- Who determines data ownership?
- Who determines ad hoc data access rights?
- Who determines canned report data access rights?
- Who determines cyclical canned report data access rights?
- Which report types use a master data source?
- Which report types do not use a master data source?
- What are the business and IT purposes for content management technologies?
- Which products are used for content management?
- How is content within each content management repository organized?
- What is the content management ontology for content?
- What is the process for managing content?
- What databases/files/content management repositories house each type of data (e.g., customer, product, vendor, distribution channel, employee, contracts)?
- What is the data lineage for each type of data?
- What are the data quality issues for each type of data?
- Is each type of data cleansed uniformly?
- Is each type of data standardized uniformly?
- Is each type of data integrated uniformly?
- What would business metadata characteristics are captured in data models?
In summary, there are absolutely great architectural patterns available to address various MDM-related challenges in cost-effective ways. Before arriving at one, however, it is critical to understand the Web of desktop software and manual processes that have been deployed to compensate for the lack of unique identifiers for data that is shared across the organization, as well as the Web of desktop software tools and manual processes that perform application integration among business systems and reporting platforms.
4.1.2 Logical Data Architecture
When developing an architecture for anything, whether that thing consists of things that are tangible, intangible, or both, it forms a foundation and foundations are clearly best when they are stable.
As mentioned earlier, the most stable foundation upon which one may organize the parts in a control system—software that operates machinery—is the discrete hardware components that one can point to and touch (e.g., anemometer, throttle). The LDA for a simple control system consisting of just these two parts would be one data subject area for the anemometer and one for the throttle.
In contrast, the role of LDA in information systems is somewhat similar to that of hardware architecture in control systems. In information systems, a well-formed framework formed by the business data can be extremely stable. If well formed in accordance with a rigorous LDA approach, the data architecture would be stable not only for the particular line of business in the particular company, but it would be stable for that line of business across all companies, geographic regions, and political jurisdictions operating the same line of business.
This is not to mean that new data points will not be discovered in one company versus another; however, it does mean that the LDA framework will be stable for use in areas such as application architecture, data warehouse architecture, and business data glossary architecture.
To describe an LDA in more detail, the first thing to remember is that it is a business artifact. The LDA diagram is an illustration of all data and information that is related to the enterprise.
For example, this includes any data about the business, whether it can be found in a computer file or database, e-mail, text message, tape-recorded telephone conversation, on an index card or a sheet of paper in a file cabinet, or in someone’s head. It also includes data that is sourced externally and brought into the enterprise.
Examples of external data include:
- code tables—ISO country codes, zip codes, currency codes
- external files—securities pricing feeds, prospective customer lists, demographic overlays
The purpose of the LDA is to depict clear distinctions of meaning among each and every business term used to represent every piece of data that can be used or referred to across the enterprise. With categories of clear distinction also comes a rigorous taxonomy.
Just as an expert wine taster is empowered with a vocabulary of almost a hundred words to describe several different characteristics of wine and its effects upon the palate and nose, the business vocabulary of a business domain empowers the participants of business, such as a business user and a developer, to communicate ideas more effectively.
Multiple interpretations and/or ambiguities are eliminated when vocabulary is used effectively. As an example, in insurance, the business meaning of something called Policy Payment Date communicates little information in comparison with something called a Policy Payment Due Date, Policy Payment Received Date, Policy Settlement Date, Policy Clearance Date, and Policy Funds Delivery Date.
As in the above example, individuals equipped with a comprehensive vocabulary are better equipped to communicate details about the business better than individuals that are not so prepared; however, the presence of a large vocabulary brings the burden of managing its documentation and disseminating it to others. As such, another important role of an LDA is to organize vocabulary, by creating easy to use categories for locating and managing it.
Such categories of information may differ from one another in one important aspect, their stability. Categories that are unstable can create massive amounts of work when information has to be reorganized to adhere to a new set of categories.
That said, perhaps the most important role of an LDA is to establish stable components of information that can be used as a foundation for other architectures, such as an object-oriented application architecture. The more stable the application architecture’s foundation, the more cost-effective maintenance will become.
The LDA is a top-down hierarchy of data-related topics.
For example, if the business were a bagel store, we would start with three major categories of data:
- initial business setup
- conducting business
- analyzing business
For example, there are large amounts of data and information that are collected and generated well before the business is ever ready to make and sell its first bagel. There are business plans, determining the size and location of the store, its design and equipment, its staffing, its operational processes, various permits, and licensing and inspections, and then there is the matter of ownership, management, and the financial details.
The next distinct category of data and information is the data and information that is generated once the doors of the store have opened for business.
For example, using the same store, there are data and information collected and generated while conducting business, entering into transactions with customers, taking one time orders from walk-in customers, taking and supporting reoccurring orders from local convenience stores and restaurants, and performing the various operations of the business that keep supplies in check with the demands of the store’s products and services.
The third distinct category of data and information is generated only after the doors of the store are closed.
For example, the same store may wish to analyze which products and promotions were most and least popular and profitable. A trend analysis may reveal that business is cyclical while also growing at a rapid rate, or declining due to a competitor that just opened down the street. This third category of data uses the information generated in the previous category and analyzes it to help make informed management decisions.
Within each distinct category of data, there are additional distinct categories down that are driven down to the business data subject area, which is the lowest level category that is useful to compartmentalize data into.
Let’s consider what is typically the largest category of data, which is called “conducting business.” It consists of the information that is employed and generated while business is being conducted, as is legally referred to as “books and records” of the business.
This area of data and information embodies the results of each step within each operational process pertaining to customer acquisition, and engagement, as it encompasses all contractual agreements with customers for the products and services of the enterprise in support of revenue generation, and supporting services to the customer.
As defined by the Securities and Exchange Commission, “books and records” information includes purchase and sale documents, customer records, associated person records, customer complaints, and information specifically designed to assist regulators when conducting examinations of business practices and/or specific business transactions, including accessibility of books and records on a timely basis.
Within the major category of “conducting business,” the next data categories are:
- operational workflow,
- reference data, and
- activity data.
To define these, the operational workflow layer is data that represents the information about each request or event that initiate operational actions within a given operational process, and includes the assignment of resources that participate in the workflow, the steps they perform, the authorizations they receive, and the conclusion of the request. As such, the operations layer represents information about how, when, and by whom each workflow is exercised within the enterprise representing the workload, the resources involved, and the various logistics that describe how the operational processes occurred.
It should be noted that the same operational information is applicable whether the operation was performed in-house, outsourced, off-shored, or using any combination of the aforementioned.
In contrast, the reference data layer is the data that must first be established prior to a specific business transaction. To best understand this, let’s consider a simple sale transaction to purchase some number of bagels. Prior to the actual sale, the reference data that we would need to effect the purchase would include:
- product reference data—which would include the product characteristics, its unit price, and its volume discounted pricing,
- tax rate reference data—which would include the tax rates for the various possible jurisdictions within which the transaction to purchase bagels is being conducted, and
- customer reference data—which would include information about the customer, particularly institutional customers that may be purchasing significant quantities of product for delivery each morning.
The activity data layer is the data that records the all of the information about the sale, which may include orders that are made well in advance, and well as spot contracts of bagel transactions that are effected for immediate pickup or delivery.
In a large enterprise, the data subcategories of operational, reference, and activity data often include several data categories, such as:
- front office—the books and record data associated with the front office includes the business dealings that are the primary sources for generating revenue for the enterprise from sales and sometimes includes corporate finance.
As such, the front office represents the greatest profit center of the enterprise, which must fund all of the cost centers of the enterprise, which include middle office and back office areas.
Examples of front office business areas include the various sales, marketing, and distribution channels of the enterprise.
- corporate actions—the data and information of corporate actions include the business matters that affect shareholders, which may or may not require shareholders to weigh in by voting at a shareholder meeting or by mail in voting proxy
Examples of corporate actions include shareholder registration, payments of dividends, payment of debt on bonds, forward and reverse stock splits, mergers, acquisitions, and divestitures.
- board of directors—the data and information of board of directors include the business matters that are addressed by the board of directors, who are selected by the shareholders and governed by the company bylaws to provide guidance to the enterprise in the marketplace and who are accountable to ensure that the company conducts business in accordance to law.
The members of the board of directors are legally charged with the responsibility to govern the corporation and are accountable to the shareholders. The board of directors usually consists of a board chair, vice chair, secretary and treasurer, and one or more committee chairs, and board members.
The board is responsible for establishing and maintaining the corporation in the legal jurisdictions required, for selecting and appointing a chief executive, for governing the company with principles and objectives, for acquiring resources for the operation of the company, and for accounting to the public and regulators for the funds and resources of the company. The board of directors must also agree to corporate actions before shareholder voting takes place.
- corporate finance—the data and information of the corporate finance include the financial decisions of the corporation for managing investments, working capital, cash-on-hand, tax remittances, and the securities inventory to maximize the long-term value of the corporation as well as support the daily cash requirements of the operation.
Examples of corporate finance business dealings include the various activities with contra-parties and large corporations to support primary and secondary market transactions to maintain the appropriate cash balances and reserves, such as a repurchase resale agreement to raise overnight cash reserves.
The lowest level grouping within these is called subject areas of data.
A sampling of data subject areas that would typically be located within the data subcategories of operational, reference, and activity for corporate actions includes:
- corporate actions operational workflow
- shareholder registration operations
- dividend payment operations
- stock split issuance operations
- shareholder voting operations
- merger and acquisition operations
- divestiture operations
- corporate actions reference data
- investors/shareholders reference data
- corporate initiatives reference data
- market participants reference data
- corporate actions activity data
- shareholder registration
- dividend payment
- stock split issuance
- shareholder voting
- mergers and acquisitions
- divestitures
The properties of data subject areas are:
- stability of structure,
- encompasses all business information specifically within its scope,
- based upon business terminology and business concepts,
- manageable size for business stakeholders and IT staff,
- well-defined to achieve clear and unambiguous boundaries,
- creates distinctions among terms that could otherwise have multiple meanings,
- abstractions never obfuscate the true business meaning,
- organized to optimize ease of use,
- names and definitions demonstrate a consistent use of terminology, and
- compliant with the business data glossary.
The LDA has many use cases.
As examples, let’s consider the following:
- provides business context to all data,
- provides a rigorous taxonomy (aka business vocabulary) across all data,
- accelerates communication across business areas and with and across IT,
- acts as an accelerator to the majority of life cycles of the enterprise,
- software development life cycle,
- data centric life cycle,
- data governance life cycle,
- insourcing life cycle,
- outsourcing life cycle,
- merger and acquisition life cycle,
- divestiture life cycle,
- provides a business-oriented view into data governance,
- business data glossary,
- data ownership,
- business administered data access rights,
- organizes the conceptual data models as one per data subject area,
- drives database architectures,
- provides a framework for data warehousing,
- acts as an accelerator to object-oriented application architecture,
- forms the basis for a physical data architecture that identifies the physical location and ownership of data belonging to each category of data,
- maps to the business capability model, and
- teaches vast amounts of business knowledge to newly hired staff.
As a rough gauge to estimate the number of data subject areas to expect, a large enterprise, particularly a large financial conglomerate, may have an excess of 600 distinct subject areas of data. Of the total number of data subject areas, it is common for less than half to have automation associated with them.
Since the LDA is a business artifact, the best approach we have experienced is to train business users how to maintain and manage the LDA.
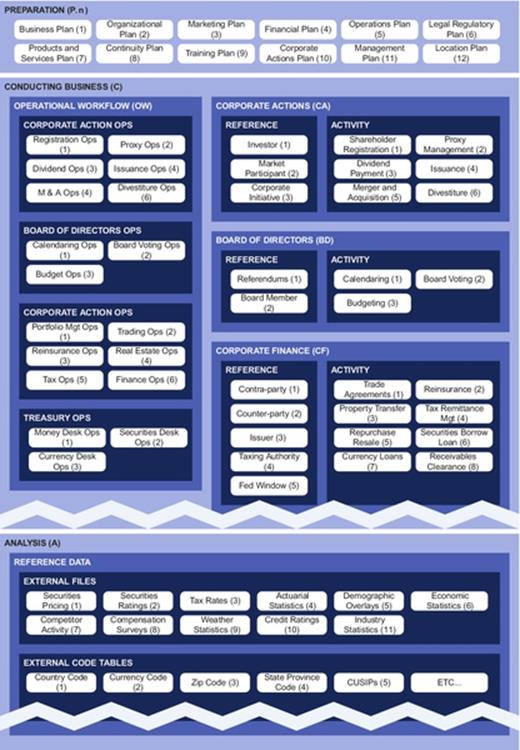
DIAGRAM Logical data architecture sample.
There will be departments that are the sole location across the enterprise that originate data for a given subject area of data. For these, data ownership and maintenance of the model are clear.
However, there will also be situations where multiple departments originate data for a given subject area of data. These situations will require information architecture to broker changes to data subject areas across the affected lines of business.
We live in a knowledge economy within which information is the currency. Having information with a clear understanding of its meaning allows us to operate more effectively across a large enterprise to facilitate informed decision making.
4.1.3 Data Governance
If you ask 10 different experts to define data governance, you are likely to get 11 different definitions.
Consider the following definitions:
- Data governance is a committee that convenes to prioritize what data-related initiatives should be funded, to make policies and rules, and to resolve issues among stakeholders.
- Data governance is an IT process that deploys technology to conduct data discovery and data quality initiatives.
- Data governance is a process that determines who can take what actions with what data, when, under what circumstances, using what methods.
- Data governance is the convergence of data management, data quality, data stewardship, data policies, and data security.
- Data governance is cultural shift away from thinking about data as a commodity toward thinking about data as a valuable asset class.
- Data governance is a cultural shift that treats data as an asset class realized through a data stewardship process that acts as a liaise between business and IT to define and organize business data from a business perspective standardizing the business vocabulary to facilitate communication and addressing the data-related needs of stakeholders across the enterprise.
While some of these definitions are notably better than others, none of these definitions can be held up as being completely accurate.
However, to begin to understand what data governance is more accurately, let’s first discuss what data governance is not and what it should not become for the well-being of the organization.
They are as follows:
- committee approach—organizations tend to form committees when they do not have a subject matter expert at a senior enough level to look out for the business interests of the enterprise.
Committees too frequently slow down the various data-related activities of the organization with bureaucracy in a struggle to establish the scope of their authority.
- IT owned process to determine authority over data—data must be governed by the business that is closest to where the particular subject of data originates.
Governing data from IT places those who understand the data and its business value the least in charge of it.
- process that determines data accountability—every category of data has a source, which is the only place that true data custodianship can pragmatically occur.
If we start by recognizing the natural areas of accountability that originate each category of data and then address the challenges that present themselves, we are on the correct path.
- convergence of many disciplines— data governance is responsible to determine the framework of architectural disciplines that comprise it and then integrate them in a manner that provides maximum business benefit.
The architectural disciplines that comprise data governance each require subject matter expertise associated with them.
- cultural shift—wholeheartedly data governance does require a cultural shift, although this is just part of what data governance is
The cultural shift is an important first step that serves to pave the way to achieve data governance within a large enterprise.
- The last definition listed was our own, and while it is not bad, it is still deficient.
The modern view of data governance is that it is an area of specialization within information architecture that is responsible for a framework of subordinate architectural disciplines to manage data and its associated metadata as an asset of the enterprise in a comprehensive manner.
It begins with understanding the business scope of the entire data landscape of an enterprise and then expands into the following:
- business data glossary—to provide a taxonomy to uniquely identify each data point in a manner similar to establishing unique identifiers for each financial account, staff member, or unit of property
- business owner—to identify the organizational unit or units that originate data for each category of data
- business metadata—to establish a clear understanding of each data point collect the important business information about data assets in a manner similar to that of establishing important information about financial transactions, staff members, and property
- stakeholders—business owners need to have a 360° view of stakeholders (e.g., legal compliance, financial compliance, HR compliance, auditing, CCO) and what is required to protect their interests
- determining the framework of component architectures—candidate architectural disciplines for a large enterprise include:
- data stewardship—the stewardship of data begins within the business areas that originate it,
- RDM—consists of three area of specialization,
– product master management—a form of code table management that focuses on code tables that are generated internally within the enterprise,
– code table management—a form of code table management that focuses on code tables that are generated outside the enterprise,
– external file management—a form of file management that focuses on files that are purchased externally for use across the enterprise,
- DIM architecture—management of the technologies that transport data,
– extract transform and load/extract load and transform (ETL/ELT) architecture—management of a class of batch tools that transport data,
– Enterprise service bus (ESB) architecture—management of a class of real-time tools that transport data,
– data virtualization architecture—management of a class of technologies that render data from disparate sources while hiding the details of their data types, data formats, and database structures,
– complex event processing (CEP) architecture—management of a class of rules engine that inspects DIM for patterns that may be useful to detect and act upon,
- semantic modeling architecture—management of a class of models that either illustrate the relationships data values have among themselves or more advanced models, such as those that depict the usage, sources, and destinations of data,
- data modeling architecture—management of a class of models that depict conceptual, logical, or physical characteristics for classes of data, and
- data obfuscation architecture—management of the technologies that mask and/or encrypt data as it is transported.
As we can see, the modern view of data governance shifts the role of data governance from IT to the business taking the lead utilizing IT to support its automation requirements, which are focused on empowering the business to govern one of its most valuable business assets.
Now that we have established a good appreciate of what data governance is and is not, let’s look briefly at the not insignificant path of how to get there, or at least some high-level milestones.
The first step toward achieving this modern view of data governance begins when IT finally recognizes that it lacks expert knowledge about the data they manage.
To business users who observe the condition of their data, data is lots of database columns with definitions that are systematically missing, incomplete, misleading, or ambiguous. When IT eventually understands what a real business definition is, then they have taken the first step.
Some of the distinctions about “customer” that IT will eventually understand include:
- customer—any individual or legal entity that has one or more agreements or contracts with the enterprise or has amounts on deposit with the enterprise, including any of its domestic or international affiliates, or for whose person, family members, or property, the enterprise or affiliate otherwise provides protection, or an administrative or other service.
A legal definition of “customer” was established by the US Congress within the Gramm-Leach-Bliley Act (GLBA) in 1999 for financial companies as it relates to the treatment of individual persons. Although insurance companies are state regulated, they must minimally comply with federal legislation, such as the GLBA.
First, the GLBA defines a “consumer” as “an individual who obtains, from a financial institution, financial products or services which are to be used primarily for personal, family, or household purposes, and also means the legal representative of such an individual.”
A “customer” is a “consumer” that has developed a relationship with privacy rights protected under the GLBA.
For example, a “customer” is not someone simply using an automated teller machine or having a check cashed at a cash advance business. These are not ongoing relationships with the “consumer,” as compared to when the “consumer” participates in a mortgage loan, tax return preparation, or line of credit.
Privacy rights protected under the GLBA require financial institutions to provide a privacy notice to customers that explain what information the company gathers about them, where this information is shared, and how the company safeguards that information. An official policy that addresses each of the three areas of information is a legal requirement for financial companies. The privacy notice containing this information must be given to the “consumer” prior to entering into an agreement to do business. Additionally, the GLBA also requires customer notification of their right to “opt-out” under the terms of The Fair Credit Reporting Act.
The law also requires that companies keep a record of all customer complaints as part of the books and records of the firm, which would be associated with the customer.
- prospective customer—an individual or legal entity that has never had and/or does not presently have a customer relationship with the enterprise
- former customer—an individual or legal entity that previously had a customer relationship with the enterprise
- the concept of customer within the confines of a particular database—such as the business concept of customer versus the database containing only customers who are residents of Canada, and
- beneficiary—an individual or legal entity that is designated as the heir, recipient, successor, or payee only within the context of a specific customer contract, policy, or other agreement
The second step toward achieving this modern view of data governance begins when IT recognizes that they cannot realistically govern something (i.e., business data) that they lack expert knowledge in. Similarly, it would be like business users thinking that they should be governing the company’s firewall architecture.
At this point, IT is then somewhat prepared to adopt the realization that it has an even more important role to play than governing business assets, and that is to transform itself to empower the individuals that have the knowledge to govern.
This means that control shifts away from IT back to business users, which is where it actually all began decades ago. In the beginning, business users sat side by side with IT resources. At that time, many data assets were still not automated and hence were under direct control of the business.
Initially, when IT slowly began to grow into the behemoth that it is today, the separation of business and IT did not manifest itself as a problem immediately as many of the early IT resources was nearly equally as fluent in the business as the result of working so closely with the people in the business. It was only when business knowledgeable IT resources became increasingly scarce as IT continued to grow and become increasingly distant from the business.
Hence, in the modern view, there are 10 basic areas of data governance that belong to the business as opposed to IT.
The 10 areas of business-driven data governance, which can incidentally be consolidated into a data governance portal, include:
- business data glossary,
- business data ownership,
- business administered data access rights,
- business designated data masking templates for data leaving production,
- business designated canned report access and distribution,
- business data stewardship,
- business-driven data discovery,
- business-driven semantic modeling,
- data governance and architecture registry for business and IT artifacts, and
- consolidated business metrics in a data governance dashboard.
The new role of IT for data governance is to render the technologies to support these 10 areas usable to business users.
4.1.3.1 Business Data Glossary Architecture
Prior to written language, there was only spoken language. Spoken language only ever occurred one individual time, that is, unless there was the rare experience of an echo, where the same words could be heard exactly as spoken a second time. During this extensive historical period prior to written language, story tellers roamed the land to tell their stories of historical events. When the Greek myths and legends were told by these story tellers, there would invariably be subtle differences in the stories. It was not until Homer wrote down a version of each Greek myth and legend, he encountered that the variances found in the telling of myths and legends could be brought under relative control.
When written language first emerged using the alphabet as we know it, terms were not controlled by their spelling. Instead, terms were phonetically spelled, and within the same documents, the spelling of the same phonetically spelled words could and often did vary.
Plato, when reflecting upon the oral culture that surrounded him, recognized that the preliterate masses lacked the ability to truly think in a structured way when he wrote, “They have no vivid in their souls.” Without written words to capture ideas in a firm medium, how could anyone understand the numerous and complex ideas of others to ponder and weigh in ones’ mind? This was not just the discovery of the self, but the thinking self.
Eventually, when Newton developed his theories involving force, time, and mass, there were no formal definitions of these terms available to him at that time. Newton used these terms with new purpose and gave them new and precise definition for the first time. Without precise definitions for the terms we use, there is little ability to communicate to others the exact meaning of what we think.
Today, the notion of thinking and the recorded word are hardly separable. The recorded word is the prerequisite to conscious thought as we understand it. We know the exact spelling or usage of most words we employ, we can look up their meaning, we know there are reference books that use these words from which we can gather information, and we can put our thoughts about that information into a recorded form using those words to share ideas with others, using books, articles, e-mails, film, or online videos.
Once recorded, thoughts are able to become detached from the speaker speaking them. Instead, the thoughts become attached to the words so that they may be shared with others to learn and understand, and share with still other individuals. Transitioning from the oral culture to the written one is a journey that begins with the notion of things represented by sounds to the written word where language can further develop. The journey then continues from words to taxonomies with specific meaning and from taxonomies to logic.
Also from writing came mathematics. Derived data is the result of mathematics where the sentences or formulas that define derived data must be recorded to convey their derivation and meaning. If we look at the progression it starts with the emergence of the first written language around 3200 BC, then money around 2500 BC, with the emergence of numbers necessarily having to be somewhere between those time periods.
Note: The origin of numbers is debated to be well after the emergence of money which seems to be an unsupportable argument no matter how many pints of mead (i.e., fermented honey beverage predating both wine and beer) one consumes.
Regardless of the type of industry or commerce, at the core of all business and commerce is data, consisting mostly of numbers. As an example, modern energy companies analyze streams of data using distributed sensors and high-speed communications to determine where it should drill for natural gas or oil. The data points of these sensors however have precise definitions that anyone who would use them needs to understand.
While the breadth of data can vary significantly in organizations, the larger the business, generally the more data there is. However, the most interesting fact is that most data within these large enterprises is not even being recorded though it can hold the key to significantly higher productivity and profitability. As an example, large amounts of data about operational workflow in large organizations are routinely not collected.
That said many organizations spend large sums of money managing what are perceived as their other valuable assets. People assets are well managed with a vast array of HR policies and processes, and similarly, financial and property assets have meticulous oversight and management, and are even insured where possible.
However, when it comes to arguably the most valuable asset of all, data, often just the basics are collected and then few of the protections that exist for people, finance, and property assets have analogous counterparts to manage it as a company asset.
Data can be found in many locations. It can be found in computers of various types, on paper in file cabinets, index cards in boxes, in smartphones, and in people’s heads. Regardless of where it is, it is the life blood of almost every enterprise. However, for it to be useful, someone has to know where to find it and they have to be able to understand what it means.
In a way, what is needed is for business management to take ownership and responsibility of data assets the same way that corporate officers take ownership and responsibility for financial assets. But what does this mean?
Consider a bank manager who must account for every penny of his branch’s transactions. While resources are dedicated to ensure that every financial account is completely accurate to the penny, comparatively few resources are spent to ensure the underlying data collected from each transaction is equally valid.
For example, the customer’s name, address, phone number, tax ID number, birth date, nationality, mother’s maiden name, and occupation are data that are collected for a purpose. Yet no matter how well the data services organization of the enterprise secures and protects the data, the concern for the validity of its content is of less importance.
While many business users generally believe that the ownership of data and information is the responsibility of IT, others have correctly zeroed in on the fact that responsibility for data cannot reside with those who do not originate the data. IT is simply responsible for the safekeeping of the data across the many files, databases, disks, tapes, and other storage media, and the technology that supports them.
In a comparable analogy, accountants are responsible for organizing and reporting financial data that have been provided to them. Even so, they are not responsible for the business decisions and activities that generated those financial numbers. Whether it involves financial accounting or data accounting, the responsibility for the accuracy and completeness of the finances and the data must reside with the business.
As such, when someone in the business buys or sells an asset, the accountant tracks the financial asset, its cost basis, depreciation, appreciation, accretion, and so on. The accountant is not responsible for the transaction or the gain or loss of assets that resulted. The accountant’s responsibility is to organize these calculations and tabulations, and then accurately report on these figures to management and the necessary regulatory bodies.
Similarly, IT reports on the data that it organizes and safeguards for the business. Like the accountants, IT is responsible for reporting on the data, although it is not responsible for the accuracy and completeness of the data provided them.
The primary focus of data that is collected in an enterprise is usually to support the particular business operation within the particular line of business. However, the usefulness of that data across various other parts of the organization can extend well beyond that particular line of business.
As examples, it could be useful for:
- opportunities to cross sell products and services to customers,
- new product development decisions,
- merger and acquisition decisions,
- divestiture decisions,
- marketing decisions,
- expansion decisions,
- corporate restructuring decisions, and
- budgeting decisions.
Hence, to be useful across these different areas, the parts of the organization that collect data need to be aware of the impact of capturing data in a nonchalant manner. This includes eliminating a few bad habits, such as typing any characters as values into required fields just to get to their next activity faster.
These types of habits create and support entire industries, such as the development of data quality products. In the end, however, the only ones that have a chance at figuring out the correct data is the business.
Let’s also consider the usefulness of business areas managing the business metadata for data that they originate.
If we consider the alternative, which is usually having a team of data modelers in IT enter hundreds and thousands of definitions for data points for which they are not the subject matter experts, we find that the usefulness of the resulting definitions can range significantly.
For example, a small portion of data modelers research each data point with business users or industry reference materials, while a larger portion of data modelers leave the definition blank or they simply repeat the name of the data point as part of its definition.
I can’t speak to how other people react, but when I see a data point name like “Coupon Rate,” it disturbs me to see a definition the likes of “A coupon rate is the rate of a coupon.”
In contrast, a data steward or other individual that has a thorough understanding of the business would provide a somewhat more useful definition.
4.1.3.1.1 Coupon Rate
Definition: A coupon rate of a financial instrument (e.g., bond, note or other fixed income security) is the amount of interest paid by the issuer of the financial instrument per year expressed as a percentage of the “principal amount” or “face value” of the security, to the holder of the security, which is usually paid twice per year.
Purpose: The coupon rate of a financial instrument participates in calculations that determine the market price and the rate of return of the financial instrument that bears the coupon.
Data format: Coupon rates are represented or quoted in either fractions of 32nds or decimal.
Data sensitivity: Coupon rates are not considered sensitive data as there are neither external regulatory restrictions nor internal policies that restrict its disclosure for competitive or proprietary reasons.
Business synonyms: “fixed income interest,” “coupon yield.”
Subject area of data: This data point is based within the business context of the data subject area named, “PRODUCT.”
The difference in usefulness to other business stakeholders and IT is simply remarkable. One approach actually costs the enterprise money to have a high-priced IT resource to perform data entry of content that is of no use to anyone, while another approach takes a less expensive subject matter expert to record knowledge that will be useful to mentor new staff and to convey the true business meaning of the data point to every stakeholder across the enterprise.
In fact, if we were to disclose a more complete set of useful business metadata that a business subject matter expert could record, we would consider recording the following business metadata characteristics:
- LDA data subject area,
- unique business data glossary name,
- business trustee for the data glossary field,
- business definition,
- business purpose and usage,
- format of the data,
- data sensitivity, such as confidential for customer privacy,
- specific regulatory or compliance rules that are deemed applicable,
- synonyms used in the industry,
- labels typically used in applications, forms, and reports,
- business processes that originate the data content,
- business area(s) and business processes that typically use, report, or analyze the data content,
- related business data glossary fields,
- source of the data in the business where the data point originates, or if calculated, what is the formula for its derivation,
- basic business data class (e.g., date, amount, quantity, rate) and required level of precision,
- whether the data point is sent to the general ledger (GL),
- whether the data point is sent to external organizations, such as regulatory bodies,
- mapping to external standards, such as ACORD and MISMO,
- complete or sample business values or domain values, and
- global variances in definition, such as with “personally identifying information” (PII) where the European Union includes small businesses as those that have an income under ten million Euros and less than 50 employees.
4.1.3.1.2 Identifying the Source of Data
Once the business has thoroughly defined a business data point, then it is the role of IT to work with the data steward to locate its sources from across the various production databases of the company. Each source will have its own profile for data quality (e.g., data sparseness, accuracy, numerical precision versus rounding, standardization of format and values, and segment of the business, such as pertaining only to Canadian business)
4.1.3.1.3 Extracting Data to a Landing Zone
Once the sources of data have been confirmed, it can be extracted into a landing zone, either a conventional landing zone or a low cost big data landing zone. The considerations here will involve the appropriate frequency with which data extracts to the landing zone need to occur, or whether a real-time feed from the production database will be required to stream data as it is written, or updated.
The answer to this will depend upon the real-time requirements, and to an extent, it will depend upon the degree of data cleansing, standardization, and integration that may ultimately be required before the data can be useful to a real-time business capability.
What’s important here is that the extraction stage provides valuable metadata to the business data glossary to communicate to the user which applications the data is available from, and the business assessment of the degree of reliability of the data from each source being reliable.
These types of metrics can provide guidance to stakeholders that may need the data to request additional services from IT to improve the quality of the data by enhancing the application software, provide monitoring and alerts on data quality, assist business users in viewing and correcting data, or request additional services from data stewards to develop training for business users to capture the information more reliably.
4.1.3.1.4 Data Profiling
Data profiling is mostly a consideration during the development process, but in some cases can continue into production. Once landed, the data can be analyzed so that specifications can be developed to perform data cleansing (aka scrubbing) on the data.
As data cleansing occurs, the original data should be retained partially for historical purposes and partially for the possibility of needing to reprocess the data if issues arose downstream that required corrections at this early stage of processing.
Once cleansed, the data is placed in the next layer of the landing zone, with statistics and metrics about the cleansing process being stored for display into the business data glossary.
4.1.3.1.5 Data Standardization
When even the same business data is sourced from different application databases, a number of issues tend to arise. The first issue that becomes apparent is that each application tends to use different codes and/or different data types for the same things, which is easy to remedy with a good RDM code tables initiative. The additional issues tend to demonstrate somewhat greater complexity, such as:
- values of a data point not having a one to one relationship with the corresponding data point in another system,
- values of a data point corresponding to domain values that are outside the domain values of the same data point in another system,
- values of a data point containing values that correspond to something that should have been a separate data point, but was incorrectly combined together.
As in each previous phase, the standardized data is placed in yet the next layer of the landing zone, with statistics and metrics about the standardization process being stored for display into the business data glossary.
4.1.3.1.6 Data Integration
Once standardized data is available, it is possible to prepare specifications for data integration. The ideal target state for data integration is one that closely resembles the conceptual data model that data stewards and business users develop for the particular data subject areas involved.
As in each previous phase, the integrated data is placed in yet the next layer of the landing zone, with statistics and metrics about the integration process being stored for display into the business data glossary.
These metrics can be far more comprehensive and can include for each data point the following:
- sparseness,
- reliability,
- mean,
- median,
- standard deviation,
- skew, and
- any other standard or proprietary calculation.
As for the usefulness of metrics such as sparseness and reliability, if a metric for a business data glossary entry indicates that data values are missing 30% of the time or have invalid values 10% of the time, then using that business data glossary data point to organize totals or subtotals may not be practical.
At this point, the integrated data can be stored within an operational data store (ODS) layer that mirrors the data subject areas of the LDA.
If the resulting ODS layer is too large and complex to support ad hoc joins using a standard relational database management system (DBMS), then one more step should be undertaken to migrate it into a high-performance analytical data base that can support real-time joins and analytics pertaining to one or more technologies associated with big data architecture.
The result has far reaching implications for the many stakeholders of business and IT. For the first time since automation, business will have taken back control of their data asset. In addition, the data with the highest priority to the business has meaningful definitions that can be communicated across the company.
4.1.3.1.7 Shopping Cart
The next step for the business data glossary is to make it go somewhere. In other words, let’s suppose the business data glossary was also a business data catalog for business users. A business user or stakeholder can look up the data points that they need to see in a report, confirm that the data points are in fact the correct ones based upon their business metadata, and then put them in a shopping basket for reporting.
Once the shopping cart contains everything the particular business user requires, then they can automatically get a list of existing reports that they can run from a mashup technology, or they can easily assemble their own report using a mashup technology.
The benefits from a business perspective are compelling, such as:
- the correct data points required by business can be identified in seconds as opposed to negotiating months with various IT resources,
- from this point forward the analysis to determine what applications to source the data is performed just once,
- from this point forward the development work to land the data from production is performed just once,
- from this point forward the analysis and programming to cleanse the data is performed just once,
- from this point forward reporting results no longer display inconsistencies that resulted from different rounding factors and data cleansing logic,
- from this point forward the analysis and programming to standardize the data is performed just once,
- as additional data points are sourced, cleansed, standardized, and integrated, they become permanently available to stakeholders,
- the speed with which new reports can be developed is a fraction of what it was previously,
- the cost of new reports to be developed is a fraction of what it was previously,
- the development effort that ties up resources to develop duplicate reports is eliminated,
- the costs associated with developing duplicate reports are eliminated,
- the licensing costs associated with a high-end mashup technology is a fraction of the costs associated with non-mashup technologies,
- the ability to gather metrics about data usage across the entire data landscape is facilitated by a high-end mashup technology,
- data masking for ad hoc reporting is automatically facilitated by a high-end mashup technology,
- a high-end mashup technology can source data from an HDFS and/or HBase environment, and
- a high-end mashup technology will support high-speed data streaming for critical real-time reporting, analysis, and alerting.
As is now apparent, a modern business data glossary places a great deal of knowledge about the data assets in the hands of the business. This allows business to make informed decisions about how to prioritize the activities of IT to address data-related issues that are of greatest priority to the business and reveals what data assets are available and their condition for use in business decision making where informed decisions are required.
As such, business data glossary architecture is the architectural discipline responsible for building the foundation for the data assets of the company. Standing on the foundation of an LDA, the business data glossary architecture has synergies with and impacts every area of the business as well as all of the other architectural disciplines within business and information systems architectures.
4.1.3.2 Data Ownership Architecture
The next valuable area associated with data governance is data ownership architecture. The foundation for data ownership is also the LDA. Using the LDA as a source that identifies all subject areas of data across the enterprise, each subject area is designated as being owned by the business department or business departments that originate the data for that topic of data.
The principle at work here is that the most appropriate individuals to act as custodians for a collection of data points are the individuals that are responsible for originating the data for those data points. The department head, or their designated data steward, would therefore act as the person managing responsibility for that portion of the data asset.
In our earlier discussion of LDA, we know that there are many business categories that data may be organized into.
As examples of this:
- when considering the data that is originated during business preparation, the owners are the company founders,
- when considering the data that pertains to any operational workflow while conducting business, this data is originated with the workflow inside the department whose workflow it is,
- when considering the business activity data while conducting business, this data is originated with the business users that perform the activity, such as the board of directors creating conducting corporate action activity, and
- when considering analysis activities, the data originates in the business area that conducts business intelligence.
However, not all data originates within the company, and therefore data ownership is at times external to the company. In fact, there are several situations when data is originated outside the company, such as “reference data.”
While not all reference data originates outside the company, such as the reference data of corporate initiatives and company bylaws associated with “corporate actions,” there is a considerable amount of information about many reference business subject areas of data that do originate from outside the company.
Examples of data that originates outside an enterprise include:
- customer data—which can be entered through a Web interface by the customer,
- distribution channel data—which can be entered through a Web interface by the distribution channel,
- shareholder data—which is provided via feeds from brokerage firms whose customers have acquired financial instruments in your enterprise,
- issuer data—provided from external feeds,
- vendors—which can be entered through a Web interface by the vendor,
- RDM code tables—which originate from various external authorities, such as the International Organization for Standardization (ISO) which originates many categories of data including country codes and currency codes, and
- RDM external files—which originate from various authorities and may include topics, such as economic data and demographic data.
When data originates externally, it is still important to designate one or more internal departments and data stewards to act as the custodian for those data assets within the enterprise. As an example, information architecture, reference data architecture, or the data governance area of data stewardship and their associated subject matter experts are good candidates to act as data custodians for data that is typically shared across the enterprise.
The role of a data owner should include:
- fiduciary responsibilities of the data assets that are “owned” by the particular department including the proper designation of business metadata,
- mentor department personnel in their role as “owners” of the particular class of data assets,
- liaise with the individuals that are stakeholders in the data “owned” by the department,
- understand the data quality-related issues affecting the data assets “owned” by the department and their impact upon other stakeholders,
- coordinate with IT to prioritize and remedy the business critical issues affecting the data assets “owned” by the department,
- facilitate the reporting needs of the department by coordinating with IT to source, cleanse, standardize, and integrate additional data points from production applications,
- convey to IT any reporting requirements in which their assistance is requested,
- with regard to sensitive data, administer access rights to the other departments across the enterprise based upon their functional need to know,
- coordinate to acquire from the appropriate authorities the necessary RDM code tables or external files by the enterprise
As such, data ownership architecture is the data governance-related architectural discipline responsible for the frameworks associated with determining data ownership and subsequent fiduciary responsibility over the data assets that are owned by the department.
4.1.3.3 Data Access Rights Architecture
Data access rights architecture, introduced in the data ownership architecture section just prior to this, is associated with data governance and continues the theme of business empowerment, particularly with respect to the data assets of the enterprise.
In the modern view of data governance, data access rights are determined by the data owner. The data owner is best defined as the department head or designated data steward for the department that originates the majority of data within a given data subject area. Once data has been designated as being owned by a particular data owner, then access rights can be administered according to the need for other departments and stakeholders to view sensitive data.
If the subject area of data that is “owned” by a department does not contain sensitive data, then all business departments across the enterprise would be given access to it.
Sensitive data, however, includes any data points that are subject to:
- regulatory restrictions, such as PII,
- promises made to customers or vendors regarding the privacy of their information, or
- company restrictions due to the value of the data from the perspective of a competitive advantage or generally held as confidential across the enterprise.
Once data has been restricted to a given set of departments that do not have a general need to have access to the data to perform their activities, there may still be an isolated role within a given department that does require access to sensitive data. When this occurs access can be granted to just that role within a given department so that the individual assigned to that role can access the data content to perform their job function.
Although many large companies tend not to administer role-level security within their LDAP security framework, role-level security can usually be provided as an additional layer around LDAP to provide for the few cases where role-level security is crucial.
As an additional layer of protection, data access rights architecture also provides “data access rights overrides” that can be administered by the legal and compliance departments of a company. Using this approach, legal, regulatory compliance, financial compliance, and HR compliance departments are provided the ability to override the access right designations of a data owner to further restrict access.
This is particularly important if one or more business owners fail to restrict access to departments that may expose the company unnecessarily to violations of regulatory requirements. In such circumstances, legal and compliance may focus on the categories of data that are deemed most sensitive from the perspective of either regulations or proprietary competitive concerns to provide a safety net for data accessibility.
Once access rights have been determined by business “owners,” it is useful for the architecture to render that information to any data virtualization layer that could mask data that a particular user is not permitted to access in an ad hoc or canned report.
It is also useful for architecture to render access right information to an ETL CASE tool to automatically identify sensitive data that should be routinely obfuscated when it leaves the safety of a production environment (see Section 4.1.3.4).
In our final example, it is also useful for the architecture to render access right information to either the file access layer or report dissemination layer of a document repository for controlling which individuals an already existing report may be retrieved by or disseminated to by another individual or automation system (see Section 4.1.3.5).
As such, data access rights architecture is the architectural discipline responsible for the frameworks associated with determining accessibility of business data in ad hoc reports, canned reports, or already existing cyclical reports, such as end of quarter or year-end reports. In contrast, access to the source databases themselves is controlled through a completely separate set of processes that control application access to production data, where user access is managed in the form of controlling access to the applications that in turn have access to data.
4.1.3.4 ETL Data Masking Architecture
ETL data masking architecture, a discipline associated with DIM architecture, was introduced in the data access rights architecture section just prior to this and is associated with data governance and continues the theme of business empowerment, particularly with respect to the data assets of the enterprise. Data masking is pertinent to ETL more than say other forms of DIM, such as ESB movement of data, because ETL is typically used to transport data out of a production environment, whereas ESBs and CEPs are almost never used to transport data past the production boundary.
ETL data masking architecture addresses the standards and frameworks associated with identifying and protecting sensitive data points that are within a production environment that are being transferred out of production into an less controlled environment.
Examples of less controlled environments of varying degrees include:
- QA test environments—which house business users for preproduction testing of applications,
- integration test—which houses IT and business personnel for the testing of various application or system components that have been brought together for testing,
- unit test—which houses IT developers for the testing of their individual software components.
One approach to automating ETL data masking is to leverage the business data glossary with its record of business metadata that includes data sensitivity with the mapping of the production sources of those data points, which should be recorded when data is extracted from production into the landing zone.
As control of the business definition of data transfers from IT to business, business analysts and IT should be busy identifying the sources of physical data that corresponds with the business view. It is then the responsibility of IT to record the database column names associated with the physical side of sourcing the data to support the business view.
Once these production data sources, which are comprised of production database table names and column names, have been linked to a sensitive data point in the business glossary, it is then reasonable to conclude that the production database table names and column names that provide that data contain sensitive data.
These database table names and column names are generally useful for all architectural disciplines associated with DIM architecture, as they all operate at the physical level with the names associated with the physical files and databases.
This is true for the following sources and DIM techniques:
- conventional database technologies,
- conventional file technologies,
- big data file technologies,
- big data database technologies,
- cloud data transfers,
- ESB data transmissions,
- FTP data transfers,
- XML and XBRL file transfers, and
- ETL data transmissions.
Essentially, if the data is leaving the protections of a secure production environment, sensitive data must be either masked or encrypted.
4.1.3.5 Canned Report Access Architecture
There are two general types of canned reports.
4.1.3.5.1 Canned Report with Variable Data
The first type of canned reports is standard reports that are run on demand. In this case, the format of the report is fixed and the data changes potentially up to the point in time when it is generated.
For example, if the user is running a canned report to list all staff members of the enterprise organized by department one day, they will get all of the staff members that were with the enterprise on that particular day. If they rerun the same report the next day, it will use the exact same queries and formatting, but it will include the new hires and will exclude the retirees, and all former employees.
The access rights for these reports are usually administered at the application level when the report is requested. If someone has access to the reporting application, then they can often run any report, such as any HR-related reports.
4.1.3.5.2 Canned Report with Fixed Data
The second type of canned reports is standard reports that are cyclical in nature, such as end of month, quarterly, or annual reports, where both their format and data content are frozen in time. When these reports are generated their output is typically stored as a PDF file in a document repository. These types of canned reports have access controls at the document repository level where access to a report is requested.
The first objective of canned report architecture is to facilitate a framework that makes it easy for any stakeholder across the enterprise to locate the canned report of interest.
The next objective of canned report access architecture is to develop the necessary standards and frameworks to centrally organize canned reports and map their content to the business data glossary so that requests for their subsequent access may be evaluated based upon the access rights as determined by the business owners of the content.
When access requests are denied, the framework may allow for either access to a redacted form of the same report or the creation of a request to either the business owner or business compliance to override a denial of access.
Depending upon the industry that an enterprise is in and the regulatory climate of that industry, canned report access architecture may additionally make use of technologies that can prevent attachment of documents to e-mails, or track the dissemination of canned reports across the IT landscape. This is typically accomplished by incorporating a traceable tag within the PDF file of the canned report.
4.1.3.6 Data Stewardship
Data stewardship in the modern view of data governance is also in line with the theme of business empowerment and data being managed as an asset class. There are many stakeholders that must be across the business with data quality as well as regulatory needs, especially for a global business.
With the volume and volatility of rules about data from regulatory requirements in every country and treaty zone, one of the most useful technologies for the data steward is clearly the “data governance” rules engine. A data governance rules engine focuses on the data quality of information being originated and passed to downstream consumers of that data.
The first advantage of a “data governance” rules engine is its ability to organize the numerous rules into a useful business ontology that begins with jurisdictions.
The jurisdictional level organization of rules consists of a flexible hierarchy of (1) Treaty Zone (e.g., European Union (EU), North America Free Trade Agreement (NAFTA), South Asian Free Trade Agreement (SAFTA), CommonMarket of the Southern Cone (Mercosur), and Andean Community (CAN)); (2) Country (e.g., South Korea, China); and (3) Administrative Levels, which in some situations may be further subdivided into increasingly local municipalities (e.g., US States, Counties, and Cities/Townships).
Note: The term “flexible hierarchy” refers to the fact that the hierarchy permits a parent of “None” or “All,” such as a country not associated with a Treaty Zone, or a Treaty Zone without a specific Country or Administrative Level being applicable.
The next level of organization is an authority document level, which embodies the conceptual requirement. The authority document organization of rules consists of a flexible hierarchy of:
- authority document name and authority document legislative identifier;
- authority document section name and authority document section identifier; and
- citation, which is the phrase within the section that cites the regulatory requirement in written language.
The level of organization following an authority document level is the data steward level, which embodies the logical requirement. The data steward level organization of rules consists of a flexible hierarchy of:
- business data glossary data points,
- business capabilities, and
- application systems.
The final level of organization is the business analyst level of organization, which embodies the physical requirement. The business analyst level of organization of rules consists of a flexible hierarchy of:
- database names/file names,
- database tables/file record types, and
- database columns/file field names from across the IT landscape.
Then there are the physical rules, which should be associated with these various levels of organization so that they may be traceable to the jurisdiction, authority document, data steward, and business analyst levels. The physical rules would generate alerts to the data stewards for the areas of the business in which they have responsibility. The data stewards would then work with their respective areas to address the violations detected by the physical rules.
The following approach recognizes the fact that the costs of addressing application-related issues are extremely high. These include the analysis, design, and implementation phases, followed by unit testing, integration testing, QA testing, and production turnover. The full life cycle engages quite a variety of technical services and a large number of individuals.
As a result, data stewardship should seriously consider the following five steps to capture and assess the alternatives for addressing the data governance issues identified to the data steward.
These steps include:
- identify potential manual and automated solutions for each data violation,
- capture estimates for the cost of implementing each,
- select the best solution based upon ROI,
- capture implementation lessons learned, and
- periodically review manually implemented solutions.
Identification of potential manual and automated solutions accepts proposals associated with the outstanding data governance issue. There is no particular limit to the number of proposals that may be associated with a data governance issue, but in general, the more ideas the better.
The capture of estimated resources required for each identifies the various parts of the organization that would have to participate to implement a specific proposal. Once identified, the proposal would be routed to these participants in the same sequence that implementation would have to occur. Once each participant reviews the proposal and records their estimates for the activities that they are responsible for, the proposal is routed to the next participant.
In the end, IT will have identified the applications and components that would require maintenance and the estimated costs associated with each. This approach helps to provide management and data stewards the type of business information that they will need to make an informed decision.
The selection of the solution based upon ROI consists of an automated workflow that illustrates the estimates provided by the participants of each proposed solution. At this point, the business can identify the business value associated with addressing the specific data governance issue, along with the level of perceived risk associated with each of the proposed solutions.
Once business value has been associated with the data governance issue and a level of risk has been associated with each proposed solution, the evaluation of ROI may be determined for each proposed solution.
This allows the business to select the particular proposal for implementation, which may simply consist of selecting one of the manual proposals, or it may consist of selecting an automated approach. However, regardless of whether a manual operational approach is selected, the automated approaches proposed should be evaluated and the most desirable of the automated proposals should be identified for future consideration.
If the business selects an automated approach, the selection of the proposed solution should include the evaluation of all pending automated proposals that are associated with the same applications and application components. If it is determined that several automated proposals should be combined within the life cycle of this implementation, then an additional round of estimates for a combined solution should be considered.
A new hybrid proposal requiring a combined round of estimates should consist of the identification of the various manual operational alternatives being decommissioned by the automated proposals being included within the life cycle of this implementation. The total cost of the combined implementation to be considered will be the new round of estimates from the various stakeholders for the implementation of the combined automated solution proposals with one pass of the life cycle, and the costs of removing the manual operational alternatives that have been implemented.
In simple terms, the total risk of the combined implementation to be considered will be the risks associated with the selected automation proposals versus the risks associated with the already implemented manual operational alternatives.
In the circumstance when application enhancements are being planned for reasons unrelated to addressing data governance issues, the data governance issues that have been implemented with manual operational alternatives should be considered for inclusion into the specifications of the application enhancements.
The capture of lessons learned from the implementation should consist of an assessment of the cost savings associated with:
- diverting automation to manual operational costs and
- subsequent batching of automation implementations into one pass of the software development life cycle (SDLC) to maintain applications and their associated components.
The uniqueness of the modern approach rests completely with the fact that it recognizes that the entire life cycle of application maintenance costs is extremely high and that manual operational alternatives should always be considered as an alternative either permanently or temporary. This should be considered at least until the particular area of the application would be undergoing maintenance for additional reasons so that requirements may be batched together.
The notion of a manual solution is one where the costs involved are for creating user training with periodic retraining built into the assumptions.
Also unique to the modern approach is the notion that solutions considered and adopted be recorded for future staff members if the same or similar data governance issue emerges in the future. Often the analysis performed is lost causing the resources to perform the same analysis over again without the advantage of learning the lessons from the past, as is what generally happens to those who ignore history.
One key aspect to the modern approach is the notion that automation change may be temporarily postponed until requirements may be batched into a more comprehensive set of requirements, thereby incurring the costs of the full life cycle only once as opposed to several times for smaller units of change.
As such, the role of a data steward requires a broad combination of knowledge and cumulative experience about the business of their area and its associated data quality and regulatory requirements.
4.1.3.7 Data Discovery Architecture
The data landscape of an enterprise consists of every file, database, document repository, and Big Data repository residing on every production server within every data center. As one can imagine, the inventory of database columns and fields that exist across these files and databases can easily number in the millions. In addition, the number of unstructured files and documents that exist on file servers, document repositories, and Big Data repositories can also number in the millions, consisting of hundreds of terabytes to petabytes and exabytes.
As we begin to appreciate the magnitude of our data landscape, it is important to consider the informational needs of business stakeholders, as well as regulatory responsibilities across the various jurisdictions, (e.g., treaty zones, countries, and the sub-country administrative levels) and LH requirements across these jurisdictions.
Considering that the only effective way to understand what each database column or field may be is to inspect the values of the data content for each, to approach this manually would be anything except cost effective. Therefore, the activity to develop a map to illustrate the company’s global data landscape requires a significant degree of automation beginning with data discovery capabilities.
Basic data discovery capabilities start by learning to recognize the parts of the data landscape that are well understood, and then they compare the data content of these understood parts of the data landscape with the many parts of the data landscape that are understood less or not understood at all. These data discovery capabilities then propose a map of related columns and fields from across the globe, saving countless man years of effort to conduct this first level of data analysis. The next step is to profile the data and inspect the data points that are related to it.
Data profiling capabilities help determine the qualities of the data content, including the qualities of the data content of the database columns and fields that are related to the columns and fields that are undergoing discovery. The complexity here cannot be overstated, as the data points undergoing discovery may contain data values corresponding to different business definitions.
As an example, if the database column undergoing discovery in some database contains the given name or surname of individuals, the appropriate business glossary field name for one database column could be employee name, employee spouse name, vendor contact name, customer name, conservator name, regulatory agency contact name, and beneficiary name depending upon the row or record number.
Under such circumstances, the only way to decipher the business meaning of a database column undergoing discovery is to analyze the data that is related to it. Depending upon the database design, there will be situations where the information necessary to decipher the business meaning will not be present in the database. Instead, the key to deciphering the information will be buried within application code that must be used to decode the meaning of the information contained within the database.
When this occurs, the effort is a lengthy manual effort requiring analysis of the application programs that access the data. That said, the process of data discovery is still greatly enhanced by data discovery and data automation.
As data is discovered and profiled, it is then classified based upon its usefulness for business intelligence, regulatory, and LH uses.
4.1.3.8 Semantic Modeling Architecture
There are many types of use cases for semantic modeling. Distinct from conceptual, logical, and physical data modeling, and process modeling, the conventions for semantic modeling can vary widely depending upon the particular use case and the objectives that are desired from each use case.
But first, let’s discuss what semantic modeling is. Some models illustrate the relationships that classes of data have with one another, such as this example where business concepts are hidden.
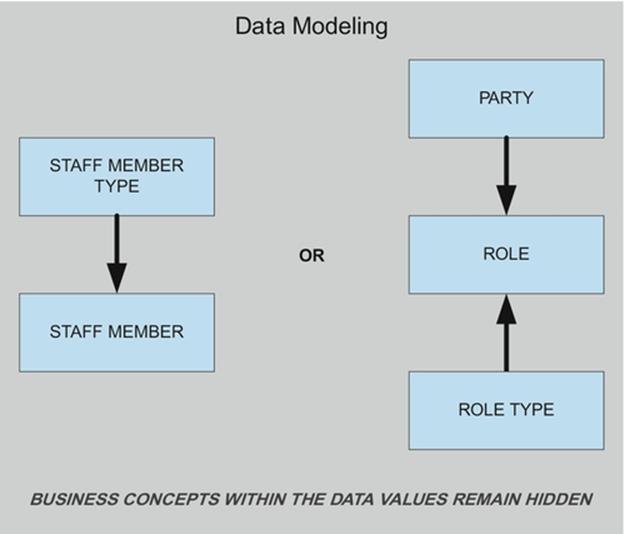
DIAGRAM Data modeling depicts entity relationships.
At its most basic, semantic modeling is used to depict the relationships that exist among specific values of data, such as the example below that models the same topic as the data modeling diagram above, but now focused on the values of the data and the relationship they have.
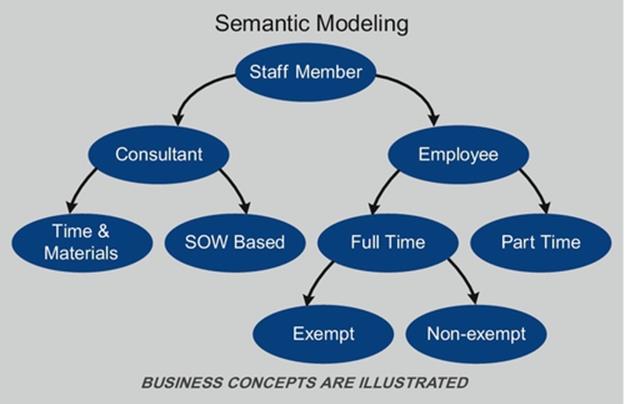
DIAGRAM Semantic modeling can depict data content relationships.
For example, a derivative security can have its various underlying securities graphically depicted in a semantic model to illustrate how the derivative was constructed and the constituent cash flows that determines its return.
Another example that may be applicable to a broader audience would be the distinction between social security numbers and tax ID numbers.
A complete semantic model in this domain would depict:
- social security number (SSN) as issued for an individual by the Social Security Administration,
- employer identification number (EIN) as issued for a business by the Internal Revenue Service,
- individual taxpayer identification number (ITIN) as issued for an individual that does not have, and is not eligible to obtain, a social security number, and is issued by the Internal Revenue Service,
- adoption taxpayer identification number (ATIN) as issued for a minor as a taxpayer identification number for pending U.S. adoptions by the Internal Revenue Service to allow the minor to be claimed as a legal deduction, but is not appropriate to have income reported against it; and
- preparer taxpayer identification number (PTIN) as issued for a tax preparer by the Internal Revenue Service to safeguard their true SSN or EIN, but is not appropriate to have income reported against it.
Similarly, examples of basic semantic models can be found in online thesaurus portals, where synonyms and their related terms are depicted with linkages to their other synonyms and related terms, which are themselves connected to their other synonyms and related terms.
Such basic use cases do not require much in the way of diagramming standards or procedural workflows. When semantic models are simple like this, it is easy to avoid creating unintended outcomes that can make diagrams overly complex and unusable.
At the other end of the spectrum are the advanced use cases, which typically have different categories of participants with particular roles that follow a customized set of modeling conventions consisting of diagramming techniques and naming conventions, with a well-defined operational workflow.
For example, the diagram below illustrates the life cycle of a country, the ISO standards organization process, and its associated metadata view. The ISO standard that identifies country is ISO 3166-1.
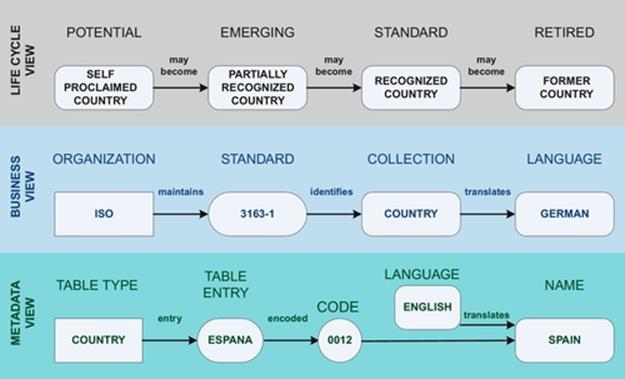
DIAGRAM Semantic models are extremely flexible and can also depict various types of concepts.
An example of an advanced use case would be business users depicting semantic models for business data points present on reports, relating them to business data glossary entries, with IT staff depicting semantic models of the physical data sources used to generate the data points on the same reports as a method to satisfy regulatory reporting requirements that mandate identification of data sources and their business meaning (e.g., pillars two and three of Solvency II).
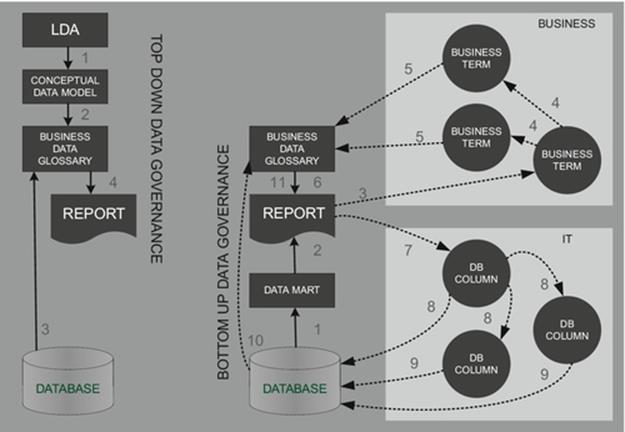
DIAGRAM Semantic models can depict workflows for data governance.
A semantic modeling architect requires a broad combination of knowledge and cumulative experience about business and data, as well as the use cases to be addressed with the aid of a semantic modeling approach. Perhaps most important, the semantic model must be a subject matter expert able to develop semantic modeling standards that are able to take advantage of the diagramming and reporting capabilities of the particular semantic technology to be chosen.
4.1.3.9 Architecture Governance Component Registry
A large global enterprise has architectural subject matter experts that span various architectural disciplines and solution architects that work with application development teams located in various countries around the world. The standards and frameworks created by the various enterprise architects must be accessible by the various solution architects without anyone knowing the name of the directory or document, and as we learn over and over again, there is no good way for anyone to organize documents into directories within document repositories that everyone will understand.
As many of us have seen, directory structures and naming conventions are simply not suitable for stakeholders that may have alternate terms for and ways of viewing the subject matter being stored, especially when considering the use of alternative languages.
To avoid the mass confusion so often caused by directory structures, the first place to start is to have just one place to store all documents. While this may seem odd at first, by eliminating the need to organize content into a confusing directory structure and then hope that stakeholders can guess the correct directory, we will have removed the first obstacle toward achieving a practical approach to document management.
Now we need to avoid the mass confusion so often caused by naming conventions that we have relied on in the past. Instead, let’s decide to rely upon a well-developed ontology that addresses the needs of the various stakeholders, which include:
- architects,
- project managers,
- application developers,
- legal,
- financial compliance,
- regulatory compliance,
- HR compliance,
- IT compliance,
- auditors,
- CFO,
- CIO,
- COO, and
- CEO.
The ontology of architecture standards and frameworks is relatively finite. It consists of a number of hierarchical taxonomies that include:
- architectural disciplines,
- business capabilities,
- departments that are accountable to adhere to standards,
- stakeholders across the organization whose interests that standards and frameworks protect,
- legislative jurisdictions and their associated legislation, and
- pertinent regulatory agencies.
As examples, the taxonomy of legislative jurisdictions consists of a top-down hierarchy of:
- treaty zone,
- country,
- subordinated municipalities,
- legislative acts,
- their sections, and
- citations.
However, a taxonomy of architectural disciplines may consist of a hierarchy as defined by the sections and subsections of this book.
Once the taxonomies of the architecture standards and frameworks ontology have been defined, the modern view of an architecture repository consists of handful of major capabilities, starting with an administrative capability to manage the taxonomies and their translation into a set of languages.
4.1.3.9.1 Administration
The objective of the administration function is to identify the various stakeholders and the taxonomies that can be applicable to an architectural standard or framework. The tags associated with each of the taxonomies must be carefully managed to include an easy to understand hierarchy of tags that can be associated with pertinent documents and then subsequently used to search with.
4.1.3.9.2 Document Development
The second major capability supports the document development. One of the objectives of standards and frameworks is to represent the interests of stakeholders from across the company by incorporating their interests into the standard and/or framework. By the time the standard or framework is to go through the approval process, the tags associated with the taxonomies will be incorporated into the document corresponding to the interests of each of its stakeholders.
For example, if the company is required to report customer applications for credit by a set of ethnic categories, then the collection of such ethnic categories becomes part of the standards and frameworks for credit application specifications uniformly across the particular jurisdiction.
4.1.3.9.3 Approval Process
The third major capability is the approval process. Here, the subject matter experts of related architectural disciplines would evaluate the document for completeness and accuracy. The final approval would come from the Chief Enterprise Architect.
4.1.3.9.4 Production Use
The fourth major capability supports locating the desired standards and/or frameworks document by using the tags that the particular stakeholder can relate to best. These tags may be viewed in the language of the stakeholder’s choice and will be translated into the tags associated with appropriate documents that have been stored in the architecture repository rendering those documents with an overlapping set of tags.
For example, a stakeholder knows that the document they are searching for belongs to a particular business capability within the company, and it must represent the interests of IT security and business compliance. Selection of these tags will render a list of all documents that have these tags associated with them, and then the stakeholder can either figure out which document is required by reading their descriptions or by providing a few more tags to further reduce the size of the returned set of standards and frameworks.
As such, the role of an architecture repository architect requires subject matter expertise in ontology and taxonomies, Big Data repository architecture, as well as the usage of standards and frameworks within and across a large organization.
4.1.3.10 Data Governance Dashboard
Given that data is a critical asset class of the company, data about the data and data about data governance can only contribute to better comprehending its condition and determine the priorities for improving it, protecting it, and managing it. The data governance dashboard is the focal point for determining and housing the metrics that help guide business decisions about data and data governance.
Useful metrics can be collected for better managing the capabilities associated with a business data glossary, data ownership, data access right administration, ETL data masking, canned report access, data stewardship, global data landscape data discovery, semantic modeling use cases, architecture component registry, and the sourcing of data from production, data scrubbing, data standardization, data integration, and rendering a useful ODS layer for business intelligence, data analytics, and management and regulatory reporting.
Within each of the abovementioned areas of data governance metrics can be used to continually improve upon the areas of data that are a priority to the business to better support its business strategy.
For example, data stewardship metrics can illustrate which applications and/or databases have the most numerous data quality and/or regulatory exceptions, and the trend that is associated with their remediation, such as the rate of increase or decrease of alerts being generated for the data steward.
4.1.4 Data Obfuscation Architecture
The scope of data obfuscation architecture includes business operations and nonproduction and production systems to protect business confidential and restricted data. This includes information about data subjects, such as customer and employee, and the ease with which access can be attained by unauthorized individuals.
This includes data obfuscation topics, such as:
- data access restrictions,
- data masking (mentioned previously with regard to ETL),
- data encryption,
- data at rest (DAR), and
- DIM, as well as
- protection of business communications.
This also includes third-party partners and vendors, who must contractually agree to provide the same level of compliancy and security that the company must adhere to.
Data obfuscation architecture ensures that all unnecessary copies of data will be purged, controls and processes must support separation of duties, and access rights require maintenance by the appropriate resources with oversight from:
- legal,
- financial compliance,
- regulatory compliance,
- HR compliance,
- IT compliance, and
- Auditing.
Data obfuscation architecture works to protect the interests of various business stakeholders and regulatory bodies by conducting internal audits across IT, as well as mentoring and coordinating other architectural disciplines to incorporate the standards and frameworks that address the needs of various stakeholders.
For example, with regard to the appropriate use of social security numbers, the following information can be viewed on the US Government GAO Web site (Use of Social Security Number is Widespread, GAO document number: GAO/T-HEHS-00-111, p. 7).
Federal laws, specifically the Internal Revenue Code and regulations governing the administration of the personal income tax system, require social security number to be disclosed in all reporting to the IRS. As a result, customers who receive income from corporations, and employees of corporations that are residents or maintain citizenship in the U.S., must disclose their social security number to facilitate compliance with federal law.
Federal laws that require their use for the statutory purposes regarding income reporting also place limitations on the use of social security number. Specifically, they stipulate that social security numbers are to be confidential with both civil and criminal penalties for unauthorized disclosure.
Although States are permitted by federal law to use social security numbers for broader purposes, such as for public assistance, owning a vehicle, or operating a vehicle, they are not permitted to disclose social security numbers without proper authorization from the individual, and some States have legislated that public assistance cannot be restricted to individuals that fail to provide a valid social security number.
Within the nongovernment sector, there are a few forms of external disclosure of social security numbers that are sanctioned, such as when sharing or requesting information with credit bureaus, or buying and/or selling social security numbers when those social security numbers were acquired legally from either public and nonpublic sources.
The entities that currently make use of social security numbers for purposes other than income reporting include: lawyers, debt collectors, private investigators, and automobile insurers, and placing additional restrictions on social security number use may reasonably hamper their ability to function.
In addition, the following information can be viewed on the US Government Web site (Social Security Online, SSA Publication No. 05-10093, October 2006, p. 1).
Victims of identity theft, domestic abuse, or other specified crimes can get new social security numbers, resulting in an individual having two social security numbers associated with them. As a result of this condition, a decision has to be made whether to support the possibility of a second social security number retiring the first number. Advice from experts indicates that while it may be important to support a second SSN, it is equally important to never link the first and second SSN together in any form that may be disseminated outside the organization, particularly over the phone by customer service.
The general challenges with social security number are that: SSN lacks checksum/check digit validation; with a billion possible numbers and a population of 300 million, the chance of entering someone else’s SSN is one in three; and an SSN is difficult to validate when it is not provided for employment purposes.
There are also additional restrictions regarding the appropriate use of social security numbers at the state level.
For example, California has the most restrictive legislation regarding the use of social security numbers. The following information can be viewed on the California State Government Web site (California Law Governing Use of the Social Security Number, The Law: Civil Code Section 1798.85, p. 1).
The State of California prohibits any public display or communication of an individual’s social security number, in any manner; use of SSN on any card that is required to access any products or services; transmission of SSN over the Internet without a secure connection or encryption; SSN to access an Internet Web site, unless also accompanied by another password or device; printing an individual’s SSN on any material mailed unless required by State or Federal law; and encoding SSN on any card or document, whether visual or otherwise.
The same legislation identifies the allowable uses of SSN as follows: permits SSN to be collected, used, or released as required by state or federal law; permits SSN to be used for internal verification or administrative purposes.
The role of data obfuscation architect requires subject matter expertise in data governance, data masking, data encryption, DAR and DIM, legal requirements, and the stakeholders across the company including the regulatory bodies whose interests must be represented.
4.1.5 Data Modeling Architecture
The traditional view of data modeling begins with logical data modeling. Logical data modeling is a part of the SDLC for application development and was intended to minimize data redundancy with a database design process known as normalization. It should not be confused with LDA which is a business artifact for organizing all data of the enterprise, regardless of whether it will participate in a database for automation.
The intended benefit of achieving minimal redundancy was that it would simplify application logic by only having to maintain the business values of a given database column in one database table, as opposed to having to write application code to maintain its values across multiple database tables.
4.1.5.1 Conceptual Data Models
The somewhat less traditional view of data modeling begins with conceptual data modeling. Conceptual data models utilize a standard system of symbols that form a formal, although uncomplicated language that communicates an abundance of knowledge about the information being modeled. This uncomplicated visual language is effective for communicating the business users’ view of the data they work with.
The system of symbols employed in conceptual data model borrows a number of the basic modeling constructs found in entity relationship diagrams (ERDs), containing entities, attributes, and relationships.
The characteristics of conceptual data models that are specific to it include the following:
- The objective of the model is to communicate business knowledge to any individuals who are unfamiliar to the business.
- The scope of the model is from the perspective of a business subject area of data, as opposed to the scope of an automation project, automation application, automation database, or automation interface.
- The names of the objects in the model are strictly restricted to language used within the business, excluding any and all technical terminology related to automation jargon.
- Diagramming conventions are that which emphasize what an individual can comfortably view and comprehend on an individual page.
- Business data points are simply associated with the data objects they would belong to and are not taken through the data engineering process called “normalization” to separate attributes into code tables.
- Data abstractions, such as referring to business objects in a more generic and general way, are not performed as they often lose the business intent and then become less recognizable to the business.
- Technical details, frequently found within ERDs, such as optionality and specific numerical cardinalities, are omitted.
The modern approach to conceptual data models is to incorporate them as a natural extension of the LDA. In fact, each conceptual data model should correspond to one business subject area of data and should be developed by business users who have been mentored by information architects to assist in the upkeep of the LDA.
4.1.5.2 Logical Data Models
Logical data models are more technical in nature and often represent the scope of the data for a particular automation effort or project. Logical data modeling belongs to the logical design phase as a data engineering step within the SDLC.
Logical data models also utilize a standard system of symbols that form a formal and rather uncomplicated language that communicates knowledge. That said, unlike an easy to read conceptual data model diagram, logical data models can look like the electronic schematics of your flat screen television and surround system.
The logical data model is effective however for communicating the designers’ view of the information to business analysts on application development teams and to database administrators who will perform the physical database design phase.
Once the business analysts confirm that the logical data model meets all of the data requirements, the database administrator is then free to perform the physical design phase.
The characteristics of logical data models that are specific to it include the following:
- objective of the model—to communicate to software developers a detailed form of data requirements to drive the database design,
- scope—is typically from the perspective of an automation project, automation application, automation database, or automation interface,
- names of the objects in the model—include technical terminology related to automation jargon, such as the use of the words (e.g., type, batch file, interface, and system control record),
- diagramming conventions—often require technical specialists that have been trained to work with “bill-of-material” structures and “subtypes,”
- business data points—are taken through the data engineering process called “normalization,”
- data abstractions—such as referring to business objects in a more generic and general way is a frequent practice,
- technical details—frequently found within ERDs, such as optionality and specific numerical cardinalities are required.
4.1.5.3 Normalization
Logical database design requires an engineering step called normalization. Normalization is a set of rules that, when represented in their original form as developed and presented by Ted Codd, are highly technical from a mathematical and engineering perspective. To spare the readers and author alike, we will simplify the presentation without losing the basic idea of each rule.
The starting point for data modeling is said to be a list of data points, often described as atomic data. The term “atomic” simply refers to the fact that each data point is an individual data item not consisting of any combination of data items.
As an example, address is not atomic because it consists of several component data items, whereas “address street name” is atomic.
The most important aspect about these atomic data points is that they must have accurate business definitions so that each of them may be well understood. Sample data and business rules should be analyzed during normalization to ensure that the data are understood. Hence, both the business meaning of the data and sample data values should be considered.
First Normal Form (1NF) identifies atomic data that must conform to the following:
The atomic data points in a collection of data points must:
- be associated with a single set of values that one would expect to encounter as only one occurrence of a thing.
For example, an occurrence of a bank account would have one “account open date,” “account number,” “account officer approval given name,” “account officer approval surname,” and “primary tax ID number.” It could not have two or more “account open date,” “account number,” “account officer approval given name,” “account officer approval surname,” and “primary tax ID number.”
- have no particular order or sequence for the data points in the collection.
Whatever order the atomic data items are specified in, there must be no business meaning or importance associated with that order.
- have no business meaning based on the sequence of the records that occur.
For example, the first three bank accounts that may exist have no business meaning relative to one another, as all three bank accounts are simply occurrences of three distinct bank accounts.
- have a set of business data points whose values identify a unique occurrence of said collection.
For example, “account number” will uniquely identify the collection of atomic data point values associated with it, such as the “account open date” and “account officer approval surname” are associated with the unique account occurrence.
The same “account number” cannot reappear as the unique identifier for the same or any other collection of data points about an account.
Second Normal Form (2NF) identifies data that is already in 1NF and additionally, the following:
The atomic data points in a collection of data points must:
- have no dependency on just part of the business data points that uniquely identify each record occurrence.
If only one business data point uniquely identifies a record occurrence, then the collection is automatically in 2NF. If multiple atomic data points are needed to uniquely identify a record, then every atomic data point that is not among the unique identifiers must be dependent upon all of the business data points that uniquely identify a record.
When dependencies exist on a subset of the data points that uniquely identify a record, then those data points must be separated into their own collection of data points with the subset of data points that uniquely identify a record to be in 2NF.
For example, a product price cannot be in 2NF with the data points of “account number” and “product code” as their unique business identifiers because “product price” is only dependent on “product code.”
Third Normal Form (3NF) identifies data that are already in 2NF and additionally, the following:
The atomic data points in a collection of data points must:
- have no dependency on any other data point that is not among the data points that uniquely identify a record.
When dependencies exist on any other nonidentifying data point, then those data points must be separated into their own collection of data points with the subset of data points that uniquely identify a record to be in 3NF.
For example, a product price cannot be in 3NF if it has a dependency on another data point, such as “repricing date” and be in 3NF. If the dependency exists, then the “product price” and the “repricing date” must be separated into its own collection to be in 3NF.
Often just the first three rules of normalization are performed, and very few people know that there are more than four rules of normalization. However, just to provide an easy way to remember all seven rules of normalization, they are as follows:
- 1NF Remove Repeating Fields or Groups
- 2NF Remove Non-Key Fields Dependent Upon Any Part of the Prime Key
- 3NF Remove Non-Key Fields Dependent Upon Other Non-Key Fields
- 4NF Remove Independent Multi-Valued Fields (i.e., multiple hobbies from a student record)
- 5NF Remove Associated Multi-Valued Fields (i.e., a teacher and student from a class record)
- 6NF Remove Fields Associated With Different Contexts (i.e., process, business)
- 7NF Remove Fields With Differing Security Levels
Additional Notes:
- Domain Key Normal Form (DKNF) a competing 6th NF
- Boyce Codd (BCNF) is a stricter 3rd NF
We should mention that 7NF is our personal favorite, probably because it is so obscure. In 7NF, data points that are associated with different security levels must be separated out into distinct sets such that there is uniformity of security levels within a given collection.
Seventh normal form is generally no longer required with the emergence of advanced data encryption technologies that are available in modern DBMSs and data communications hardware and software. It was developed out of a concern that someone would be able to access data points that were unclassified, but which were commingled with data points that were classified within the same collection. Even though the application program could have prevented the display or reporting of the classified data points, the concern was that someone could crash the machine and then the classified data points could be found within the dump of core memory from the crash.
4.1.5.4 Weaknesses of Normalization
There are two significant flaws of the normalization process. An easy way to understand these two flaws is through the following true story, where one of the most prominent Wall Street firms sent me to an excellent vendor administered course:
A class of 20 students had just completed a 4-day course in logical data modeling, where they learned the rules of normalization and the fact that these rules were part of a software engineering process that was based upon a sound mathematical foundation developed by Ted Codd—someone I would become friends with a decade later.
After having taken the same 4-day course in data modeling and normalization, 20 newly and rather well-trained data modelers sat at separate desks in the same classroom with ample space between each student.
In the afternoon of the final day, each student was given the same single page of “business requirements” describing an area of the business that needed automation and it needed a database for its data. All students were uniformly given the same number of hours to develop the logical data model that would support the requirements provided.
During the exercise, the students were allowed to ask questions of the instructor, but they did not have many questions as the exercise was so simple.
At the conclusion of the 2-hour exercise, the data models of all 20 students were collected and 20 copies were made of each of the data models collected from the students. Each student was then provided a copy of the data model developed by each student.
Upon reviewing the 20 data models, it was discovered that 20 different data models were developed from the same business requirements from 20 individuals that were uniformly trained.
The data model diagrams were simply not the same with merely synonyms of the terms, but instead, the models themselves, including the number of business objects, could not be made to match no matter how the entities were rearranged on the page.
We don’t know what the reader thinks, but this doesn’t sound like an “engineering process” to this author. Given this true story, it becomes readily understandable why so many people consider data modeling an art form as opposed to a science. However, they are wrong; data modeling is not an art form and we will explain why.
First, let’s list all of the explanations that the students gave for their data models being different from one another.
The reasons offered included:
- each logical data model hypothetically supported the data needs to different degrees at the onset when the application would be initially developed,
- each logical data model hypothetically supported the data needs to different degrees into the future,
- each student interpreted the requirements differently,
- each student had different definitions of the data points provided,
- each student incorporated their varying degrees of knowledge about the business domain into the logical data model, and
- none of the students could follow instructions (this one was offered by the instructor).
If you were paying close attention you already know one of the two flaws of normalization. The first issue is that we already know that it is critical for data fields to have accurate business definitions so that each of them could be well understood. If the definition of a data field differs from one individual to the next, then its relationship to other data fields is likely to be different as well.
The students got this correct on their fourth point, “each student had different definitions of the data points provided.”
What they didn’t see, and what the instructor did not see, was that if the students were also provided a business data glossary complete with business metadata, they still would have had different logical data models, although the degree of variability would have been less, and from logical data modeling courses that we’ve taught, some of the models will come out identical or near identical.
However, there is one additional contributing factor that fundamentally plagues the normalization process, and it is called abstraction (aka generalization), where we have to consider how the brain works and how we learn.
4.1.5.5 Abstraction
Abstraction is the process by which we simplify the world around us. We take a collection of concepts and we chunk them together into a single concept, which makes it easier for us to think about things.
For a basic example, when we learn to drive, we learn to stop at the specific stop signs and red traffic lights along the route that the driving instructor takes us. We automatically abstract these stop signs and traffic lights into a single concept, so that we don’t have to learn to stop at stop signs and traffic lights every time we encounter a new one.
In any form of modeling, such as logical data modeling, we encounter a variety of objects.
As examples, these may include:
- the company that owns a chain of sandwich shops, whose CEO is John, and President is Bob,
- its investors, including Joe and Rajiv,
- its customers, including Jean and Ted,
- its staff, such as Malcolm the sales clerk and Jim the sandwich maker, and
- Hank the driver of the truck that delivers bagels from the local bakery and Frank the driver that delivers milk from the dairy farm.
Depending upon the individual, these objects can be abstracted in several ways, such as the following:
- John, Bob, Joe, Rajiv, Jean, Ted, Malcolm, Jim, Hank, and Frank—representing the least abstraction possible,
- franchise owner, vendor, investor, staff, customer, and vendor contact—
- franchise owner, vendor, investor, customer, and staff—“vendor” representing the person from the vendor that represents a point of contact,
- franchise owner, vendor, and individual—“individual” representing investors, customers, and staff,
- company and individual—all companies can be abstracted together and all individuals can be abstracted together,
- party—all companies and individuals can simply be referred to as one concept.
We find through various sessions with logical data modelers, and anyone doing modeling, that the way in which concepts are abstracted or generalized contributes to significant differences in the way models are conceptualized in people’s minds.
This does not mean that the rules of normalization are wrong, and it does not mean that they are an art form. What it does mean, however, is that the rules of normalization by themselves are incomplete.
As a result, to avoid the inconsistency found among data models, the rules of normalization must be preceded by the rules of data abstraction.
4.1.5.6 Rules of Data Abstraction
The rules of abstraction completely invalidate the arbitrary grouping of data points into collections based upon an individual’s way of viewing the world. As such, the first step of normalization does not make any sense until after the rules of abstraction have been applied.
For ease of use, we will refer to the data points whose combination forms a unique identifier for a record as the “primary key” and collections of data points as “business objects.”
The rules of abstraction are as follows:
- First Abstract Form (1AF) [synonyms] identifies business concepts for collections of data points (aka business objects) that must conform to the following constraints:
Business object synonyms that share the same business definition should be abstracted together into the term that is most commonly used by business.
For example, if the business definitions for “client” and “customer” are identical, then they can be combined into the business object referred to as “customer.” If however the definitions differ, then the individual concepts cannot be merged together.
Second Abstract Form (2AF) [time dependence] identifies a business object that is already in 1AF and additionally the following constraints:
Business objects that represent the same underlying business object at different points in time, such as business objects that follow a life cycle, when sharing the same primary key data points should be combined.
For example, “applicant,” “customer,” and “deceased customer” share the same primary key data points and should be combined into the business object referred to as “customer.”
If however they do not share the same primary key, such as “direct mailing prospect” and “customer,” where “direct mailing prospect” has a primary key of name and address, and “customer” has a primary key of home telephone number, then the concept of “prospect” and “customer” cannot be combined.
- Third Abstract Form (3AF) [essential dependence] identifies a business object that is already in 2AF and additionally the following constraints:
Business objects that have different business definitions that are uniquely identified by the same primary key data points should be combined into the term that is most common for the joint collection of business objects.
For example, a long-term treasury and a common stock have different business definitions but both uniquely identify their occurrences by a CUSIP number. Therefore, these two business objects should be combined into the business object referred to as “financial security” or “financial product.”
- Fourth Abstract Form (4AF) [accidental dependence] identifies a business object that is already in 3AF and additionally, the following constraints:
Business objects that combine other concepts that do not share the same set of business data points to uniquely identify them must be separated into their discrete individual business objects.
For example, “vendor contact” and “customer” cannot be combined into “party” as they do not represent an appropriate abstraction. The primary key data points for a vendor contact involve the contact’s work address, work phone number, and business tax ID, while the primary key data points for the customer involve the customer’s home address, home phone number, and social security number. These are clearly not the same business identifier.
4.1.5.7 Class Words
Another important note about abstraction applies to class words in logical data modeling. Class words are the terms added onto the end of the name of a data point (aka attribute) to indicate the type of data point it is, such as:
- quantity
- amount,
- price,
- frequency,
- percent,
- indicator,
- date,
- rate,
- rank,
- score,
- grade,
- name,
- code and
- description.
Some logical data modeling engineers choose to abstract class words into a simple set of class words, such as:
- number,
- text,
- alphanumeric,
- date, and
- code.
It should be noted, however, that like any vocabulary, the greater the number of distinct class words, the more useful it is for understanding what the data point actually is.
For example, the class word number reveals very little about a data point, whereas the following numerical class words reveal much:
- quantity—the number of things there are of a particular unit,
- amount—the number of things there are in a particular currency,
- price—the exchange rate of a thing as stated in a particular currency for trade,
- frequency—the number of events of something over a specific period of time,
- percent—the ratio of a thing relative to a hundred,
- dateyyyymmdd—the full year, month, day,
- dateyymm—the year and month,
- datetime—the full year, month, day, and time potentially to thousandths of a second,
- rate—the velocity of a thing in quantity per unit of time,
- rank—a number indicating the relative standing within a finite set of occurrences,
- score—the result of an assessment, usually regarding performance, or proficiency in a discipline of knowledge, which may be raw, weighted, and/or scaled to a mathematical function or model, and
- grade—an assessment based upon one or more scores and type of scores that may precede an assigned grade indicating a level of overall performance and proficiency.
4.1.5.8 Logical Data Modeling Summary
Hence, the modern approach to data modeling differs in four important ways:
- First, a business data glossary establishes the appropriate business definitions for data points before data modeling activities can begin.
- This includes business metadata that is defined by business users stated earlier so that a consistent and accurate definition can be understood by all “parties” involved.
- Second, the use of the LDA.
- The LDA provides the necessary business context within which to understand any given data point. Additionally, the conceptual data models that depict the data subject areas in more detail can provide a valuable source of related data points and any already known business object names.
- Third, rules of abstraction provide a necessary method that transforms data modeling into an engineering discipline.
- Although many enterprises have assembled teams of artists, it is important that they instead assemble teams of information engineers so that models contain properly abstracted business objects that create logical data models that have a high degree of consistency and stability over time.
- The more representative and well formed a logical data model is, the less complex an application has to be in order to interpret and maintain the business data.
- Fourth, class words are employed to convey the most information possible as opposed to being employed to require the least amount of effort possible to assign.
4.1.5.9 Physical Data Models
Physical data models are the most technical of all the data models, and of the various entrance criteria that is associated with it before it can begin, the most important is the transaction path analysis (TAPA).
Physical database design is a set of tasks performed by the data base administrator (DBA) that requires an in-depth knowledge of the specific DBMS product and the physical environment of the database to determine the appropriate physical database structures and parameters that can best satisfy database performance requirements for one or more applications.
A DBA knowledge of the DBMS is analogous of a doctor’s knowledge of medicine, and hence the patient that the DBA must analyze is the application programming.
The TAPA is analogous to the patient. The information that the DBA requires is information about the application because that is what will suffer if the physical database design is inappropriate.
The role of each of TAPA workbook is to concisely consolidate the various aspects of an application that the DBA needs to understand in order to competently perform their responsibilities.
The first two TAPA workbooks, “TAPA 01 Significant Transactions” and “TAPA 02 SQL Data Services,” support the first step of the physical design process called “denormalization,” which is an approach that trades improved performance for additional storage by replicating information in strategic ways.
Denormalization—can only be performed after “normalization,” which is a step performed during the logical design. “Normalization” is a set of rules, where the completion of each rule reduces the presence of data redundancy to save space, while “denormalization” is a set of techniques that cautiously increase data redundancy to meet performance-related service-level agreements.
The valid types of denormalization are: (a) column denormalization, (b) table collapsing, (c) horizontal partitioning, and (d) vertical partitioning. All forms of denormalization share a common characteristic, in that each one causes the further redundancy of data in a calculated manner to improve performance for those transactions that require their performance to be enhanced.
The transactions usually evaluated are those that are performed most frequently, for both retrieval and update, as updates are always impacted adversely by denormalization, while retrievals are sometimes impacted favorably. Hence, denormalization cannot be performed without knowledge of how selected transactions act upon the data, any more than one can realistically provide an answer, without first knowing the question.
To truly appreciate what denormalization is, it is equally important to appreciate what it is not. As such, the goal of denormalization is not to enhance the clarity of a database design; foster an understanding of complex data structures; or reorganize, redesign, restructure, or reabstract a poorly designed data model. In contrast, these abovementioned activities are the indicators of a poor database design.
The “TAPA 03 SIGNIFICANT TRANSACTION DB TABLE USE” workbook identifies the sequence of lock placement and escalation, which is used to alert the DBA to the possibility and likelihood of potential deadlocking problems.
Deadlocks—when two transactions place or escalate locks on resources they share and acquire in opposing sequences, they inadvertently create a condition where each waits on one other to release their locks. When the DBMS detects that a deadlock has occurred, the only course of action available to it is to terminate one of the waiting transactions.
When deadlocks occur in rare or isolated circumstances, the approach of automatic termination and restart may go virtually unnoticed. However, when the circumstances for deadlocks are not so rare or isolated, as the number of users increase the DBMS can become surprisingly preoccupied with the overhead of terminating and restarting an ever-increasing number of transactions that never seem to complete, eventually overwhelming the available resources.
Although deadlocks can also stem from within transactions that are not high volume, complex, long running, or memory intensive, these deadlocks will occur in rare and isolated circumstances such that the automatic detection mechanisms of the DBMS can manage them.
The fourth TAPA workbook, “TAPA 04 DATABASE TABLES,” helps the DBA determine database sizing and archiving requirements by identifying average row sizes, initial data volume, growth rates, data retention periods, and other aspects that have a “table” focus.
“TAPA 05 DATABASE USER AVAILABILITY” identifies the database availability profile for the users’ online and batch business processing, “TAPA 06 DATABASE PROCESSING VOLUME PROFILE” identifies the processing profile for the time of day and periods of the calendar, and “TAPA 07 DATABASE PERFORMANCE SLA” identifies the service-level requirements of the application. Together, these three TAPA forms help the DBA determine the databases that can be colocated on a server or load balanced cluster.
The last TAPA workbook, “TAPA 08 DATABASE INSTANCES,” identifies the various requirements for database instances in development, test, quality assurance, production, and production failover environments, such as size, access privileges, and firewall ports, and identifies databases that must share availability, high-level ETL requirements, and database backup and maintenance windows.
In order to provide the DBA the opportunity to perform their responsibilities, the DBA will need to understand the information that is organized into these TAPA workbooks. Each TAPA workbook encompasses its particular aspect of physical database design that helps ensure a high-quality product to support the various needs of the organization.
Each TAPA workbook is an integral part of the documentation capturing the physical database design requirements of the database used by the DBA to effectively support the various service-level agreements of the application.
To maintain the database SLA over the longer term, changes in the application and database will be routinely reflected in the corresponding TAPA as a part of the approval process for migration of each production release.
The data modeling department(s) of a large enterprise are at the heart of an organization IT automation capabilities. It is the single most critical function in any organization, as it can do the most damage long term to an enterprise’s ability to understand its data assets.
That said, many large enterprises still operate under the old view of architecture and do not manage their logical and physical data modeling activities to the engineering level commensurate with treated data as a valuable asset class. In fact, the majority of large organizations neither adhere to rules of abstraction in their logical data modeling activities nor adhere to performing TAPAs in their physical data modeling activities.
The role of the data modeling architecture subject matter expert is to ensure that the appropriate standards and frameworks are addressed across the enterprise that treat data in its proper place as a valuable asset class across the enterprise.
4.1.6 RDM—Product Master Management
Given the growth strategy of corporate acquisition, it can be surprising how many products and services a large enterprise can accumulate, even from an individual acquisition. It is even common for large conglomerates to have a number of acquisitions and divestitures through the course of each year across the various countries in which they operate.
Additionally, it is also relatively common for a large enterprise to introduce new products and services through their new product development process, as well as to decommission products and services as a normal activity. As a result, it is often difficult to determine to accurately know at any point in time the products and services that are offered in each jurisdiction globally.
The compilation of an accurate inventory of the products and services offered by the company within each jurisdiction has business value to a number of stakeholders, such as sales and marketing, legal and compliance, accounting, product development, merger and acquisitions, executive management, as well as enterprise architecture.
The RDM subject matter expert coordinates the collection of product master management across the enterprise. They establish the relationships to the various stakeholders that have business needs for the information about products and services, and they frequently have access to every department of the company globally through data stewards and the application development teams within every country supporting them.
As examples, the business metadata for a product or service should include:
- jurisdictions where the product is being offered,
- original date when the product or service was offered within each jurisdiction,
- date when the product or service was no longer offered within each jurisdiction,
- product name within each jurisdiction,
- global product name,
- product description,
- the merger or acquisition that the product or service stems from, or the product development team that created the product,
- jurisdictions where the product was offered prior to a merger or acquisition,
- regulatory bodies that govern the sale and distribution of the product or service,
- distribution channels that are permitted to offer the product or service, and
- GL account that the product or service rolls up into.
The modern approach to enterprise architecture recognizes that each stakeholder of product and service master data most likely has a product hierarchy distinct to their business perspective to support their business needs. Once the business metadata has been determined, the RDM subject matter expert should record the product or service within the various product type hierarchies.
Examples of stakeholders with distinct product type hierarchies include:
- sales and marketing,
- accounting,
- auditing,
- financial business compliance,
- legal business compliance, and
- product servicing organizations.
4.1.7 RDM—Code Tables Management
The automation associated with various lines of business and the various business capabilities across a large enterprise frequently makes use of different codes that are intended to mean the same things, such as country codes, local jurisdiction codes, currency codes, language codes, and identifiers of legislation and regulator directives.
For example, country codes across different applications may use:
- two character International Organization for Standardization (ISO) codes,
- three character ISO codes,
- World Intellectual Property Organization (WIPO) two character country codes,
- telephone international country codes, or
- internally grown set of country codes.
Centralized code table management is an approach to improve the accuracy and consistency of codes across application systems and business stakeholders globally, and its business value is high.
In the absence of centralized code table management, applications frequently have code tables that are out of date creating adverse downstream effects on reporting that cause the organization to perform the same work over and over again.
BI reporting seeks to organize business activity from across many applications. Depending on where these applications were originally developed, and when they were developed, the codes used for their code tables will undoubtedly be a good degree of inconsistency across the application landscape. As data moves, however, from its origins to the various stages through its life cycle, its codes must sometimes be adjusted to match the target systems that serve as stops along the journey.
Data often moves from front office systems to back office systems as well as to reporting systems often referred to as middle office systems. When data moves into an ODS or data warehouse (DW), its codes are typically standardized to those being used in the particular ODS or data warehouse. As additional operational data stores and data warehouses are developed, the same types of standardization processes are conducted to comply with the code standards of the particular target database.
An RDM subject matter expert focused on codes tables in a large enterprise can easily identify well over a hundred externally acquired code tables that are purchased frequently redundantly across the enterprise. Once inventoried and coordinated, code table purchases can be centralized and notices of their updates can be passed to the areas that consume them for timely deployment. In fact, each code table has a life cycle.
For example, an emerging country may declare itself to the global community, and then gradually other countries begin to observe the new country until the country in which your company is headquartered recognizes it. Likewise, the former country becomes decommissioned.
The business capabilities of code table management include:
- adopting support for newly identified code tables being used in applications,
- adding support for a new code table,
- management of the contents associated with each code table,
- notification of code table changes to stakeholders,
- coordinating the adoption of new code tables and code table contents with stakeholders,
- dissemination of code tables and their corresponding updates to the various stakeholders, and
- the collection of metrics associated with the code table management process as well as with the adoption of code table updates across the data landscape.
The primary difference between the discipline of code table management and product master management is that code table management’s first priority are the code tables that associated with external authorities outside the enterprise as well as internal codes for many organizations, especially those involved in manufacturing.
A more advanced form of code table management would seek to deliver analytical software that would scan application databases and application code to estimate and facilitate the adoption of a standard code table.
4.1.8 RDM—External Files Management
The discipline of RDM with regard to external files is similar to that of code tables in that there are files that may be routinely purchased by the enterprise from various external organizations.
These types of authorities are far greater in number than authorities for code tables, which is often limited to standards organizations, and often include:
- treaty zones—(e.g., EU),
- federal governments and associated state governments—national governments and their subdivisions,
- quasi-government agencies,
- industry groups,
- company that originates and sells its data,
- data reseller that gathers data external to itself and then resells it,
- international organizations,
- nonprofit organizations.
A small portion of examples of authorities include:
- A.M. Best,
- Bank of Canada,
- Bank of England,
- Dun & Bradstreet,
- Equifax,
- Experian,
- Fitch,
- Moody’s,
- Morningstar, and
- United Nations.
External files RDM are distinct in the following ways:
They generally have a much greater:
- frequency of files,
- number of data points per record, and
- number of records per file.
The external files portion of RDM primarily supports business departments such as marketing, investments, and risk management.
4.1.9 Data in Motion Architecture
DIM architecture encompasses a handful of disciplines pertaining to the movement of data, including:
- data virtualization architecture,
- high-speed data streaming,
- ETL architecture—ETL and ELT,
- ESB architecture—enterprise service bus,
- CEP architecture—complex event architecture, and
- technologies such as rules engines, FTP, and XML.
The DIM architecture discipline is interactive with a variety of other architectural disciplines, such as data governance, data architecture, data obfuscation architecture, compliance architecture, data warehouse architecture, system recovery failover architecture, and DR architecture.
4.1.9.1 Data Virtualization Architecture
Not to be confused with virtualization within operations architecture, data virtualization is an architectural discipline that has been slowly expanding in functional capabilities and its frequency of use within large companies. While these technologies are often marketed as a having numerous use cases, such as a means to create a virtual ODS or data warehouse, there are actually few use cases that are practical when large amounts of data are involved, high velocity, or significant levels of data cleansing required. That said, they still offer a good deal of business value.
A valuable use case for data virtualization is for the rendering of data from a physical ODS layer or data warehouse to a mashup reporting platform (see Section 3.1.2.5). The data virtualization capabilities that are particularly valuable for this use case are the ability to perform LDAP lookups of users, correlate the individual’s access rights with data access rights that have been designated to the individual’s role or department, and then to automatically mask data as it is passed to the visualization component of the mashup technology to prevent unauthorized viewing.
Another use case that offers considerable value is that of handling database stored procedures in a data virtualization layer, as opposed to embedding them within the particular brand of DBMS. Placing data base stored procedures in the data virtualization layer provides complete flexibility to transition from one brand of DBMS to another.
4.1.9.2 ETL Architecture
ETL is a type of technology that is used to move data from one place to another with data manipulation capabilities that can convert the data into the format of the target location.
In fact, ETL effectively integrates systems that have different:
- DBMSs,
- data types,
- data values for code tables,
- data formats,
- data structures,
- operating systems,
- hardware types, and
- communication protocols.
Conventional ETL architectures encounter the problem of becoming overwhelmed with transformation overhead (see the below diagram).
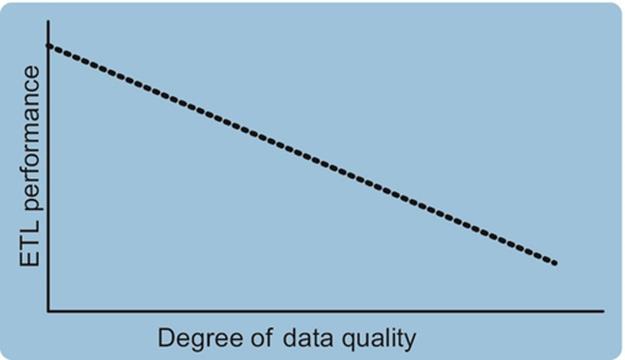
DIAGRAM ETL performance with transformation overhead.
The modern ETL architectures provide approaches that facilitate sharding, where additional nodes can be added on to facilitate increased transformation overhead and volume.
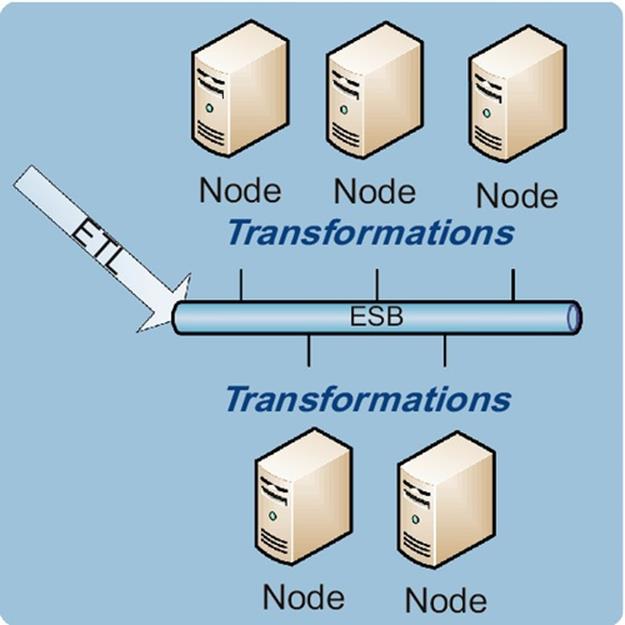
DIAGRAM Modern ETL architecture and sharding.
Automation systems in large companies move massive numbers of records and data points from and to hundreds of databases daily using a variety of means, often including vast numbers of programs that have been written in many programming languages, file transfer utilities from various vendors, database product exports and imports, database utilities, XML, and ETL.
However, as the variety of tools moving data increases, the greater the complexity that results. It doesn’t even take much complexity before all reasonable attempts to understand data movement across the data landscape of the enterprise is severely compromised.
A more modern view of ETL architecture eliminates this problem as well by standardizing the tooling used to manage all data movement across the data landscape to strictly ETL technologies with the key proviso that all ETL be centrally administered from the same ETL CASE tool.
The advantages of central administration are considerable. Use of an ETL CASE tool facilitates reuse of transformation specifications that have been recorded within the ETL CASE tool, thereby making it possible to generate consistent ETL code across an environment consisting of several different ETL products. Thus, ETL tools can be commoditized in a manner as effectively as with DBMS products that the industry has experienced with the use of database CASE technologies that can generate DDL associated with most any major brand of a DBMS.
These types of architectural decisions can significantly reduce the costs associated with data scrubbing by not incurring the costs associated with developing data transformation logic redundantly across the environment. Consistent transformation logic also provides business with more consistent results in reports by ensuring that conversions and numerical rounding factors are identical across each instance of ETL.
For information architecture, understanding data lineage is an essential first step toward simplifying the automation landscape of any environment. The modern approach involving central administration within an ETL CASE tool is one of the few approaches that can make data lineage reporting practical across the entire data landscape even when multiple ETL products are deployed.
The alternative suggested by the vendors still trapped in the past is to manually document data lineage in a tool that is separate from the technologies moving the data. This approach is not only redundant, but it is more costly to implement and maintain, not to mention impractical to expect that the informational content, never mind the constant flow of updates, could be reliably recorded to any meaning extent.
Intelligent standards and frameworks for ETL tool use are an integral part of a successful ETL architecture.
For example, a corporate standard that disallows ETL use when there are no data transformation requirements will create gaps in the reporting capabilities of data lineage across the data landscape.
Instead, not only should ETL be permitted, but it should also be encouraged and within a reasonable cost structure.
High-priced ETL products and high-priced administration of such products only serve to thwart their adoption across the enterprise. The key architectural characteristics are “distributed” and “open source” where possible. Paid versions will always be necessary when high volume and high data velocity are involved, but there are open source versions of ETL software for conventional databases as well as for Hadoop and HBase, as well as their paid full feature counterparts.
Examples of architectural touch points for ETL architecture include code table management, where nonstandardized code values bound for an ODS layer or data warehouse may be dynamically substituted with standard code table values, and data obfuscation, where data masking may be performed dynamically when production data is leaving the safety of the more rigorously controlled production environment.
4.1.9.3 ESB Architecture
ESB architecture is a discipline that facilitates uniform, flexible, and asynchronous communications across applications potentially residing on disparate operating system environments.
Although opinions of ESB services differ, the basic set of communications services provided by an ESB includes:
- routing, to identify the environment of the recipient application,
- transformation, for potential message format conversion,
- adaption, when the message must be transformed to or from the format of a nonstandard service-oriented architecture protocol (SOAP) (e.g., standard protocols are SOAP/HTTP or SOAP/JMS),
- messaging, to transport the message to the environment identified,
- orchestration, to manage the flow of control from one ESB service to another,
- service registration, to inventory the ESB services available to applications,
- security, protecting the bus from intruders,
- consumer integration, allowing message consumers the ability to tell ESB services where to find them,
- service request validation, to enforce policies enabling secure service invocation,
- metrics monitoring, to measure performance variables, and
- B2B support, to allow communication services with external applications over a firewall.
The discipline of ESB architecture deals with the:
- application architectures that need to communicate through the ESB,
- environments upon which these applications depend upon,
- software and hardware infrastructures required to support the high-availability needs of the service bus, such as clustering and failover, storage requirements, and power and racking requirements, and
- appropriate testing and deployment procedures.
ESB architecture also has close cooperation with a variety of other architectural disciplines, such as directory services architecture, for identity management and LDAP registries; ETL architecture, for deploying ETL within the ESB; network architecture, for SSL certificate management; and IT compliance architecture.
4.1.9.4 CEP Architecture
CEP architecture involves a type of real-time business analytics based on event pattern detection techniques and event abstraction that is well suited for use cases requiring rapid situational awareness. From an artificial intelligence perspective, the information interpreted from the patterns of numerous event data is referred to as an event cloud. At any given moment, the event cloud contains business situations that have been inferred to exist at the moment that may warrant action.
The components of CEP include:
- use case discovery,
- event pattern determination,
- event hierarchy models,
- relationships between event hierarchy models,
- abstraction of business situations, and
- determination of a rapid response.
For example, the earliest use cases for CEP in the financial services industry included program trading when particular trading behaviors were detected.
CEP engines can:
- filter which events to pay attention to,
- store events in memory (aka windows) or databases,
- determine if new events are related to events that have been stored,
- identify missing events within time periods, and
- can perform database lookups and joins.
The CEP architect determines the appropriate standards and frameworks for managing the CEP life cycle and inventory of each of these components with traceability to their associated use cases. The modern approach to CEP architecture involves recording from a variety of systems the events detected and/or their abstractions over time so that real-time events may be observed simultaneously with historical time series data as a technique for learning from previous event patterns.
The role of information architecture in CEP is to manage the metadata associated with CEP rules and frameworks.
As such, the role of a CEP architect requires a broad combination of knowledge and cumulative experience in business and business applicable use cases, pertinent areas of artificial intelligence, application development, DR, and CEP standards and frameworks.
4.1.10 Content Management Architecture
Content management architecture encompasses the standards, frameworks, strategies, methods, and tools to capture, manage, store, preserve, and deliver content and documents related to organizational processes in both business and IT operations.
The types of documents involved are often unstructured, although they are actually semistructured. These include documents that have structured data, such as within their document properties.
As mentioned earlier, unstructured data refers to the types of data that do not have discrete data points within the data that can be designed to map the stream of data such that anyone would know where one data point begins and ends after which the next data point would begin.
Similar to the requirements of an architecture component repository for standards and frameworks, an ontology that supports the needs of stakeholders must be developed on a case-by-case basis so that the pitfalls of directory structures and naming conventions can be similarly avoided where possible.
Content management architecture subject matter experts tend to focus on the separation of capabilities to be handled by the appropriate technologies. For example, if the backend that stores the documents is IBM’s FileNet or a Big Data repository of some type, then the front-end GUI can be Microsoft’s SharePoint product or other GUI.
4.1.11 Information Architecture—Summary
Information architecture is a highly specialized area that is frequently inadequately addressed among large enterprises. We believe that part of the explanation lies with the fact that the scope of information architecture is frequently confused as being related to reporting architecture, which consists of a vast area of visualization, database, and data virtualization technologies for developing BI applications.
It not only contains many disciplines, but it is also an area that requires support from a variety of other architectural disciplines across enterprise architecture. A lone information architect is certainly not a good thing to be unless you can systematically educate and inform the executive leadership team what a functional ecosystem looks like. I suggest you start by making analogies that illustrate a lone doctor, when what is needed are the many supporting disciplines of an inner city medical center.
The way we look at it, if information architecture was easy, then everyone would be doing it.