Practical Data Science with R (2014)
Part 1. Introduction to data science
Chapter 4. Managing data
This chapter covers
· Fixing data quality problems
· Organizing your data for the modeling process
In chapter 3, you learned how to explore your data and to identify common data issues. In this chapter, you’ll see how to fix the data issues that you’ve discovered. After that, we’ll talk about organizing the data for the modeling process.[1]
1 For all of the examples in this chapter, we’ll use synthetic customer data (mostly derived from US Census data) with specifically introduced flaws. The data can be loaded by saving the file exampleData.rData from https://github.com/WinVector/zmPDSwR/tree/master/Custdata and then running load("exampleData.rData") in R.
4.1. Cleaning data
In this section, we’ll address issues that you discovered during the data exploration/visualization phase. First you’ll see how to treat missing values. Then we’ll discuss some common data transformations and when they’re appropriate: converting continuous variables to discrete; normalization and rescaling; and logarithmic transformations.
4.1.1. Treating missing values (NAs)
Let’s take another look at some of the variables with missing values in our customer dataset from the previous chapter. We’ve reproduced the summary in figure 4.1.
Figure 4.1. Variables with missing values
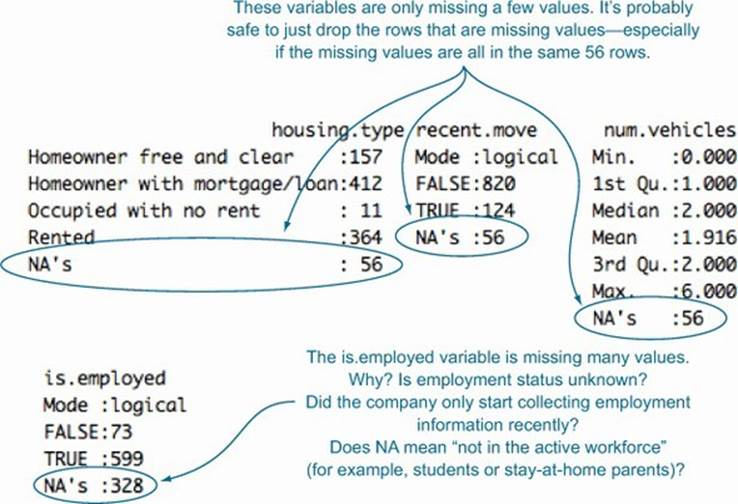
Fundamentally, there are two things you can do with these variables: drop the rows with missing values, or convert the missing values to a meaningful value.
To Drop or not to Drop?
Remember that we have a dataset of 1,000 customers; 56 missing values represents about 6% of the data. That’s not trivial, but it’s not huge, either. The fact that three variables are all missing exactly 56 values suggests that it’s the same 56 customers in each case. That’s easy enough to check.
Listing 4.1. Checking locations of missing data
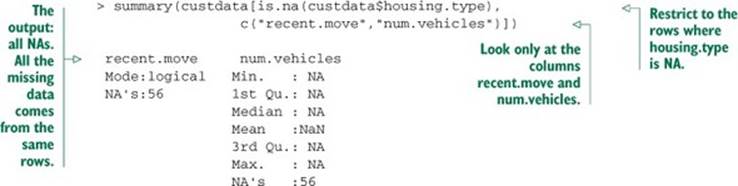
Because the missing data represents a fairly small fraction of the dataset, it’s probably safe just to drop these customers from your analysis. But what about the variable is.employed? Here you’re missing data from a third of the customers. What do you do then?
Missing data in categorical variables
The most straightforward solution is just to create a new category for the variable, called missing.
Listing 4.2. Remapping NA to a level
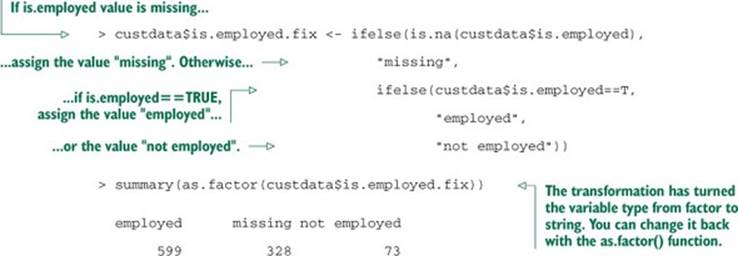
Practically speaking, this is exactly equivalent to what we had before; but remember that most analysis functions in R (and in a great many other statistical languages and packages) will, by default, drop rows with missing data. Changing each NA (which is R’s code for missing values) to the token missing (which is people-code for missing values) will prevent that.
The preceding fix will get the job done, but as a data scientist, you ought to be interested in why so many customers are missing this information. It could just be bad record-keeping, but it could be semantic, as well. In this case, the format of the data (using the same row type for all customers) hints that the NA actually encodes that the customer is not in the active workforce: they are a homemaker, a student, retired, or otherwise not seeking paid employment. Assuming that you don’t want to differentiate between retirees, students, and so on, naming the category appropriately will make it easier to interpret the model that you build down the line—both for you and for others:
custdata$is.employed.fix <- ifelse(is.na(custdata$is.employed),
"not in active workforce",
ifelse(custdata$is.employed==T,
"employed",
"not employed"))
If you did want to differentiate retirees from students and so on, you’d need additional data to make the correct assignments.
Why a new variable?
You’ll notice that we created a new variable called is.employed.fix, rather than simply replacing is.employed. This is a matter of taste. We prefer to have the original variable on hand, in case we second-guess our data cleaning and want to redo it. This is mostly a problem when the data cleaning involves a complicated transformation, like determining which customers are retirees and which ones are students. On the other hand, having two variables about employment in your data frame leaves you open to accidentally using the wrong one. Both choices have advantages and disadvantages.
Missing values in categorical variables are a relatively straightforward case to work through. What about numeric data?
Missing values in numeric data
Suppose your income variable is missing substantial data:
> summary(custdata$Income)
Min. 1st Qu. Median Mean 3rd Qu. Max. NA's
0 25000 45000 66200 82000 615000 328
You believe that income is still an important predictor of the probability of health insurance coverage, so you still want to use the variable. What do you do?
When values are missing randomly
You might believe that the data is missing because of a faulty sensor—in other words, the data collection failed at random. In this case, you can replace the missing values with the expected, or mean, income:
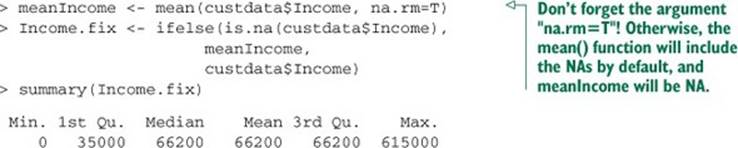
Assuming that the customers with missing income are distributed the same way as the others, this estimate will be correct on average, and you’ll be about as likely to have overestimated customer income as underestimated it. It’s also an easy fix to implement.
This estimate can be improved when you remember that income is related to other variables in your data—for instance, you know from your data exploration in the previous chapter that there’s a relationship between age and income. There might be a relationship between state of residence or marital status and income, as well. If you have this information, you can use it.
Note that the method of imputing a missing value of an input variable based on the other input variables can be applied to categorical data, as well. The text R in Action, Second Edition (Robert Kabacoff, 2014, http://mng.bz/ybS4) includes an extensive discussion of several methods available in R.
It’s important to remember that replacing missing values by the mean, as well as many more sophisticated methods for imputing missing values, assumes that the customers with missing income are in some sense random (the “faulty sensor” situation). It’s possible that the customers with missing income data are systematically different from the others. For instance, it could be the case that the customers with missing income information truly have no income—because they’re not in the active workforce. If this is so, then “filling in” their income information by using one of the preceding methods is the wrong thing to do. In this situation, there are two transformations you can try.
When values are missing systematically
One thing you can do is to convert the numeric data into categorical data, and then use the methods that we discussed previously. In this case, you would divide the income into some income categories of interest, such as “below $10,000,” or “from $100,000 to $250,000” using the cut()function, and then treat the NAs as we did when working with missing categorical values.
Listing 4.3. Converting missing numeric data to a level
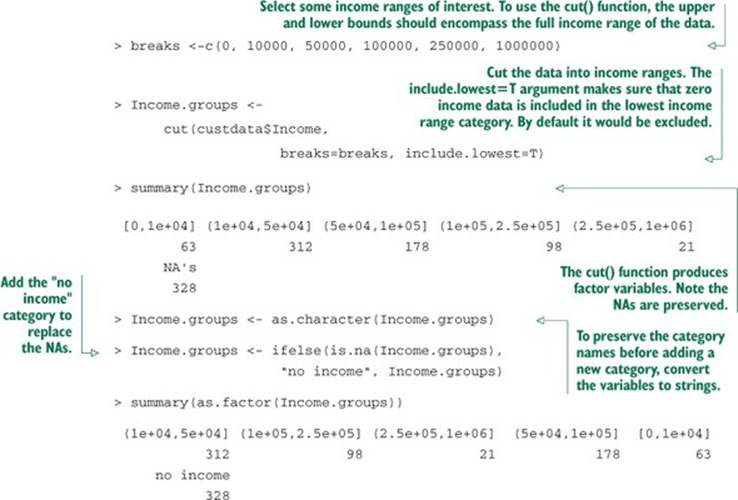
This grouping approach can work well, especially if the relationship between income and insurance is nonmonotonic (the likelihood of having insurance doesn’t strictly increase or decrease with income). It does require that you select good cuts, and it’s a less concise representation of income than a numeric variable.
You could also replace all the NAs with zero income—but the data already has customers with zero income. Those zeros could be from the same mechanism as the NAs (customers not in the active workforce), or they could come from another mechanism—for example, customers who have been unemployed the entire year. A trick that has worked well for us is to replace the NAs with zeros and add an additional variable (we call it a masking variable) to keep track of which data points have been altered.
Listing 4.4. Tracking original NAs with an extra categorical variable
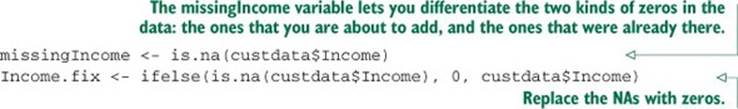
You give both variables, missingIncome and Income.fix, to the modeling algorithm, and it can determine how to best use the information to make predictions. Note that if the missing values really are missing randomly, then the masking variable will basically pick up the variable’s mean value (at least in regression models).
In summary, to properly handle missing data you need to know why the data is missing in the first place. If you don’t know whether the missing values are random or systematic, we recommend assuming that the difference is systematic, rather than trying to impute values to the variables based on the faulty sensor assumption.
In addition to fixing missing data, there are other ways that you can transform the data to address issues that you found during the exploration phase. In the next section, we’ll examine some common transformations.
4.1.2. Data transformations
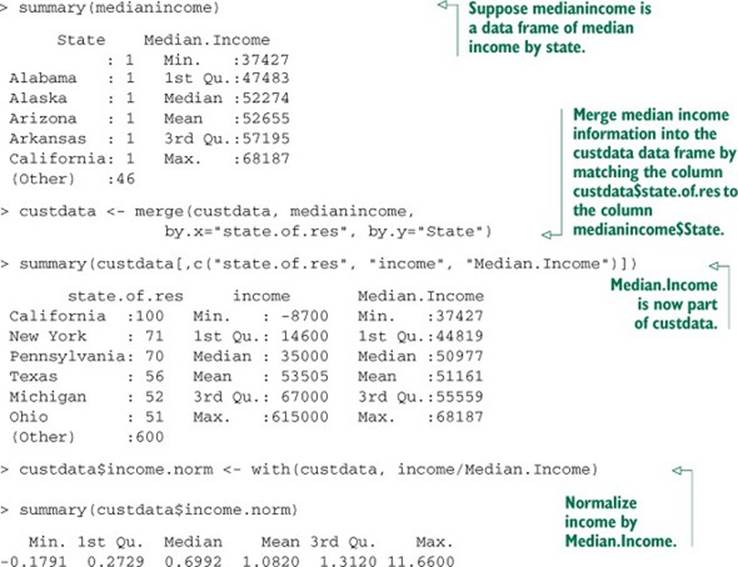
The purpose of data transformation is to make data easier to model—and easier to understand. For example, the cost of living will vary from state to state, so what would be a high salary in one region could be barely enough to scrape by in another. If you want to use income as an input to your insurance model, it might be more meaningful to normalize a customer’s income by the typical income in the area where they live. The next listing is an example of a relatively simple (and common) transformation.
Listing 4.5. Normalizing income by state
The need for data transformation can also depend on which modeling method you plan to use. For linear and logistic regression, for example, you ideally want to make sure that the relationship between input variables and output variable is approximately linear, and that the output variable is constant variance (the variance of the output variable is independent of the input variables). You may need to transform some of your input variables to better meet these assumptions.
In this section, we’ll look at some useful data transformations and when to use them: converting continuous variables to discrete; normalizing variables; and log transformations.
Converting continuous variables to discrete
For some continuous variables, their exact value matters less than whether they fall into a certain range. For example, you may notice that customers with incomes less than $20,000 have different health insurance patterns than customers with higher incomes. Or you may notice that customers younger than 25 and older than 65 have high probabilities of insurance coverage, because they tend to be on their parents’ coverage or on a retirement plan, respectively, whereas customers between those ages have a different pattern.
In these cases, you might want to convert the continuous age and income variables into ranges, or discrete variables. Discretizing continuous variables is useful when the relationship between input and output isn’t linear, but you’re using a modeling technique that assumes it is, like regression (see figure 4.2).
Figure 4.2. Health insurance coverage versus income (log10 scale)
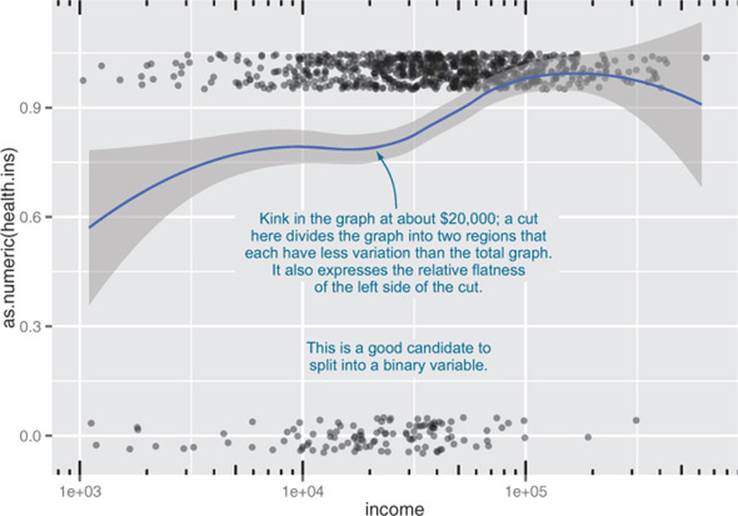
Looking at figure 4.2, you see that you can replace the income variable with a Boolean variable that indicates whether income is less than $20,000:
> custdata$income.lt.20K <- custdata$income < 20000
> summary(custdata$income.lt.20K)
Mode FALSE TRUE NA's
logical 678 322 0
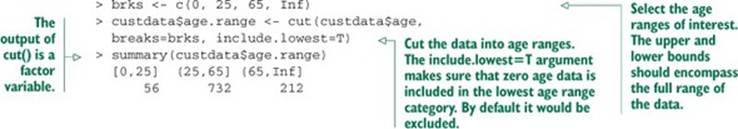
If you want more than a simple threshold (as in the age example), you can use the cut() function, as you saw in the section “When values are missing systematically.”
Listing 4.6. Converting age into ranges
Even when you do decide not to discretize a numeric variable, you may still need to transform it to better bring out the relationship between it and other variables. You saw this in the example that introduced this section, where we normalized income by the regional median income. In the next section, we’ll talk about normalization and rescaling.
Normalization and rescaling
Normalization is useful when absolute quantities are less meaningful than relative ones. We’ve already seen an example of normalizing income relative to another meaningful quantity (median income). In that case, the meaningful quantity was external (came from the analyst’s domain knowledge); but it can also be internal (derived from the data itself).
For example, you might be less interested in a customer’s absolute age than you are in how old or young they are relative to a “typical” customer. Let’s take the mean age of your customers to be the typical age. You can normalize by that, as shown in the following listing.
Listing 4.7. Centering on mean age
> summary(custdata$age)
Min. 1st Qu. Median Mean 3rd Qu. Max.
0.0 38.0 50.0 51.7 64.0 146.7
> meanage <- mean(custdata$age)
> custdata$age.normalized <- custdata$age/meanage
> summary(custdata$age.normalized)
Min. 1st Qu. Median Mean 3rd Qu. Max.
0.0000 0.7350 0.9671 1.0000 1.2380 2.8370
A value for age.normalized that is much less than 1 signifies an unusually young customer; much greater than 1 signifies an unusually old customer. But what constitutes “much less” or “much greater” than 1? That depends on how wide an age spread your customers tend to have. Seefigure 4.3 for an example.
Figure 4.3. Is a 35-year-old young?
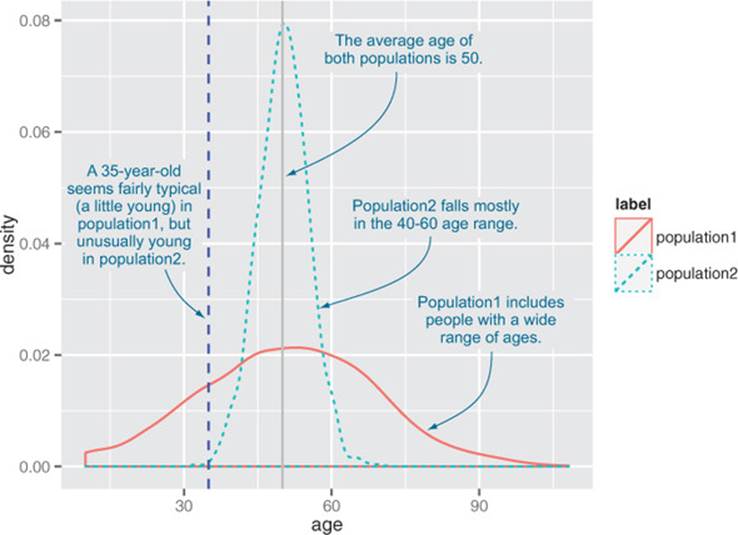
The typical age spread of your customers is summarized in the standard deviation. You can rescale your data by using the standard deviation as a unit of distance. A customer who is within one standard deviation of the mean is not much older or younger than typical. A customer who is more than one or two standard deviations from the mean can be considered much older, or much younger.
Listing 4.8. Summarizing age
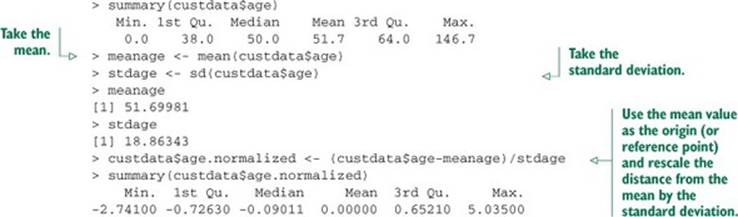
Now, values less than -1 signify customers younger than typical; values greater than 1 signify customers older than typical.
Normalizing by mean and standard deviation is most meaningful when the data distribution is roughly symmetric. Next, we’ll look at a transformation that can make some distributions more symmetric.
Log transformations for skewed and wide distributions
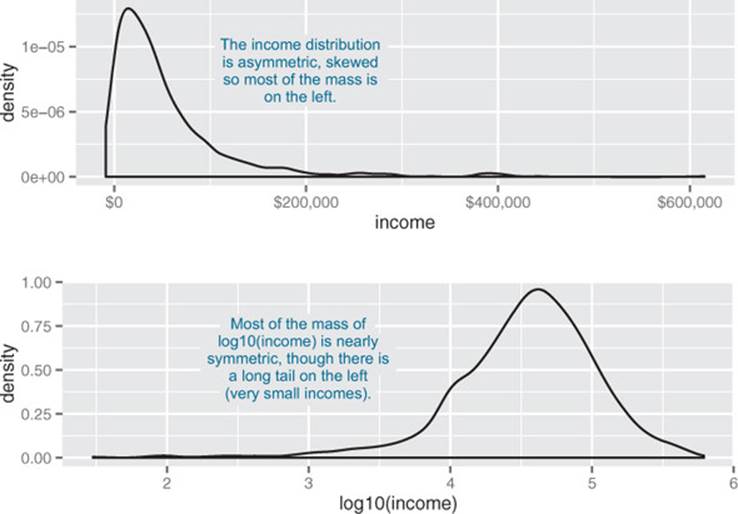
Monetary amounts—incomes, customer value, account, or purchase sizes—are some of the most commonly encountered sources of skewed distributions in data science applications. In fact, as we discuss in appendix B, monetary amounts are often lognormally distributed—the log of the data is normally distributed. This leads us to the idea that taking the log of the data can restore symmetry to it. We demonstrate this in figure 4.4.
Figure 4.4. A nearly lognormal distribution and its log
A technicality
The common interpretation of standard deviation as a unit of distance implicitly assumes that the data is distributed normally. For a normal distribution, roughly two-thirds of the data (about 68%) is within plus/minus one standard deviation from the mean. About 95% of the data is within plus/minus two standard deviations from the mean. In figure 4.3, a 35-year-old is (just barely) within one standard deviation from the mean in population1, but more than two standard deviations from the mean in population2.
You can still use this transformation if the data isn’t normally distributed, but the standard deviation is most meaningful as a unit of distance if the data is unimodal and roughly symmetric around the mean.
For the purposes of modeling, which logarithm you use—natural logarithm, log base 10, or log base 2—is generally not critical. In regression, for example, the choice of logarithm affects the magnitude of the coefficient that corresponds to the logged variable, but it doesn’t affect the value of the outcome. We like to use log base 10 for monetary amounts, because orders of ten seem natural for money: $100, $1000, $10,000, and so on. The transformed data is easy to read.
An aside on graphing
Notice that the bottom panel of figure 4.4 has the same shape as figure 3.5. The difference between using the ggplot layer scale_x_log10 on a density plot of income and plotting a density plot of log10(income) is primarily axis labeling. Using scale_x_log10 will label the x-axis in dollars amounts, rather than in logs.
It’s also generally a good idea to log transform data with values that range over several orders of magnitude—first, because modeling techniques often have a difficult time with very wide data ranges; and second, because such data often comes from multiplicative processes, so log units are in some sense more natural.
For example, when you’re studying weight loss, the natural unit is often pounds or kilograms. If you weigh 150 pounds and your friend weighs 200, you’re both equally active, and you both go on the exact same restricted-calorie diet, then you’ll probably both lose about the same number of pounds—in other words, how much weight you lose doesn’t (to first order) depend on how much you weighed in the first place, only on calorie intake. This is an additive process.
On the other hand, if management gives everyone in the department a raise, it probably isn’t giving everyone $5,000 extra. Instead, everyone gets a 2% raise: how much extra money ends up in your paycheck depends on your initial salary. This is a multiplicative process, and the natural unit of measurement is percentage, not absolute dollars. Other examples of multiplicative processes: a change to an online retail site increases conversion (purchases) for each item by 2% (not by exactly two purchases); a change to a restaurant menu increases patronage every night by 5% (not by exactly five customers every night). When the process is multiplicative, log transforming the process data can make modeling easier.
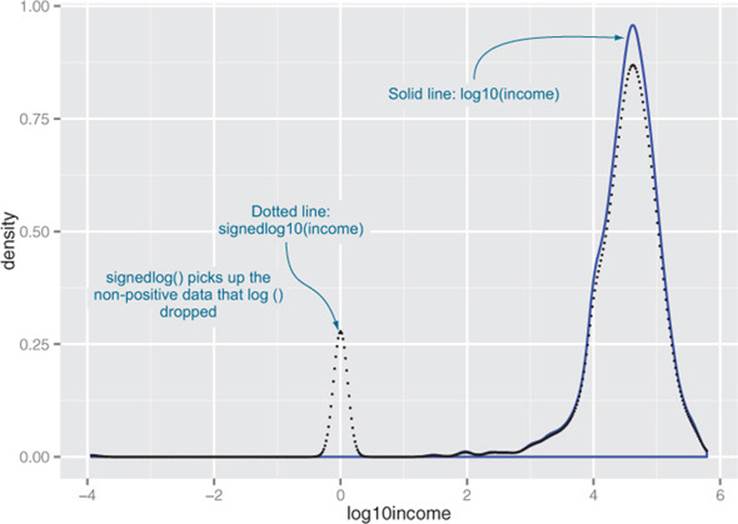
Of course, taking the logarithm only works if the data is non-negative. There are other transforms, such as arcsinh, that you can use to decrease data range if you have zero or negative values. We don’t always use arcsinh, because we don’t find the values of the transformed data to be meaningful. In applications where the skewed data is monetary (like account balances or customer value), we instead use what we call a signed logarithm. A signed logarithm takes the logarithm of the absolute value of the variable and multiplies by the appropriate sign. Values strictly between -1 and 1 are mapped to zero. The difference between log and signed log is shown in figure 4.5.
Figure 4.5. Signed log lets you visualize non-positive data on a logarithmic scale.
Here’s how to calculate signed log base 10, in R:
signedlog10 <- function(x) {
ifelse(abs(x) <= 1, 0, sign(x)*log10(abs(x)))
}
Clearly this isn’t useful if values below unit magnitude are important. But with many monetary variables (in US currency), values less than a dollar aren’t much different from zero (or one), for all practical purposes. So, for example, mapping account balances that are less than or equal to $1 (the equivalent of every account always having a minimum balance of one dollar) is probably okay.[2]
2 There are methods other than capping to deal with signed logarithms, such as the arcsinh function (see http://mng.bz/ZWQa), but they also distort data near zero and make almost any data appear to be bimodal.
Once you’ve got the data suitably cleaned and transformed, you’re almost ready to start the modeling stage. Before we get there, we have one more step.
4.2. Sampling for modeling and validation
Sampling is the process of selecting a subset of a population to represent the whole, during analysis and modeling. In the current era of big datasets, some people argue that computational power and modern algorithms let us analyze the entire large dataset without the need to sample.
We can certainly analyze larger datasets than we could before, but sampling is a necessary task for other reasons. When you’re in the middle of developing or refining a modeling procedure, it’s easier to test and debug the code on small subsamples before training the model on the entire dataset. Visualization can be easier with a subsample of the data; ggplot runs faster on smaller datasets, and too much data will often obscure the patterns in a graph, as we mentioned in chapter 3. And often it’s not feasible to use your entire customer base to train a model.
It’s important that the dataset that you do use is an accurate representation of your population as a whole. For example, your customers might come from all over the United States. When you collect your custdata dataset, it might be tempting to use all the customers from one state, say Connecticut, to train the model. But if you plan to use the model to make predictions about customers all over the country, it’s a good idea to pick customers randomly from all the states, because what predicts health insurance coverage for Texas customers might be different from what predicts health insurance coverage in Connecticut. This might not always be possible (perhaps only your Connecticut and Massachusetts branches currently collect the customer health insurance information), but the shortcomings of using a nonrepresentative dataset should be kept in mind.
The other reason to sample your data is to create test and training splits.
4.2.1. Test and training splits
When you’re building a model to make predictions, like our model to predict the probability of health insurance coverage, you need data to build the model. You also need data to test whether the model makes correct predictions on new data. The first set is called the training set, and the second set is called the test (or hold-out) set.
The training set is the data that you feed to the model-building algorithm—regression, decision trees, and so on—so that the algorithm can set the correct parameters to best predict the outcome variable. The test set is the data that you feed into the resulting model, to verify that the model’s predictions are accurate. We’ll go into detail about the kinds of modeling issues that you can detect by using hold-out data in chapter 5. For now, we’ll just get our data ready for doing hold-out experiments at a later stage.
Many writers recommend train/calibration/test splits, which is also good advice. Our philosophy is this: split the data into train/test early, don’t look at test until final evaluation, and if you need calibration data, resplit it from your training subset.
4.2.2. Creating a sample group column
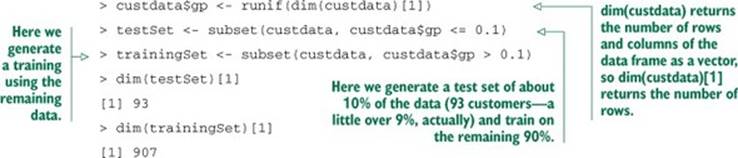
A convenient way to manage random sampling is to add a sample group column to the data frame. The sample group column contains a number generated uniformly from zero to one, using the runif function. You can draw a random sample of arbitrary size from the data frame by using the appropriate threshold on the sample group column.
For example, once you’ve labeled all the rows of your data frame with your sample group column (let’s call it gp), then the set of all rows such that gp < 0.4 will be about four-tenths, or 40%, of the data. The set of all rows where gp is between 0.55 and 0.70 is about 15% of the data (0.7 - 0.55 = 0.15). So you can repeatably generate a random sample of the data of any size by using gp.
Listing 4.9. Splitting into test and training using a random group mark
R also has a function called sample that draws a random sample (a uniform random sample, by default) from a data frame. Why not just use sample to draw training and test sets? You could, but using a sample group column guarantees that you’ll draw the same sample group every time. This reproducible sampling is convenient when you’re debugging code. In many cases, code will crash because of a corner case that you forgot to guard against. This corner case might show up in your random sample. If you’re using a different random input sample every time you run the code, you won’t know if you will tickle the bug again. This makes it hard to track down and fix errors.
You also want repeatable input samples for what software engineers call regression testing (not to be confused with statistical regression). In other words, when you make changes to a model or to your data treatment, you want to make sure you don’t break what was already working. If model version 1 was giving “the right answer” for a certain input set, you want to make sure that model version 2 does so also.
Reproducible sampling is not just a trick for R
If your data is in a database or other external store, and you only want to pull a subset of the data into R for analysis, you can draw a reproducible random sample by generating a sample group column in an appropriate table in the database, using the SQL command RAND .
4.2.3. Record grouping
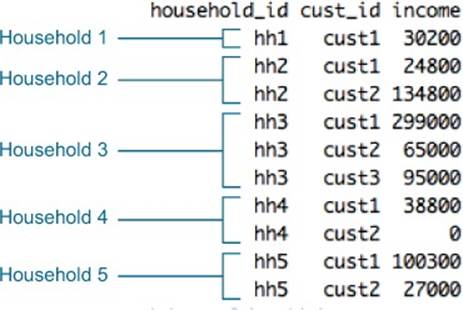
One caveat is that the preceding trick works if every object of interest (every customer, in this case) corresponds to a unique row. But what if you’re interested less in which customers don’t have health insurance, and more about which households have uninsured members? If you’re modeling a question at the household level rather than the customer level, then every member of a household should be in the same group (test or training). In other words, the random sampling also has to be at the household level.
Suppose your customers are marked both by a household ID and a customer ID (so the unique ID for a customer is the combination (household_id, cust_id). This is shown in figure 4.6. We want to split the households into a training set and a test set. The next listing shows one way to generate an appropriate sample group column.
Figure 4.6. Example of dataset with customers and households
Listing 4.10. Ensuring test/train split doesn’t split inside a household
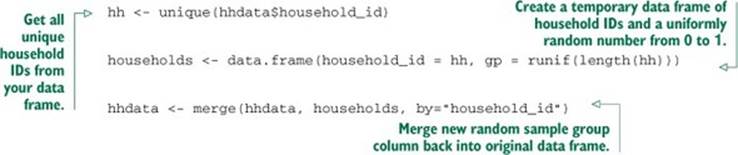
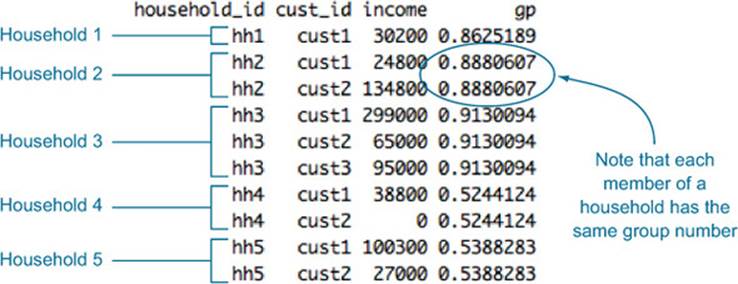
The resulting sample group column is shown in figure 4.7. Now we can generate the test and training sets as before. This time, however, the threshold 0.1 doesn’t represent 10% of the data rows, but 10% of the households (which may be more or less than 10% of the data, depending on the sizes of the households).
Figure 4.7. Example of dataset with customers and households
4.2.4. Data provenance
You’ll also want to add a column (or columns) to record data provenance: when your dataset was collected, perhaps what version of your data cleaning procedure was used on the data before modeling, and so on. This is akin to version control for data. It’s handy information to have, to make sure that you’re comparing apples to apples when you’re in the process of improving your model, or comparing different models or different versions of a model.
4.3. Summary
At some point, you’ll have data quality that is as good as you can make it. You’ve fixed problems with missing data and performed any needed transformations. You’re ready to go on to the modeling stage.
Remember, though, that data science is an iterative process. You may discover during the modeling process that you have to do additional data cleaning or transformation. You may have to go back even further and collect different types of data. That’s why we recommend adding columns for sample groups and data provenance to your datasets (and later, to the models and model output), so you can keep track of the data management steps as the data and the models evolve.
In the part 2 of the book, we’ll talk about the process of building and evaluating models to meet your stated objectives.
Key takeaways
· What you do with missing values depends on how many there are, and whether they’re missing randomly or systematically.
· When in doubt, assume that missing values are missing systematically.
· Appropriate data transformations can make the data easier to understand and easier to model.
· Normalization and rescaling are important when relative changes are more important than absolute ones.
· Data provenance records help reduce errors as you iterate over data collection, data treatment, and modeling.
All materials on the site are licensed Creative Commons Attribution-Sharealike 3.0 Unported CC BY-SA 3.0 & GNU Free Documentation License (GFDL)
If you are the copyright holder of any material contained on our site and intend to remove it, please contact our site administrator for approval.
© 2016-2026 All site design rights belong to S.Y.A.