CCNP Security FIREWALL 642-618 Official Cert Guide (2012)
Chapter 6. Recording ASA Activity
This chapter covers the following topics:
• System Time: This section describes configuration of system time, both locally on the ASA and through the use of NTP.
• Managing Event and Session Logging: This section gives an overview of the ASA logging subsystem, including event destinations, severity levels, and NetFlow support.
• Configuring Event and Session Logging: This section describes the configuration of logging on the ASA. It covers the setting of global parameters, the creation of event lists and filters, and the details on configuring a number of event destinations.
• Verifying Event and Session Logging: This section covers commands used to verify proper functioning of logging on the ASA.
• Troubleshooting Event and Session Logging: This section covers commands used to troubleshoot logging functionality.
Effective troubleshooting of network or device activity, from the perspective of the Cisco Adaptive Security Appliance (ASA), requires accurate information. Many times, the best source of accurate and complete information will be various logs, if logging is properly configured to capture the necessary information. An ASA has many potential destinations to which it can send logging information.
“Do I Know This Already?” Quiz
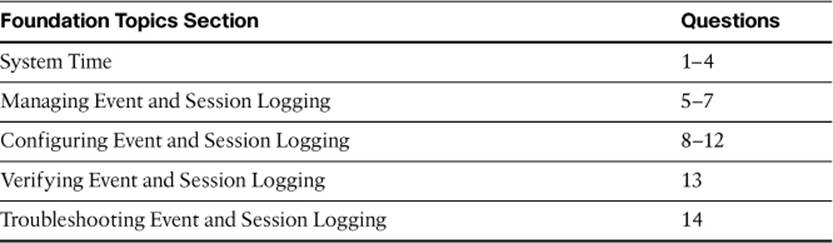
The “Do I Know This Already?” quiz allows you to assess whether you should read this entire chapter thoroughly or jump to the “Exam Preparation Tasks” section. If you are in doubt about your answers to these questions or your own assessment of your knowledge of the topics, read the entire chapter. Table 6-1 lists the major headings in this chapter and their corresponding “Do I Know This Already?” quiz questions. You can find the answers in Appendix A, “Answers to the ‘Do I Know This Already?’ Quizzes.”
Table 6-1. “Do I Know This Already?” Section-to-Question Mapping
Caution
The goal of self-assessment is to gauge your mastery of the topics in this chapter. If you do not know the answer to a question or are only partially sure of the answer, you should mark that question as wrong for purposes of the self-assessment. Giving yourself credit for an answer you correctly guess skews your self-assessment results and might provide you with a false sense of security.
1. Which are two of the most important reasons for ensuring accurate time on an ASA? (Choose two.)
a. Synchronization with AAA servers
b. Use of digital certificates
c. Time-based Modular Policy Framework rules
d. Time stamps in log messages
2. Where in ASDM do you configure NTP authentication and servers?
a. Configuration > Device Setup > System Time > NTP
b. Configuration > Device Management > System Time > NTP
c. Configuration > Device Management > System Time > NTP > Parameters
d. Configuration > Device Setup > System Time > NTP > Parameters
3. Consider the following command:
ntp authentication-key 1 md5 UEB34mid@#9C
What does this command mean?
a. This is the first authentication key in a key ring, and the MD5 hash value is the value UEB34mid@#9C.
b. The key number is 1, which will be sent by the NTP server in all packets. The key of UEB34mid@#9C is used to create an MD5 keyed hash value to verify the server message.
c. The key number is 1, which is locally significant and allows the creation of multiple trusted keys per server. The key of UEB34mid@#9C is used to create an MD5 keyed hash value to verify the server message.
d. None of these answers are correct. This is not a valid command string.
4. Consider the following command:
ntp server 10.0.0.5 key 1 source inside prefer
What is the meaning of the word “prefer” in this command?
a. This NTP server is preferred over all other time sources.
b. The ASA prefers the use of NTP authentication key 1 over other keys in the key ring.
c. The ASA prefers the use of NTP authentication using key 1, but is willing to accept unauthenticated NTP messages from this server.
d. This NTP server is preferred over other time sources of similar accuracy, but can be overridden by a more accurate time source.
e. None of these answers are correct. This is not a valid command string.
5. What are the two major classifications of ASA events? (Choose two.)
a. System events
b. Security events
c. Network events
d. Syslog events
e. None of these answers are correct. This is not a valid command string.
6. Consider the following partial event message:
Jan 5 2011 09:27:16 FIREWALL : %ASA-6-725002: Device completed ...
What is the severity level of this event message?
a. Notifications
b. Informational
c. Warnings
d. Debugging
e. Errors
7. Which version of NetFlow is supported by the ASA?
a. 9
b. 2
c. 7.2
d. 5
8. If the internal buffer logging destination becomes full, which two locations can its contents be copied to, to ensure no loss of information?
a. An HTTP server
b. An FTP server
c. Internal flash memory
d. A TFTP server
e. An SCP server
9. How are time stamps enabled/disabled for logging event messages to destinations?
a. Once, globally, by navigating to Configuration > Device Management > Logging > Syslog Setup.
b. Once, globally, by navigating to Configuration > Device Management > Logging > Logging Setup.
c. Once, globally, but this can be done only from the CLI.
d. Per log destination, by navigating to Configuration > Device Management > Logging > screen for destination being configured.
e. Per log destination, but this can be done only from the CLI interface
10. You want to change the level at which message 106018 is logged to Notifications, from its default setting. The message will be sent to your syslog server destination. Which of the following is the correct command syntax?
a. logging trap message 106018 level Notifications
b. message 106018 syslog level Notifications
c. logging message 106018 level Notifications
d. logging level Notifications message 106018
e. logging message 106018 new level Notifications
11. What is an event list? (Choose all that apply.)
a. A grouping of messages, based on which logging subsystem generated the events in the list.
b. A reusable group of messages, selected by a combination of event class, event severity, and separately by message IDs.
c. A filter, used to determine which messages generated by the logging subsystem are forwarded to a particular log destination.
d. All of these answers are correct.
12. You want to configure logging so that email messages are sent to administrators when events of maximum level Errors are generated by the system. Which of the following is the correct syntax for the command you need to use?
a. logging smtp Errors
b. logging trap smtp Errors
c. logging email Errors
d. logging trap email Errors
e. logging mail Errors
f. logging trap mail Errors
13. You want to verify that the ASA is sending NetFlow v9 records to the configured NetFlow collector. Which of these items will do that?
a. Use the show logging command and look for a nonzero number as messages logged for the NetFlow destination.
b. Use the show logging command and look for a nonzero number as packets sent for the NetFlow destination.
c. Use the show flow-export counters command and look for a non-zero number as messages logged.
d. Use the show flow-export counters command and look for a nonzero number as packets sent.
14. You suspect your syslog server is not receiving all messages generated by the ASA, possibly due to excessive logging leading to a queue overflow. What command would you use to verify your suspicions?
a. show logging
b. show logging queue
c. show logging drops
d. show logging queue drops
Foundation Topics
This chapter discusses methods for gathering information on network or device activity, including the use of system event logs. It also discusses how to ensure accurate time on the system clock because accurate time stamps on gathered information are critical to properly analyzing that information.
The FIREWALL exam focuses on practical, hands-on skills that are used by a networking professional. You are expected to be familiar with how to configure various features either from the ASDM GUI or from the CLI and to be able to use either for verification and troubleshooting. This being the case, this book shows the use of both tools, primarily configuring an ASA using ASDM, and recapping the equivalent CLI commands for each section.
System Time
Having a correct time set on a Cisco ASA is important for a number of reasons. Possibly the most important reason is that digital certificates compare this time to the range defined by their Valid From and Valid To fields to define a specific validity period. Having a correct time set is also important when logging information with the timestamp option. Whether you are sending messages to a syslog server, sending messages to an SNMP monitoring station, or performing packet captures, time stamps have little usefulness if you cannot be certain of their accuracy.
The default ASA time zone is set to UTC (Coordinated Universal Time), but you can add local time zone information so that the time displayed by the ASA is more relevant to those who are viewing it. Even if you set local time zone information, the ASA internally tracks time as UTC, so if it is interacting with hosts in other time zones (which is fairly common when using digital certificates for VPN connectivity, for example), they have a common frame of reference.
To set the time locally on the ASA (that is, not using Network Time Protocol [NTP]), first navigate to Configuration > Device Setup > System Time > Clock to display the Clock settings window, shown in Figure 6-1. If you want to set the clock to UTC time, simply enter a new date and time, as UTC is the default time zone. If you prefer to set the clock using your local time zone, choose that time zone from the drop-down list before you enter a new date and time. (Figure 6-1 shows the North American Central Time Zone being selected.)
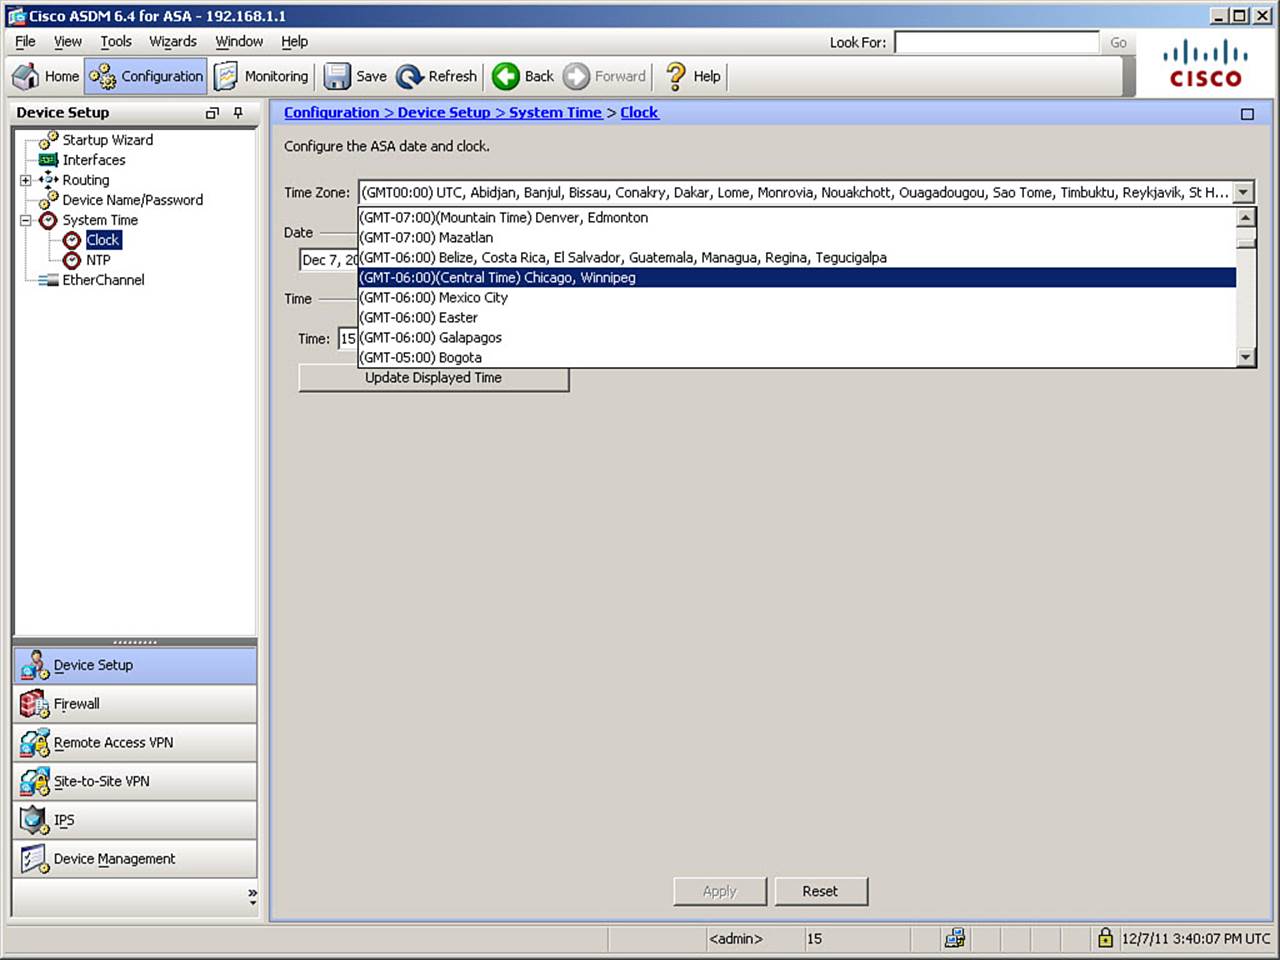
Figure 6-1. Setting Local Time Parameters
You can then set the date and time accordingly. Time is set as hours, minutes, and seconds, in 24-hour format. Optionally, you can click the Update Displayed Time button to update the time shown in the bottom-right corner of the Cisco ASDM status bar. The current time updates automatically every ten seconds. The example assumes that the current time is manually set. Click Apply to complete the setting of the internal clock.
The configured time is retained in memory when the power is off, by a battery on the ASA motherboard.
The CLI commands generated by the changes made are as follows:
clock set 09:58:26 DEC 7 2011
clock timezone CST -6 0
clock summer-time CDT recurring 2 Sun Mar 2:00 1 Sun Nov 2:00 60
If you are configuring the ASA from the CLI, you can enter these commands directly in global configuration mode. (The clock set command can actually be entered from privileged mode as well.)
The clock set command is used to manually set the ASA date and time information. It can be used from the CLI in privileged EXEC mode (use of configuration mode is not necessary). When setting from the CLI, the date can be specified as MONTH DAY YEAR or DAY MONTH YEAR—whichever you prefer.
The clock timezone command defines a name for your local time zone (in Standard Time) and its offset from UTC in hours (the -6 in the example) and in minutes (the 0 in the example) if you live in a time zone with an offset that is not in whole hours.
The clock summer-time command defines a name for your local time zone (in DST), and uses the keyword recurring to set a recurring range, defined as a day and time of a given month, rather than a specific date, so that you do not need to alter the setting yearly. Use it to set the beginning and ending days and times for DST in your time zone (in the example, DST begins on the second Sunday in March at 2 a.m. and ends on the first Sunday of November at 2 a.m.) and the DST offset from Standard Time (in the example, 60 minutes).
Note
Because of the change in dates on which Daylight Savings Time (DST) begins and ends in the United States, effective 2007, the beginning and ending dates when using the recurring keyword are different for older OS versions and might not align with DST periods in other countries. You might want to consider verifying the configured period for DST, especially for ASAs that will be operated outside of the United States. You may do so by using the show clock detail command.
NTP
Of course, to ensure precise synchronization of the ASA’s clock to the rest of your network, you should configure the ASA to obtain time information from a trusted NTP server. To do so, navigate to Configuration > Device Setup > System Time > NTP. The NTP settings window opens. To define a new NTP time source, click Add to open the Add NTP Server Configuration dialog box, as shown in Figure 6-2. Define the IP address of the new NTP time source, the ASA interface through which this NTP server can be reached, whether this is a preferred time source, and any information relevant to the use of authenticated NTP communication.
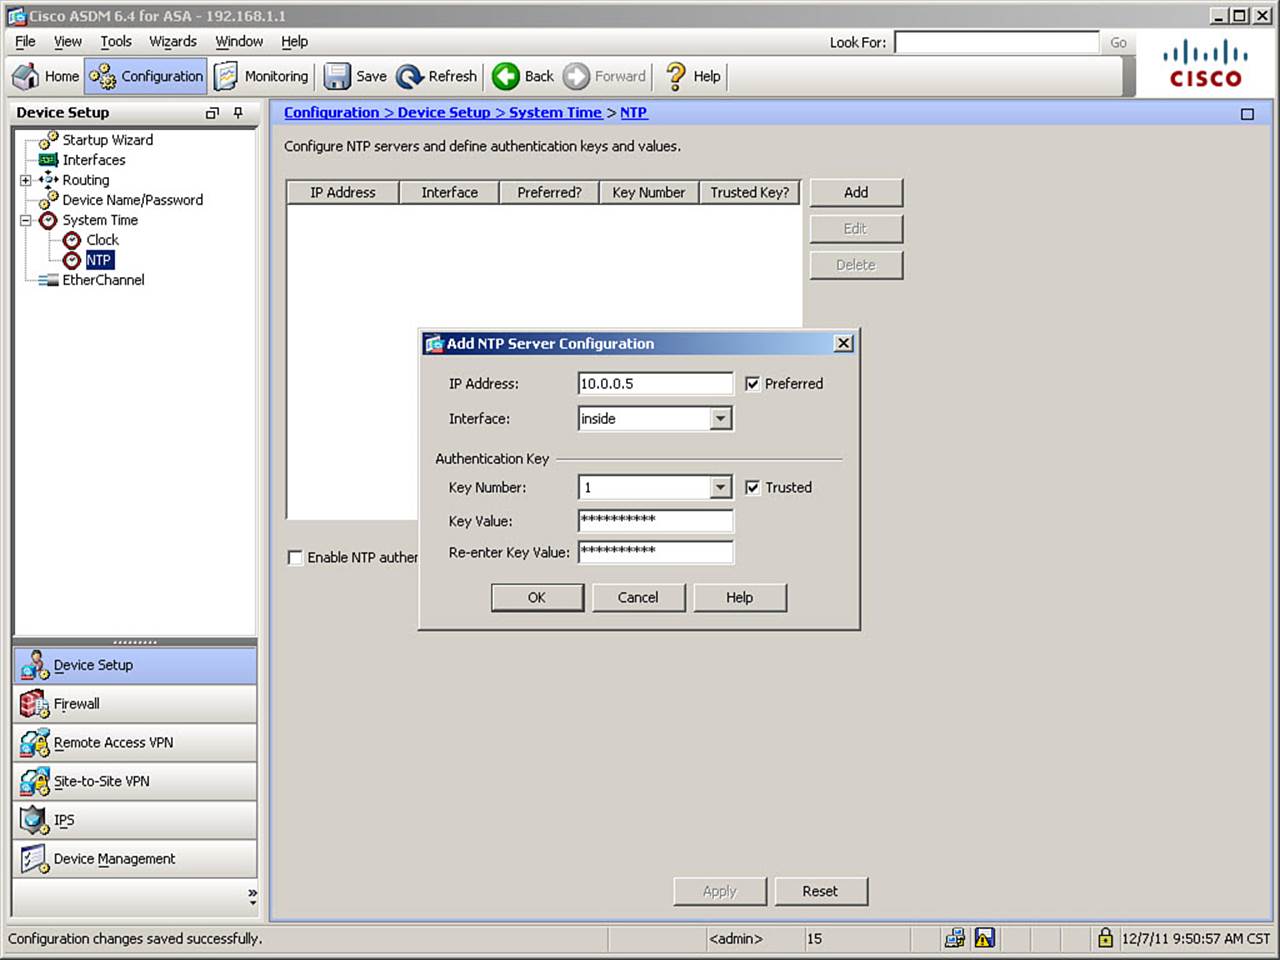
Figure 6-2. Configuring an NTP Server
Figure 6-2 shows the configuration of an internal NTP server, 10.0.0.5, which is preferred to other NTP sources and uses NTP authentication for added security. To use NTP authentication, both the server and any clients must be configured with the same trusted key number and key (effectively, a password). The key number must be included in NTP packets from the server in order for the ASA to accept synchronization to that server. The key is used to create a keyed hash for verification that NTP advertisements are from an authorized source, and have not been tampered with. You must check the Trusted check box for the configured key ID for authentication to work. You must also check the Enable NTP Authentication box at the bottom of the NTP server window (shown in the background in Figure 6-2).
Note
The ASA can act only as an NTP client, not as an NTP server.
You can configure additional NTP servers (a minimum of three associations is recommended for optimal accuracy and redundancy). Figure 6-3 shows the result of configuring 192.43.244.18 (time.nist.gov) as an additional NTP server. (It is not set as preferred and does not use authentication.) Note that you can enter only IP addresses when defining NTP servers, not logical names to be resolved to IP addresses via DNS.
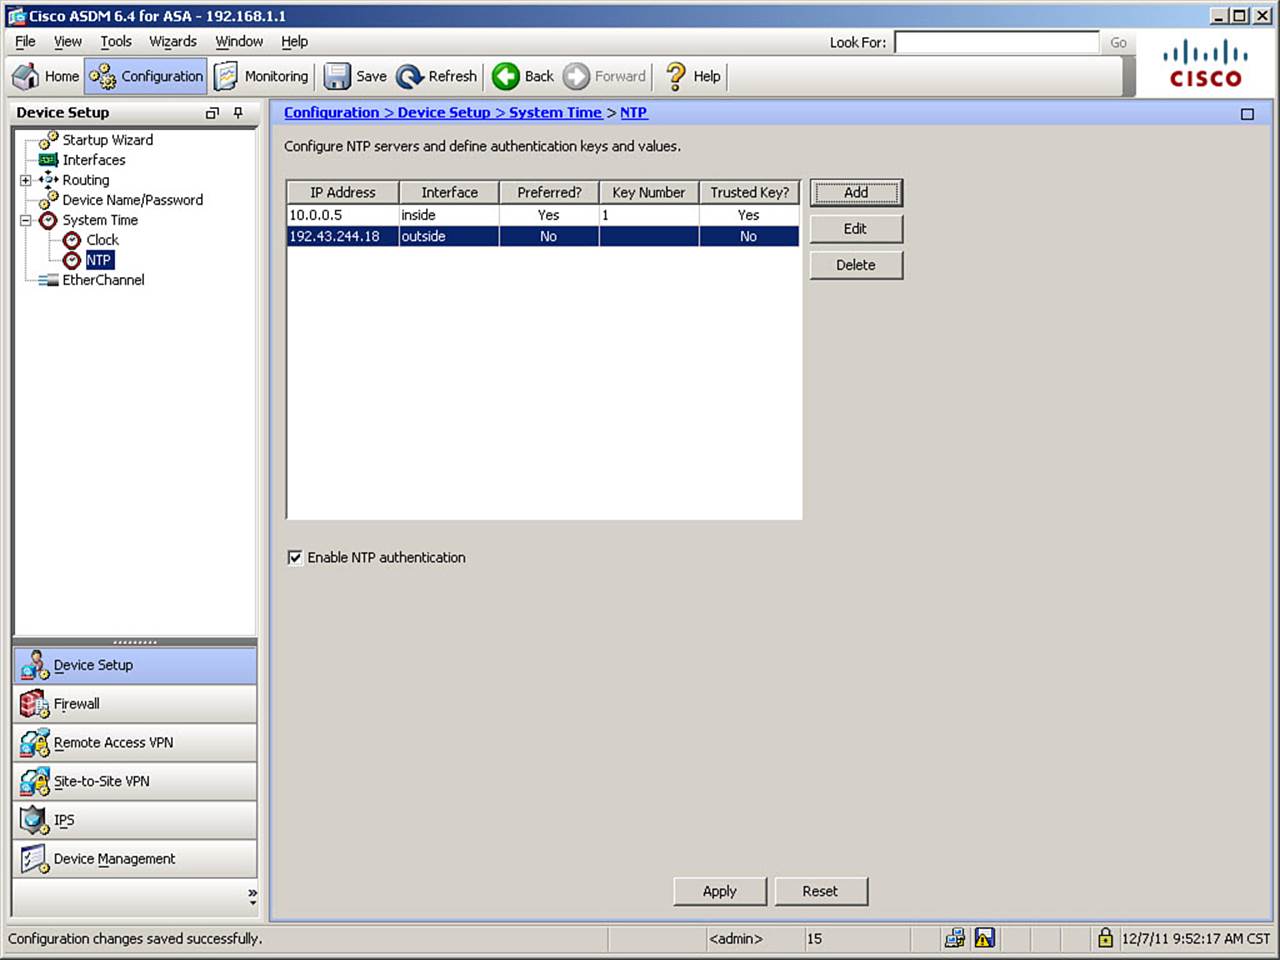
Figure 6-3. Configuring Multiple NTP Servers
Using an NTP server reachable through the outside interface, and not using authentication, is inherently subject to potential compromise, so it should be done only as a backup to an internal NTP server, if available. Note also that, because NTP Authentication is enabled on this ASA, time would not currently be accepted from the TIME.NIST.GOV server, because it is not configured for authenticated NTP messaging. Thus, the addition of this server is for example purposes only.

Time derived from an NTP server overrides any time set manually in the Clock pane. However, in the unlikely event of an extended period of unavailability of any configured NTP servers, the local clock can serve as a fallback mechanism for maintaining time on the ASA. Setting a server as preferred does not guarantee that the ASA will accept the time advertised by such a server. The ASA will choose the NTP server with the lowest stratum number and synchronize to that server. A stratum number indicates the distance from the reference clock, so a lower stratum number implies that a server is more reliable than others with a higher stratum number. The atomic clock at NIST, for instance, is considered stratum 0. If several servers have similar accuracy, the preferred server is used. If another server is significantly more accurate than the preferred server, however, the ASA uses the more accurate one.
The CLI commands generated by the changes made are as follows:
ntp server 10.0.0.5 key 1 source inside prefer
ntp server 192.43.244.18 source outside
ntp authenticate
ntp authentication-key 1 md5 UEB34mid@#9C
ntp trusted-key 1
If you are configuring the ASA from the CLI, you can enter these commands directly in global configuration mode.
Note that if you set the time zone using ASDM, the use of Daylight Saving Time (DST) is automatically enabled, if appropriate, with the correct date and time parameters for the selected time zone. To alter the start and end dates of DST, should they be incorrect, you would need to make the change from the CLI.
The ntp server command defines a server to be used as a time source by the ASA. This command sets the server IP address, authentication key number (if used), source interface, and whether or not it is a preferred server.
To enable authentication with an NTP server, you must use the ntp authenticate command from global configuration mode. The ntp authentication-key command ties the key number to the specific key used to create an MD5 keyed hash for source validation and integrity check. For NTP authentication to succeed, any key ID to be accepted by the ASA must be defined as trusted. This is done using the ntp trusted-key command.
Verifying System Time Settings
System time can be verified using two commands, show clock and show ntp associations. Both have an optional keyword of detail. Example 6-1 shows the use of both the standard and detailed version of the show clock command.
Example 6-1. Verifying System Time with show clock
FIREWALL# show clock
10:03:16.309 CST Wed Dec 7 2011
FIREWALL# show clock detail
10:03:55.129 CST Wed Dec 7 2011
Time source is NTP
UTC time is: 16:03:55 UTC Wed Dec 7 2011
Summer time starts 02:00:00 CST Sun Mar 11 2012
Summer time ends 02:00:00 CDT Sun Nov 4 2012
As shown in the example, using the detail keyword with the show clock command adds information on the time source, and the local time zone DST information. Using show clock detail also adds the display of UTC time, as a non-local reference. (This is a recent change and was not the case in earlier versions of the OS.) Note the source of NTP in this example.
Example 6-2 shows the use of the show ntp associations command, which displays the configured NTP server and whether the ASA is successfully synced.
Example 6-2. Verifying System Time with show ntp associations
FIREWALL# show ntp associations
address ref clock st when poll reach delay offset disp
*~10.0.0.5 0.0.0.0 4 87 1024 377 2.5 -0.23 1.8
-~192.43.244.18 .ACTS. 1 147 1024 377 41.5 -1.08 16.5
* master (synced), # master (unsynced), + selected, - candidate, ~ configured
Managing Event and Session Logging
The ASA supports a full audit trail of system log messages that describe its activities and security events. The two major classifications of events are system events, such as resource depletion, and network events, such as denied sessions or packets. These messages are used to create log files, which can be filtered and sent to a number of different destinations for storage, display, or analysis.
Figure 6-4 provides a graphical illustration of the ASA logging subsystem, showing the two major event classifications as sources, and the eight possible destinations.
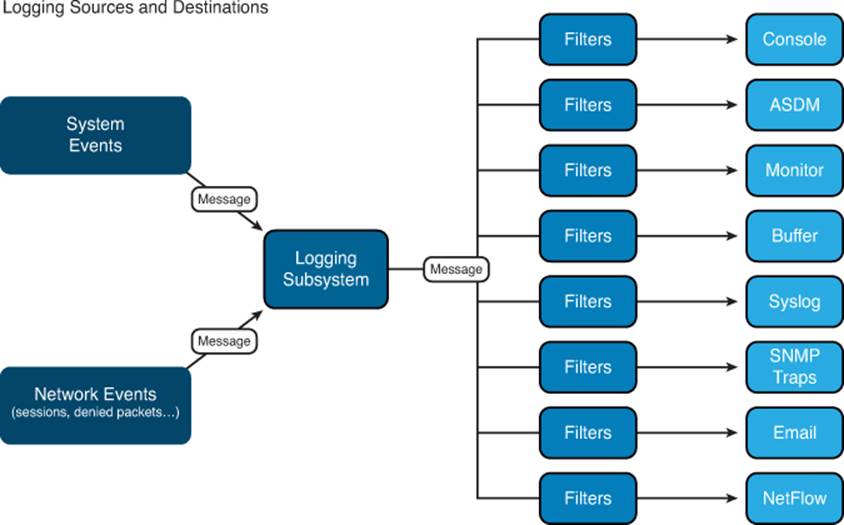
Figure 6-4. ASA Logging Subsystem
The ASA supports sending log messages to the following destinations:
• Console: The ASA console, a low-bandwidth serial connection to which messages can be sent for display on a console CLI session. This mode is useful for limited debugging, or in production environments with limited traffic or a lack of centralized management tools.
• ASDM: The ASDM graphical user interface, which provides a powerful real-time event viewer useful for troubleshooting issues or monitoring network activity.
• Monitor: Telnet or SSH administrative sessions. This mode is useful to receive real-time debugging information when troubleshooting.
• Buffered: The internal in-memory buffer on the ASA. Although useful for storage and analysis of recent activity, the internal buffer is limited in size, and it is not persistent across appliance reboots. The buffer can optionally be archived to an external FTP server or to the ASA’s internal flash memory.
• Host: Remote syslog servers, using the standard syslog protocol. Use the logging host command in conjunction with the logging trap command to define both a destination server and a logging level.
• SNMP: Remote network management servers, using the standard Simple Network Management Protocol (SNMP) Trap to send event messages. This mode is configured with the snmp-server enable traps syslog command, rather than directly with a logging destination command.
• Mail: Remote email systems, using the standard Simple Mail Transfer Protocol (SMTP) to send event messages to a defined SMTP server, or set of SMTP servers.
• Flow-export-syslogs: Remote NetFlow collectors, using the standard NetFlow v9 protocol to send event messages to the defined collector.
NetFlow Support
Cisco NetFlow efficiently provides a key set of services for IP applications, including network traffic accounting, usage-based network billing, network planning, security, denial-of-service monitoring capabilities, and network monitoring. NetFlow provides valuable information about network users and applications, peak usage times, and traffic routing.
The basic output of NetFlow is known as a flow record. Several different formats for flow records have existed as NetFlow has evolved and matured. The current version of NetFlow formatting is known as NetFlow version 9. The ASA supports providing NetFlow Secure Event Logging (NSEL), beginning with version 8.2(1). NSEL allows specific, high-volume, traffic-related events to be exported from the ASA in a more efficient and scalable manner than that provided by standard syslog logging. You may use any NetFlow v9–capable collector to receive ASA NetFlow data.
The ASA implementation of NSEL is a stateful, IP flow tracking method that exports only those records that indicate significant events in a flow. In stateful flow tracking, tracked flows go through a series of state changes. NSEL events are used to export data about flow status, and are triggered by the events that cause state changes. Examples of events that are tracked include flow-create, flow-teardown, and flow-denied (excluding flows that are denied by EtherType ACLs, which are discussed in Chapter 12, “Using Transparent Firewall Mode”). Each NSEL record has an event ID and an extended event ID field, which describe the flow event.
The ASA supports multiple NetFlow export destinations and can therefore store its Net-Flow information on multiple NetFlow collectors.
For a detailed discussion on ASA NetFlow event generation, consult “Cisco ASA 5500 Series Implementation Note for NetFlow Collectors, 8.2,” at www.cisco.com/en/US/docs/security/asa/asa82/netflow/netflow.html.
Logging Message Format
Most ASA messages generated by the logging subsystem are simple text messages that conform to a particular message format, as demonstrated here:
Jan 5 2011 09:27:16 FIREWALL : %ASA-6-725002: Device completed SSL handshake with
client management:192.168.1.108/49287
This message consists of the following:
• An optional timestamp (disabled by default)
• An optional device-id (disabled by default), which can include the interface name, IP address, hostname, context name, or a custom string up to 16 characters, if configured
• A message identifier (%ASA-6-725002 in the example), which identifies the device type (ASA), the message severity level (6, Informational), and the event message number (725002)
• The message text (Device completed SSL handshake...)
Additional data may be added to the message, depending on its destination. For example, a time stamp and hostname may be added for the syslog destination.
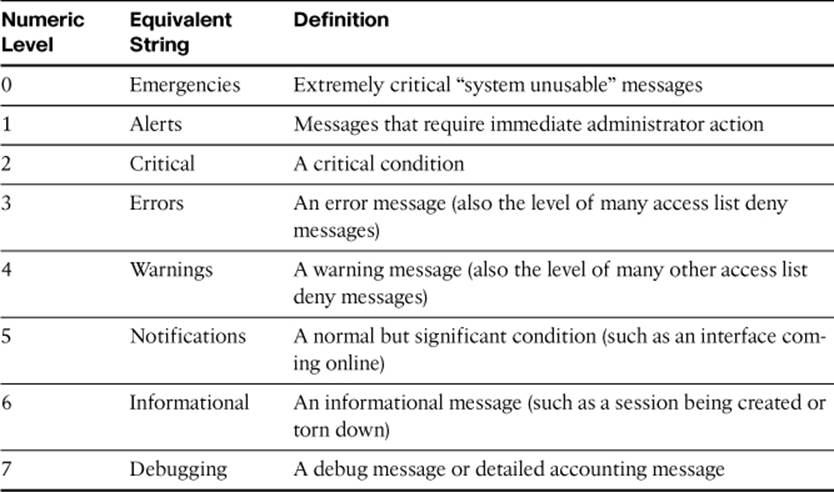
Message Severity
Each log message is assigned a severity level that indicates its relative importance. Lower numbers are of higher severity than higher numbers. Possible number and string values for message severity are shown in Table 6-2.
Table 6-2. Message Severity Levels
Note
Take care in setting the severity level of messages being sent to various destinations, particularly the console. Too low a severity (a high number), when coupled with a lot of traffic, can severely impact system performance, or potentially exhaust system resources, and make it difficult or impossible to regain access to the device CLI. It is important to remember that the ASA will send all messages of the selected level and all higher severity (lower number) messages, not just messages of the configured level.
Configuring Event and Session Logging
Configuring event and session logging consists of some or all of the following tasks:
• Globally enabling system logging and configuring global logging properties
• Optionally, disabling logging of specific messages
• Optionally, changing the severity level of specific messages
• Optionally, configuring message event filters that will govern which system messages to send to particular destinations
• Configuring event destinations and specifying message filters that apply to each of those destinations
Configuring Global Logging Properties
To globally enable system logging and set general logging properties, navigate in ASDM to Configuration > Device Management > Logging > Logging Setup. The Logging Setup pane opens, as shown in Figure 6-5. In this pane, you can set several global logging properties.
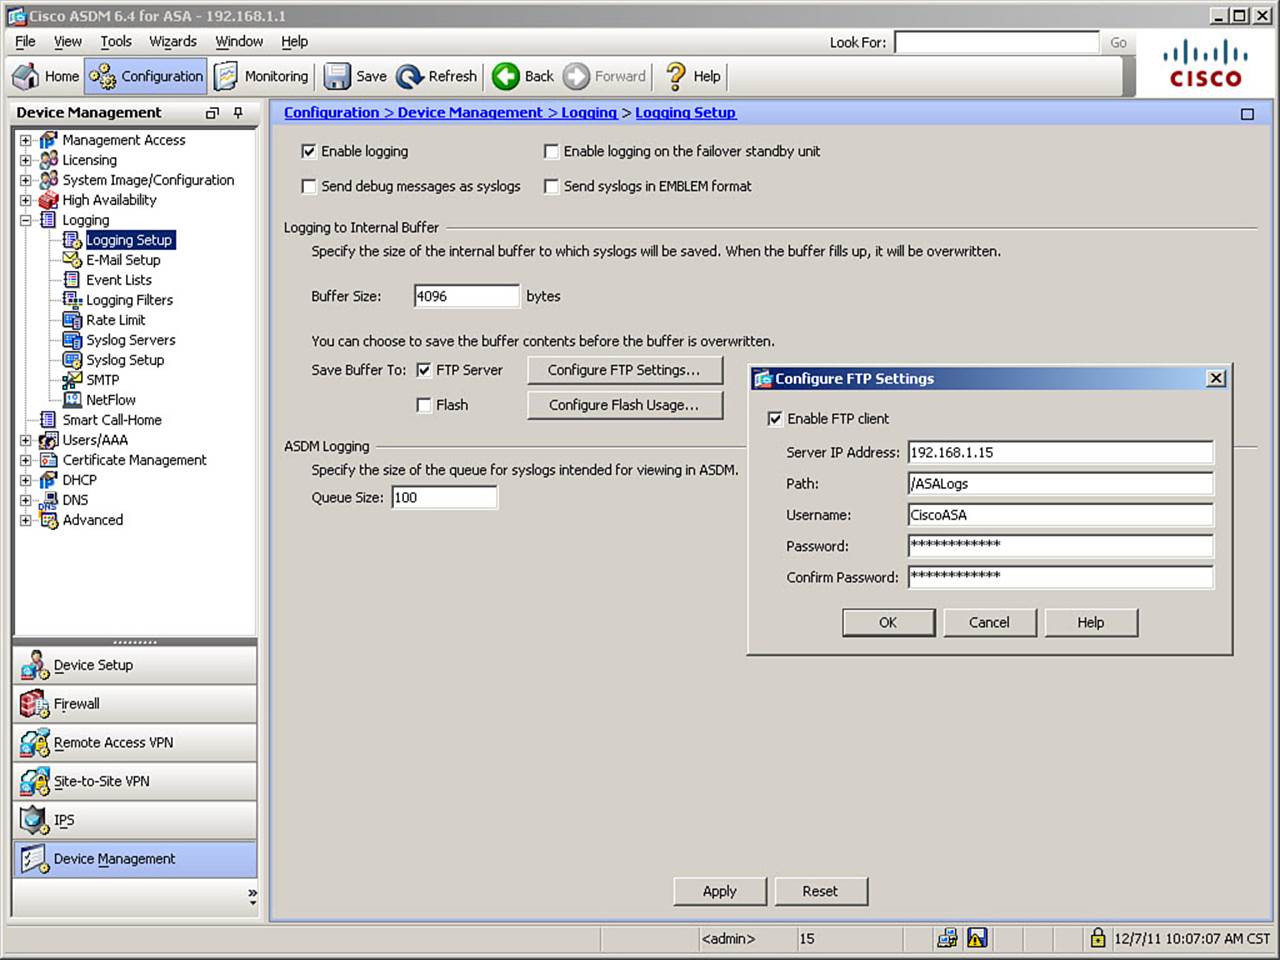
Figure 6-5. Setting Global Logging Parameters
In Figure 6-5, the Enable Logging check box is selected. This is necessary because, by default, all logging on the ASA is disabled. Options within this same pane, none of which are selected in the figure, are as follows:
• Enable logging on the failover standby unit: Check this box to enable logging for a standby ASA, if one exists. By default, if this box is not checked, only severity level 1 messages are available on the standby unit (severity level 1 messages on the standby unit are related to failover events). Failover configurations are discussed in Chapter 14, “Deploying High Availability Features.”
• Send debug messages as syslogs: Check this box to redirect all debug output to system logs. By default, debug output is not included in system log messages. Checking this box redirects debug messages to logs as syslog message 711001, with severity level 7. Use care with this option because it can generate a tremendous amount of logging information, depending on what is being debugged.
• Send syslogs in EMBLEM format: Check this box to enable Cisco EMBLEM format for all log destinations other than syslog servers. EMBLEM format is designed to be consistent with the Cisco IOS format. Many event management solutions will not recognize EMBLEM format messages, however. It is used primarily for the CiscoWorks Resource Manager Essentials (RME) Syslog Analyzer.
In Figure 6-5, the Buffer Size setting is left at the default of 4096 bytes (valid sizes are from 4096 to 1,048,576 bytes). This pertains to the internal buffer, maintained in memory. When this buffer gets full, it is overwritten in circular fashion, with each new message overwriting the oldest message in the buffer. If you do not want to lose information to these overwrites, there are two options for preserving buffered log messages: sending the buffer contents to an FTP server or saving them to internal flash memory. In Figure 6-5, the check box for FTP Server is checked, and the Configure FTP Settings button has been clicked, opening the Configure FTP Settings dialog box, seen on the right side of the figure.
To enable saving of buffer contents to an FTP server, in the Configure FTP Settings dialog box, check the Enable FTP Client check box and configure information on the FTP server address, directory path for storing buffer log contents, and a username and password used to log in to the FTP server. In Figure 6-5, a server is defined in the out-of-band (OOB) management network, at IP address 192.168.1.15; the /ASALogs directory of the FTP server is used for storage; the username is set to CiscoASA; and a password of CCNPSecurity is entered twice, the second time to verify it is entered correctly. Clicking OK would complete the FTP server definition.
If you were saving buffered log contents to internal flash memory, you would need to define two parameters: the maximum amount of flash memory to be used for storing log information, and the minimum free space to be preserved in flash memory. Selecting this option creates a directory named “syslog” on the device disk on which messages are stored.
Finally, Figure 6-5 leaves the default queue size of 100 for messages retained in the ASDM log buffer. The ASDM log buffer is a different buffer than the internal log buffer.
Once the FTP server window is completed and saved, clicking Apply in the Logging Setup pane will send the new settings to the ASA.
The CLI commands generated by the changes made are as follows:
logging enable
logging ftp-bufferwrap
logging ftp-server 192.168.1.15 /ASALogs CiscoASA CCNPSecurity
If you are configuring the ASA from the CLI, you can enter these commands directly in global configuration mode.
Two other settings that are global for syslog messages are the syslog Facility Code and whether messages carry a time stamp when sent by the ASA. These settings are not made in the same pane in which the other settings are made.
To modify these settings, navigate to Configuration > Device Management > Logging > Syslog Setup. This pane is shown in Figure 6-6. In the Syslog Format area, at the top of the pane, you can set the Facility Code and enable/disable time stamps.
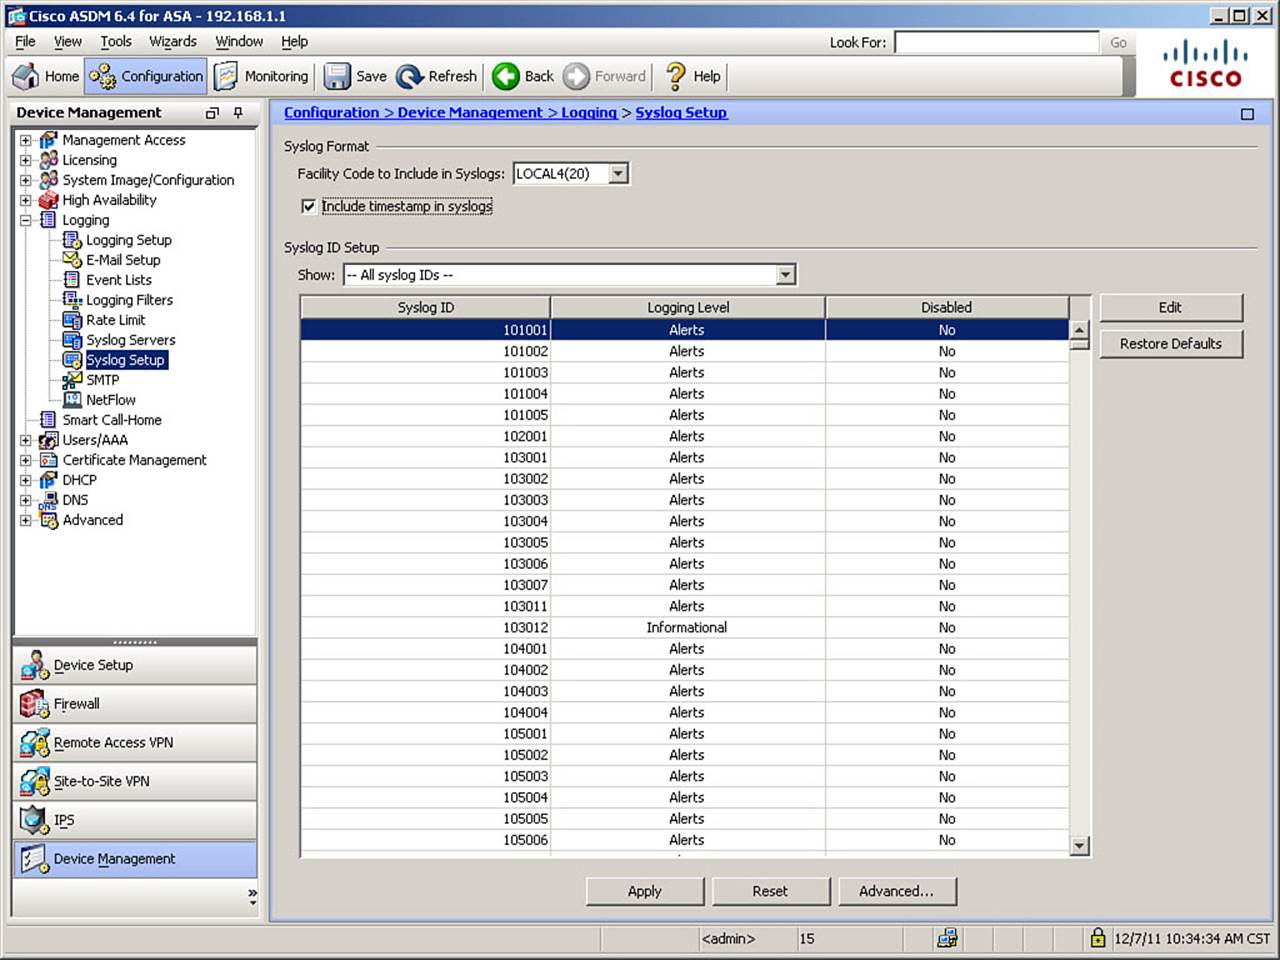
Figure 6-6. Syslog Setup Pane
In Figure 6-6, the default syslog Facility Code of LOCAL4(20) is left unchanged. Syslog Facility Codes are included in messages sent to syslog servers. The codes are used by syslog servers to organize event messages as they arrive. Eight logging facilities are available, LOCAL0 to LOCAL7 (if set in decimal only, 16–23). LOCAL4(20) is the default setting for all ASA syslog events. In the figure, the check box to enable time stamps is selected. Click Apply to send the change to the ASA.
The CLI command generated by the change is as follows:
logging timestamp
If you are configuring the ASA from the CLI, you can enter this command directly in global configuration mode.
Altering Settings of Specific Messages
Sometimes, a default system message does not contain any useful information, or the default severity assigned to a message is not suitable to a particular environment. In such cases, you can tune individual system messages by globally suppressing them or by altering their default severity. You tune these aspects in the Syslog Setup pane, too.
The Syslog ID Setup area comprises most of the Syslog Setup pane. The first option available is to change what message IDs are displayed in the main portion of this area. The default option is to display all syslog message IDs. Other options available in the Show drop-down list are as follows:
• Disabled syslog IDs: Display only message IDs that have been explicitly suppressed.
• Syslog IDs with changed logging: Display only message IDs with severity levels that have been changed from their default values.
• Syslog IDs that are suppressed or with a changed logging level: Display all message IDs that have been modified by being suppressed or having their default level modified.
To modify a specific message ID, still in the Syslog Setup window, click the message to select it, and then click the Edit button to open the Edit Syslog ID Settings dialog box, shown in Figure 6-7. In this dialog box, you can suppress (disable) a particular message or change its configured logging level.
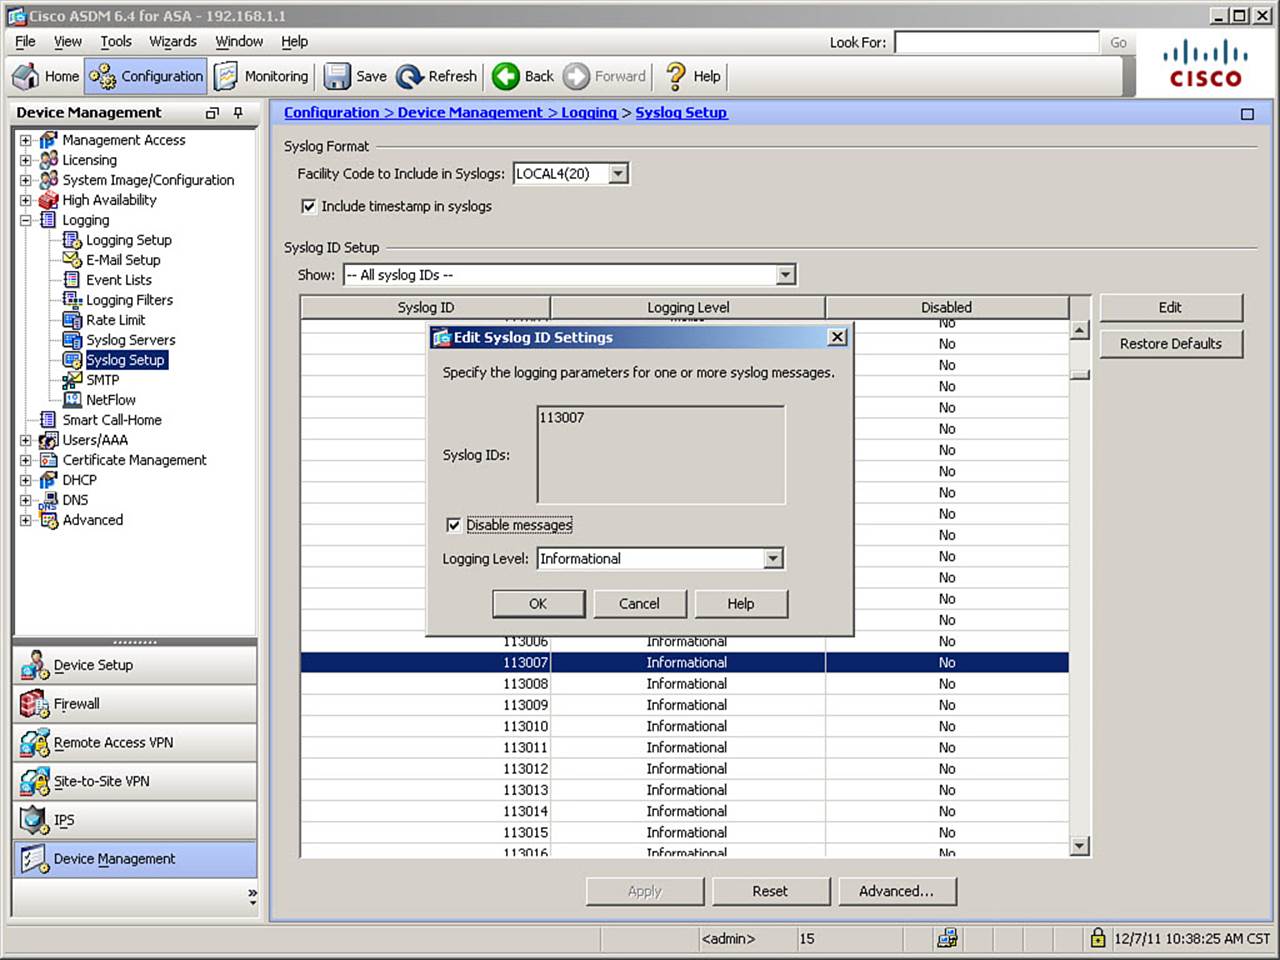
Figure 6-7. Disabling a Message ID
In Figure 6-7, message ID 113007 has been selected for editing, and the Disable Messages check box has been selected. Clicking OK will configure global suppression of this particular message. Message 113007 is generated when a locked user account is unlocked by an administrator, and in this scenario, it has been decided that this information is unimportant—what is important is to log when an account is locked for excessive incorrect password attempts.
Note
There is a difference between suppressing a message ID and filtering it (covered later). If a message ID is disabled, the ASA will not generate that particular message to any logging destination. Filtering a message is a means of not delivering a particular message to a particular logging destination, but the ASA still generates the message, and can deliver it to other destinations.
There are times when you may want to log a particular message ID, but alter the severity level at which it is reported. You do so from the same Edit Syslog ID Settings dialog box. Click a message to select it, and then click the Edit button. Figure 6-8 shows an example of modifying the severity level of a syslog message.
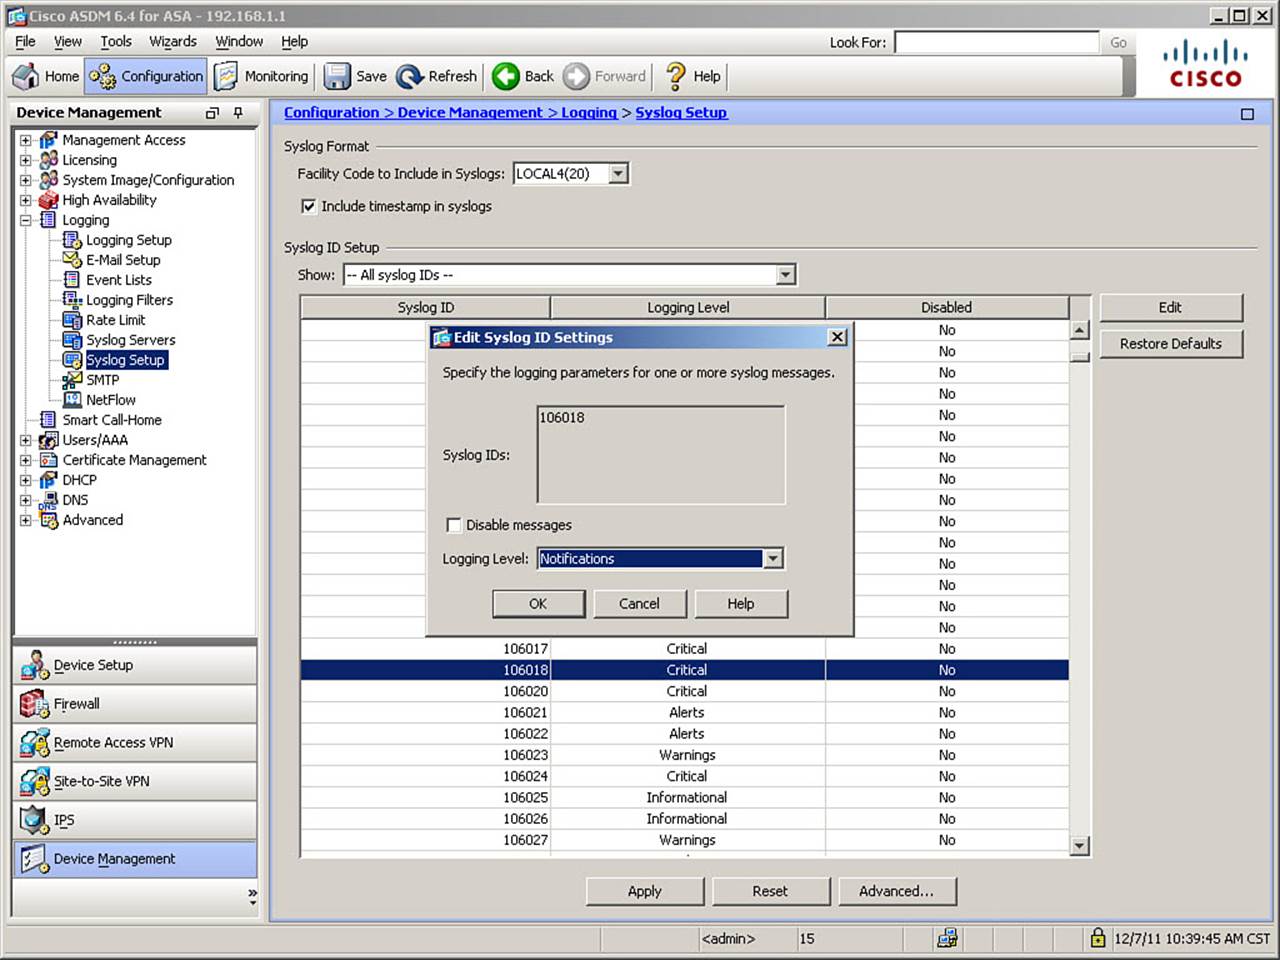
Figure 6-8. Modifying a Syslog Message Severity Level
In Figure 6-8, message ID 106018 has been selected for modification. As you can see in the background, the default setting for this message ID is Critical (2). This particular message is generated if an ICMP packet is denied by an outgoing access list. Because outgoing filters do not exist by default on the ASA, this means an administrator explicitly configured the ASA to block such packets. However, given that an internal user generating a ping that is dropped by the ASA would generate such a message, in this scenario it has been decided to alter the level from Critical to Notifications (5). Click OK to complete the modification of this message, and then click Apply to send these changes to the ASA.
The CLI commands generated by the changes made are as follows:
logging message 106018 level Notifications
no logging message 113007
If you are configuring the ASA from the CLI, you can enter these commands directly in global configuration mode.
Configuring Event Filters
For each logging destination, you can configure filters (known as event lists) that determine which subset of all generated messages will be forwarded to that destination. You can configure such filters based on the following:
• Event (message) severity only: For example, by specifying a maximum severity of 4 (Warnings), all messages with a severity of Warnings or higher (severity levels 0 through 4) would be forwarded to the logging destination. All messages with severities of 5 through 7 would be dropped.
• Event classes: All system messages are grouped into event classes based on the subsystem that created the messages. For example, there is an event class for the Authentication subsystem.
• A combination of event class and event severity: For example, all Authentication messages with a maximum severity of 4 (Warnings).
• The message ID: Each message has a unique message ID. Therefore, you can select individual messages for forwarding to particular logging destinations.
Event lists are reusable groups of messages, which can be selected by a combination of event class and severity, or individually by message ID. When you create an event list, you can apply that same event list to multiple logging destinations, thus simplifying the configuration of message filters.
To create an event list, navigate to Configuration > Device Management > Logging > Event Lists. Click Add to create a new event list. This opens the Add Event List dialog box, which is shown in Figure 6-9. You assign a unique name to each event list, and then configure the parameters that define your desired filter.
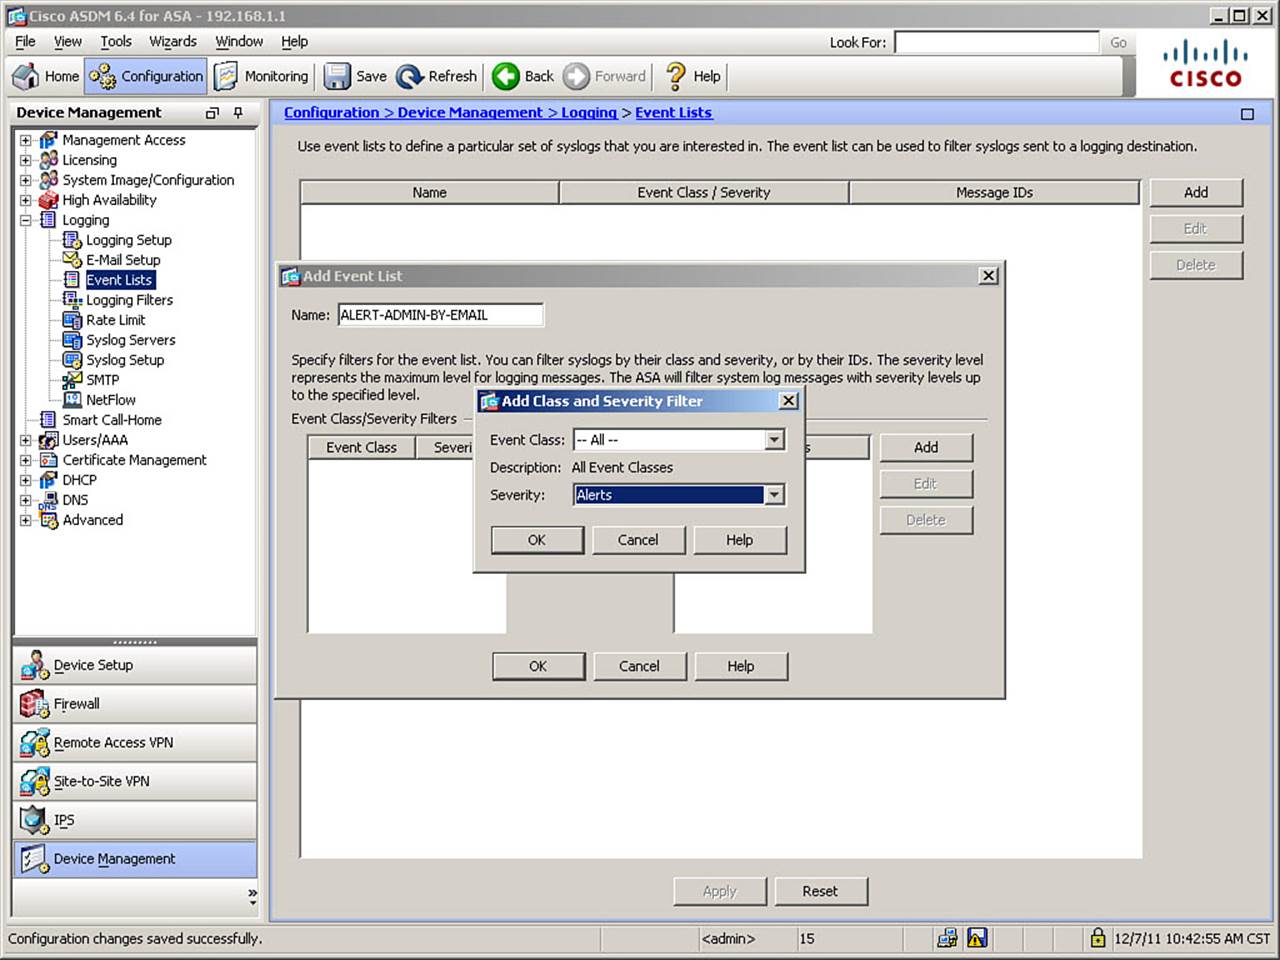
Figure 6-9. Configuring an Event List
In Figure 6-9, a name of ALERT-ADMIN-BY-EMAIL has been defined. The Add button in the Event Class/Severity Filters area was clicked to open the Add Class and Severity Filter dialog box, in which a specific class and severity can be defined. In this example, All Event Classes has been selected, and a severity level of Alerts (1) has been selected. In this scenario, it has been determined that any syslog message of severity 0 or 1 should generate an immediate email notification to an administrator (setup of the SMTP log destination is covered in the “Email” section of this chapter). This event list will accommodate such a configuration. Click OK twice to complete the configuration of the event class filter and the creation of the event list. Finally, click Apply to send the configuration to the ASA.
The CLI command generated by the change is as follows:
logging list ALERT-ADMIN-BY-EMAIL level Alerts
If you are configuring the ASA from the CLI, you can enter this command directly in global configuration mode.
Configuring Individual Event Destinations
After you have enabled logging globally, optionally set up global logging properties, and optionally configured event lists, you can configure the ASA to send logging messages to one or more logging destinations. For each destination, you specify a filter that will select a subset of generated messages to be forwarded to that destination.
To configure logging destinations and filters, navigate to Configuration > Device Management > Logging > Logging Filters. In the Logging Filters pane that opens, you can activate logging to any of the eight available destinations and configure filters that determine which generated messages are forwarded to each.
Internal Buffer
The first example will be to configure the internal buffer as a logging destination. In the Logging Filters pane, select the Internal Buffer destination, and click Edit to open the Edit Logging Filters dialog box, as shown in Figure 6-10.
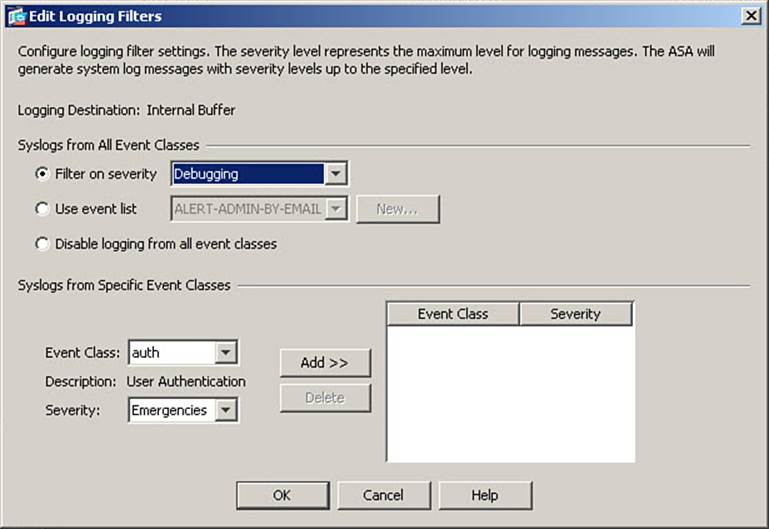
Figure 6-10. Configuring the Internal Buffer Logging Filter
As you can see in Figure 6-10, you have several options for determining the logging filter for a particular log destination. To create a filter that applies to all event classes, choose one of the following radio buttons in the top, Syslogs from All Event Classes area:
• Filter on severity: Filters system log messages by their severity level, and allows you to specify the level of messages that should be forwarded to the log destination. In Figure 6-10, this choice is selected, and the filter level is set to Debugging, which sends all system messages to the destination being configured (internal buffer). Depending on traffic, this particular choice can overwhelm the destination service (especially the console) or the user attempting to analyze events. You should carefully consider the impact of your choice before applying the configuration to the ASA. If you wish to log all messages from all severity levels, it is strongly recommended that you do so to the internal buffer, and never to the console. In fact, it is generally recommended to leave console logging disabled.
• Use event list: Filters system log messages based on a previously defined event list, and allows you to specify which event list to use, or create a new event list.
• Disable logging from all event classes: Disables all forwarding of system messages to the destination being configured.
You can also create specific logging filters in this dialog box by entering the filter criteria in the Syslogs from Specific Event Classes area. This is equivalent to creating an event list for just this specific logging destination.
Click OK to complete the configuration of a logging filter to the internal buffer logging destination. Click Apply to send the modified settings to the ASA.
The CLI command generated by the change made is as follows:
logging buffered Debugging
If you are configuring the ASA from the CLI, you can enter this command directly in global configuration mode.
Note
A full log buffer can be saved to flash memory or transmitted to an FTP server for retention, as discussed in the earlier section, “Configuring Global Logging Properties.”
ASDM
Cisco ASDM contains a powerful event viewer that you can use to display a real-time message feed from the ASA. This event viewer is particularly useful when you are troubleshooting ASA software and configuration issues, or when you are monitoring real-time activity over the ASA.
You enable logging to the internal ASDM event viewer by configuring the ASDM logging destination and specifying a logging filter, in the same manner as for other logging destinations. Messages are forwarded to ASDM over the HTTPS session and are displayed in a log viewer window at the bottom of the ASDM Home page.
This example assumes that the ASDM logging destination has been configured to receive messages from all event classes, containing a maximum severity level of Informational. Click Apply to send the modified settings to the ASA.
The CLI command generated by the change made is as follows:
logging asdm Informational
If you are configuring the ASA from the CLI, you can enter this command directly in global configuration mode.
To use the full event viewer functionality, start the viewer by navigating in ASDM to Monitoring > Logging > Real-Time Log Viewer, selecting a logging level, and clicking the View button. The ASDM Real-Time Log Viewer opens in a dedicated window and starts displaying log messages as selected by the configured message filter. Figure 6-11 shows an example of the Real-Time Log Viewer.
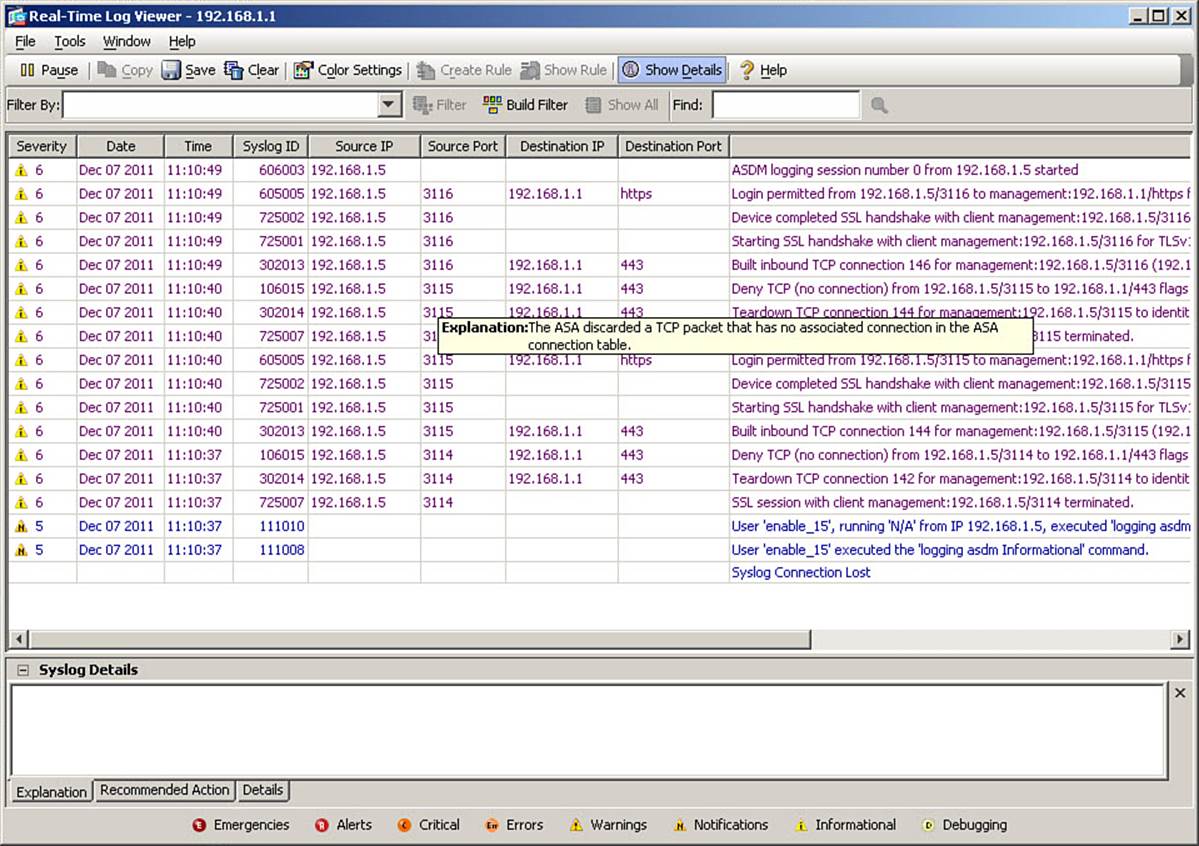
Figure 6-11. Real-Time Log Viewer
In the Real-Time Log Viewer, you can set additional keyword-based filtering by entering a keyword in the Filter By field in the log viewer toolbar. Above this field are toolbar icons that can be used to pause, resume, and clear the event display, copy individual messages to the clipboard, and set message colors.
The log viewer interface also allows you to select a particular message, and invoke various options by right-clicking it. You can, for example, show or even create specific access rules based on log messages. For example, if a log message showed that a packet had been denied by an access rule, you could immediately create a rule to allow such packets in the future. Or, for all session-related messages, you could right-click the interface and select Show Access Rule to jump immediately to the table of access rules and to the exact rule permitting or denying this particular connection.
At the bottom of the Real-Time Log Viewer, a context-sensitive help window shows message descriptions, recommends actions to administrators, and offers full message details. This is the only tool in ASDM that provides an administrator with such detailed explanations of log messages. Additionally, the suggestion of remedies is an invaluable aid in rapid troubleshooting and resolution of identified problems.
You can also use ASDM to view a snapshot of the current appliance internal log buffer, by navigating to Monitor > Logging > Log Buffer, selecting a maximum severity level, and clicking View.
Syslog Server(s)
Probably the most common destination to configure for log messages is one or more syslog servers in your network. Configuring the ASA to send log messages to syslog servers enables you to easily archive logs, limited only by the available disk space on the remote syslog server. You can specify up to 16 syslog servers as log destinations. Further, the ASA can deliver syslog messages to servers using either UDP (standard syslog) or TCP (specialized for firewall syslog) as transport protocols.
Prior to ASA software version 8.0, all syslog messages were transferred in clear text. Beginning with software version 8.0(2), support was introduced for secure logging, using a SSL/TLS transport layer between the ASA and syslog servers. Certificate-based authentication and encrypted data transfer help mitigate security threats to the logging service when messages are crossing an untrusted network. To use secure logging, you must set up an SSL/TLS connection between the ASA and a remote syslog server supporting SSL/TLS. Also, the SSL syslog server must be added to the ASA as a certificate trust point. Configuration of secure logging is not covered in this book, but more information can be obtained from the Cisco ASDM User Guide available at Cisco.com.
When an ASA is configured to use TCP-based syslog to at least one syslog server, by default, the ASA will drop all traffic attempting to go through the appliance if the TCP-based syslog server is down or unable to record further messages in its logs (that is, it is out of disk space). This feature is designed to prevent traffic from traversing an ASA that is unable to log security events, a common requirement in high-security networks. Use this feature if your local security policy requires this level of risk control.
Note
Even if an ASA is dropping all transit traffic because of the failure of TCP-based syslog connectivity, it still allows traffic terminating at the ASA itself. For instance, you can still SSH into the ASA and execute commands that allow you to determine this as the cause of all traffic being dropped.
To configure (non-SSL/TLS) syslog servers as log destinations, navigate to Configuration > Device Management > Logging > Syslog Servers. In the Syslog Servers pane, click Add to define a new syslog server log destination. The Add Syslog Server dialog box opens, as shown in Figure 6-12. Here, you define which interface the ASA uses to reach the server, the server’s IP address, whether to use TCP or UDP as the transport protocol, the destination port on the server, and, optionally, the use of EMBLEM format (only if using UDP) or SSL/TLS encryption (only if using TCP).
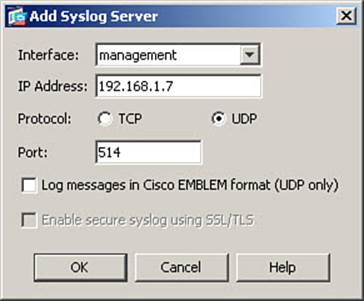
Figure 6-12. Adding a Syslog Server Destination
In Figure 6-12, a syslog server is defined, reachable through the management interface (in the OOB management network), using IP address 192.168.1.7, and standard UDP-based syslog transport to port 514 (the default UDP port; the default TCP port is 1470). Click OK to complete the configuration of this server.
If you are using TCP-based syslog, you have the option to allow user traffic to traverse the ASA even when the TCP syslog server is down. To do so, in the main Syslog Servers pane, check the Allow User Traffic to Pass when TCP Syslog Server Is Down check box and then click Applyto send the new server definitions to the ASA. Selecting this option generates the logging permit-hostdown command in the ASA configuration.
After you have defined one or more syslog servers, you must configure a logging filter for the destination syslog servers, before the ASA actually sends event messages to the configured servers. You do this the same way as covered previously. This example assumes that you have configured a logging filter to send all event classes, with a maximum severity of Warnings (4) to the logging destination of syslog servers.
The CLI commands generated by the changes made are as follows:
logging trap Warnings
logging host management 192.168.1.7
If you are configuring the ASA from the CLI, you can enter these commands directly in global configuration mode.
In most cases, using remote syslog servers as the primary method of reporting events to a central repository is recommended, as syslog is a widely supported and easily deployed logging protocol. Because UDP transport does not guarantee delivery, and should be used only over trusted or OOB networks, you should consider the use of TCP-based syslog when operating over a congested network subject to frequent packet loss. Also, consider the use of SSL/TLS if you are using untrusted (“sniffable”) transport networks between the ASA and the syslog server.
Sending log messages to an email system is useful, as it provides a simple way to integrate event notification with many messaging solutions, including simple email, mobile email, and SMS or pager systems, using appropriate gateways.
Configuring the ASA to send email notifications is similar to configuring syslog servers, in that you must first define how the ASA reaches intended recipients (sender and receiver addresses, SMTP servers, and so on), and then create a logging filter instructing the ASA to use email as a logging destination and what events to send.
To configure email sender and recipient addresses, navigate to Configuration > Device Management > Logging > E-Mail Setup. Enter a source email address in the provided field, and then click the Add button to add recipient information. Figure 6-13 shows an example, where a source address of ASA@CiscoPress.CCNP has been entered in the Source E-Mail Address field.
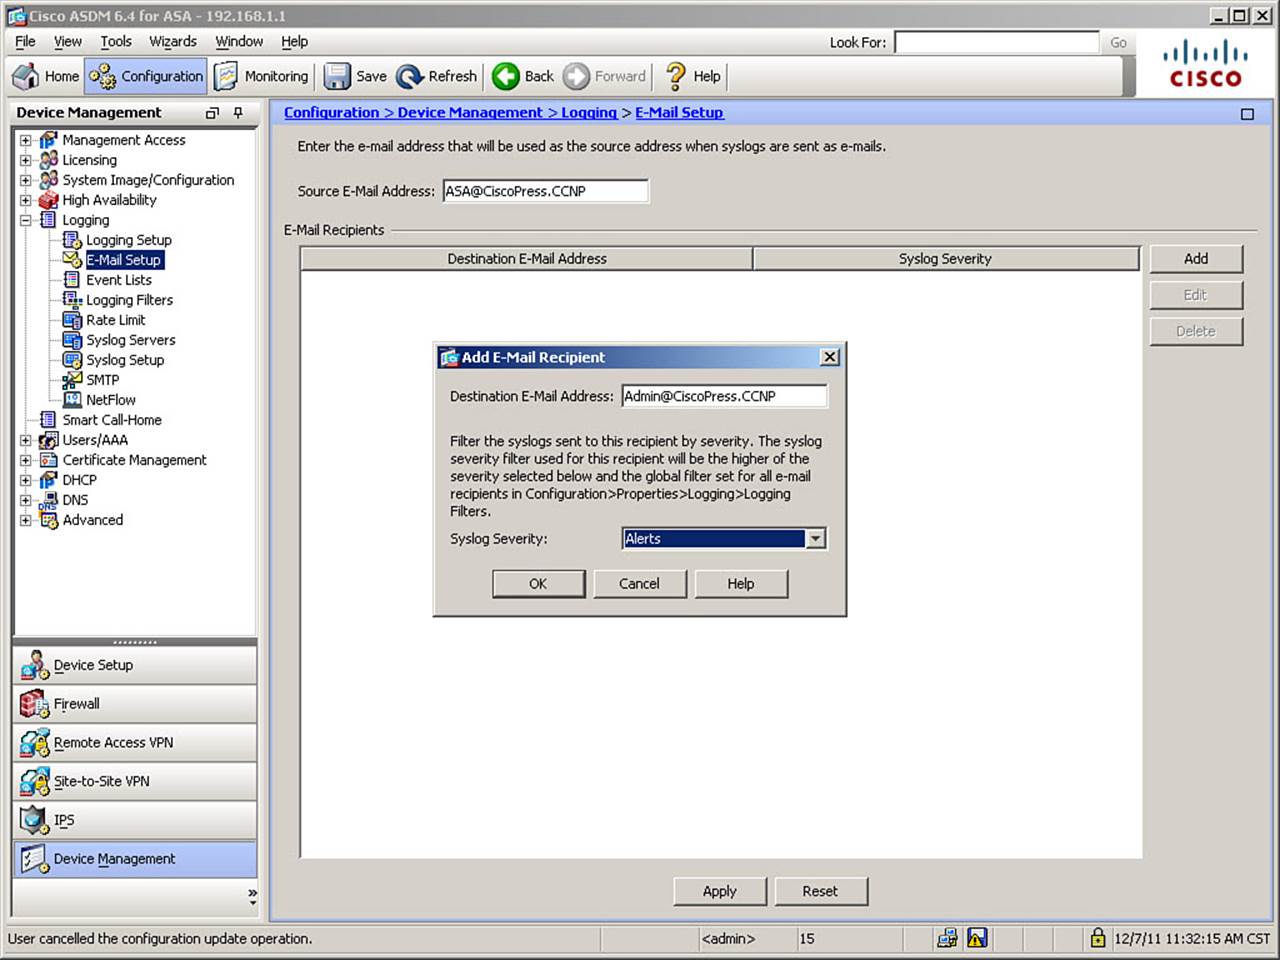
Figure 6-13. Adding an Email Recipient
In the Add E-Mail Recipient dialog box, the Destination E-Mail Address field has been completed with Admin@CiscoPress.CCNP as the recipient. Finally, the maximum severity of event messages that should generate an email to this recipient is configured in the Syslog Severity field, as Alerts.
After you have configured recipients, you must configure the ASA with information about the SMTP server(s) through which the ASA will send email notifications. To do this, navigate to Configuration > Device Management > Logging > SMTP. The SMTP pane, as shown in Figure 6-14, is where you configure a primary and, optionally, secondary SMTP server address for the ASA to send email through.
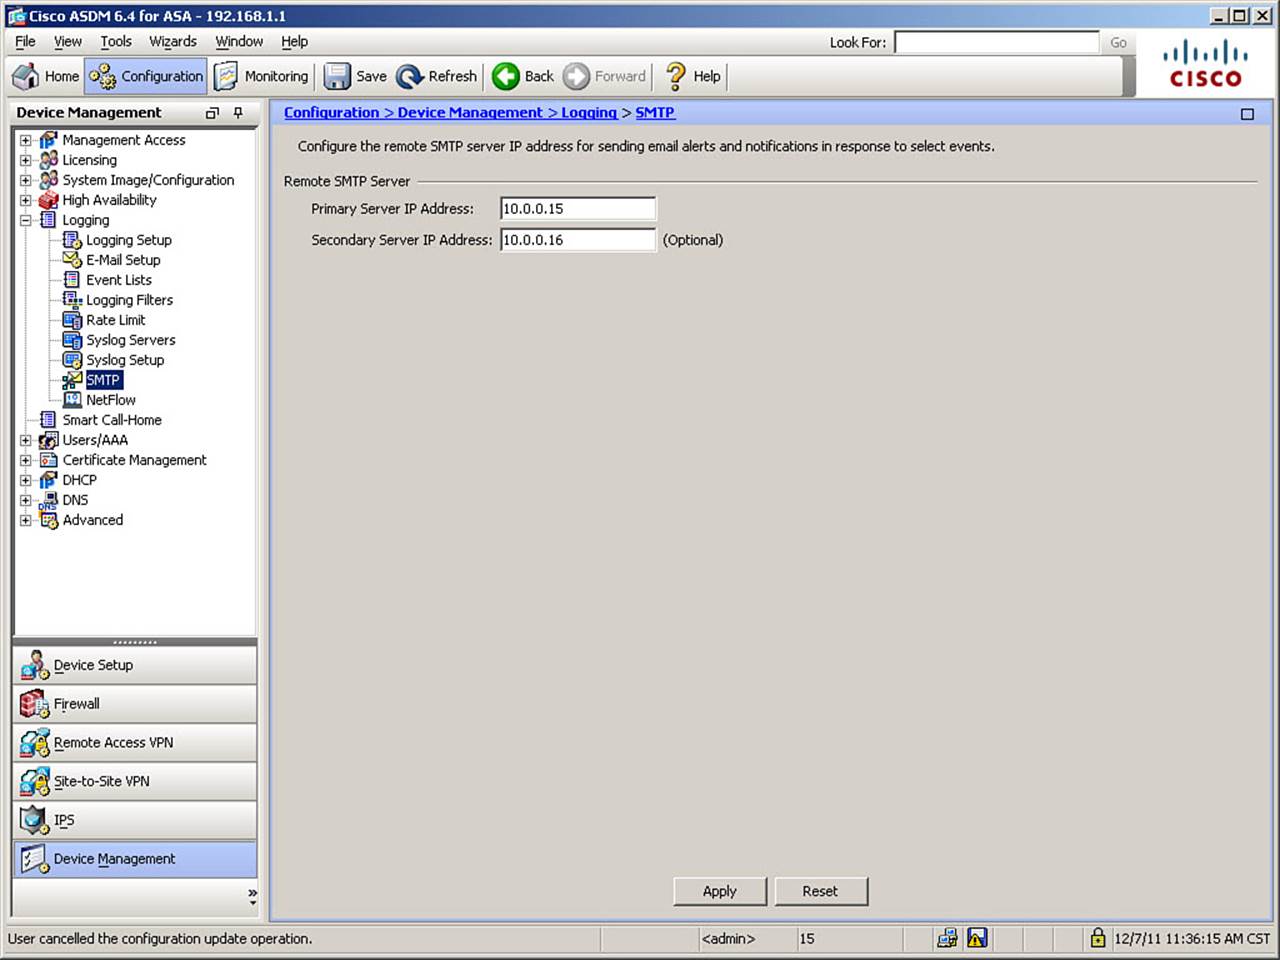
Figure 6-14. Defining SMTP Servers
Figure 6-14 shows an example where two SMTP servers on the inside network—10.0.0.15 as primary and 10.0.0.16 as secondary—are configured.
After configuring sender and recipient addresses and SMTP servers, you configure email notifications just like any other logging destination. In this example, however, rather than simply setting a maximum severity for all event classes, Figure 6-15 shows the configuration of a logging filter for the E-Mail destination, using the previously created event list named ALERT-ADMIN-BY-EMAIL.
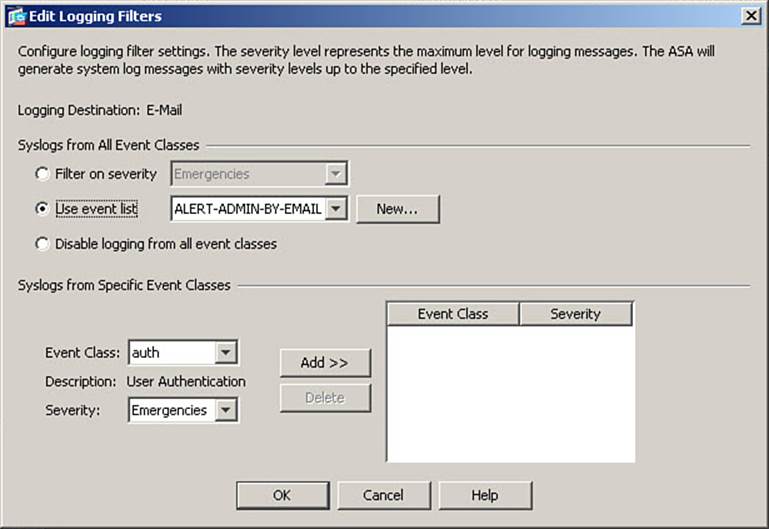
Figure 6-15. Configuring Email Logging Filter
It is important to limit the amount of notifications sent via email, so use this destination only for exceptional events of critical importance. In this example, recall that event list ALERT-ADMIN-BY-EMAIL was defined with a maximum severity level of Alerts (1). This example might be overly restrictive, so use an appropriate level based on your local security policy.
Click OK in the Edit Logging Filters dialog box, and then click Apply in the Logging Filters pane, to complete the configuration of email as a logging destination.
The CLI commands generated by the changes made are as follows:
logging mail ALERT-ADMIN-BY-EMAIL
smtp-server 10.0.0.15 10.0.0.16
logging from-address ASA@CiscoPress.CCNP
logging recipient-address Admin@CiscoPress.CCNP level Alerts
If you are configuring the ASA from the CLI, you can enter these commands directly in global configuration mode.
NetFlow
To configure NSEL in the ASA, you must first configure NetFlow export destinations by defining the location of NetFlow collectors. To do so, navigate to Configuration > Device Management > Logging > NetFlow. In the NetFlow window, shown in Figure 6-16, you can configure NetFlow destinations, and also some options that might impact performance with NetFlow export enabled.
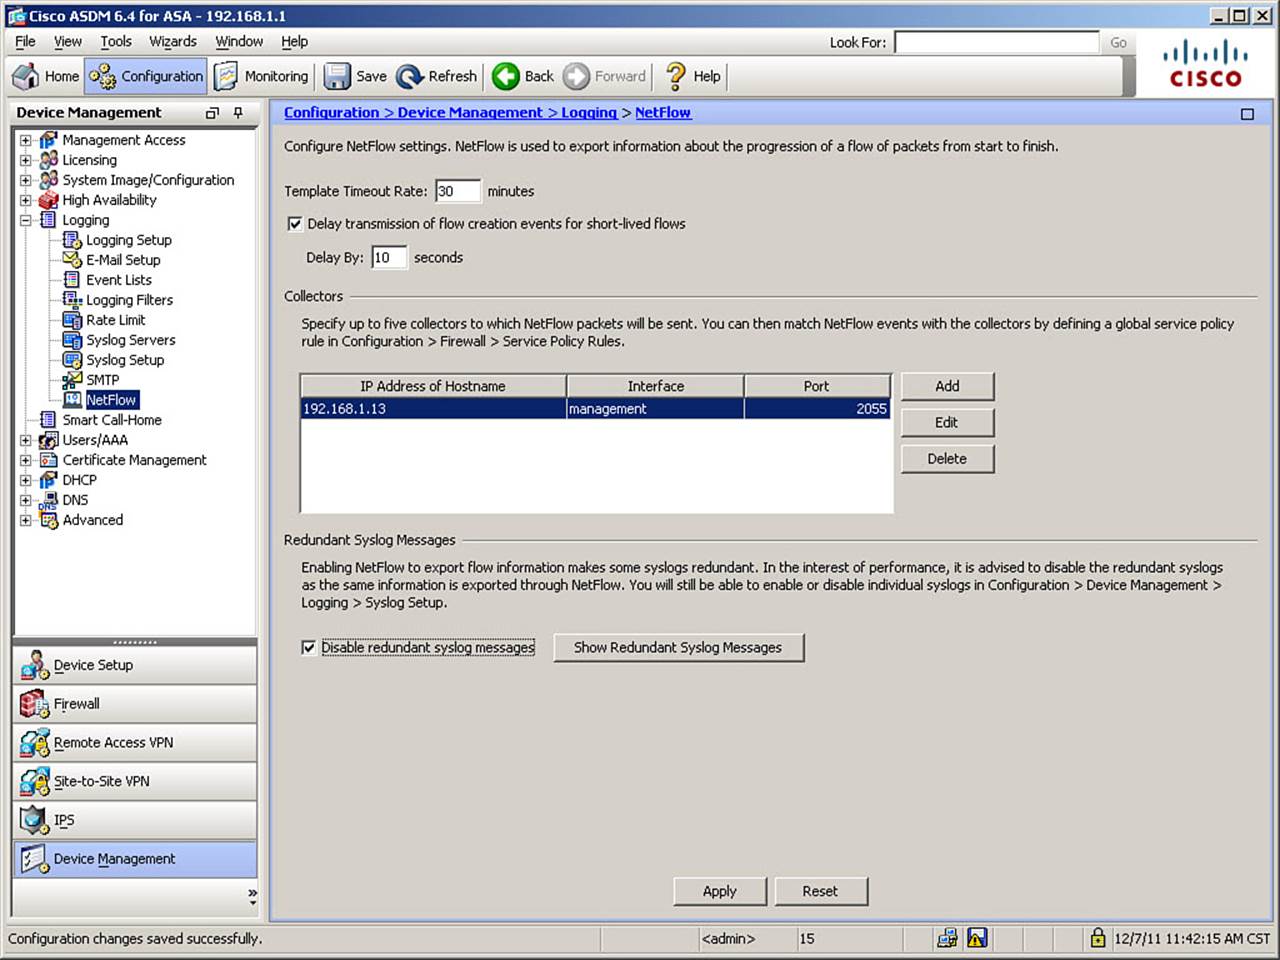
Figure 6-16. Configuring NetFlow Settings
In Figure 6-16, a NetFlow collector has been defined through the management interface, with IP address 192.168.1.13, and the default NetFlow port of UDP 2055. Additionally, the option Delay Transmission of Flow Creation Events for Short-Lived Flows has been enabled, and the delay set to 10 seconds. Finally, because use of NetFlow makes some syslog messages redundant, the option to Disable Redundant Syslog Messages has been selected. (Neither of the preceding options is enabled by default.)
Defining flows to be exported to NetFlow collectors is unique among logging destinations. With NSEL, you can granularly select which flows through the ASA are exported using NetFlow, based on flow properties such as IP addresses, protocols, and ports. You configure this selection using Cisco Modular Policy Framework (MPF) service policies, which are covered in Chapter 9, “Inspecting Traffic.”
The CLI commands generated by the changes made are as follows:
no logging message 106015
no logging message 106023
...output omitted...
flow-export delay flow-create 10
flow-export destination management 192.168.1.13 2055
If you are configuring the ASA from the CLI, you can enter these commands directly in global configuration mode.
Telnet or SSH Sessions
To enable the ASA to display system event messages in Telnet or SSH sessions, you can configure a logging filter for the Telnet and SSH Sessions destination, like any other destination. This generates the logging monitor command in the ASA’s configuration file. Although these messages are sent to the Telnet or SSH session, the user must also use the terminal monitor command to see the messages displayed in their remote terminal session.
Verifying Event and Session Logging
Only a few commands are used to verify the configuration and functionality of logging. Example 6-3 shows the use of the show logging command to see a summary of the logging configuration, along with any internally buffered log messages.
Example 6-3. Verifying Logging
FIREWALL# show logging
Syslog logging: enabled
Facility: 20
Timestamp logging: enabled
Standby logging: disabled
Debug-trace logging: disabled
Console logging: disabled
Monitor logging: disabled
Buffer logging: level debugging, 5548 messages logged
Trap logging: level warnings, facility 20, 2145 messages logged
Logging to management 192.168.1.7
History logging: disabled
Device ID: disabled
Mail logging: list ALERT-ADMIN-BY-EMAIL, 0 messages logged
ASDM logging: level informational, 802 messages logged
Dec 07 2011 16:10:13 FIREWALL : %ASA-7-609001: Built local-host
management:192.168.1.15
Dec 07 2011 16:10:23 FIREWALL : %ASA-7-609002: Teardown local-host
management:192.168.1.15 duration 0:00:10
...output omitted...
The output shows several important pieces of information, which are shaded for easy reference. Logging is globally enabled. Time stamps are enabled. Console logging is disabled, as it should be on production devices, except in rare circumstances. For each configured destination, you can see the number of logged messages. Additionally, if you are using a TCP syslog server, the connection from the ASA to the syslog server will be shown.
At the end of the configuration summary, you will see the full contents of the internal log buffer. This output is truncated in the example.
To verify NetFlow export operation, use the show flow-export counters command, as shown in Example 6-4. A non-zero packets sent count will prove that the ASA is sending NetFlow v9 records to the configured NetFlow collector.
Example 6-4. Verifying NetFlow Export
FIREWALL# show flow-export counters
destination: management 192.168.1.13 2055
Statistics:
packets sent 14327
Errors:
block allocation failure 0
invalid interface 0
template send failure 0
no route to collector 0
Implementation Guidelines
When implementing event and session logging, consider the following implementation guidelines:
• Depending on the requirements of your local security policy, some events can be deleted, archived, or partially archived. This depends on the amount of event history available for online retrieval, the need for long-term reporting, and regulatory and legal requirements, which might require a specific retention period or, conversely, not allow certain types of personal information to be stored in an event database or event archives. Therefore, you should create a log retention policy that will enable you to store appropriate logs for an appropriate amount of time.
• It is generally best to log too much information as opposed to too little. Gathering too much information typically is harmless, unless it causes performance or capacity issues, whereas gathering too little information might prevent you from having information necessary to respond effectively to incidents or to meet regulatory requirements.
• Tune logging to exclude duplicate information. Some events might be redundant or not needed in your local environment. Make sure you analyze the event feed thoroughly to review and confirm these duplicates.
• Use multiple destinations for logging, to increase reliability of the information gathered.
• Try to handle boundary conditions, such as excessive event rate and lack of storage space, appropriately and without interruptions to service. Monitoring should be regularly tested and validated for accuracy, to ensure that changes to the system have not disabled desired functionality.
• Synchronize the ASA clock to a reliable time source, to ensure trustworthy logging of time stamps.
• Transport events over the network using reliable and secure channels, if possible. Use a trusted network, or at least authenticate and verify the integrity of messages. To ensure reliability and no packet loss, consider using TCP transport for log messages to remote servers.
• To provide the most scalable remote event export in high-connection-rate environments, consider using NetFlow instead of syslog to report on network events.
• Limit access to the ASA logging subsystem (so that logging cannot be disabled without detection), the central event database, and long-term event archives. Implement mechanisms to prevent or detect changes to stored event data.
• Consider using an appliance-based logging server, especially when output from multiple sources will be collected, or where real-time event parsing along with event correlation might be required.
Troubleshooting Event and Session Logging
The recommended troubleshooting task flow when troubleshooting remote logging is as follows:
• For remote logging, verify mutual connectivity between the ASA and the server using ping, traceroute, or similar tools.
• If you are using a TCP syslog server with a fail-closed policy (the default), use the show logging command (shown in Example 6-3) to determine if the host is reachable.
• Use show logging on the ASA to determine the configuration of the event source. Verify logging filters to ensure that they are not filtering out desired event messages. You can also use the capture command to verify that events are actually being sent through ASA interfaces. On the remote log destination, view stored logs and consider running a network analyzer to determine if events are arriving properly at the destination.
• Finally, there could be a performance problem at the ASA that prevents it from sending messages to a destination. Use show logging queue (detailed in the next section) to examine the logging queue length and any drops, to determine if such a problem exists.
Troubleshooting Commands
Oversubscription of the logging queue indicates local performance issues. If you encounter oversubscription, consider logging less, rate-limiting a logging destination, tuning the logging queue, or using alternative logging methods such as NetFlow.
Example 6-5 shows the use of the show logging queue command to look for performance issues. A large number of discarded event messages is indicative of a logging subsystem performance problem.
Example 6-5. Verifying Logging Queue Performance
FIREWALL# show logging queue
Logging Queue length limit : 512 msg(s)
412366 msg(s) discarded due to queue overflow
10 msg(s) discarded due to memory allocation failure
Current 216 msg on queue, 512 msgs most on queue
The logging queue is where messages wait to be dispatched to their destinations. This queue is 512 messages long by default, but can be made larger or smaller. Rare drops due to queue overflow might not be indicative of a serious problem. Frequent drops due to queue overflow is a sign that the ASA is not able to keep up with the number of messages being generated, and cannot dispatch them all to their intended destinations. If this occurs, first consider extending the size of the logging queue, using rate-limiting or more efficient logging methods (such as NetFlow), and reducing the amount of information being logged.
You can use the logging queue command to extend the size of the queue. Valid values range from 0 to 8192 messages. The following command doubles the size of the queue from the default value of 512 to a new value of 1024:
FIREWALL (config)# logging queue 1024
If a TCP-based syslog server is being used as a destination, with a fail-closed policy, and the server is not reachable, this will be indicated in the output of the show logging command, and will also appear as a recurring syslog message in an available destination (such as Internal Buffer or ASDM):
Dec 07 2011 18:49:56 FIREWALL : %ASA-3-414003: TCP Syslog Server management:
192.168.1.7/1470 not responding, New connections are denied based on logging
permit-hostdown policy
Exam Preparation Tasks
As mentioned in the section, “How to Use This Book,” in the Introduction, you have a couple of choices for exam preparation: the exercises here, Chapter 17, “Final Preparation,” and the exam simulation questions on the CD-ROM.
Review All Key Topics
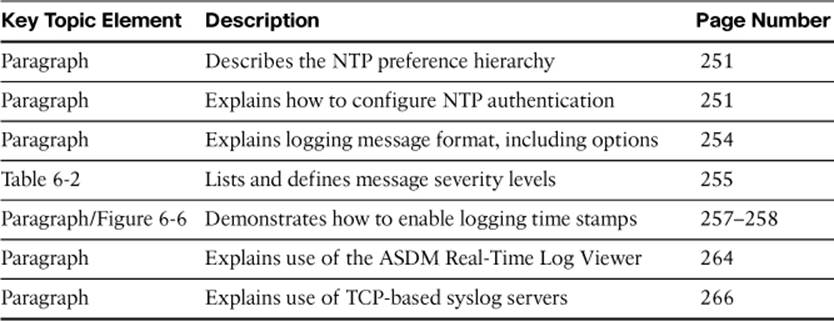
Review the most important topics in this chapter, noted with the Key Topic icon in the outer margin of the page. Table 6-3 lists a reference of these key topics and the page numbers on which each is found.
Table 6-3. Key Topics for Chapter 6
Command Reference to Check Your Memory
This section includes the most important configuration and EXEC commands covered in this chapter. It is not necessary to memorize the complete syntax of every command, but you should be able to remember the basic keywords that are needed.
To test your memory of the commands, cover the right side of Tables 6-4 and 6-5 with a piece of paper, read the description on the left side, and then see how much of the command you can remember.
Table 6-4. ASA Time-Related Commands
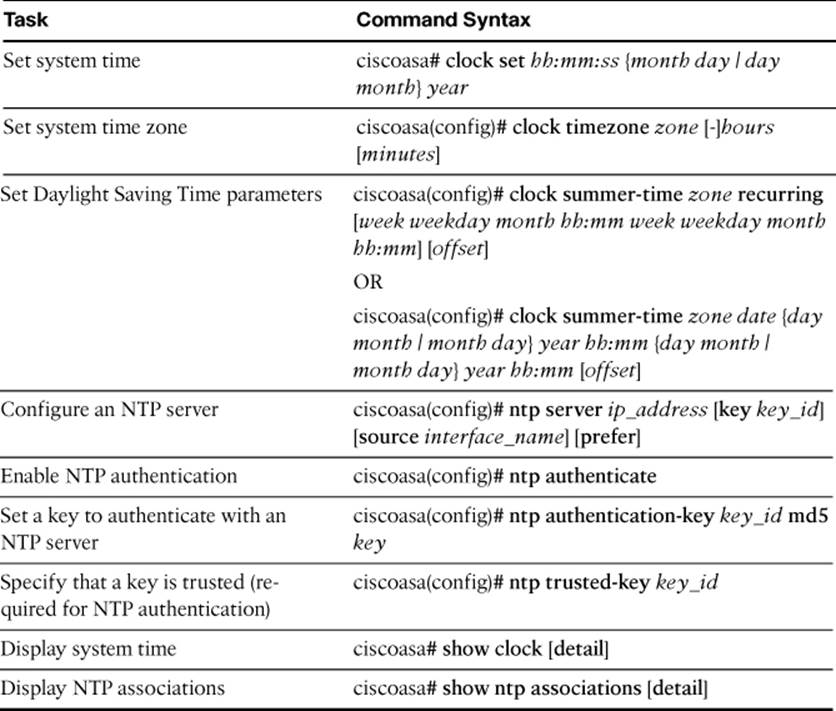
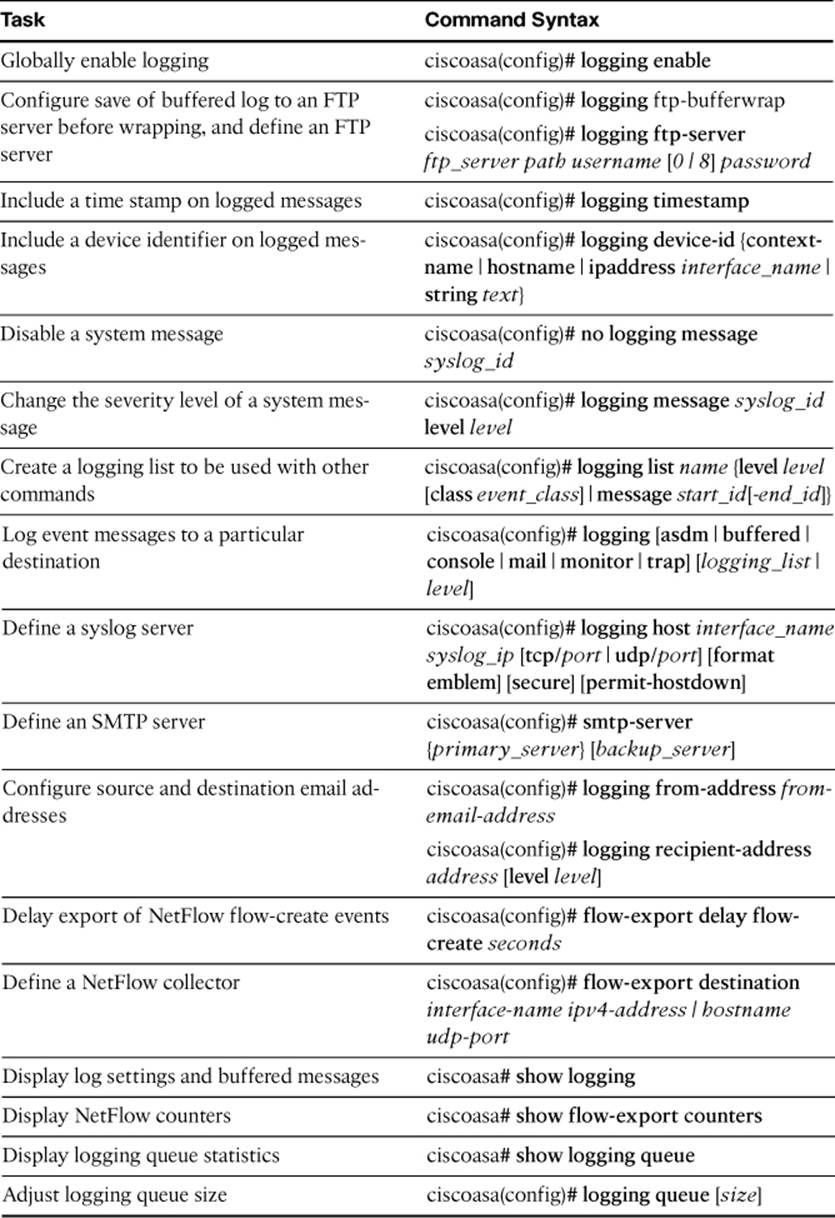
Table 6-5. ASA Logging Configuration Commands
The FIREWALL exam focuses on practical, hands-on skills that are used by a networking professional. Therefore, you should be able to identify the commands needed to configure and test an ASA feature.
All materials on the site are licensed Creative Commons Attribution-Sharealike 3.0 Unported CC BY-SA 3.0 & GNU Free Documentation License (GFDL)
If you are the copyright holder of any material contained on our site and intend to remove it, please contact our site administrator for approval.
© 2016-2026 All site design rights belong to S.Y.A.