Computer Forensics: Investigating Network Intrusions and Cybercrime (CHFI) (2016)
2
Chapter
Investigating Network Traffic
Objectives
After completing this chapter, you should be able to:
• Understand network protocols
• Understand the physical and data link layers of the OSI model
• Understand the network and transport layers of the OSI model
• Describe types of network attacks
• Understand the reasons for investigating network traffic
• Perform evidence gathering via sniffing
• Describe the tools used in investigating network traffic
• Document the evidence gathered on a network
• Reconstruct evidence for an investigation
Key Terms
Encapsulation the method of wrapping data from one layer of the OSI model in a new data
structure so that each layer of the OSI model will only see and deal with the information it needs in order to properly handle and deliver the data from one host to another on a computer network
Internet Protocol (IP) a communications protocol used for transferring data across packet-
switched networks. Part of what is known as the Internet Protocol suite (TCP/IP), it is used to
define addressing of datagram packets containing both a source and destination address to transfer the encapsulated data across multiple networks. It functions at the network layer of the OSI model and is usually found in IPv4 (a 32-bit number) or the newer IPv6 (a 128-bit number).
Local area network (LAN) a set of host machines (computers, printers, etc.) in a relatively
contiguous area, allowing for high data transfer rates among hosts on the same IP network; With
LAN addressing, each node in the LAN has a unique MAC (media access control) address assigned
to the NIC (network interface card)
Media access control (MAC) address the unique 48-bit serial number assigned to each network
interface card, providing a physical address to the host machine
2-1
2-2
Chapter 2
Network interface card (NIC) a piece of hardware used to provide an interface between the host machine and a computer network; functions at both the physical and data link layers of the OSI model
Promiscuous mode the mode of a network interface card in which the card passes all network traffic it receives to the host computer, rather than only the traffic specifically addressed to it
Case Example
Jessica, a university student, was known to be an introvert among her peers. She used to live with her father.
One day, Jessica left a note for her father mentioning that she was going to meet her old school friend and would be back by the end of the week. A week passed, but Jessica did not return. Her father, Shane, filed a missing persons report with the police. All the students who interacted with Jessica were questioned to get some clue about her whereabouts, but none of them knew where she was. Two weeks later, Jessica’s dead body was found near a dumping ground near her university campus.
An investigator was called in from a special force to investigate the case. Jessica’s interest in computers was revealed during an interview with her father. Digital forensic investigators from the special force were called in to investigate Jessica’s computer. Preliminary investigation of Jessica’s computer revealed some facts that shed some light on the case. Jessica’s system logs showed that Jessica frequented Web sites related to bondage and sex. Further investigations revealed Jessica’s e-mail address. The autologin feature was enabled on her e-mail client, so the investigators were able to get into her e-mail account. They scanned Jessica’s e-mails for clues. One e-mail address caught the attention of the investigators, as there was constant interaction with this one person. The investigators traced the e-mail service provider of the unknown person. The trace revealed that the e-mail address belonged to a man named Nichol.
The investigators analyzed Nichol’s computer after the state judiciary granted them permission to do so. They found pornography and materials related to bondage and murder on Nichol’s computer. Nichol was questioned and after long hours of investigation, he broke down and admitted to the crime.
Introduction to Investigating Network Traffic
This chapter focuses on investigating network traffic. It begins by explaining some basic networking concepts, such as network addressing schemes and the OSI model. It then moves into discussing the ways that an intruder can attack a network. The chapter also covers how an investigator can gather evidence from different parts of the network and what tools an investigator can use to gather this evidence.
Network Addressing Schemes
There are two methods of network addressing: LAN addressing and Internetwork addressing.
LAN Addressing
A local area network (LAN) is a set of host machines in a relatively contiguous area, allowing for high data transfer rates among hosts on the same IP network. With LAN addressing, each node in the LAN has a unique MAC (media access control) address assigned to the NIC (network interface card). A MAC address is a unique 48-bit serial number assigned to each network interface card, providing a physical address to the host machine.
An NIC is a piece of hardware used to provide an interface between a host machine and a computer network.
A MAC address may be one of the following types:
• Static address: This is the 48-bit unique address programmed by the Ethernet board manufacturer into the hardware of the computer. This address is permanent and changes only if the NIC changes.
• Configurable address: This type of address is programmed into the NIC during the initial installation of the hardware, and becomes static after that. A user can set this type of address through switches or jumpers on the circuit board, or through software.
• Dynamic address: This type of MAC address is obtained when the computer is powered on and connected to the network. Due to this, there are chances that a number of systems have the same address.
In LAN addressing, packets are either addressed to one node or, in the case of broadcasting, to all the nodes in the LAN. Broadcasting is often used to discover the services or devices on the network.
Internetwork Addressing
Internetwork addressing is used in a network where a number of LANs or other networks are connected with the help of routers. Each network in this Internetwork has a unique network ID or network address. Routers use
![]()
Overview of Network Protocols
2-3
these addresses when data packets are transmitted from a source to its target. Each node in the network has its own unique address known as the host address or node ID. An Internetwork address is a combination of both a network address and host address.
When a data packet is transmitted from one host to another in an Internetwork, the router does not know the host address, but it knows the network address of the network to which that host belongs. After the packet is transmitted to the correct network, the packet goes to the destination host.
OSI Reference Model
Prior to the introduction of the OSI (Open Systems Interconnection) reference model, most networks were proprietary, with different standards and protocols for different vendor-developed networks. The OSI initiative sought to standardize networking to allow for interoperability across networks.
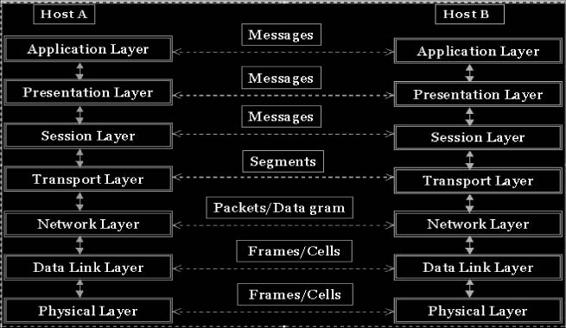
The OSI model consists of seven layers, as shown in Figure 2-1. Each layer contains a set of similar functions and provides services to the layer above it.
The OSI reference model is based on the following principles:
• Every layer has a fully defined function.
• The boundaries of the layers have been designed to reduce the flow of information in the interface.
• When an additional level of abstraction is required, then a layer is created.
• Each layer contains the functions of the international standardized protocol.
The OSI model implements a concept known as encapsulation. Encapsulation is the method of wrapping data from one layer of the OSI model in a new data structure so that each layer of the OSI model will only see and deal with the information it needs in order to properly handle and deliver the data from one host to another on a computer network.
The system that implements the protocol behavior and contains the different layers is called the protocol stack, as shown in Figure 2-1.
Overview of Network Protocols
In the seven layers of the OSI model, protocols exist in only six layers; the physical layer contains no network protocols.
The following sections describe the protocols used in these six OSI layers.
Copyright © by
All rights reserved. Reproduction is strictly prohibited
Figure 2-1 The OSI protocol stack consists of seven layers.
2-4
Chapter 2
Data Link Layer
The following are the main protocols for the data link layer:
• Point-to-Point Protocol (PPP): It is the standard for the transport of IP traffic over point-to-point links.
It consists of three main components:
1.
High-Level Data Link Control (HDLC) protocol is used by PPP to sum up the data between the
source and destination links.
2.
Link Control Protocol is used in establishing, configuring, and testing the data link connection between the source and the destination IP address.
3.
Network Control Protocols (NCPs) are used to negotiate options for network layer protocols running on top of PPP.
• Serial Line Internet Protocol (SLIP): IP packets were relayed over dial-up lines using SLIP. SLIP was replaced by PPP.
• Address Resolution Protocol (ARP): ARP is considered a part of the data link layer, even though it is a part of TCP/IP.
Network Layer
The following are the main protocols for the network layer:
• RARP (Reverse Address Resolution Protocol): RARP is a TCP/IP protocol that can allow an IP address to be changed into a physical address. Systems that do not have a disk drive will have only their hardware interface address listed in the attributes when booted. Users can discover the IP address from an external source with the help of a RARP server.
• ICMP (Internet Control Message Protocol): ICMP is an extension of IP and supports packets that have error and control messages. A common example of the ICMP protocol is the ping command in DOS.
• IGMP (Internet Group Management Protocol): IGMP is used to manage the membership of multicast groups that are available on a single network. There are many features of this protocol by which a host computer is informed about its local router.
• IP (Internet Protocol): IP is a communications protocol used for transferring data across packet-switched networks. Often paired with TCP (Transmission Control Protocol), its purpose is to send datagrams from the destination to the source.
Transport Layer
The following are the main protocols for the transport layer:
• UDP (User Datagram Protocol): UDP is a connectionless protocol that is different from TCP/IP in that it provides few error recovery services. It can broadcast datagrams over an IP network.
• TCP (Transmission Control Protocol): TCP is a main component in TCP/IP networks. The reliable, connection-oriented protocol mainly involves dealing with packets sent from one system to another. The TCP protocol enables two hosts to create a connection and exchange different types of data.
Session Layer, Presentation Layer, and Application Layer
The following are the main protocols for the session layer, presentation layer, and application layer:
• HTTP (Hypertext Transfer Protocol): HTTP is the standard used by the World Wide Web to transfer massages. This protocol defines the way in which messages are transmitted. The protocol also defines the actions browsers are required to take for various other commands.
• SMTP (Simple Mail Transfer Protocol): SMTP is the standard for sending e-mail between servers. Systems on the Internet make use of this protocol to send e-mail from one server to another.
• NNTP (Network News Transfer Protocol): NNTP is the standard protocol for distributing and recovering Usenet messages.
• Telnet: Telnet is a protocol that establishes a connection between a client and server, typically through TCP port 23.
![]()
Overview of Network and Transport Layers of the OSI Model
2-5
Copyright © by
All rights reserved. Reproduction is strictly prohibited
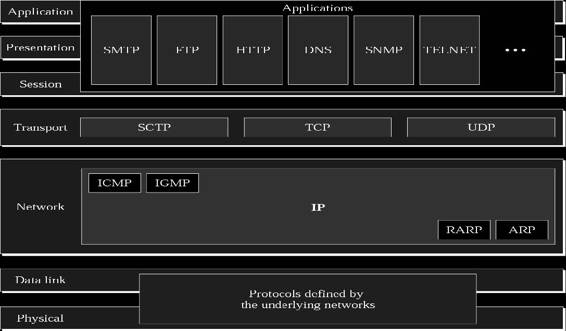
Figure 2-2 Different protocols are used in different layers in the TCP/IP model.
• FTP (File Transfer Protocol): FTP is the standard file transfer protocol in use on the Internet. This protocol works similarly to HTTP for transferring HTML files. FTP uses TCP/IP protocols to begin data transfer.
• SNMP (Simple Network Management Protocol): SNMP is used to manage networks. This protocol functions by sending messages known as PDUs (protocol data units) to all parts of the network.
• TFTP (Trivial File Transfer Protocol): TFTP is the most common form of FTP. This protocol makes use of UDP, which has no security attributes. Servers often use this protocol to assist in booting workstations that are not equipped with a disk drive.
Figure 2-2 shows how all of these protocols fit into the TCP/IP model.
Overview of Physical and Data Link Layers of the OSI Model
The Physical Layer
The physical layer transmits raw bits over a communication channel. The design must ensure that when one side sends a 1 bit, the other side should receive that bit as a 1 bit, not a 0 bit. This layer deals with the mechanical, elec-trical, and procedural interfaces, and the physical transmission medium, which are all below the physical layer.
The Data Link Layer
The data link layer breaks the raw transmission bits into data frames. Then, it sequentially broadcasts the frames, and the processed acknowledge frames are sent back by the receiver. The data link layer has the foremost function of creating and recognizing frame boundaries, since the physical layer only accepts and transmits a stream of bits without any regard to the meaning of the structure. The data link layer does this by adding special bit patterns to the beginning and the end of the frame. The data link layer also adds error detection functionality.
Overview of Network and Transport Layers of the OSI Model
The Network Layer
The network layer takes care of the delivery of data packets from the source to the destination. The need for a network layer does not arise if the two communicating network devices are connected to the same network.
The network layer provides the logical address of the sender and receiver in the header of the data packet. The 2-6
Chapter 2
network layer responds to service requests from the transport layer. The network layer checks the integrity of the transferred data.
The Transport Layer
The transport layer takes care of the entire message that is transferred from the source to the destination. In contrast, the network layer checks only for the delivery of the individual packets that make up the message. The network layer considers data packets of each message as individual entities. The transport layer takes care of error correction and flow control of the message. For security reasons, the transport layer establishes a connection between ports of the two communicating network devices. The entire packet in the message is associated with the connection.
A connection is established in three steps:
1. Establishment of logical path
2. Transfer of data
3. Release of connection after data transfer
Since all the packets are transmitted in a single path, the transport layer has more control over sequencing, flow control, and error correction of data packets.
Types of Network Attacks
The following are the main categories of attacks launched against networks:
• IP spoofing
• Router attacks
• Eavesdropping
• Denial of service
• Man-in-the-middle attack
• Sniffing
• Data modification
Why Investigate Network Traffic?
The following are some of the reasons investigators analyze network traffic:
• Locate suspicious network traffic
• Know which network is generating the troublesome traffic and where the traffic is being transmitted to or received from
• Identify network problems
Evidence Gathering at the Physical Layer
A computer connected to a LAN has two addresses. The first is the MAC address, which is stored in the network card and uniquely identifies every node in a network. Ethernet uses the MAC address while building frames to transfer data from a system. The other address is the IP address. This address is used by applications. At the data link layer, the MAC address is used for addressing instead of the IP address. The MAC address is mapped to its respective IP address at the network layer. The data link layer looks for the MAC address of the destination machine in a table commonly known as the ARP cache. If an entry is not found for the IP address, then an ARP request will be broadcast to all machines on the network. The machine with the matched IP address then responds to the source machine with its MAC address. The MAC address of the destination machine gets added to the ARP cache of the source machine, and further communication is done using the MAC address.
There are two basic types of Ethernet environments, and sniffers work slightly differently in both of these environments. The two types of Ethernet environments are shared Ethernet and switched Ethernet.
Shared Ethernet
In this type of environment, every machine receives packets that are meant for one machine. One machine sends a packet with the MAC address of the source and destination to every machine. A machine with a MAC
DNS Poisoning Techniques
2-7
address that does not match the destination address simply discards the frame. A sniffer ignores this rule and accepts all frames by putting the NIC into promiscuous mode. Promiscuous mode is the mode of a network interface card in which the card passes all network traffic it receives to the host computer, rather than only the traffic specifically addressed to it. Hence, passive sniffing is possible in a shared Ethernet environment, but it is difficult to detect.
Switched Ethernet
In this type of environment, hosts are connected to a switch, which has a table that keeps records of the MAC addresses of the host machines on the network. The switch transmits the data packets to the destination machines using this table. The switch does not broadcast to all computers but sends the packets to the appropriate destination only. Sniffing by putting the NIC into promiscuous mode does not work in this type of environment. A sniffer can capture packets in a switched environment only when the traffic is flooded to all ports. Flooding happens only when the switch does not have the MAC address of the destination in its content-addressable memory (CAM) table.
For a sniffer to work in a switched environment, an extra feature is needed that captures traffic from the source port to the sniffer port. The port that is configured to receive all the packets sent by any source port is called the SPAN (Switched Port Analyzer) port.
The drawback of a SPANned port is that it copies only legitimate Ethernet traffic. The error information related to the data packets is not copied, which limits the accuracy of evidence gathering. To overcome this limitation, hardware taps, also known as in-line taps, can be used for connecting more than one device to the switched port.
This method helps the investigator get an accurate copy of the network traffic. Special switches are available that can be configured to allow sniffing at the switch that can even capture local traffic. Investigators can request an ISP
to install a sniffer on its network for monitoring the traffic flowing between the ISP and a suspect’s computer.
Special permissions need to be taken for this act. Sniffers cannot function when connected to a modem over a network. Sniffers collect traffic from the network and transport layers, not the physical and data link layers.
Investigators have to configure sniffers for the size of the frames to be captured. The default frame size is usually 68 bytes. It is advisable to configure sniffers to collect frames with a size of 65,535 bytes.
DNS Poisoning Techniques
DNS (Domain Name Service) is a service that translates domain names (e.g., www.eccouncil.org) into IP addresses (e.g., 208.66.172.56). DNS poisoning is a process in which an attacker provides fake data to a DNS
server for the purpose of misdirecting users. For example, a malicious user who operates Web site ABC but wants to pose as Web site 123 could build up a DNS poisoning attack in order to put Web site ABC’s IP address into the entry for Web site 123. Users who use the DNS server that is “poisoned” to locate Web site 123 would then be served by Web site ABC’s IP address.
The following are the steps involved in one DNS poisoning technique:
1. Set up a fake Web site on a computer.
2. Install TreeWalk and modify the file mentioned in the readme.txt to the computer’s IP address. TreeWalk will make this computer the DNS server.
3. Modify the file dns-spoofing.bat and replace the IP address with the computer’s IP address.
4. Trojanize the dns-spoofing.bat file and send it to another user.
5. When the user clicks the Trojaned file, it will replace the user’s DNS entry in his or her TCP/IP properties to that of your machine.
6. You will become the DNS server for the other user, and his or her DNS requests will go through the machine set up in step 1.
7. When the user tries to go to a certain Web site, the Web site he or she resolves to is the fake Web site. Then you can capture the password and send the user to the real Web site.
The following are some of the types of DNS poisoning:
• Intranet DNS spoofing (local network)
• Internet DNS spoofing (remote network)
• Proxy server DNS poisoning
• DNS cache poisoning

![]()
![]()
2-8
Chapter 2
Intranet DNS Spoofing (Local Network)
For this technique, the attacker must be connected to the local area network (LAN) and be able to sniff packets.
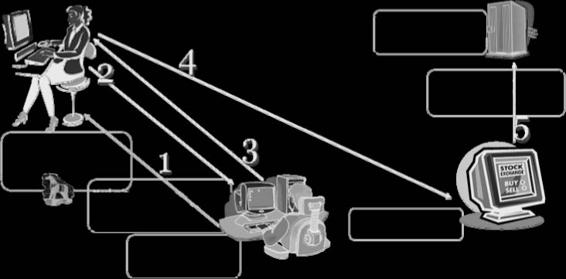
This method works well against switches with ARP poisoning on the router. Figure 2-3 depicts the process of intranet DNS spoofing (local network).
Internet DNS Spoofing (Remote Network)
This method of DNS spoofing works across networks and is relatively easy to set up and implement. Using this technique, the attacker sends a Trojan to the target machine and changes the machine’s DNS IP address to that of the attacker. Figure 2-4 depicts the process of Internet DNS spoofing (remote network).
Proxy Server DNS Poisoning
This type of DNS poisoning works across networks and is easy to set up and execute. The attacker sends a Trojan to a user’s machine to change the proxy server settings on a machine to point to the attacker’s machine.
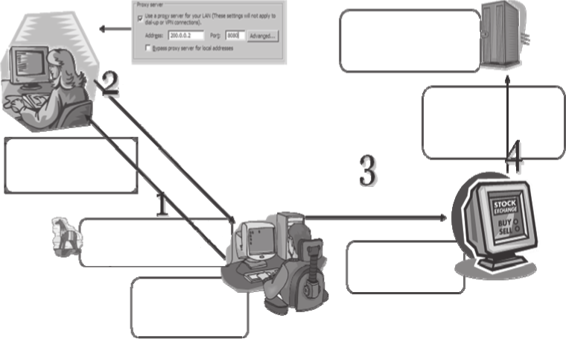
Figure 2-5 depicts the process of proxy server DNS poisoning.
DNS Cache Poisoning
To perform a cache poisoning attack, an attacker exploits a flaw in the DNS server software that can make it accept incorrect information. If the server does not correctly validate DNS responses to ensure that they have come from an authoritative source, the server will end up caching the incorrect entries locally and serve them to users that make the same request. For example, an attacker poisons the IP address DNS entries for a target Web What is the IP address
of
Router
Real Web site
www.xsecurity.com
IP: 10.0.0.254
www.xsecurity.com
IP: 200.0.0.45
DNS request
Rebecca’
Hacker’s fake Web site sniffs the
s bro
Hacker poisons
DNS response
wser connects to
the router and
credential and redirects the request to
10.0.0.5
all the router
real Web site
traffic is
forwarded to his
Hacker sets up fake
machine
Rebecca types
ity.com
Web site
www.xsecurity.com in her
.xsecur
www.xsecurity.com
www
Web browser
is located at 10.0.0.5
IP: 10.0.0.5
IP: 10.0.0.3
Hacker runs
arpspoof/dnsspoof
www.xsecurity.com
Copyright © by
All rights reserved. Reproduction is strictly prohibited
Figure 2-3 An attacker must be connected to the LAN to perform intranet DNS spoofing.
Real Web site
www.xsecurity.com
IP: 200.0.0.45
www
.xsecur
Rebe
What is the IP
DNS response
cc
Hacker’s fake Web site sniffs the
ity
a’
DNS reques
s bro
.com is located at 65.0.0
credential and redirects the
wser con
request to real Web site
ne
address
cts to 65.0.0.2
t goes to 200
of ww
Rebecca types
w.
.0.
.2
0.2
xsecur
www.xsecurity.com in
ity
her Web browser
.com
Hacker’s infects Rebecca’s
computer by changing her DNS IP
Fake Web site
address to: 200.0.0.2
IP: 65.0.0.2
Hacker runs DNS
server in Russia
IP: 200.0.0.2
Copyright © by
All rights reserved. Reproduction is strictly prohibited
Figure 2-4 An attacker uses a Trojan to perform Internet DNS spoofing.
![]()
Evidence Gathering from ARP Table
2-9
Real Web site
www.xsecurity.com
IP: 200.0.0.45
All Rebec
Hacker’s fake Web site
c
sniffs the credential and
a’s
hac Web requests go through
redirects the request to
ker’s machine
real Web site
Rebecca types
www.xsecurity.com in
her Web Browser
Hacker sends Rebecca’s request to fake
Web site
Hacker’s infects Rebecca’s
computer by changing her JE
Proxy address to: 200.0.0.2
Fake Web site
IP: 65.0.0.2
Hacker runs proxy
server in Russia
IP: 200.0.0.2
Copyright © by
All rights reserved. Reproduction is strictly prohibited
Figure 2-5 An attacker uses a Trojan to change the proxy server settings on a
machine during a proxy server DNS poisoning attack.
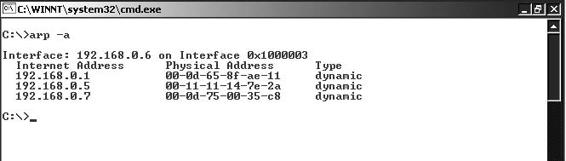
Figure 2-6 The arp -a command displays the ARP table in Windows.
site on a given DNS server, replacing them with the IP address of a server the attacker controls. The attacker then creates fake entries for files on the server he or she controls with names matching those on the target server.
Evidence Gathering from ARP Table
The ARP table of a router comes in handy for investigating network attacks, as the table contains the IP addresses associated with MAC addresses. An investigator can view the ARP table in Windows by issuing the command arp -a, as shown in Figure 2-6.
An investigator can also refer to the ARP table to find out the MAC addresses. The ARP table maintained on the router is of crucial importance, as it can provide information about the MAC address of all the hosts that were involved in recent communications.
The following are ways that an investigator can document the ARP table:
• Taking a photograph of the computer screen
• Taking a screenshot of the table and saving it on a disk
• Using the HyperTerminal logging facility
2-10
Chapter 2
Evidence Gathering at the Data Link Layer: DHCP Database
The DHCP database provides a means of determining the MAC address associated with the computer in custody. This database helps DHCP conclude the MAC address in case DHCP is unable to maintain a permanent log of requests.
The DHCP server maintains a list of recent queries along with the MAC address and IP address. The database can be queried by giving the time duration during which the given IP address accessed the server.
Gathering Evidence from an IDS
Monitoring network traffic is of prime importance. An administrator can configure an intrusion detection system (IDS) to capture network traffic when an alert is generated. However, this data is not a sufficient source of evidence because there is no way to perform integrity checks on the log files.
In a network investigation, preserving digital evidence is difficult, as data is displayed on-screen for a few seconds. Investigators can record examination results from networking devices such as routers, switches, and firewalls through a serial cable and software such as the Windows HyperTerminal program or a script on UNIX.
If the amount of information to be captured is large, an investigator can record the on-screen event using a video camera or a related software program. The disadvantage to this method is that there is no integrity check, making it difficult to authenticate the information.
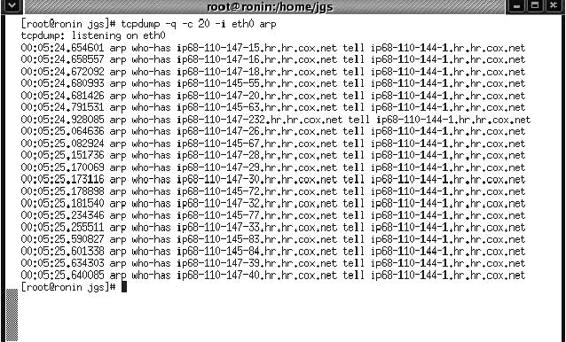
Tool: Tcpdump
Tcpdump is a powerful tool that extracts network packets and performs statistical analysis on those dumps. It operates by putting the network card into promiscuous mode. It may be used to measure the response time and packet loss percentages, and to view TCP/UDP connection establishment and termination. One major drawback to Tcpdump is that the size of the flat file containing the text output is large.
The Tcpdump report consists of the following:
• Captured packet count: This is the number of packets that Tcpdump has received and processed.
• Received packet count: The meaning of this depends on the OS on which the investigator is running Tcpdump. It may also depend on the way the OS is configured. If a filter is specified on the command line, on some OSs it counts packets, regardless of whether they were matched by the filter expression and, even if they were matched by the filter expression, regardless of whether Tcpdump has read and processed them yet.
• Count of packets dropped by kernel: This is the number of packets that were dropped, due to a lack of buffer space, by the packet capture mechanism in the OS on which Tcpdump is running, if the OS reports that information to applications; if the OS does not report this information, Tcpdump will report it as zero.
Tcpdump supports the following platforms:
• SunOS 3.x or 4.x: The investigator must have read access to /dev/nit or /dev/bpf*.
• Solaris: The investigator must have read/write access to the network pseudodevice, e.g., /dev/le.
• HP-UX: The investigator must be root or Tcpdump must be installed setuid to root.
• IRIX: The investigator must be root or Tcpdump must be installed setuid to root.
• Linux: The investigator must be root or Tcpdump must be installed setuid to root.
• Ultrix and Digital UNIX: Any user may capture network traffic with Tcpdump. However, no user (not even the super-user) can capture in promiscuous mode on an interface unless the super-user has enabled promiscuous-mode operation on that interface using pfconfig.
• BSD: The investigator must have read access to /dev/bpf*.
Figure 2-7 shows sample output from Tcpdump.
![]()
![]()
![]()
![]()
![]()
![]()
![]()
![]()
Tool: WinDump
2-11
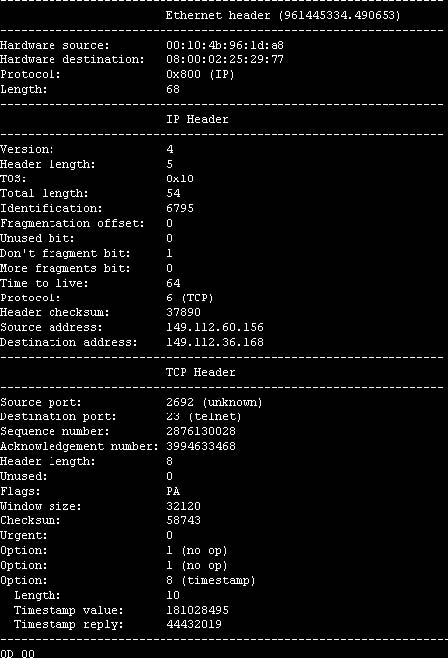
Figure 2-7 Tcpdump shows information about all the packets that come through the
network interface.
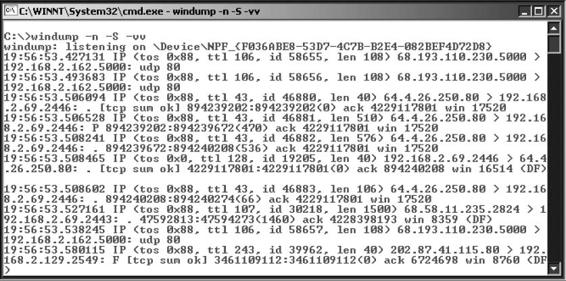
Tool: WinDump
WinDump is a port of Tcpdump for the Windows platform. WinDump is fully compatible with Tcpdump and can be used to watch and diagnose network traffic according to various complex rules.
WinDump is simple to use and works at the command-line level. Figure 2-8 shows the results of windump -n
-S -vv. The -n option tells WinDump to display IP addresses instead of computer names. The -S option indicates that the actual TCP/IP sequence numbers should be shown (if this option is omitted, relative numbers will be shown). The -vv option makes the output more verbose, adding fields such as time to live and IP ID number to the sniffed information.
The following is a TCP example that shows a data packet with the PUSH and ACK flags set:
20:50:00.037087 IP (tos 0x0, ttl 128, id 2572, and len 46) 192.168.2.24.1036 > 64.12.24.42.5190: P [tcp sum ok] 157351:157357(6) ack 2475757024 win 8767 (DF)
The above entry can be deciphered in the following way:
20:50:00.037087 [time stamp] IP [protocol header follows] (tos 0x0, ttl 128, id 2572, len 46) 192.168.2.24.1036
[source IP:port] > 64.12.24.42.5190: [destination IP:port] P [push flag] [tcp sum ok] 157351:157357 [sequence numbers] (6) [bytes of data] ack 2475757024 [acknowledgement and sequence number] win 8767 [window size]
(DF) [don’t fragment set]
The next example is UDP:
20:50:11.190427 [time stamp] IP [protocol header follows] (tos 0x0, ttl 128, id 6071, len 160) 192.168.2.28.3010
[source IP:port] > 192.168.2.1.1900: [destination IP:port] udp [protocol] 132
2-12
Chapter 2
Figure 2-8 WinDump displays more verbose information when the user specifies the -vv option.
The following is an ICMP log entry:
20:50:11.968384 [time stamp] IP [protocol header follows] (tos 0x0, ttl 128, id 8964, len 60) 192.168.2.132
[source IP] > 192.168.2.1: [destination IP] icmp [protocol type] 40: [time to live] echo request seq 43783 [sequence number]
Finally, WinDump can also capture ARP requests and replies, such as the following:
20:50:37.333222 [time stamp] arp [protocol] who-has 192.168.2.1 [destination IP] tell 192.168.2.118 [source IP]
20:50:37.333997 [time stamp] arp [protocol] reply 192.168.2.1 [destination IP] is-at 0:a0:c5:4b:52: fc
[MAC address]
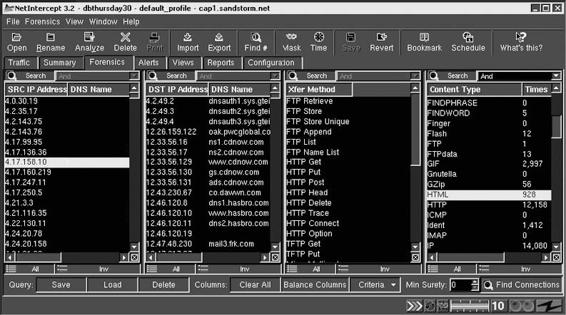
Tool: NetIntercept
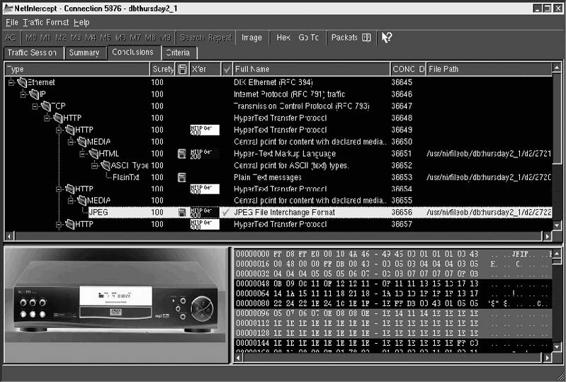
NetIntercept, from Sandstorm Enterprises, is a network analysis tool that allows an organization to increase its network security. NetIntercept captures LAN traffic using a standard Ethernet interface card placed in promiscuous mode and a modified UNIX kernel. The capture subsystem runs continuously, whether or not the GUI is active. Figure 2-9 shows a screenshot of captured traffic.
NetIntercept performs stream reconstruction on demand. When the user selects a range of captured network traffic to analyze, NetIntercept assembles those packets into network connection data streams. The reconstructed streams are then presented to the NetIntercept analysis subsystem for identification and analysis. Once TCP streams are reconstructed and parsed, some of the objects that they contain need to be stored for long periods, e.g., Web pages, files transferred by FTP, and e-mail attachments.
Aside from controlling data capture and analysis, the GUI offers sophisticated search criteria. A user can find one or many network connections according to the following:
• Time of day
• Source or destination hardware or Internet address
• Source or destination TCP or UDP port name or number
• Username associated with the connection
• E-mail sender, recipient(s), or subject header
• File name or World Wide Web URL associated with the transfer
• Specific protocols or content types recognized in the connection contents
Once a connection has been identified, the user can drill down to view the search criteria extracted from it, as shown in Figure 2-10.
Tool: Wireshark
2-13
Figure 2-9 NetIntercept captures traffic continuously.
Figure 2-10 A user can look at the contents of a connection once it has been identified.
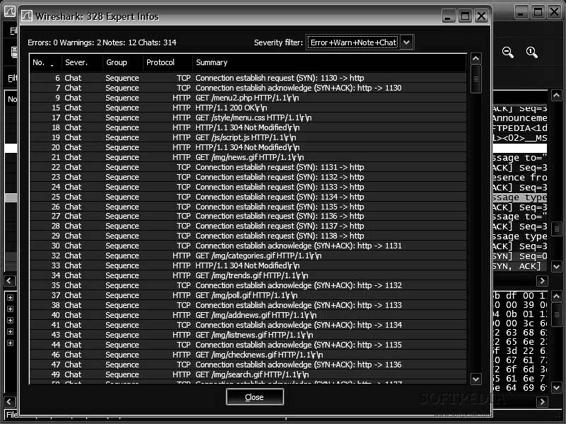
Tool: Wireshark
Wireshark, formerly known as Ethereal, is a GUI-based network protocol analyzer. It lets the user interactively browse packet data from a live network or from a previously saved capture file. Wireshark’s native capture file format is the libpcap format, which is also the format used by Tcpdump and various other tools. In addition, Wireshark can read capture files from snoop and atmsnoop, Shomiti/Finisar Surveyor, Novell LANalyzer,
2-14
Chapter 2
Figure 2-11 Wireshark can show information about all captured packets.
Network General/Network Associates DOS-based Sniffer (compressed or uncompressed), Microsoft Network Monitor, and other tools. Wireshark can determine the capture file type by itself, without user intervention. It is also capable of reading any of these file formats if they are compressed using gzip.
Like other protocol analyzers, Wireshark’s main window shows three views of a packet. It shows a summary line, briefly describing what the packet is. It also shows a protocol tree, allowing the user to drill down to the exact protocol, or field, that he or she is interested in. Finally, a hex dump shows the user exactly what the packet looks like when it goes over the wire.
Wireshark has other features. It can assemble all the packets in a TCP conversation and show the user the ASCII (or EBCDIC, or hex) data in that conversation. Packet capturing is performed with the pcap library. The capture filter syntax follows the rules of the pcap library. This syntax is different from the display filter syntax.
Compressed file support uses the zlib library.
The following are some of the other features of Wireshark:
• Data can be captured off the wire from a live network connection or read from a captured file.
• Live data can be read from Ethernet, FDDI, PPP, Token Ring, IEEE 802.11, and loopback interfaces.
• Captured network data can be browsed using a GUI or by using the TTY mode.
• Captured files can be programmatically edited or converted via command-line switches.
• Output can be saved or printed as plain text or PostScript.
• Data display can be refined using a display filter.
• Display filters can also be used to selectively highlight and color packet summary information.
• All or part of each captured network trace can be saved to a disk.
Figure 2-11 shows a screenshot from Wireshark.
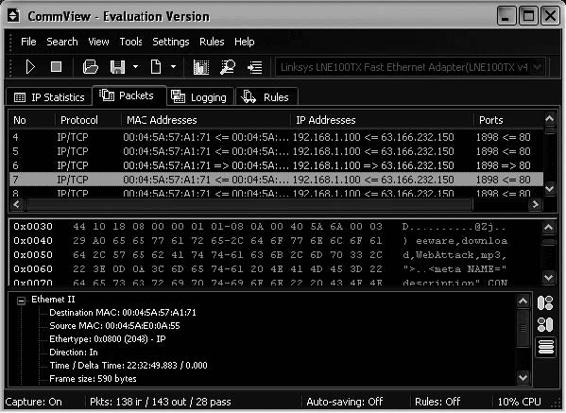
Tool: CommView
CommView is a network monitor and analysis tool that provides a complete picture of the traffic flowing through a PC or LAN segment. It captures every packet on the wire and displays information and vital statistics about the captured packets, as shown in Figure 2-12. A user can examine, save, filter, import, and export captured packets.
Tool: SoftPerfect Network Protocol Analyzer
2-15
Figure 2-12 CommView shows detailed information about every captured packet.
For remote monitoring, CommView includes an add-on called the Remote Agent. It allows CommView users to capture network traffic on any computer where Remote Agent is running, regardless of the computer’s physical location.
CommView allows users to do the following:
• View detailed statistics about IP addresses, ports, and sessions
• Reconstruct TCP sessions
• Map packets to the sending or receiving application
• View protocol distribution, bandwidth utilization, and network node charts and tables
• Generate network traffic reports in real time
• Browse captured and decoded packets in real time
• Search for strings or hex data in captured packet contents
• Import and export packets in multiple formats
• Configure alarms that can notify the user about important events, such as suspicious packets, high bandwidth utilization, and unknown addresses
• Create plug-ins for decoding any protocol
• Exchange data with applications over TCP/IP
• Export any IP address to SmartWhois for quick, easy IP lookup
• Capture loopback traffic
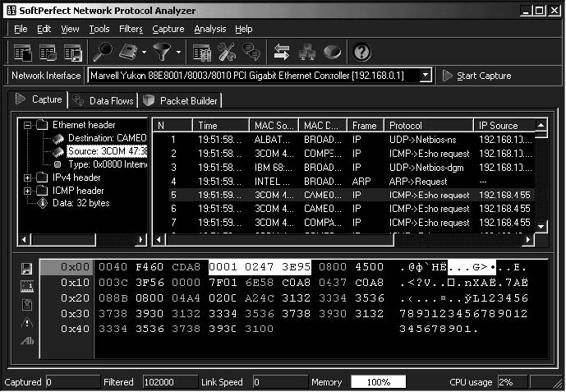
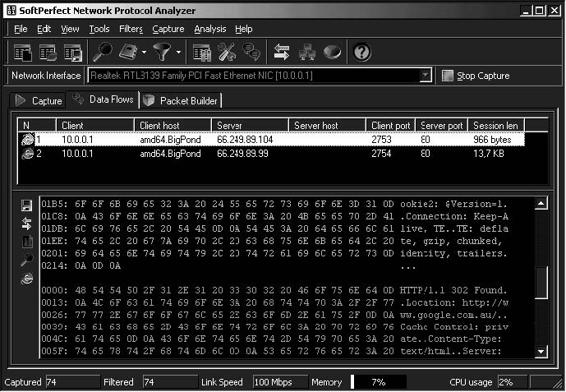
Tool: SoftPerfect Network Protocol Analyzer
SoftPerfect Network Protocol Analyzer debugs, maintains, analyzes, and monitors local networks and Internet connections. It captures the data passing through network connections, analyzes this data, and then represents it in an easily readable form. The SoftPerfect Network Protocol Analyzer presents analysis results 2-16
Chapter 2
in an easily understandable format. It also allows a user to defragment and reassemble network packets into streams. The tool can analyze network traffic based on a number of different Internet protocols, such as the following:
• AH
• ARP
• ESP
• FTP
• HTTP
• ICMP
• ICMPv6
• IMAP
• IP
• IPv6
• IPX
• LLC
• MSG
• POP
• REVARP
• RIP
• SAP
• SER
• SMTP
• SNAP
• SPX
• TCP
• Telnet
• UDP
A user can filter network traffic so he or she is only presented with the traffic he or she is concerned with.
The SoftPerfect Network Protocol Analyzer also features a packet builder. This tool allows the user to build custom network packets and send them over the network. With this feature, the user can check the network for protection against attacks and intruders.
The software supports all 32-bit and 64-bit versions of Windows. The following are some of the features of SoftPerfect Network Protocol Analyzer:
• It can work in promiscuous mode to capture all network packets (Figure 2-13).
• It has a flexible system of traffic filtering. Any filter can be inclusive or exclusive.
• It can reconstruct packets into flows so the user can easily see a complete data exchange following Telnet, POP3, SMTP, IMAP, FTP, HTTP, and other protocols. Figure 2-14 shows a reconstructed HTTP stream.
• It supports SMP systems (with two or more CPUs), as well as HT-enabled systems.
• It is able to monitor loopback connections within the computer.
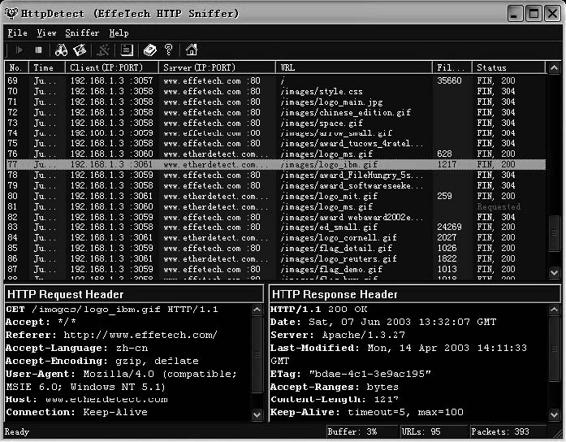
Tool: HTTP Sniffer
EffeTech HTTP Sniffer is an HTTP packet sniffer, protocol analyzer, and file reassembly tool for Windows.
This sniffer captures IP packets containing HTTP messages, rebuilds the HTTP sessions, and reassembles files sent through HTTP. HTTP Sniffer provides real-time analysis of content while capturing, analyzing, parsing, and decoding HTTP messages.
Tool: HTTP Sniffer
2-17
Figure 2-13 SoftPerfect Network Protocol Analyzer displays information about all packets captured from the network.
Figure 2-14 SoftPerfect Network Protocol Analyzer can reconstruct an entire data exchange.
2-18
Chapter 2
Figure 2-15 HTTP Sniffer displays information about captured HTTP packets.
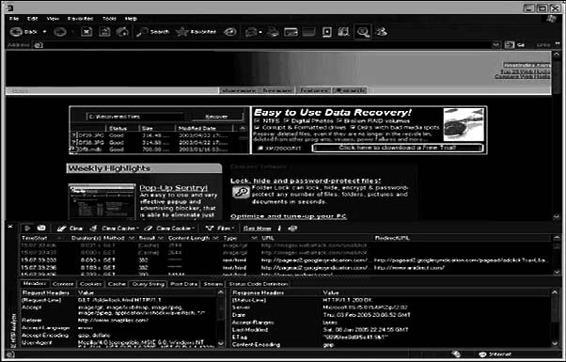
The following are some of the features of HTTP Sniffer:
• Powerful HTTP file rebuilder: HTTP Sniffer recognizes the reconstructed stream of each TCP session.
Through analysis of the HTTP packets in the same TCP connection, it reassembles the original files transferred by HTTP. The user can view and save the rebuilt files.
• Multiple file-type support: The tool supports HTML, XML, GIF, JPG, and other file types.
• Powerful packet-capturing filter: This feature provides a flexible mechanism to monitor specific target host and file types.
• Customized logging: HTTP Sniffer exports log files in HTML format or a customized CSV format.
Figure 2-15 shows a screenshot from HTTP Sniffer.
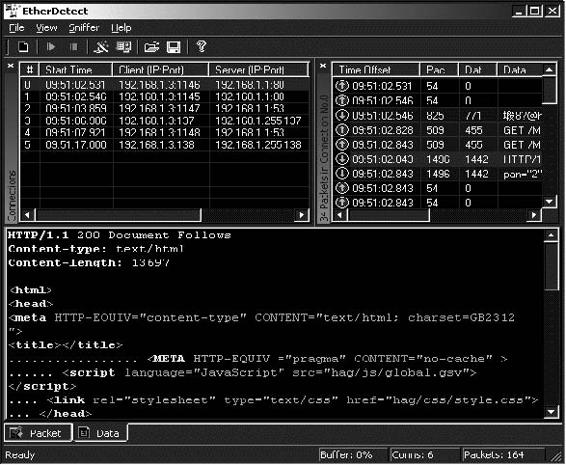
Tool: EtherDetect Packet Sniffer
EtherDetect Packet Sniffer is a connection-oriented packet sniffer and network protocol analyzer. A user can capture full packets, organize packets by TCP connections or UDP threads, passively monitor the network, and view packets in hex format.
The following are some of the features of EtherDetect Packet Sniffer:
• Captures IP packets on a LAN with nearly no packet loss
• Enables on-the-fly content viewing while capturing and analyzing
• Parses and decodes a variety of network protocols
• Supports saving captured packets for viewing at a later time
Tool: Iris Network Traffic Analyzer
2-19
Figure 2-16 EtherDetect Packet Sniffer provides syntax highlighting for application data, including HTTP data, as shown here.
• Provides a flexible filtering mechanism to capture specific packets
• Provides syntax highlighting for application data in the HTML, HTTP, and XML formats, as shown in Figure 2-16
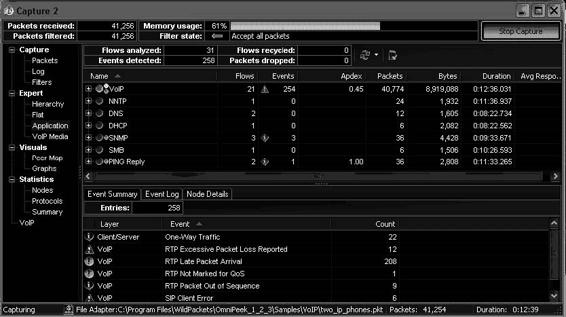
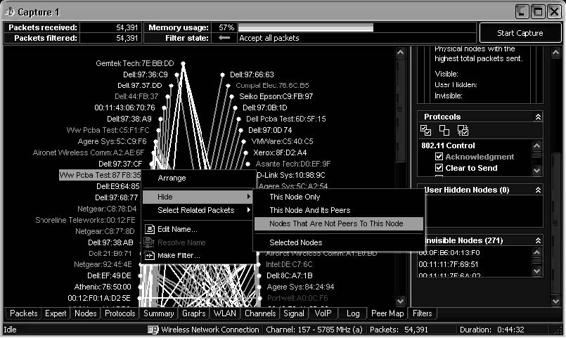
Tool: OmniPeek
OmniPeek is a network analysis tool that an administrator can use to quickly analyze and troubleshoot network problems at the enterprise level. The following are some of the features of OmniPeek:
• Ability to analyze traffic from any local network segment, including gigabit and WAN segments
• Ability to drill down to see which network nodes are communicating, which protocols and subprotocols are being transmitted, and which traffic characteristics are affecting network performance
• Ability to change filters on the fly without having to stop and restart packet captures
• Ability to view packet-stream-based analytics by conversation pair
• Ability to view local captures, remote captures, or a combination of local and remote captures
• Ability to simultaneously monitor multiple parts of the network
• Ability to analyze and troubleshoot VoIP traffic
Figures 2-17 and 2-18 show screenshots from OmniPeek.
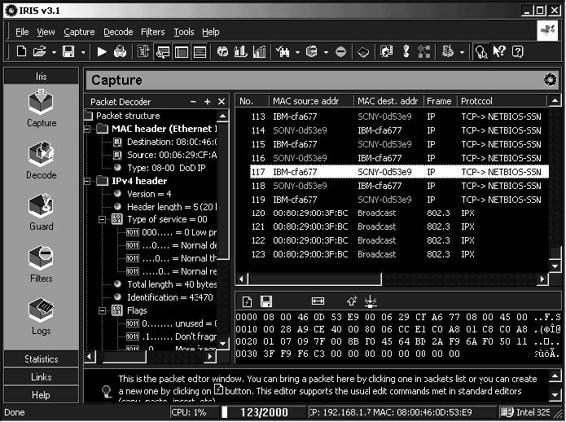
Tool: Iris Network Traffic Analyzer
Iris Network Traffic Analyzer provides network traffic analysis and reporting functionality. This tool captures network traffic and can automatically reassemble it to its native format, making it much easier to analyze the
2-20
Chapter 2
Figure 2-17 OmniPeek provides different views of captured packets.
Figure 2-18 OmniPeek provides users with visuals concerning network traffic.
data going across the network. An investigator can read the actual text of an e-mail exactly as it was sent, or reconstruct exact HTML pages that a user has visited.
An investigator can configure Iris Network Traffic Analyzer to capture only specific data through any combination of packet filters. Packet filters can be based on hardware or protocol layers, any number of keywords, MAC or IP addresses, source and destination ports, custom data, and packet sizes.
Figure 2-19 shows a screenshot from Iris Network Traffic Analyzer.
Tool: NetSetMan
2-21
Figure 2-19 Iris Network Traffic Analyzer allows a user to view details about
captured packets.
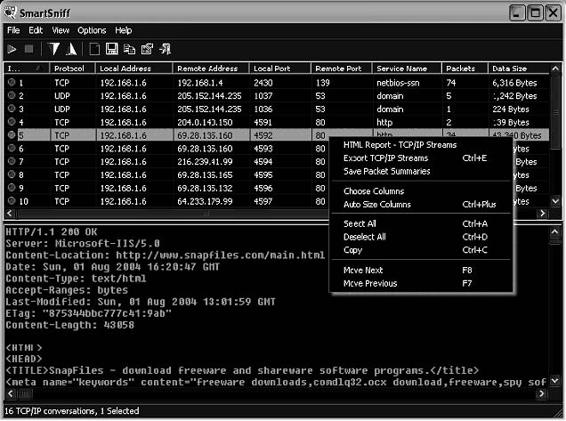
Tool: SmartSniff
SmartSniff provides investigators with the ability to view captured TCP/IP packets as sequences of conversations between clients and servers. Investigators can view these conversations in ASCII mode (for text-based protocols) or as a hex dump for non-text-based protocols).
The following are some of the features of SmartSniff:
• Color coding of local and remote traffic
• Exporting to HTML and other formats
• A basic, but very small and standalone, protocol analyzer
Figure 2-20 shows a screenshot from SmartSniff.
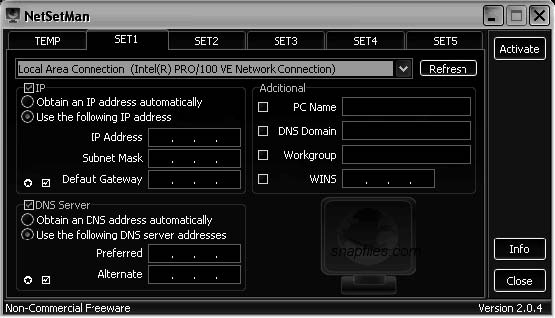
Tool: NetSetMan
NetSetMan is a network settings manager that allows a user to easily switch between six different network settings profiles. These profiles include the following settings:
• IP address
• Subnet mask
• Default gateway
• Preferred and alternate DNS servers
• Computer name
• Workgroup
• DNS domain
• WINS server
• Default printer
2-22
Chapter 2
Figure 2-20 SmartSniff shows ASCII views of network conversations for text-based
protocols.
Figure 2-21 NetSetMan allows a user to switch between sets of network settings.
• Run scripts
• Network domain
• Complete proxy settings (Internet Explorer and Firefox)
• Home page (Internet Explorer and Firefox)
Figure 2-21 shows a screenshot from NetSetMan.
Tool: MaaTec Network Analyzer
2-23
Figure 2-22 Distinct Network Monitor displays live network traffic statistics.
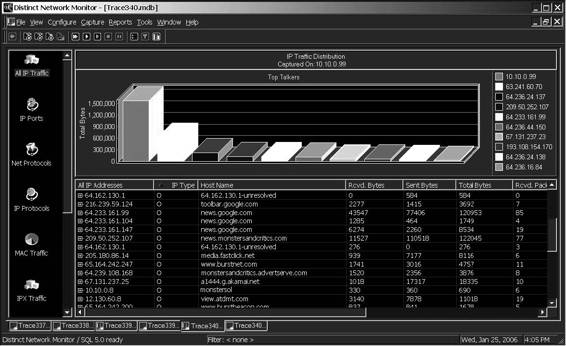
Tool: Distinct Network Monitor
Distinct Network Monitor displays live network traffic statistics, as shown in Figure 2-22. It includes a scheduler that allows an administrator to run a scheduled collection of network traffic statistics or packet captures.
The following are some of the features of Distinct Network Monitor:
• Network protocols have a drill-down capability showing all the local hardware addresses that generated the packets.
• The reporting feature allows a user to create statistics reports in HTML and CSV formats.
• A user can discover which ports on a system are open and listening for a connection.
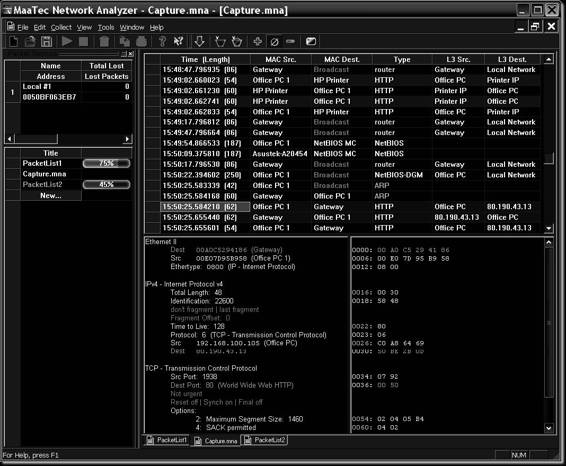
Tool: MaaTec Network Analyzer
MaaTec Network Analyzer is a tool that is used for capturing, saving, and analyzing network traffic. The following are some of the features of MaaTec Network Analyzer:
• Real-time network traffic statistics
• Scheduled network traffic reports
• Online view of incoming packets
• Multiple data color options (Figure 2-23)
2-24
Chapter 2
Figure 2-23 MaaTec Network Analyzer can color-code data based on different criteria.
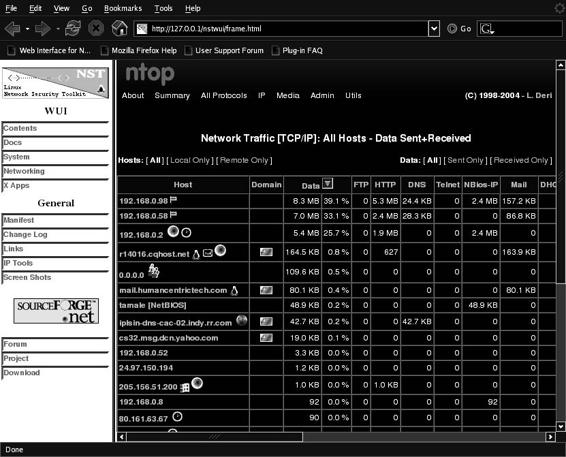
Tool: ntop
ntop is a network traffic probe that shows network usage. In interactive mode, it displays the network status on the user’s terminal. In Web mode, it acts as a Web server, creating an HTML dump of the network status, as shown in Figure 2-24.
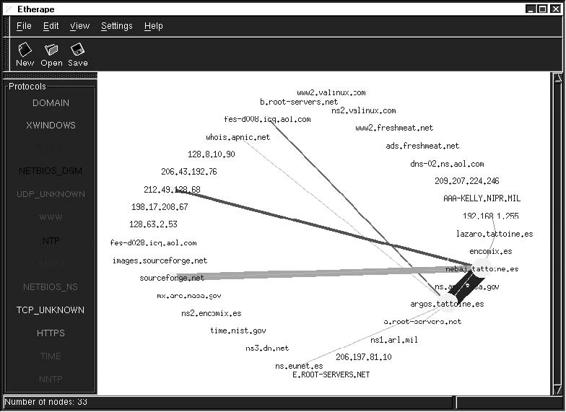
Tool: EtherApe
EtherApe is a graphical network monitor for UNIX. It displays network activity graphically by featuring link layer, IP, and TCP modes, as shown in Figure 2-25. It can filter traffic for display, and it can read traffic from a file as well as live from the network.
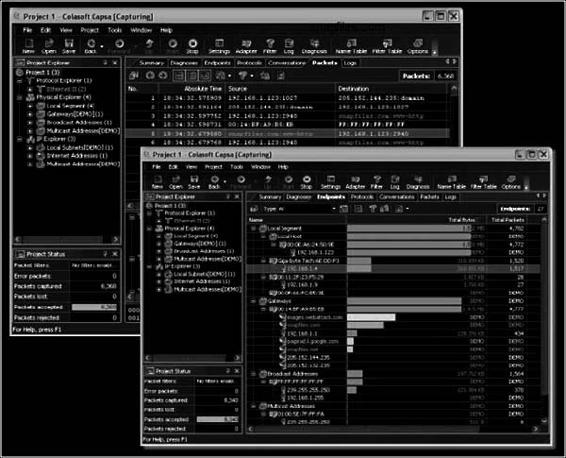
Tool: Colasoft Capsa Network Analyzer
Colasoft Capsa Network Analyzer is a TCP/IP network sniffer and analyzer that offers real-time monitoring and data analysis of network traffic. It also offers e-mail analysis, Web analysis, and transaction analysis.
Figure 2-26 shows a screenshot from Colasoft Capsa Network Analyzer.
Tool: Colasoft Capsa Network Analyzer
2-25
Figure 2-24 ntop displays network statistics on a Web page.
Figure 2-25 EtherApe creates a graphical display of network traffic.
2-26
Chapter 2
Figure 2-26 Colasoft Capsa Network Analyzer provides statistics about
network traffic.
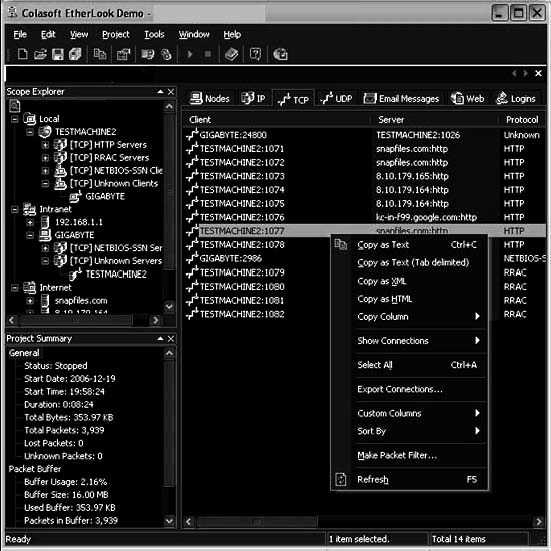
Tool: Colasoft EtherLook
Colasoft EtherLook is a TCP/IP network-monitoring tool for Windows-based platforms. It monitors real-time traffic flowing around local networks, and to and from the Internet. The Traffic Analysis Module allows a user to capture network traffic in real time, and display data received and sent by every host in a LAN, as shown in Figure 2-27.
It also includes three advanced analysis modules:
• E-Mail Analysis Module: Captures e-mail messages and restores their contents
• Web Analysis Module: Allows for detailed tracking of Web accesses from the network
• Login Analysis Module: Analyzes all data logins within the network and records all related data
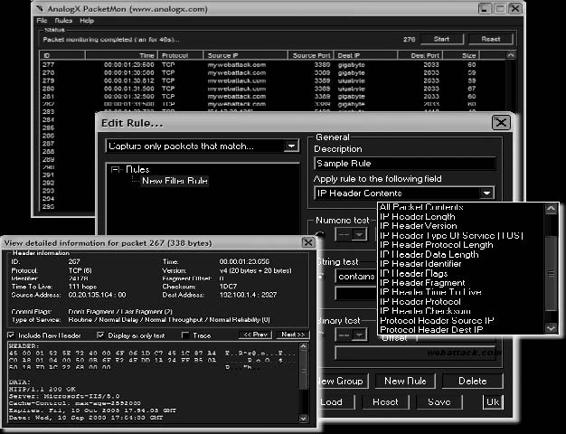
Tool: AnalogX PacketMon
AnalogX PacketMon allows an administrator to capture IP packets that pass through a network interface, whether those packets originated from the machine on which PacketMon is installed or from any other machine on the network. Administrators can then use the built-in viewer to examine the packet’s header and contents.
PacketMon can export the results into a CSV file for further processing. Figure 2-28 shows a screenshot from AnalogX PacketMon.
Tool: BillSniff
2-27
Figure 2-27 Colasoft EtherLook displays all the data received by every host in a LAN.
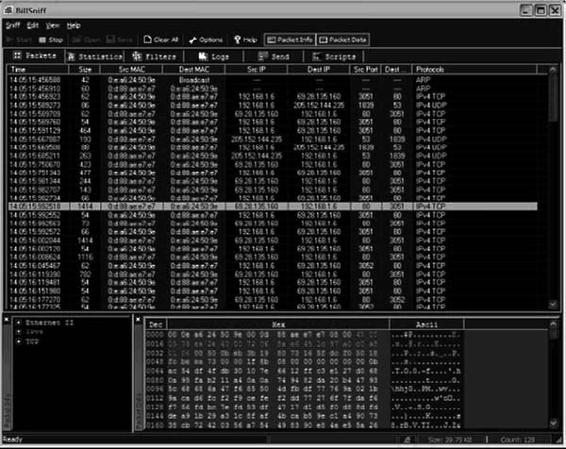
Tool: BillSniff
BillSniff is a network protocol analyzer that provides detailed information about current traffic, as well as overall protocol statistics. It supports the following protocols:
• IPv4
• TCP
• UDP
• IEEE 802.2 frame
• Ethernet II frame
• NetBIOS
• IPX
BillSniff includes both real-time monitoring and an extensive array of filter options that allows a user to limit capture based on IP address, port, protocol, MAC address, packet size, and other criteria. BillSniff also provides graphical statistics for network layers. Users can also send packets and script custom protocols with BillSniff.
Figure 2-29 shows a screenshot from BillSniff.
2-28
Chapter 2
Figure 2-28 AnalogX PacketMon can show detailed information about packets.
Figure 2-29 BillSniff allows a user to view hexadecimal and ASCII versions
of packets.
Tool: Sniphere
2-29
Figure 2-30 IE HTTP Analyzer displays its information in a separate frame within Internet Explorer.
Tool: IE HTTP Analyzer
IE HTTP Analyzer is an add-in for Internet Explorer that allows a user to capture HTTP and HTTPS traffic in real time. It displays the following information:
• Headers
• Content
• Cookies
• Query strings
• Post data
• Redirection URLs
• Cache information
• HTTP status code information
It also provides session clearing and several filtering options. Figure 2-30 shows a screenshot from IE
HTTP Analyzer.
Tool: EtherScan Analyzer
EtherScan Analyzer is a network traffic and protocol analyzer. It captures and analyzes packets sent over a local network. It decodes the major protocols and is capable of reconstructing TCP/IP sessions.
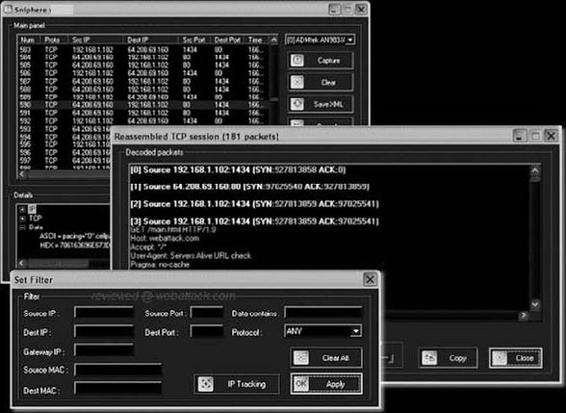
Tool: Sniphere
Sniphere is a WinPcap network sniffer that supports most common protocols. It can be used on Ethernet devices and supports PPPoE modems. It allows the user to set filters based on IP, MAC address, ports, and protocols,
2-30
Chapter 2
Figure 2-31 Sniphere can filter traffic based on several criteria.
and it also decodes packages into an easy-to-understand format. In addition, users can save session logs in XML format and copy selected packets to the clipboard. Figure 2-31 shows a screenshot from Sniphere.
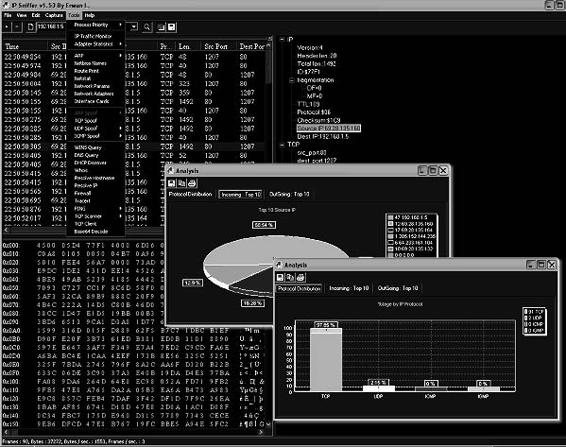
Tool: IP Sniffer
IP Sniffer is a protocol analyzer that uses Windows XP/2000 raw socket features. It supports filtering rules, adapter selection, packet decoding, advanced protocol description, and more. It provides detailed information about each packet in a tree-style view, and the right-click menu allows users to resolve or scan a selected source IP address.
IP Sniffer provides the following additional features:
• Adapter statistics
• IP traffic monitoring
• Traceroute
• Ping
• Port scanning
• TCP/UDP/ICMP spoofing options
• Opens TCP/UDP ports attached to a process
• MAC address changing
• DNS/WINS/SNMP/WHOIS/DHCP queries
Figure 2-32 shows a screenshot from IP Sniffer.
Tool: Atelier Web Ports Traffic Analyzer
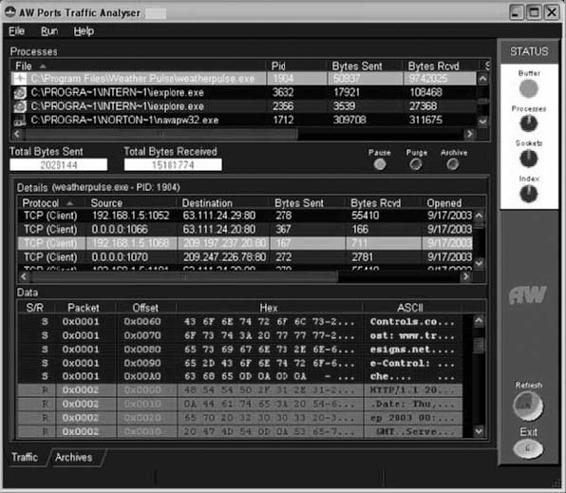
Atelier Web Ports Traffic Analyzer is a network traffic sniffer and logger that allows a user to monitor all Internet and network traffic on a PC and view the actual content of the packets. It provides real-time mapping of ports to processes. It also shows the history since boot time of every TCP, UDP, or RAW port opened through Winsock. Figure 2-33 shows a screenshot from Atelier Web Ports Traffic Analyzer.
Tool: Atelier Web Ports Traffic Analyzer
2-31
Figure 2-32 IP Sniffer provides graphical statistics about network traffic.
Figure 2-33 Atelier Web Ports Traffic Analyzer shows hexadecimal and ASCII
versions of the content of packets.
2-32
Chapter 2
Figure 2-34 IPgrab’s verbose mode displays a lot of information about
each packet.
Tool: IPgrab
IPgrab is a packet sniffer for UNIX hosts. It provides a verbose mode that displays a great amount of information about packets. It also provides a minimal mode in which all information about all parts of a packet is displayed in a single line of text. Figure 2-34 shows a screenshot from IPgrab.
Tool: Sniff-O-Matic
2-33
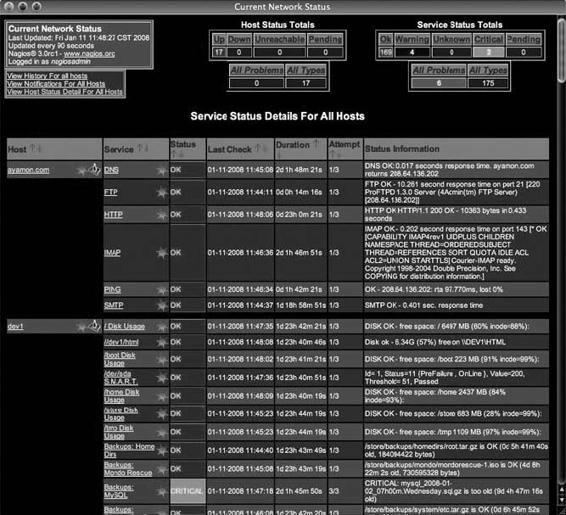
Tool: Nagios
Nagios is a host and service monitor designed to run under the Linux operating system. The following are some of the features of Nagios:
• Monitoring of network services (SMTP, POP3, HTTP, NNTP, ping, etc.)
• Monitoring of host resources (processor load, disk and memory usage, running processes, log files, etc.)
• Web interface for viewing current network status, notification and problem history, log files, etc.
• Support for implementing redundant and distributed monitoring servers
Figure 2-35 shows a screenshot from Nagios.
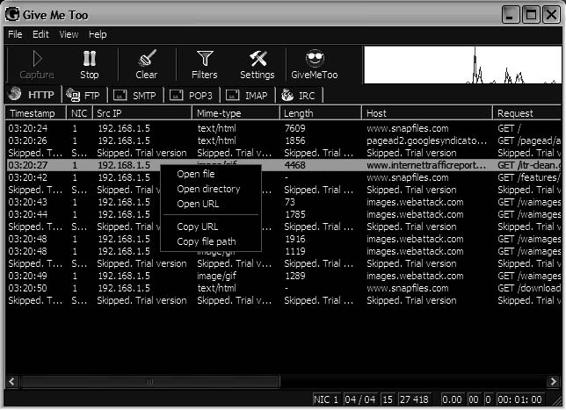
Tool: Give Me Too
Give Me Too is a packet sniffer, network analyzer, and network sniffer that monitors any Internet and e-mail activity. It captures all data transferred through the network via HTTP, FTP, SMTP, IMAP, POP3, and IRC
protocols. Figure 2-36 shows a screenshot from Give Me Too.
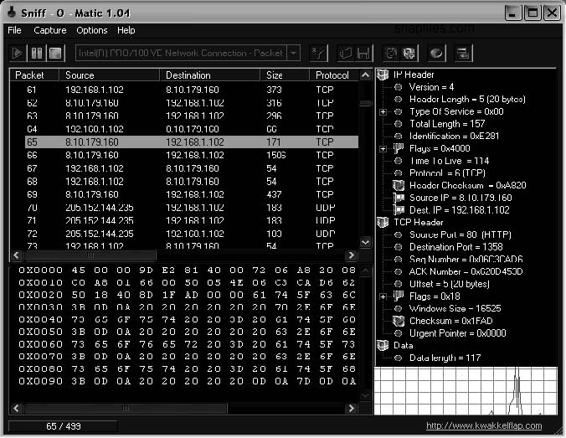
Tool: Sniff-O-Matic
Sniff-O-Matic is a network protocol analyzer and packet sniffer. It captures network traffic and provides analysis tools that allow a user to analyze the captured data. Figure 2-37 shows a screenshot from Sniff-O-Matic.
Figure 2-35 Nagios can display details about the current network status.
2-34
Chapter 2
Figure 2-36 Using Give Me Too, users can open files that have been transferred over the network.
Figure 2-37 Sniff-O-Matic shows the entire contents of each packet.
Tool: GPRS Network Sniffer: Nokia LIG
2-35
Figure 2-38 EtherSnoop allows users to choose which packets to see in a more detailed view.
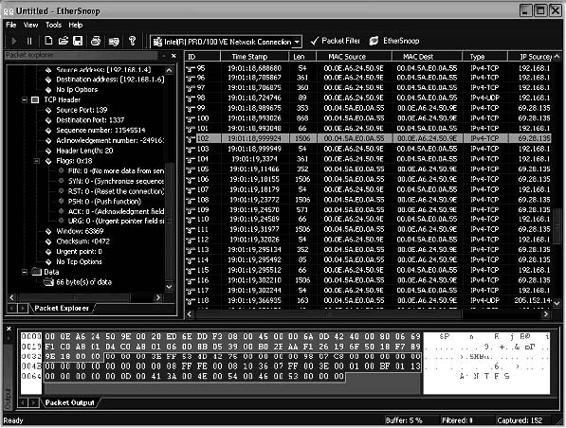
Tool: EtherSnoop
EtherSnoop is a packet sniffer and protocol analyzer. It captures the data passing through a dial-up connection or Ethernet card, analyzes the data, and presents it in a readable format. Figure 2-38 shows a screenshot from EtherSnoop.
Tool: GPRS Network Sniffer: Nokia LIG
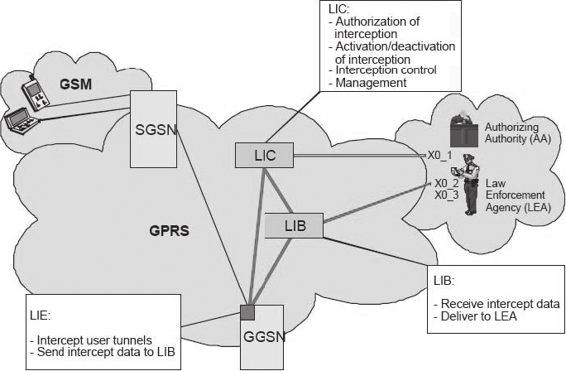
In the General Packet Radio Service (GPRS) embedding of the Lawful Interception Gateway (LIG), critical network functionality enables interception of GPRS mobile data calls. This technique is entirely different from GSM call interception. The difference lies in interception. In GSM, voice-based audio recording is primarily intercepted, whereas in GPRS, the data between the mobile station and the access point is captured.
The Nokia LIG provides a precise solution for constructing the GPRS interception system.
In Nokia’s execution, the Lawful Interception Controller (LIC) network element communicates with the ADMF (Administration Function), and the Lawful Interception Browser (LIB) element communicates with the delivery functions DF2 and DF3 of the ETSI standard.
The architecture of Nokia’s implementation comprises the following:
• Lawful Interception Controller (LIC): This component is based on the Nokia/IPRG IP650 router product. It monitors data interception and provides secured Web interfaces for various lawful enforcement agencies (LEAs) and the authorization authorities (AAs).
• Lawful Interception Browser (LIB): This component is also based on the Nokia/IPRG IP650 router product. It keeps interception-related information and communication content (CC) temporarily that are sent in the same form to the defined LEA(s).
![]()
2-36
Chapter 2
Copyright © by
All rights reserved. Reproduction is strictly prohibited
Figure 2-39 The LIC, LIB, and LIE all work together in the Nokia LIG.
• Lawful Interception Extension (LIE): This component is based on the GGSN Release 1.1 software. Its primary role is to gather part of the IRI and accumulate the communication content, mainly the user (mobile) data transmitted.
Figure 2-39 shows how these components work together.
Tool: Siemens Monitoring Center
Siemens Monitoring Center is designed for law enforcement and government security agencies. Its design permits integration within all telecommunications networks that use any type of modern standardized equipment compatible with an ETSI recommendation (e.g., Siemens, Ericsson, Alcatel, Nokia, Nortel, Lucent, and Huawei).
With the help of the Siemens Intelligence Platform, analysts may find meaning among large reams of irrelevant data. The Intelligence Platform is a means to organize disparate pieces of information for the law enforcement and security agencies so decision makers can act upon the information.
Siemens Monitoring Center provides all monitoring requirements within telecommunication networks, including the following:
• Fixed networks: PSTN (local and international exchanges)
• Mobile networks: GSM, GPRS, UMTS
• Next-generation networking (NGN)
• IP networks (local loop, ISP, and Internet backbone)
• Automatic correlation of content of communication to IRI
• Mono and stereo, optionally compressed, voice recording
• Full duplex/no compression recording for data demodulation (fax, Internet, e-mails, etc.)
• Customized add-on applications
• Centralized or distributed Monitoring Center (Monitoring Center to-go)
Tool: NetWitness
2-37
• Scalable and adaptable to customer requirements
• Joint roadmap for upcoming telecommunications technology
Tool: NetWitness
NetWitness analyzes network traffic for potential threats. The primary focus of NetWitness is on expanding the efficiency of information gathering. It enables organizations to recognize and respond to network activity promptly.
NetWitness performs a threat assessment of the Web, voice, file access, chat, and database sessions from any packet source. It presents data at the application layer, which removes the necessity of low-level packet inspection.
The comprehensive packet filtering features enable the filtering of analysis logs during the collection phase.
Implementation of application rules can generate a number of events, such as real-time alerts and information logging. These facilities can be employed to observe parameters that are set to meet specific legal requirements.
NetWitness brings together large collections of data and combines them with data intercepted from other systems, which allows administrators to have an extensive understanding of the trends in network traffic. This feature of NetWitness makes filtering of the search and monitoring functions easy.
The following are modes in which NetWitness can work:
• Stealth mode: In an intrusion attack, NetWitness hides its presence from detection by the intruder, but only if it is working on an Ethernet-based network.
• Real-time mode: This mode monitors network traffic.
• File mode: This mode analyzes the files captured from a different machine.
• Archival mode: This mode ensures the storage of compressed logs of captured data for later analysis.
Figure 2-40 shows a screenshot from NetWitness.
Figure 2-40 NetWitness allows users to view files captured from other machines on the network.
2-38
Chapter 2
Figure 2-41 Users can view reconstructed Web pages using NetResident.
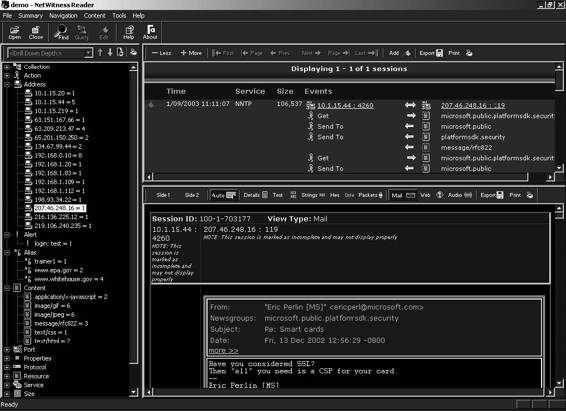
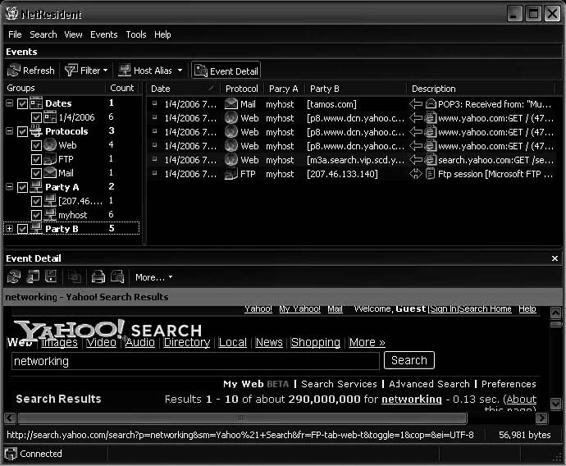
Tool: NetResident
NetResident captures, stores, analyzes, and reconstructs network events, such as e-mail messages, Web pages, downloaded files, instant messages, and VoIP conversations. NetResident captures the data on the network, saves it to a database, reconstructs it, and displays this content in an easy-to-understand format.
NetResident focuses on the high-level protocols used to transfer content over networks. Network a dministrators can use NetResident to enforce IT policy, and forensic investigators can use it to gain crucial information.
Figure 2-41 shows a screenshot from NetResident.
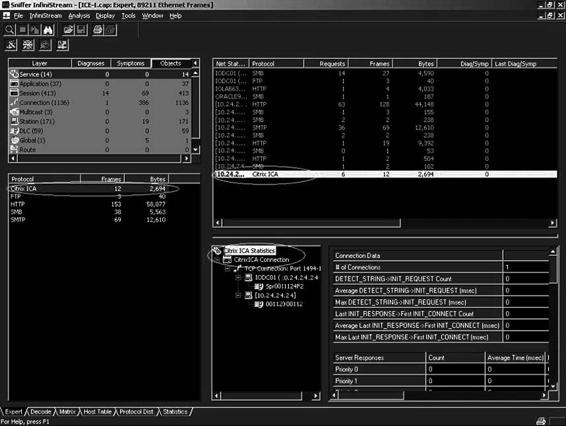
Tool: InfiniStream
InfiniStream provides the ability to identify, monitor, measure, and resolve high-impact, intermittent enterprise problems. InfiniStream’s continuous long-term capture ability enables users to have data for an entire transaction or a series of transactions. Users can then drill down to the area of interest and conduct a postcapture analysis using sniffer decodes and analysis. InfiniStream provides streaming capture performance and flexible data mining for the following:
• Real-time analysis
• Back-in-time analysis
• Historical analysis, in conjunction with Sniffer Enterprise Visualizer
Tool: eTrust Network Forensics
2-39
The following are some of the features of InfiniStream:
• 10 GbE capture and analysis: The 10 GbE appliance provides a sustained 10 GbE full-duplex capture and analysis for troubleshooting backbones and vital network segments. Plus, it offers 24ϫ7 visibility to resolve high-impact network issues before they affect the network.
• Web-based user interface (UI) option: This flexible UI allows users to access reports from anywhere on the network, serving actionable data to help users make critical business decisions.
• WAN topology support: Using the WAN/ATM SuperTAP, users can better understand the health and condition of their WAN links and provide end-to-end coverage of vital network segments, from LAN
to WAN. The WAN/ATM SuperTAP provides the ability to passively connect into any of the following WAN link types: DS-3 Clear Channel, WAN HSSI, ATM DS-3, and ATM OC-3.
• Real-time statistical monitoring and alerting: This enables users to learn about a potential problem before it becomes business critical.
• High-performance enhanced four-port gigabit hardware option: This is a customized four-port analysis card that ensures sustained full-duplex line-rate capture with hardware assist on the i1620 appliance for highly utilized gigabit segments.
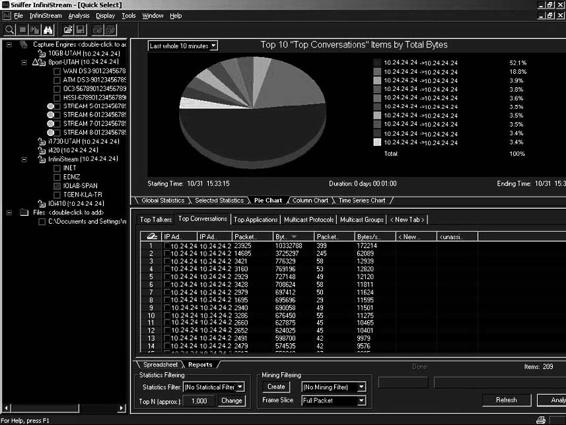
Figures 2-42 and 2-43 show screenshots from InfiniStream.
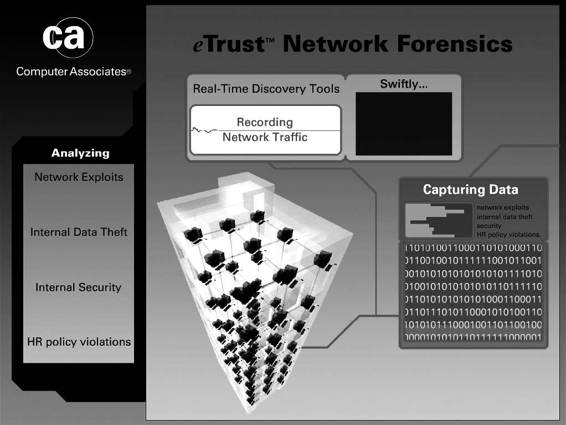
Tool: eTrust Network Forensics
eTrust Network Forensics helps an organization secure its network and ensure availability by capturing real-time network data to identify how business assets are affected by network exploits, internal data theft, and security or HR policy violations. eTrust Network Forensics can help the organization mitigate risk, comply with regulations, and reduce analysis and investigation costs by allowing IT and security staff to visualize network activity, uncover anomalous traffic, and investigate security breaches.
Figure 2-42 InfiniStream captures packets from the network.
2-40
Chapter 2
Figure 2-43 InfiniStream shows various types of charts describing statistics about network traffic.
The following are some of the features of eTrust Network Forensics:
• Network traffic recording and visualization: eTrust Network Forensics promiscuously monitors and records network traffic in all seven layers of the OSI stack in real time, and uses advanced visualization tools to create a picture of communication flows to swiftly expose anomalies, illegal connections, and security and network problems.
• Real-time network data capture: eTrust Network Forensics promiscuously monitors more than 1,500
protocols and services out of the box, and records network activity in real time into a central database that can be queried, providing a complete view of how network communications are impacting security and availability.
• Advanced visualization: eTrust Network Forensics helps administrators detect anomalies or trouble spots by transforming raw network data into actionable knowledge. It generates interactive
graphical representations of the series of events representing the propagation of an attack or other suspicious activity.
• Pattern and content analysis: eTrust Network Forensics visualizes and depicts abnormal usage, and analyzes e-mails, keywords, images, or other references to reveal improper data exchange or leakage.
• Communications catalog: eTrust Network Forensics stores and catalogs network packets in real time into a centralized knowledge base that administrators can query.
• On-demand incident playback: On-the-fly session reassembly enables you to quickly associate the com-municators based on addresses, domains, protocols, users, hardware vendors, and more.
• Advanced security investigation: eTrust Network Forensics uses advanced forensics investigation tools to diagnose network activities, allowing auditors, law enforcement agents, and enterprise security teams
Tool: P2 Enterprise Shuttle
2-41
Figure 2-44 eTrust Network Forensics captures and analyzes network traffic in real time.
to efficiently build critical intelligence to uncover anomalies, rebuild crime patterns, and review network asset utilization, architecture, and security policies.
Figure 2-44 shows a screenshot from eTrust Network Forensics.
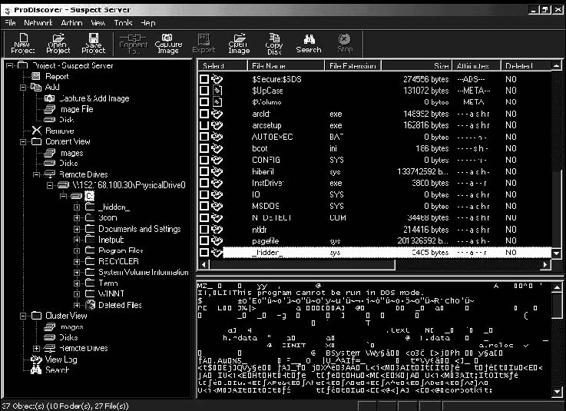
Tool: ProDiscover Investigator
ProDiscover Investigator investigates disk contents throughout the network. It checks for illegal activity and for compliance with company policies. ProDiscover Investigator can gather evidence for potential use in legal proceedings.
The following are some of the features of ProDiscover Investigator:
• Extracts Internet history
• Utilizes Perl scripts to automate investigation tasks
• Saves travel costs by forensically examining live systems
Figure 2-45 shows a screenshot from ProDiscover Investigator.
Tool: P2 Enterprise Shuttle
P2 Enterprise Shuttle is an enterprise investigation tool that views, acquires, and searches client data wherever it resides in an enterprise. It checks the main communication pass-through for the system as well as the routers and firewalls. P2 Enterprise Shuttle acts as the central repository for all forensic images collected and is integrated with MySQL.
2-42
Chapter 2
Figure 2-45 ProDiscover Investigator inspects disk contents around the network for
illegal content.
Figure 2-46 Show Traffic shows a continuous display of network traffic.
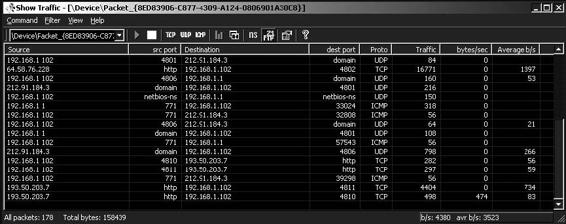
Tool: Show Traffic
Show Traffic monitors network traffic on a user-specified network interface and displays it continuously. It allows a user to find suspicious network traffic or just monitor the traffic flowing through the network interface.
Figure 2-46 shows a screenshot from Show Traffic.
Tool: Snort Intrusion Detection System
2-43
Figure 2-47 Network Probe provides a graphical summary of network traffic.
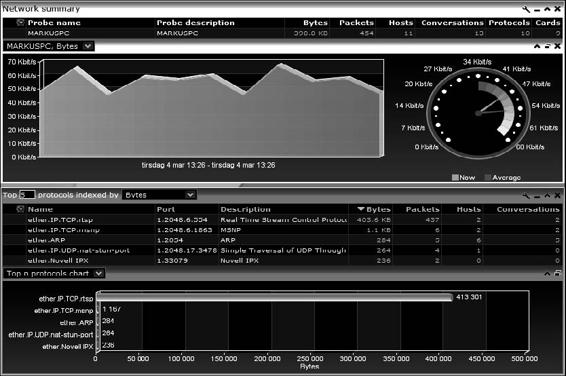
Tool: Network Probe
Network Probe identifies the source of network slowdowns and other problems. It shows who is generating troublesome traffic, and where the traffic is being transmitted to or received from. Figure 2-47 shows a screenshot from Network Probe.
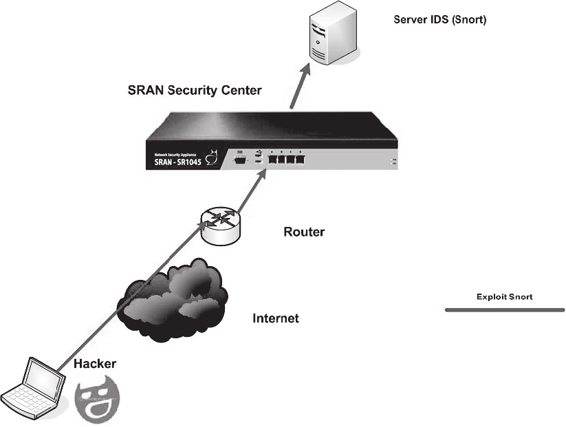
Tool: Snort Intrusion Detection System
Snort is a software-based, real-time network intrusion detection system that notifies an administrator of a potential intrusion attempt. Snort is nonintrusive, is easily configured, and utilizes familiar methods for rule development. Snort has the ability to detect more than 1,100 potential vulnerabilities.
Snort includes the following features:
• Detects, based on pattern matching, threats including buffer overflows, stealth port scans, CGI attacks, SMB probes, NetBIOS queries, port scanners, well-known backdoor and system vulnerabilities, DDoS
clients, and many more
• Uses syslog, SMB messages, or a file to alert an administrator
• Develops new rules quickly once the pattern (attack signature) is known for a vulnerability
• Records packets from the offending IP address in a hierarchical directory structure, in human-readable form
• Records the presence of traffic that should not be found on the network
Snort uses the libpcap library, the same library that Tcpdump uses to perform its packet sniffing. Snort decodes all the packets passing through the network to which it is attached, by entering promiscuous mode. Based upon the content of the individual packets and rules defined in the configuration file, Snort generates an alert.
![]()
2-44
Chapter 2
Snort Rules
There are a number of rules that Snort allows a user to write. Each of these Snort rules must describe the following:
• Any violation of the security policy of the company that might be a threat to the security of the company’s network and other valuable information
• All the well-known and common attempts to exploit the vulnerabilities in the company’s network
• The conditions in which a user thinks that the identity of a network packet is not authentic
Snort rules are written for both protocol analysis and content searching and matching. The rules should be robust, meaning the system should keep a rigid check on the activities taking place in the network, and notify the administrator of any potential intrusion attempt. The rules should also be flexible, meaning that the system must be compatible enough to act immediately and take the necessary remedial measures if there is an intrusion.
There are two basic principles that a user must keep in mind while writing Snort rules. They are as follows:
• Principle 1: No written rule should extend beyond a single line, so that the rules are short, precise, and easy to understand.
• Principle 2: Each rule should be divided into two logical sections:
•
The rule header, which contains the rule’s action, the protocol, the source and destination IP address, the source and destination port information, and the CIDR (classless interdomain routing) block
•
The rule options, which includes alert messages and information about which part of the packet
should be inspected to determine whether the rule action should be taken
The following illustrates a sample example of a Snort rule:
Alert tcp any -> 192.168.1.0/24 111
(Content: “ | 00 01 86 a5 | ” ; msg: “mountd access” ; )
Figure 2-48 shows how Snort fits into a network.
Copyright © by
All rights reserved. Reproduction is strictly prohibited
Figure 2-48 Snort is a powerful IDS that allows users to write new rules.
Documenting the Evidence Gathered on a Network
2-45
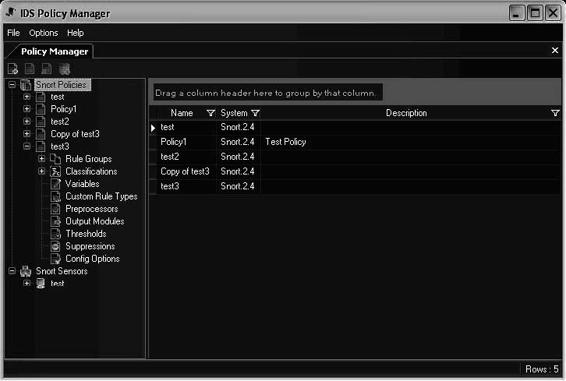
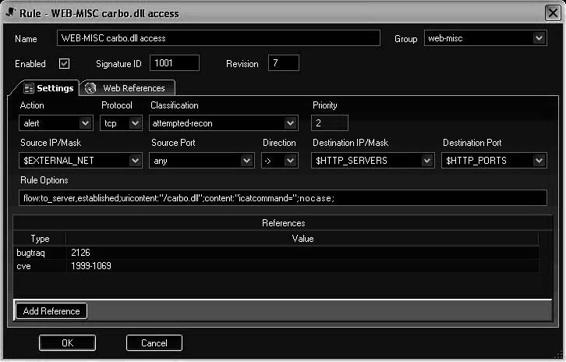
Tool: IDS Policy Manager
The IDS Policy Manager manages Snort IDS sensors in a distributed environment. Users can modify the configuration files using a GUI. Users can manage Snort by merging new rule sets, managing preprocessors, configuring output modules, and securely copying rules to sensors.
The following are some of the features of Snort:
• Ability to update rules via the Web
• Can manage multiple sensors with multiple policy files
• Can upload policy files via SFTP and FTP
• Supports external rule set for BleedingSnort and Snort Community rules
• Can learn details about a signature from popular databases such as CVE, BugTraq, McAfee, and
Snort.org Reference
Figures 2-49 and 2-50 show screenshots from IDS Policy Manager.
Documenting the Evidence Gathered on a Network
In any investigation, it is necessary to maintain a chain of custody. In a network investigation, an investigator is required to document the gathered evidence. Documenting the evidence gathered on a network is easy if the network logs are small, as a printout can be taken and tested.
But the process of documenting digital evidence on a network becomes more complex when the evidence is gathered from systems that are in remote locations because of the unavailability of date and time stamps of the related files.
Figure 2-49 IDS Policy Manager allows users to manage multiple Snort policies.
2-46
Chapter 2
Figure 2-50 Users can view and edit the details of a Snort rule with IDS Policy Manager.
The investigator should document the evidence-gathering process by listing the name of the person who collected the evidence, from where it was collected, the procedure used to collect the evidence, and the reason for collecting the evidence.
If the evidence resides on a remote computer, detailed information about collection and location should be documented. The investigator should specify the server containing the data to avoid confusion.
For documentation and integrity of the document, it is advisable to follow a standard methodology. To support the chain of custody, the investigator should print out screenshots of important items and attach a record of actions taken during the collection process.
Evidence Reconstruction for Investigation
Gathering evidence on a network is cumbersome for the following reasons:
• Evidence is not static and not concentrated at a single point on the network.
• The variety of hardware and software found on the network makes the evidence-gathering process more difficult.
Once the evidence is gathered, it can be used to reconstruct the crime to produce a clearer picture of the crime and identify the missing links in the picture. The following are three fundamentals of reconstruction for investigating a crime:
1.
Temporal analysis: Temporal analysis produces a sequential event trail, which sheds light on important factors such as what happened and who was involved. Usage patterns, such as a histogram or time grid, can show redundancies and deviations, which can relate to high-priority activity requiring immediate attention.
2.
Relational analysis: Relational analysis correlates the actions of suspect and victim. Once the relations are determined, it becomes easier to reconstruct the activities. Diagrams, such as association or relational, Review Questions
2-47
can reveal important links. Relational analysis is best suited for a small number of entities, but for a large number, the process becomes complex.
3.
Functional analysis: Functional analysis provides a description of the possible conditions of a crime. It testifies to the events responsible for a crime in relation to their functionalities. This analysis determines how things actually happened and what factors are responsible. Functional analysis presents the possible pattern of crime and fills in the gaps in the crime picture.
Chapter Summary
■ There are two types of network addressing schemes: LAN addressing and Internetwork addressing.
■ Sniffing tools are software or hardware that can intercept and log traffic passing over a digital network or part of a network.
■ The ARP table of a router comes in handy for investigating network attacks, as the table contains IP
addresses associated with the respective MAC addresses.
■ The DHCP server maintains a list of recent queries, along with the MAC address and IP address.
■ An administrator can configure an IDS to capture network traffic when an alert is generated.
Review Questions
1. Describe the two network addressing schemes.
_____________________________________________________________________________________________
_____________________________________________________________________________________________
2. Why was the OSI model developed? What problem did it solve?
_____________________________________________________________________________________________
_____________________________________________________________________________________________
3. Describe the two types of Ethernet environments.
_____________________________________________________________________________________________
_____________________________________________________________________________________________
4. Describe the functions of the different layers of the OSI model.
_____________________________________________________________________________________________
_____________________________________________________________________________________________
5. Describe the different types of DNS poisoning.
_____________________________________________________________________________________________
_____________________________________________________________________________________________
6. Why is it difficult to reconstruct evidence for a network investigation?
_____________________________________________________________________________________________
_____________________________________________________________________________________________
7. What three types of analysis must an investigator perform during evidence reconstruction?
_____________________________________________________________________________________________
_____________________________________________________________________________________________

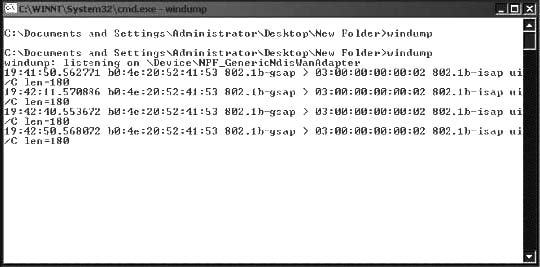
2-48
Chapter 2
8. How is the ARP table useful in a network investigation?
_____________________________________________________________________________________________
_____________________________________________________________________________________________
Hands-On Projects
1. Perform the following steps:
■ Navigate to Chapter 2 of the Student Resource Center.
■ Install WinDump.
■ Run WinDump in a command shell.
■ View the captured packets (Figure 2-51).
Figure 2-51 WinDump displays details about captured packets.
2. Perform the following steps:
■ Navigate to Chapter 2 of the Student Resource Center.
■ Install and launch Iris Network Traffic Analyzer.
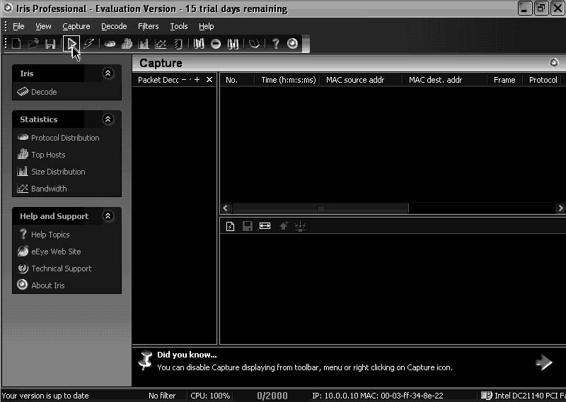
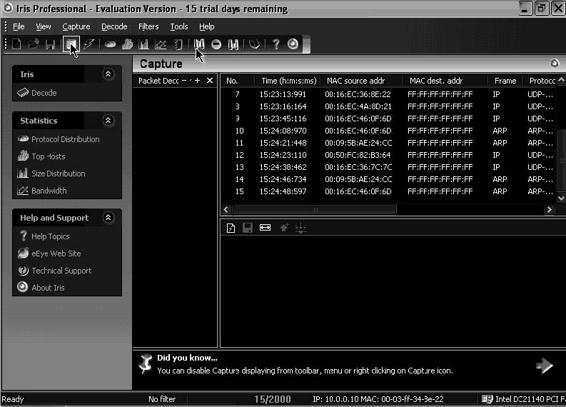
Hands-On Projects
2-49
■ Click on the green Go arrow (Figure 2-52).
Figure 2-52 The Go arrow starts traffic capturing.
■ After a few minutes, click on the red Stop rectangle (Figure 2-53).
Figure 2-53 Hit the Stop button once you have acquired enough traffic data.
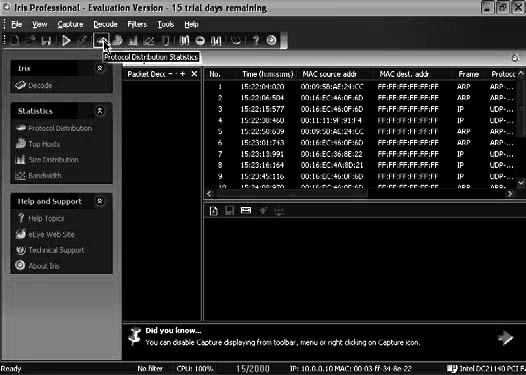
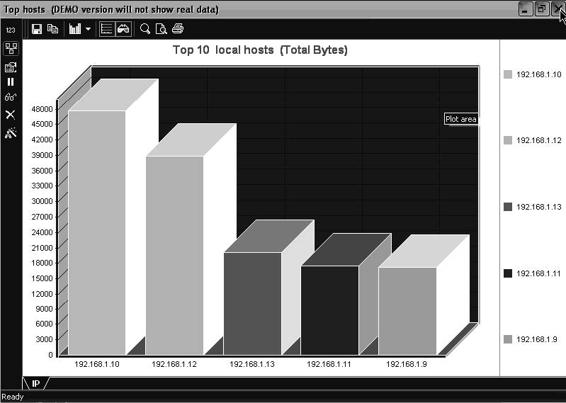
2-50
Chapter 2
■ Click on the Protocol Distribution Statistics button (Figure 2-54).
Figure 2-54 The Protocol Distribution Statistics screen shows statistics about the captured traffic.
■ View the graphical representation of network traffic (Figure 2-55).
Figure 2-55 Iris Network Traffic Analyzer can display a graphical representation
of data.
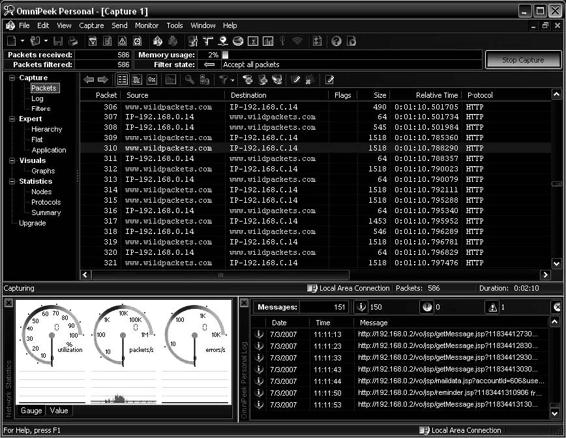
Hands-On Projects
2-51
3. Perform the following steps:
■ Navigate to Chapter 2 of the Student Resource Center.
■ Install and launch OmniPeek.
■ Start the capture and click the Packets option under Capture (Figure 2-56).
Figure 2-56 The Packets screen shows information about captured packets.
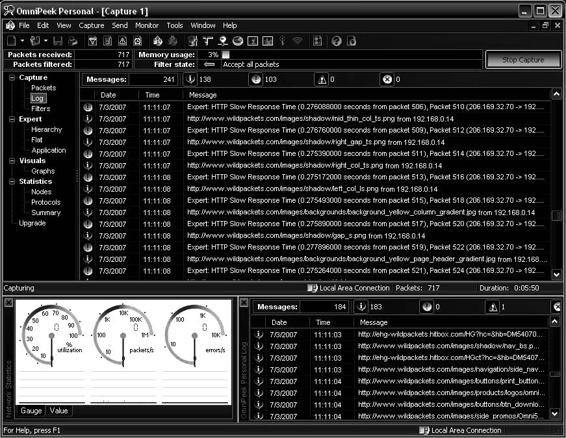
2-52
Chapter 2
■ Click the Log option under Capture (Figure 2-57).
Figure 2-57 The Log screen displays a lot of capturing activity.
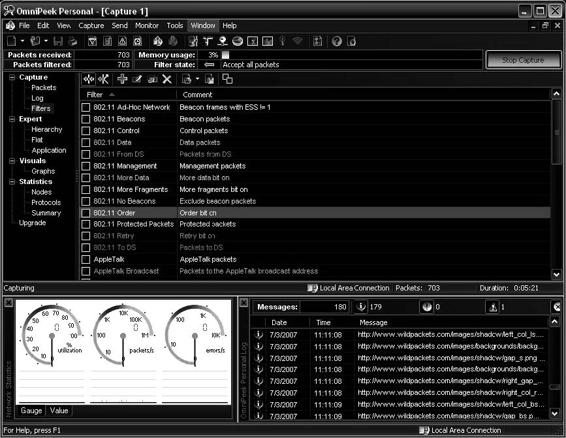
Hands-On Projects
2-53
■ Click the Filters option under Capture (Figure 2-58).
Figure 2-58 The Filters screen allows a user to filter traffic data.
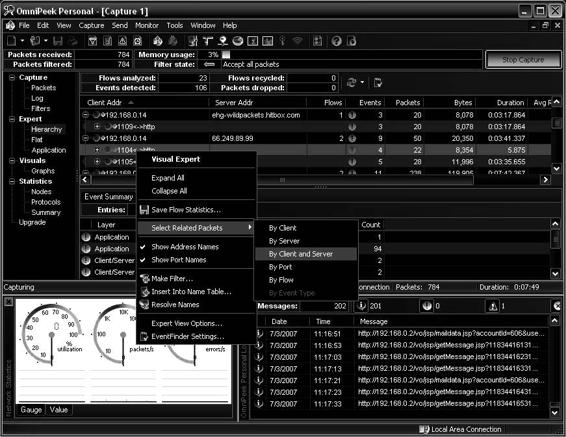
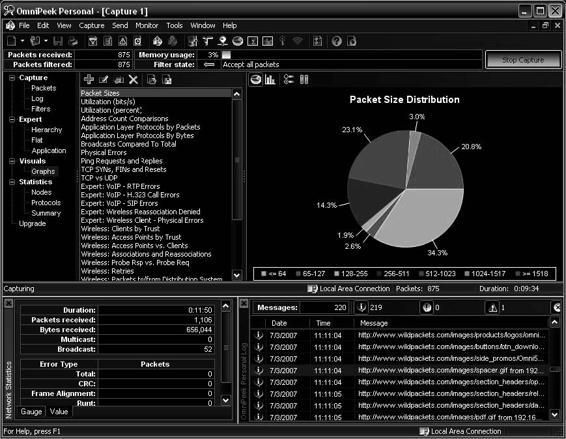
2-54
Chapter 2
■ Click the Hierarchy option under Expert (Figure 2-59).
Figure 2-59 The Hierarchy screen shows a hierarchical view of traffic data.
■ Click the Graphs option under Visuals (Figure 2-60).
Figure 2-60 OmniPeek can show a visual representation of traffic statistics.

All materials on the site are licensed Creative Commons Attribution-Sharealike 3.0 Unported CC BY-SA 3.0 & GNU Free Documentation License (GFDL)
If you are the copyright holder of any material contained on our site and intend to remove it, please contact our site administrator for approval.
© 2016-2026 All site design rights belong to S.Y.A.