Information Security A Practical Guide: Bridging the gap between IT and management (2015)
CHAPTER 7. DOCUMENTING THE SYSTEM FOR EVERYONE
Rationale: Systems have many technical designs that IT teams use to develop and maintain the system. However, these systems are very hard to understand for members of staff who are not technical, typically management. This can be a real barrier for management, especially when they need to make a key decision based on risk.
Content: To help management understand the system you can re-document the system into a kind of entity relationship diagram. This diagram will be a high-level view of staff, networks, systems and so on, and each entity will be connected with an arrow showing the flow of information and control points in the system. This diagram is even more useful when some entities are outside of the business’ control, for example customers or Cloud suppliers. Additionally this diagram can show where risks exist, to help decide where the most security controls are needed. The diagrams also help scope better penetration tests of the system, making sure our tests mimic the risks and cover all aspects of the system. This chapter features my own example of an e-commerce system fully designed using this method; the design includes all parts of the system, including developers, users, the network and so on.
Chapter Overview
One of the biggest obstacles is helping the business understand what the system looks like. Often their understanding is limited to the database, network and perhaps the web pages that provide the system interface. The truth is systems are far more complicated when we consider them from a risk point of view. I have often found a gulf between the technical diagrams provided by a system designer or architect and the technical understanding of the business. I have seen this gulf cause many problems in meetings where a lack of common understanding has meant subjects had to be revisited or people didn’t correctly understand the risk to the system, sometimes feeding their paranoia or giving a false sense of security. In this chapter I show how a system can be documented in a common, simple way. This technique not only allows the business to understand the system but also gives them the ability to collaborate with technical staff.
Objectives
In this chapter you will learn the following:
• How to document a high-level view of an entire system
• How to show control boundaries
• Showing the risks and where they exist in the system.
Setting the Scene
Before showing a diagram I need to set the scene for the system we are going to document. I have imagined the following scenario: I am working for an e-commerce start-up, which is looking to create its first online store that will allow them to sell their wares but also allow third-party sellers to also sell using their platform. The following basic requirements have been put together:
1. Customers must be able to purchase various items using card payments.
2. The website must be Cloud based so that it can scale quickly.
3. The database for the system must remain in house so that our team can administer it.
4. Third parties must be able to also add items to the database to sell.
Entities
Before we document the system we need to think about the things or entities that are involved (please don’t call this an entity relationship diagram, your database colleagues will hate you) in the system. This should include everything: systems, hardware, software, people, locations and sometimes processes. Add anything you think is key to showing on your system for an interaction. For our example let’s think about some of the entities:
1. Amazon web services (AWS) based within the EU.
AWS meets our Cloud requirement to allow us to scale quickly. They also have data centres within the EU, which is important as this means the Data Protection Act must be followed. I consider this a key point for two reasons: it gives some assurance as to how our data in their possession will be treated, and it is a regulatory rule that we must abide by as our service will be hosted within the EU.
2. Website, hosted on AWS with an API into our network to query the internal database.
This item is key as our e-commerce site will effectively be split in two, with the web pages themselves sitting on AWS so that they can scale up if our service proves popular. Our database that will contain all the items for sale will remain on our network so it’s within our control. This type of design pattern is a great example of something that can confuse and worry a business person. Often they will be worried that the system is in the possession of a third party and will question whether that third party has the same levels of security. Remember this point as it will translate well in the diagram we draw later.
3. Customers, who could be anywhere in the world connecting to our website via the Internet.
This is very obvious for anyone who understands the web, but it’s a key point to display for anyone who doesn’t understand the web. The Internet is involved and we need to understand what is connected to it and what is under our control.
4. Card payments carried out by third-party SagePay via the web.
Our company is a start-up that needs to process card payments. If we wanted to do this ourselves then we would have to comply with the Payment Card Industry Data Security Standard (the PCI DSS). At this stage this would be a heavy and resource-taxing effort, so outsourcing this requirement to a third party is an ideal choice. This is a key point we want to show in our diagram so that people understand where the customers will pay and where card transactions will actually take place.
5. Third-party sellers who can connect to a private web portal hosted internally by us.
This is an important process not only from a business point of view but also a security one. Any time data can be accessed or changed, risk is introduced to our system. For this requirement there is no need for the service to be Cloud hosted, and there are a few reasons for this. From a business point of view our third-party suppliers are not likely to increase as quickly as our customers, therefore we don’t need to scale quickly. From a security point of view this is a sensitive service, as changes will be made to our products’ database. If this service was provided on our AWS instance, then if AWS is compromised the entire system is lost as the attacker would be able to change the database and control what our customers see. Because of this risk the common sense approach is to split and host this service separately. If we host this service internally we cannot only control the service but also the connection to it, offering us a higher degree of assurance. Again, this is another key function that we need to display. If customers and third parties are both accessing a web page of some sort then people may assume they are accessing the same service. By documenting this in our diagram we can show a clear separation and explain the risk we are mitigating.
6. Our network that is provided by us and has an Internet connection.
We need to show what is connected to our network and how many systems it is connected to. This is important from a security point of view as we need to understand where sensitive systems are connected and where our boundaries are. If in our example we had one flat network that allowed customers to connect into, potentially we are exposing ourselves to the entire Internet for attack.
7. Our own web developers and database administrators as well as our own network administrators.
Most diagrams include customers or users but not the people involved in running and creating the system. That’s just insane, since in terms of fully understanding the system you are building you need to include your own people. Of course some common sense needs to be applied, and I wouldn’t expect to see literally every person, but for this example the web developers, the database administrators and our network administrators should be shown. Web developers are interesting for this example as they interact with the database API and the web pages on the AWS instance. That is because they code and deploy both. If we worked in a larger company then we may have separate teams (from a security perspective this would be better as a segregation of duty) for the web pages and the database API; our diagram would change to reflect that.
Service Overview
Based on the preceding requirements I have put together a service overview diagram. I call it a service overview because the diagram shows much more than just systems and people. Also, you can create one of these diagrams for your wider systems to show connections, but they work best when only showing a single service or subset of systems.
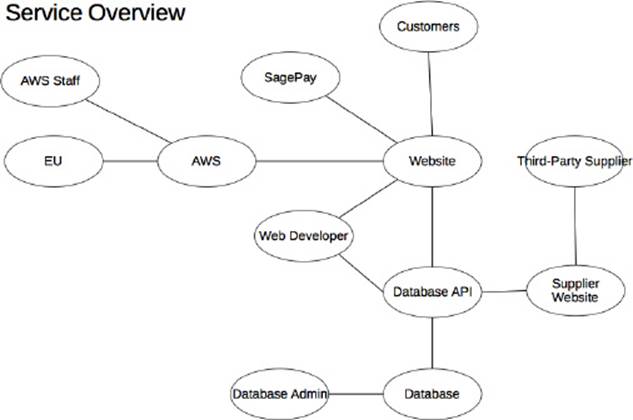
The preceding diagram is a first draft of all the entities and their interactions. It should give a good idea of who and what interacts with who and what. One of the first things you’ll notice is that I haven’t included the Internet or our network. Both of these things by their nature connect things, so if I include them then a number of the entities will be connected and it gets messy. The other problem is that strictly speaking, our customers connect to the Internet and then our website, and our website connects to our database API also via the Internet. If I drew the diagram to show this then it would cause confusion and some people may think the customer is actually connecting to our database API over the web; this is simply not the case. This blurry line is also repeated in a similar way for our third-party suppliers as they would connect to the web and then to our network via the Internet, causing another mess in our diagram. For the moment, put aside the fact that the Internet and our network are missing; I show you how to add those to the diagram in a moment. For now I will explain the connections and why they are connected in the diagram in the way that they are.
From top left, AWS is connected to AWS staff and EU. Amazon is a US company, so a business person’s first thought could be that the firm’s data will reside in the US; including EU clarifies things. It also clarifies which legal jurisdiction the data resides under. A question you may now have is where are our systems and network and shouldn’t we specify where they will be located? Typically they will be with the business, so if you’re UK based then they will probably be UK hosted; a business person will probably also make this assumption. Only include locations where they vary to that of the core business, but whether you take this down to city level rather than national level is up to you. AWS also has a connection to its staff. It is important to include this so we can see what other people will have access to on the cloud systems hosting our data and possibly even our information itself. This is even more key if those staff reside in a separate place to the system they are supporting. The next key entity is our website, which is connected to AWS because this is where it is hosted. It is also connected to SagePay, Customers, Web Developers and our Database API. The connection to SagePay is an important one as they are the ones who will carry out card payments on our behalf. A card payment process could have been added in between SagePay and our Website to clarify this, but seek feedback or assess how people interpret the diagram before adding this. If I were to add it then Card Payment would sit between SagePay and the Website entities. The next key part is the connection to our customers, as this clearly shows the part of the service they will connect to and clarifies that they will not connect to any of our internally hosted systems. The Database API is next on the list and this separation shows how the website will connect to our internal services as well as the split in the user interface and the business logic. I mentioned earlier that these two systems are split, one being on AWS and the other being internally hosted on our network. The diagram doesn’t yet show this division, but I will show you that soon. We now have our Web Developers, who are added to show that they are the ones building and deploying the Website and the Database API. You may want to divide this duty so that vulnerabilities aren’t introduced into both systems; however, for us it’s the same team and the diagram accurately reflects the reliance on this team. The next part is the Supplier Website and Third-party Suppliers, which has two key parts: the separation from the customer website and AWS, and the connection to the Database API. Again, the diagram doesn’t accurately show that the system resides on our own internal network, and this is covered later. The final part of the diagram is the Database and the Database Administrators. The database is our most valuable asset as this is where all the stock is logged and where the third-party sellers will add their own stock. The connection to the Database API is a key one as this shows that there isn’t a direct link to our database; an assumption can be made that the API is used to control access and therefore is a control to protect the database itself. The final key link is to the database administrators. This team are trusted to protect our key asset and are possibly the most important group from the point of view of supporting the service.
Adding Boundaries
It was obvious from the last section that this diagram needed to show Internet-connected services and our own internal network ones. So let’s add them.
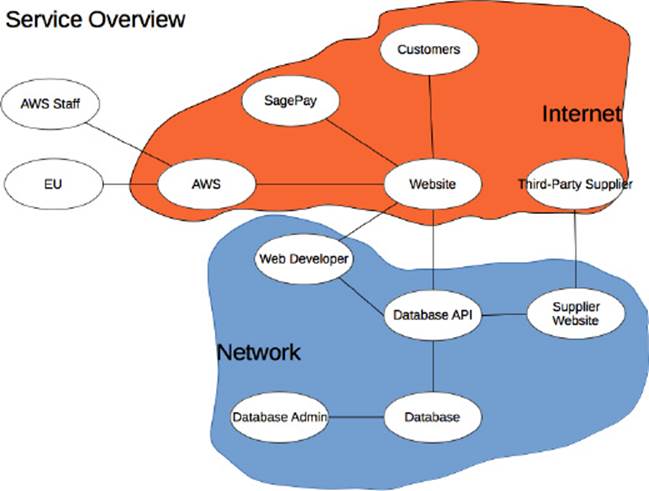
So from top left let’s work through our diagram again and understand why what entity sits where and why.
AWS Cloud, like most cloud services is internet connected and this is often the only way to connect to these types of services. Their staff sit outside of this location because for my example Amazon’s staff administer the machines directly not over the Internet, hence the direct link. The key part of the diagram is that our website itself is within the Internet zone because it is hosted and accessed from the Internet. Customers can access the website via the Internet and at no point is one of our internal systems directly used by the customer. SagePay is also accessed over the Internet. The payment service sits on the web and connects directly with our website, meaning that at no point do we handle payment details. Next is our third-party supplier, which also connects over the Internet but the difference is that they access a supplier website that is hosted on our own internal network. The next interesting point (or maybe concern) is that our web developers are building systems in both the Internet and the more trusted network zone. I say concern because they potentially provide a bridge between the two zones now because they work with systems on both sides.
Showing Information Flow
At this stage we understand the key entities in our system and where these entities reside. We have a good understanding of what entity interacts with what so we understand the system from a high-level point of view. The next stage is to add information flow. Not all flows of information are two-way, for example the web developer’s information flow with the website is one way. They create the website and then deploy it, which is a single-direction flow. It is important to understand the direction of the flows so that we know where information resides and can understand the risks. For example, where information flows out of a system we need to know where it’s going. The same as when information flows into a system, we need to ensure that access is allowed; an untrusted system should not be connecting to a trusted system and taking information out. Instead we have a trusted system push information out to an untrusted system, assuming we want the information to go that way.
I have amended the following diagram to show those information flows:
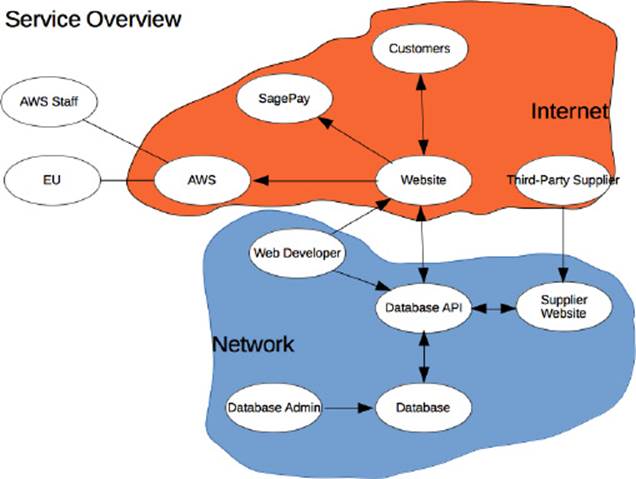
This time I will start from the customer and work my way down. The customer typically provides us registration and search information, and the system responds by displaying products it has retrieved from the Database API. The next flow is the flow to SagePay, which is a single-directional flow; via our own website the customer provides payment details. It is important that this flow is single directional so that data cannot be taken from the SagePay system via the website. Then we come to the web developer: their two single-flow interactions are developing and then deploying the website and database API. This is single flow because they don’t retrieve any information from the systems once created and deployed. Our third-party suppliers provide information only in the form of items for sale but they don’t actually receive any information back. They receive their output from the finance department in the form of invoices and payments so for the scope of our IT system they don’t actually receive any input. From a security point of view this is good because they are connecting into our network, and would be in a good position to exfiltrate data. The Database API is kind of working as a router, as it has data flowing into it and it is retrieving and sending that data back. From a security point of view it is one of the most sensitive services because of this function. If the Database API is compromised then the attacker can change or steal data from the database. I recommend splitting the database API into a customer and supplier API so that the systems have more granular specific functions. For example, the supplier API needs the ability to update the database but the user one doesn’t. The final set of flows are around the database, the database admins and the two-way flow of data between the Database API and the database. We know data flows to and from the database as it allows itself to be updated and serves information out for the customer. The database admin themselves only add information to the database as they support and configure it.
Adding the Threats
The final step is to add the threats to the system. In Chapter 4 we identified the threats and looked at how they could attack the system. Now we will map those threats onto the system so that we can better understand where and how they can attack the system. Adding all the threats to the diagram means we can see what parts of the system are most likely to be attacked and therefore ensure we spend more time and effort securing those parts of the system. For the next example I have picked four threats and mapped them to the diagram hackers, fraudsters, rivals and insiders.
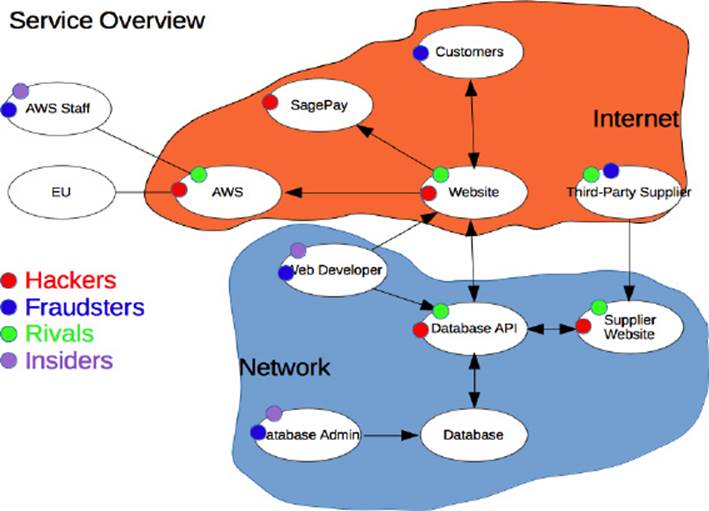
We now have a complete diagram showing the entities, how they link together and the direction of those interfaces. We have finally added the threats so at this stage we have a very good view of the risks posed to the system. Rather than working through the diagram I will explain this diagram from the threats’ point of view and suggest mitigations. I have added threats to each entity from the point of view of what they would be able to attack rather than what they would like to attack. So, for example, a hacker can’t just attack the database; they need to compromise the Database API first and then attack the database. When securing the system, time would be taken to secure the database so that a compromise to an edge service wouldn’t mean compromise to a deeper service.
I have added hackers to all systems that have an Internet connection, therefore allowing them to attack via the web. SagePay would be their primary target as this service takes card payments and would provide data of the most value to them in the form of card details and personal information. By having SagePay process the payments we have transferred this risk to them. Next on the list is AWS. Hackers will look to target this service regardless of whether we used it or not. Compromising this platform would allow them to further compromise other services that were deployed upon it. As with SagePay we have transferred this risk to Amazon. Our website will be targeted by hackers, first and foremost so that they can steal the personal information provided through registration and secondly so that they can use it as a platform to attack deeper services. In terms of sensitivity the Database API is the most sensitive service that we expose to the Internet, as it controls data in and out, and control of this service would almost certainly mean complete compromise. I would split this service so that a customer read-only version was exposed to the Internet. A separate update service for the supplier website would also be created, and this would not have a connection to the Internet, therefore mitigating the hacker threat. The supplier website is the least likely to be attacked by a hacker because it represents the least value to them in terms of what they can steal. This service is kept on our internal network because of the large impact its compromise would have.
I have marked fraudsters against those entities that represent people. I have not marked them against technical systems as if they attacked those I would consider them hackers. It’s important for your system to be clear about what each threat can do and how they could attack the system. My fraudster wants to compromise the system but by using social engineering attempts, for example getting staff to share login details or pretending to be a legitimate customer in order to gain access. The fraudsters may even consider threats of bribes to achieve their goals. I have included fraudsters to show that it’s not just the technical aspects of the system that could be compromised.
If you are selling an online commerce service, what better way to get new customers than to take down your rivals? Your rival’s site goes down and so their customers come to you; the law of averages says that if you provide a good service then you will retain some of those customers. Our suppliers also have rivals who wish to compromise their service, therefore I have added this threat not only to our website but also to AWS. I haven’t added rivals to SagePay because I would hope that financial institutions don’t make a habit of attacking one another. In terms of protecting against this threat I suggest using anti-DDOS technology or perhaps even Cloud hosting services. As for your suppliers who are targeted, either ensure they have a high service level with penalties or make sure you can move suppliers quickly.
The final threat are insiders, perhaps the scariest threat given the havoc they could cause. I previously mentioned segregation of duties for web developers as they create the website and the Database API and this threat is exactly why you would want that divide. They could compromise the entire system, or they could only compromise part of it; we would hope that the second team would spot the compromise to the other part of the system. Insider threats will always exist as long as your staff can be bribed or threatened, or even if they are not totally happy in their jobs. Background checks and thorough auditing can help mitigate this threat by ensuring people are trustworthy and they know their attack will be detected.
All materials on the site are licensed Creative Commons Attribution-Sharealike 3.0 Unported CC BY-SA 3.0 & GNU Free Documentation License (GFDL)
If you are the copyright holder of any material contained on our site and intend to remove it, please contact our site administrator for approval.
© 2016-2026 All site design rights belong to S.Y.A.