Crafting the Infosec Playbook (2015)
Chapter 8. Queries and Reports
“Truth, like gold, is to be obtained not by its growth, but by washing away from it all that is not gold.”
Leo Tolstoy
If this book were about gold mining, you’d have your mining plan all laid out at this point. You’d have your tools, a sluice box, a scale, and everything else you need to begin. You’d even have an idea of what to do with the gold once you’ve found it. Even though gold is everywhere, how are you going to separate it from the rest of the dirt? A random shovelful of dirt does contain gold, but obviously digging at random isn’t a very efficient or cost-effective strategy—you need a better plan. Just like finding gold, identifying actionable security events requires good queries to sort through a mountain of data to yield those incident and monitoring nuggets.
This chapter will help to equip you with basic ideas for creating valuable reports and the queries that power them. Keep in mind that the key to success is knowing how to ask the right questions about your log data. Explicitly define the problem you are trying to solve and then use the data to arrive at an answer. Like anything, developing effective queries becomes easier the more you practice and familiarize yourself with the data. Specifically, you need to know:
§ What makes a good report
§ Cost-benefit analysis of running a report
§ What makes up a good high-fidelity report, and how to decide when to make a report investigative or high fidelity
§ How to avoid great-but-impossible ideas and other pitfalls
§ How to work backward from an event to get a query that can effectively find more of the same and beyond
§ How to integrate security threat intelligence into your playbook
This chapter will help you get started creating the first few easy playbook reports. As you build a corpus of simple reports and familiarize yourself with your data and the report creation process, you’ll be ready for the more exploratory report creation process laid out later in the chapter, eventually making use of the more advanced query styles in Chapter 9.
False Positives: Every Playbook’s Mortal Enemy
The limiting factor in any searching endeavor is the amount of useless information you have to search through before you find whatever you’re looking for. In the needle-in-a-haystack problem, the useless content is the hay. In gold mining, it’s the dirt. All the extra content you have to sort through and discard on your way to finding what you’re looking for slows you down, and this ultimately limits the efficiency and effectiveness of your searches. The results returned from your searches broadly fall into three categories: the results you were looking for (which we usually call “true positives”), the results that really look like the bad stuff but turn out not to be bad (which we call “false positives”), and the rest of the events (which we call “benign” results, or hay). Hay can make the haystack really big and laborious for an analyst to sort through. There is no true delineation between benign results and false positives, and the definition will vary from analyst to analyst. Experts that are very familiar with a data source or the results from a query may easily be able to sort through most of the benign results at a glance, whereas to the untrained eye, every benign result may look like a true positive that turns out to be a false positive. The more you refine and tune a report query, the fewer obviously benign results you’ll have to sort through. With extensive tuning, you may be able to eliminate all the benign results so that every result looks like a true positive, even if some turn out to be false positives.
The real trouble with benign results is that each one takes a tiny bit of time and resources to analyze and discard, which draws you away from spotting the suspicious events. False positives are even worse, because they absorb your analysis time on a false lead. With enough benign events and false positives, the amount of analysis time adds up to a nontrivial drain on resources. This is why a needle in a haystack is such a hard problem. Even hay that doesn’t look like a needle can waste time when there is a lot of it. If a query returns too many benign events, there is a good chance you’ll spend so much time discarding hay that you just won’t have time to find the needles.
The majority of your logs are just like gold in dirt or needles in hay. The actionable events with useful security information are there in your logs, and they may even stand out when you see them, but finding what you want still requires a lot of time and effort. Creating good, effective plays is really about finding a way to identify and separate actionable events from the surrounding chaff to reduce benign events and false positives and the costly analysis time they bring.
There Ain’t No Such Thing as a Free Report
In a magical fairy-tale world without false positives, you could just have one report that extracts all actionable events in one step. In the real world, such all-encompassing and effective queries don’t exist. Creating successful reports is about striking the right balance between a query that’s broad enough to return the events you’re looking for, while not being so broad that your analysts spend all of their time sorting out benign events or worse, false positives. In general, analysis time is the primary cost of running a report. You need to do everything in your power to make sure result analysis is easy and efficient, and doesn’t get bogged down with junk data.
Because the analysis time cost can make or break a report, as you are writing the query, think about what the analysis section of the report will contain and how involved the processing of the report results will be. If every result that precipitates from the query requires significant human analysis, you must ensure that the query is narrow and doesn’t produce very many results or else your report will be too costly to analyze. Reports whose results require additional analysis, either by correlating with activity in other data sources or by building timelines of activity around the event’s occurrence, are especially costly in terms of resource utilization. Results that require detailed analysis aren’t necessarily bad, and sometimes they are unavoidable, but their additional cost does mean you need to keep them to a minimum.
Think of a report’s value in terms of a cost-benefit balance. You derive value from a report for every valid and actionable event it detects. If those events indicate a machine is infected with some common malware, possibly already thwarted by antivirus, then the benefit may be modest. However, if the events indicate some sophisticated hacking campaign, the benefit of even one detection may be very high. Of course, there isn’t an objective numerical measure of cost or value, so you must estimate the trade-offs of running a report based on three criteria:
§ The report’s objective
§ Analysis time for each true positive detection
§ The relevance/value of the results examined in the context of your environment
Your tolerance for potentially wasting time analyzing false positives will vary between reports because the risk and severity of the issue targeted by the report varies. A true positive alert for a critical issue may be so valuable that you can reasonably accept more analysis time on false positives.
Fortunately, in cases where a report can be made extremely precise, the difficult cost-benefit analysis does not have to be done. We call these high-fidelity reports. What sets high-fidelity reports apart from all the others is that they’re essentially free. High-fidelity reports are the “Holy Grail” of your playbook because the only cost to running them is the (often negligible) load to your systems performing the query. A high-fidelity report produces results that don’t need human verification—each result is directly actionable, doesn’t require a human to sort out the true positives from all other events, and is therefore a prime candidate for further automated processing. In other words, every result is a true positive.
An Inch Deep and a Mile Wide
You may be thinking, “Great, I’ll make all of my reports high fidelity so I don’t have to deal with the costs of dealing with false positives.” Unfortunately, the reality is that not every report can be high fidelity. You’ll find that the bulk of your good reports are investigative in nature because a highly specific query is usually what makes a report high fidelity. You’ll run out of highly specific, yet highly useful query criteria fast. There is no harm in looking for some specific behavior, but usually organizations face so many threats that detecting or preventing just one doesn’t significantly reduce their overall threat exposure. Most high-fidelity reports are built on specific indicators like a known-malicious IP address, domain name, file hash, or something similar. A common pitfall is to broaden the scope of a high-fidelity report by adding more indicators as they’re found. Soon, reports end up as a hodge-podge list of criteria, and report maintenance becomes unwieldy and burdensome fast. Worse yet, reports with lots of criteria lure you into a false sense of security because they seem comprehensive when they often just cover a small, imprecise subset of all of the indicators. They also tend to be deceptively tricky about their accuracy. Indicators such as IP addresses, domain names, and other hyper specific criteria may be malicious this week, but not next month or next year. Once a report based on dozens or hundreds of indicators starts generating false positives, it often requires extensive review and analysis work to re-vet all of these atomic indicators. Your threat intelligence management system and process is a much better place to handle lists of indicators. Without the benefit of threat intel management and curation, a report based on lists will become stale and may eventually lead to additional investigation time for false positive issues.
Take the example of the virtual hosts running on a remote web server. It’s completely normal for a single IP address to host hundreds of virtual hosts and domains. If you intend to detect attempts to contact an IP address reported as malicious, it’s likely that some of the connections are completely benign and legitimate (especially if more than a few weeks have passed since the IP address was flagged as malicious). If you start trying to exclude the benign events by adding more logic to narrow down an already poor query, you’ll end up adding complexity that won’t pay off in the long run. Normally, the cost in terms of time and effort to create a report is negligible, but trying to maintain a messy high-fidelity report can easily outweigh the benefit of the report. Don’t fall into the pitfall of clinging onto a messy and poor high-fidelity report if you can do better with an investigative one!
A Million Monkeys with a Million Typewriters
For some reports, there are other costs beyond analysis time. Just like reports, not all of your analysts are created equal. If a report requires sophisticated or skilled analysis such that only your top analysts can effectively process it, then the report has a higher cost. In some cases, it’s unavoidable to deploy reports that require highly repetitive analysis or a lot of manual analysis labor. Your analysts aren’t human machinery to be chained to a spot in the report analysis assembly line, so be wary of reports that are too repetitive. Carelessness is an unfortunate side effect of analyzing reports of this type. High stakes reports can also inflict analysts with general stress and anxiety. You likely don’t have reports looking for nuclear launches or Ebola outbreaks, but to your analysts, analyzing mission-critical reports or reports with high-level visibility can impart a similar fear. If the fallout of missing a true positive or accidentally flagging a false positive as a true positive is extremely high, every effort must be made to keep the report’s quality high.
Above all, don’t be afraid to reject or retire reports when it seems the costs outweigh the benefits. The security landscape is constantly shifting, and threats don’t last forever. Even reports that were once very good can stop producing enough results to justify the cost of running them. You also shouldn’t feel like there needs to be some quota on the number of reports you run. If you disable or reject an underperforming report, the resources that are freed up can easily be put to good use elsewhere, perhaps even creating newer and more salient reports. The number of reports doesn’t matter as much as actionable and comprehensive results do.
A Chain Is Only as Strong as Its Weakest Link
Malicious activity is rarely a singular set of behaviors to detect. Most real-world malicious behavior is an exceptionally complex system with many “moving parts” that work together to achieve a nefarious goal. The complexity of real attacks and malware is often a necessity because the software, computers, and networks subject to attack are themselves quite complex. Although this attack complexity can be quite daunting to a defender, it creates an asymmetry that we as defenders can take advantage of to help us detect or even prevent attacks.
Just as attackers don’t have to understand the inner workings of our systems to attack pieces of the system, we don’t have to understand all of the inner workings of their attacks to still detect the attack.
For even a technically modest operation like conducting click-fraud with malware (see Figure 8-1), attackers need a staggering amount of infrastructure to get their attack started and keep it going:
Some sort of malware delivery system to infect victim hosts
This usually involves developing or buying exploits, sending spam, setting up malicious advertisements, or actively scanning for vulnerable systems.
A way to trick or force the victim into downloading the malware
This usually involves (registering or hosting) domain names and their resolving IP addresses.
Bought or developed malware to infect hosts
The malware needs command and control infrastructure to receive lists of domains to click or other commands related to the fraud.
A robust system
The system needs the flexibility to include methods to update the malware and to add features, fix bugs, or change how the command and control works.
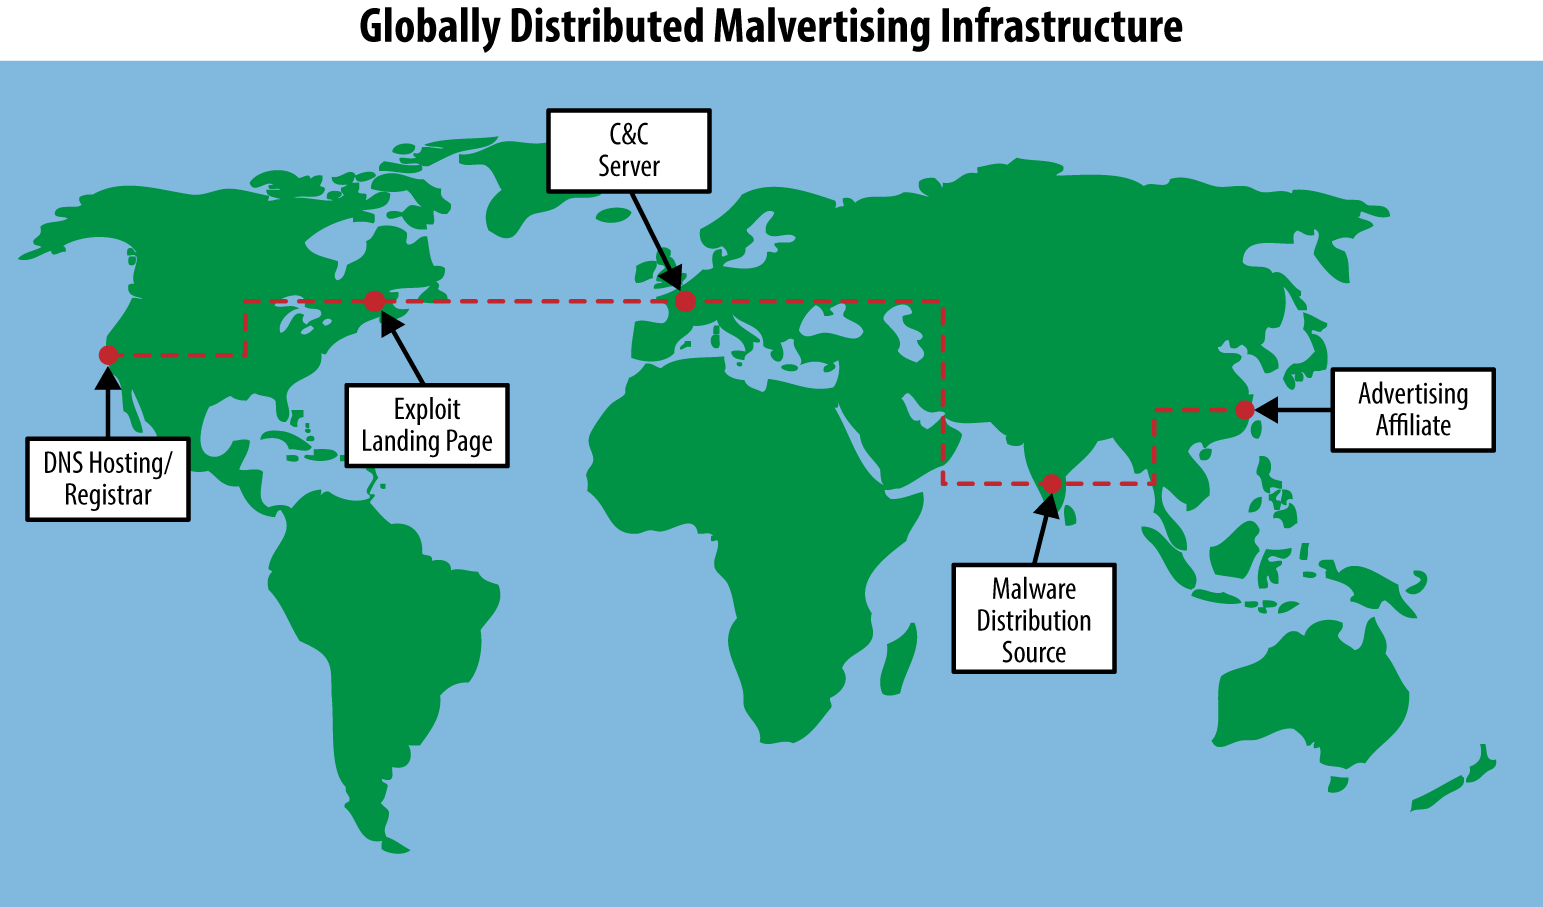
Figure 8-1. Typically, malware campaigns make use of globally spread infrastructure for successful exploitation and bot delivery. Often infrastructure is used based on availability and opportunity in response to the defender’s actions, forcing the attackers to constantly shift techniques. By splitting up the infrastructure into components, attackers are able to constantly work on standing up replacement infrastructure as needed.
In short, most real attacks are complex and require attackers to develop and maintain a lot of infrastructure. There are numerous points at which the defender can fight back. Just like in the Lockheed Martin kill chain model, you can detect an attack if you can detect even one of:
§ The exploit
§ The malware delivery process
§ The malware on the host
§ The callback to malicious controllers
If you can reliably detect any aspect of the long chain of events that happen over the course of an attack, then there is a report development opportunity.
Detect the Chain Links, Not the Chain
The motivation behind thinking about attacks in terms of a chain of events is not so you can try to detect the whole chain. Detecting the chain by looking at how the various links relate or correlate with each other is the stuff of marketing fluff. Rarely is something so complex that trying to detect the whole chain is the best, or even a good detection strategy. Instead, you should look for the easiest or most reliable-to-detect aspect of an attack—the weakest links in the chain.
If the malware authors have put a lot of time and effort into making it difficult to detect their bot because it’s polymorphic, packed, encrypted, and constantly changing, then don’t bother trying to detect the bot; instead, go after the command and control communications. If the communication is hard to detect, go after some other aspect like the domains or IP addresses involved in the attack. After all, at some point, the malware must use the network to have any profound effect for the attacker. If you can find more than one weak link in the attack chain that you can detect with high-fidelity methods, don’t build a report that looks for them to occur at the same time; instead, take a defense-in-depth strategy and create a report that looks for either.
Attacks change; if you build a complex report that requires every indicator in the chain of events to happen in sequence, even minor permutations on the attack can break your report. If your report can detect any of the weak links in the attack, you’re more likely to trigger on variations of the attack where not every indicator has changed.
Simplicity should be your goal in detecting any specific malicious activity. The simpler the aspect of an attack you’re trying to detect, the simpler the report and query logic must be. A query like “A and B” is more complex and much less likely to produce results than “A or B”; therefore, as long as event A and event B are both high-quality indicators, your report is likely to be more robust.
Getting Started Creating Queries
One of the hardest things about developing a playbook with efficient reports is getting the first few reports developed. It’s easy to think up big ideas but have only a vague idea of how to actually implement them. Don’t let this discourage you or bog you down. Although counterintuitive, in your initial efforts at getting started making reports, it’s easier to go for a few easy high-fidelity reports. The main reason why high-fidelity reports are often easier to make is that they’re often very specific. High-fidelity reports are usually based on a single, very reliable indicator, like a request to some malicious domain that matches a precise pattern. If you can find an indicator that demonstrates something is compromised beyond a reasonable doubt, then creating a report looking for that indicator is easy and no analysis of the query results is needed. Creating investigative reports requires a certain amount of subjective gut feeling about the cost of the report and the efficacy of the results, which high-fidelity reports sidestep.
The easiest thing to do is pick some simple, concrete idea and jump right in. If you don’t have any concrete ideas, don’t worry—there are many places to get them. No algorithm can adequately perform the task of objectively and empirically knowing what to search for. Trust your human brain and your security instincts. Here are some of the things you can do to get started:
Review existing or historical case investigation data
Have you had a machine compromised in the past? How did you investigate the issue and ultimately determine how the machine was compromised? Was there a “smoking gun” indicator in your logs that would have pointed to a security incident? Particularly good indicators for getting started are things like malicious domain names or IP addresses that the compromised machine was looking up or communicating with. If antivirus software was installed, the specific names of malware flagged by AV software can be used to locate additional infections in your logs, which can lead to finding indicators on other hosts or finding indicators associated with the malware published online. If samples of network traffic from the incident are available, those indicators can often be used to write IDS signatures. Similarly, if you have a searchable full-packet-capture system, the same indicators can be used to search through that traffic. Authentication logs can provide additional context around if a login was unexpected as a result of this incident. On their own, authentication logs are also great at detecting egregious abuse, like brute-force login attempts.
Search for indicators published online
InfoSec has matured to the point where there is a lot of content published online about monitoring and incident response. Most major researchers and companies have blogs they use to publish current research and recent security trends. This research often comes with example indicators or other technical information about specific emerging threats. There is no comprehensive list of places to look, but it’s a good idea to start with major security and antivirus companies and then branch out based on current security trends and researchers focusing on areas relevant to you. Eventually, you’ll build a lengthy list of excellent sources from mailing lists, blogs, Twitter, and other places where security engineers discuss and write about attacks. After you’ve found some technical information, you can search your data for any of the indicators mentioned. It often only takes one indicator such as a domain, IP address, or regular expression to find many other related indicators. You can search your own network logs for the indicators to better understand your organization’s exposure, or you can search for the indicators online to stitch together a complete picture based on information published in many different places.
Search your security logs for malicious activity
When you don’t have many reports, it’s often easy to find low-hanging fruit in your logs. If you begin with logs that are already good at detecting malicious activity like AV or HIPS logs, you won’t have to sort through as much benign activity before finding a good indicator to use as the basis of a report. For example, host security software might successfully identify malware or unwanted software on a client and report this information through its logs. Rarely does AV or HIPS software detect and stop an entire attack. Where there’s smoke, there’s fire. Activity in other event sources from around the same time as when AV or HIPS software logs malicious activity is a great place to find other indicators. Building reports that detect attacks using indicators in any of several data sources is critical to a good defense-in-depth monitoring strategy.
After you have a corpus of reports built up, creating new reports will feel natural. You’ll also have a good feel for what sort of indicators make for high-fidelity reports. Whatever you do, avoid pie-in-the-sky report ideas early on. It can be very tempting to try to create a sophisticated report to detect a major security threat. For example, if your idea involves multiple events across multiple, different data sources in a specific sequence, then it’s probably too sophisticated to start with. Also, if your idea is very generic, it can be hard to create a reliable report that doesn’t generate too many benign events or require too much human analysis time. Your initial report should be both specific and simple. Only after you’ve made several specific and simple reports should you expand your scope to include more sophisticated report ideas based on all of the patterns you’ll start to see lurking in your data.
When we were getting started, one of our first fruitful high-fidelity reports was based on highly specific intel from the Swiss abuse.ch service for tracking the ZeuS family of information stealers. The ZeuS Tracker service provides a highly curated list of ZeuS-related domains, IP addresses, and URLs. Their compromised URL list at https://zeustracker.abuse.ch/blocklist.php?download=compromised contains a long list of URLs associated with ZeuS downloads and C2 servers. At the time of writing, the list contains entries such as http://anlacviettravel.com.vn/home/plugins/system/tmp/bot.scr and http://albrecht-pie.net/new/gate.php. With such a highly specific and high-quality list of URLs available, the report logic is already done for you. We regularly (automaticrally) rebuild our report query to reflect the ongoing changes to the ZeuS tracker URL list and integrated it into the following query:
§ HTTP Request
§ URL of request matches any of:
§ <Full ZeuS Tracker URL list>
Because this query is based on a list of specific criteria, it falls into our intel-based report category, which we discuss in more depth at the end of this chapter.
Turning Samples of Malicious Activity into Queries for Reports
In the children’s board game Guess Who?, two players each choose a character from a grid of pictures and try to guess the other player’s chosen character by asking simple “yes” or “no” questions. The pictures in the grid are each attached to a little plastic hinge that allows pictures to be flipped down when an answer to a question eliminates that character. By process of elimination, when only one photo remains standing, that character must be the other player’s choice. Typical questions include “Does your person have a red shirt?” “Is your person a woman?” and “Does your person have any facial hair?” Although many characters share traits like facial hair and shirt color, each character’s total set of traits is unique. In many ways, finding specific events in your security logs is like a giant game of Guess Who? where your goal is to find the right set of questions to ask in order to find logs with actionable security information in them.
In the world of data science, an object’s traits are often called attributes. More generally, in the world of machine learning, any tidbit that can be used to make something stand out is called a feature. The term feature tends to be a bit more generic and all encompassing, so that’s the word we’ll stick with. The following is an example of a Conficker malware HTTP C2 callback request:
GET /search?q=149 HTTP/1.0
User-Agent: Mozilla/4.0 (compatible; MSIE 6.0; Windows NT 5.1; SV1)
Host: 38.229.185.125
Pragma: no-cache
One feature of the request is that it uses HTTP/1.0. Another is the Host header with the value 38.229.185.125. Features can be much broader in scope, though, and make use of less obvious traits like metadata. When searching for a needle in a haystack, one feature of the needle is that it is made of a metal that is attracted to a magnet. In the preceding Conficker example, some of the features include:
§ There are exactly three HTTP headers
§ The question mark in the URL follows a filename that does not have an extension
§ The host is an IP address rather than a domain name
The first step to finding an event is to identify what features the event has. When you have a list of features, you can use a combination of the less common of those features to uniquely define the pattern of what you’re looking for.
To illustrate the power of identifying a pattern by using a combination of event features, first it is worthwhile to look at naive approaches to see why they fail. One naive approach would be to search your HTTP logs for requests to the exact URL http://38.229.185.125/search?q=149—but if you do that, you’ll find just the one request you were looking for and no other Conficker requests. Such an absurdly specific high-fidelity report isn’t going to be very useful. A slightly less naive approach would be to search for URLs that contain search?=. In addition to turning up Conficker requests, this query will find other events including the following:
GET /search?q=modi&prmd=ivnsl&source=lnms&tbm=nws HTTP/1.1
Host: www.google.com
User-Agent: Mozilla/5.0 (compatible; MSIE 10.0; Windows Phone 8.0; Trident/6.0;
IEMobile/10.0; ARM; Touch; NOKIA; Lumia 820)
Referer: http://www.google.com/m/search?=client=ms-nokia-wp&q=%6D%6F%64%69
This result is a false positive. The more false positives a query returns, the more effort is needed to analyze the results. To create a good, high-fidelity query for Conficker, you should list the request features and estimate how common those features are. If you aren’t very familiar with a data source or you can’t estimate how unique a feature is, you can always query your data source for just that feature to see what kind of results are returned with that feature. In fact, this is exactly what you should do to determine how unique a feature is to a particular threat. It’s usually a good idea to do this even when you do have an estimate, because finding results with the same feature often gives you a better picture of what a false positive could look like. One ancillary benefit to this searching is that you’ll likely find other malicious activity with some features in common. When you find leads to other reports while working on an initial report, you can feel like a miner that just struck a big vein of gold with nuggets everywhere!
The following is an example of a feature list for the Conficker HTTP request, sorted by the likelihood of seeing that feature in the entirety of your web proxy data:
Very Common:
§ Uses HTTP
§ GET request
Common:
§ Internet Explorer User-Agent string
Uncommon:
§ HTTP protocol 1.0
§ Does not contain a Referer header
§ Takes a “q=” parameter
§ Filename in URL doesn’t contain an extension
§ Request is directly to an IP address
§ File path in URL is in base directory
The common versus uncommon categories aren’t scientific in nature, and there isn’t some cutoff that separates the two. Instead, the groupings between common and uncommon are there for you to estimate how useful a particular feature is likely to be. The more uncommon features you can identify, the more likely you’re going to be able to weave together enough of them into a great report. By querying the logs for some of the uncommon features, you can focus on just the right set of features so that the query isn’t too specific that it misses malicious activity, while also not so general that it catches harmless activity. This step is very important, because if you go straight to writing a very specific query, you’ll likely miss slight permutations on the request like this one that some Conficker variants make:
GET /search?q=0&aq=7 HTTP/1.0
User-Agent: Mozilla/4.0 (compatible; MSIE 6.0; Windows NT 5.1; SV1;
.NET CLR 1.1.4322; .NET CLR 2.0.50727)
Host: 216.38.198.78
Pragma: no-cache
After testing various features and combinations of features, you will hone in on a high-fidelity query for detecting Conficker. Our query includes the following:
§ Does not have a Referer header
§ Contains “/search?q=” in URL
§ Request uses HTTP 1.0
§ Full URL matches the regular expression “^http://[0-9]+\.[0-9]+\.[0-9]+\.[0-9]+/search\?q=[0-9]{1,3}(&aq=[^&]*)?$”
NOTE
This regular expression is looking for URLs that start (^) with http:// and then an IP address by looking for four sections of numbers split up by three periods (dotted quad). There is no need for the regular expression to be more precise about checking for valid IP addresses.
The remainder of the regular expression looks for a one- to three-digit value for q= and then an optional aq= parameter with any value before the end of the URL ($).
For much more detailed information about regular expressions, see Jeffrey Friedl’s Mastering Regular Expressions (O’Reilly).
The Conficker example is a classic easy-to-find event with a unique enough set of features that building high-fidelity detection for it is relatively straightforward. Conficker is currently a static target, though—there are only a few variants, and they aren’t being updated. In most cases, the activity you’re trying to detect is a moving target that’s constantly using new domains and new IP addresses, and the bad guys are changing tactics and updating the malware on a continual basis with additional features or functionality.
Reports Are Patterns, Patterns Are Reports
When you’re first getting into the report creation mindset, you’re bound to run into the question of what the threshold for creating a report should be. The general approach we take for determining what should become a report is that reports should look for patterns of activity instead of specific indicators. That is, if you’re searching through your data and you see a request to a malicious domain, you shouldn’t create a report based on a query like:
§ HTTP GET Request
§ Domain is verybaddomain.com
One of the problems with a report like this is that there is no end in sight. There are thousands of new malicious domains every single day, and you could never hope to keep up creating reports like this. It isn’t just domains that are troublesome either. Malicious IP addresses, known-bad User-Agent headers, cryptographic hashes of files, and other highly specific indicators are all too specific to create individual reports based entirely on a single indicator. It isn’t that specific indicators aren’t reliable—they often are—it’s that a playbook filled with highly specific reports becomes unwieldy and hard to manage, and the time spent creating new reports will outweigh the value of the reports. Specific indicators like known bad domains and IPs are useful for finding malicious patterns, and they do play an important role in detecting malicious events, but detection logic based entirely on them requires special handling. At the end of this chapter, in the section titled “Intelligence: A smart addition to your playbook”, we discuss ways of integrating indicators into your playbook in a maintainable way.
The Goldilocks-Fidelity
In the classic children’s story Goldilocks and the Three Bears, a trespassing child tastes the porridge of a family of three bears before determining which bowl was the perfect eating temperature. When building a query for a report to detect an evolving threat, you want to shoot for the “Goldilocks-fidelity”—not too specific that you only catch a few events and not too generic that you catch too many other events. Finding the Goldilocks-fidelity is more of an art than a science, as there is a certain amount of unavoidable experience-based gut feeling that guides the report creation. Your tolerance for false positives and false negatives in a report is based in part on the value of finding the event you’re looking for and the amount of analysis time you can spend sifting through results.
A good example of less straightforward events are the requests made by Java falling victim to a version of the Nuclear Exploit Pack. The following are examples of exploit requests:
GET /f/1/1394255520/1269354546/2 HTTP/1.1
Host: bfeverb.nwdsystems.com.ar
User-Agent: Mozilla/4.0 (Windows 7 6.1) Java/1.7.0_09
And in another event:
GET /f/3/1395062100/1826964273/2/2 HTTP/1.1
Host: interrupt.laurencarddesign.com
User-Agent: Mozilla/4.0 (Windows 7 6.1) Java/1.7.0_05
It is possible to make a feature list for these requests, but there aren’t a lot of features to go on:
Very Common:
§ Uses HTTP 1.1
§ GET request
Common:
§ User-Agent is Java
Uncommon:
§ URL contains a lot of numbers
§ URL contains a lot of slashes
§ URL starts with /f/
§ URL ends with 2
Very Uncommon:
§ URL contains a Unix timestamp between slashes
With a feature list like this, it can be hard to determine where to start in locating other events. Do all malicious requests start with /f/ or end in 2? In most cases, you’ll have no idea, so you’ll need to do exploratory queries to find out. Unfortunately, even if all past malicious activity contained both, there is a reasonable chance that future ones won’t. If you build features like that into the query, you could end up missing a lot of malicious events. You’ll need to rely on your experience with a data source and go with your gut. In cases like this, it can be tempting to go another route, like making a list of domains or IP addresses and watching those instead. For example, in a 90-day period, there were only six domains in the logs for the Nuclear Exploit Pack requests, so a query like the following might seem reasonable:
§ User-Agent contains “Java”
§ Domain is any one of (OR):
§ “edge.stroudland.com”
§ “interrupt.laurencarddesign.com”
§ “instruct.laurencard.com”
§ “lawyer.actionuniforms.com”
§ “bfeverb.nwdsystems.com.ar”
§ “jbps61lz.djempress.pw”
Remember, though, domains and IP addresses are usually treated as disposable resources, so what’s used today (or in the past) is often a poor predictor of what will be used in the future. For this reason, it can be very hard to maintain a query and keep it updated with whatever the domain or IP du jour happens to be. Queries based on lists of values are very useful for manual exploring to get an idea of the variety and variation of events related to some security incident, but they should only be put into production reports as an absolute last resort. It is very common to see the specifics of security events like the domain or IP address change frequently while the overall pattern of the events stays the same. Instead of building up lists of domains and other specific indicators in a single unwieldy report, you can take the specific indicators you run into and add them to your security intelligence management system so that they get picked up by your intel-based reports.
With that in mind, the goal should be to create a query that looks for a pattern rather than a query that looks for the same specifics every time. Using the features identified in the two preceding sample Nuclear Exploit Pack requests, a reasonable query could tease out the pattern with an approach like the following:
§ User-Agent matches a typical Java request string
§ URL contains at least four / characters after the http:// portion
§ URL contains a run of between 20 and 30 numbers bounded by / and optionally with / between numbers
§ URL contains numbers that look like a Unix timestamp between / characters
§ URL only contains letters, numbers, and slashes (excludes common URL characters such as periods, questions marks, etc.)
This query is highly effective at detecting the example variant of the Nuclear Exploit pack while still being generic enough that the domains and IP addresses it’s hosted at can change without affecting the report. Even future versions of the exploit pack are likely going to match the query, which will make the query effective for a longer period. Because the query is based on a unique enough set of features, it is very unlikely that it will produce false positives, and if it does, there probably won’t be many. When there is only one or a few false positives, it’s usually possible to identify the unique features the false positives have and then explicitly exclude those features from the query. However, this can be a dangerous game if the number or type of false positives grows. If tuning out false positives by explicitly excluding them becomes unwieldy, instead of negating event features, you may need to add yet another unique feature the malicious events have that the false positives don’t.
NOTE
In general, positive features (ones required for an event to match) tend to be more powerful and less finicky than negative features (ones excluded for an event to match). One trick to creating high-quality queries is finding ways of using positive features to make the event you’re looking for stand out from all of the other events in your logs. After you have a set of traits (features) that describe the event you’re looking for, it’s just a matter of constructing a query that selects those features all at the same time. If the events you’re looking for don’t have enough unique features to make them stand out, there is little you can do.
Exploring Out of Sight of Land
Up to this point, most of the discussions and examples of report creation strategies have all involved building off a sample of the malicious activity. You’ve learned how to identify unique features of a particular event and build queries to find other events with those same features. However, you won’t always have examples of malicious activity. Sometimes, you will want to find things based only on an idea of what the malicious activity might look like rather than anything concrete. The most obvious strategy is to just guess at some specific set of features you think malicious activity would likely have and then write a query to detect those features. More often than not, though, you’ll find that jumping straight to a fully defined query based on guessed features won’t return anything useful. Instead, you need to be smart but methodical about building new reports without the benefit of examples. There are many ways to do this, but we will focus on a few we find particularly effective.
Sticking with What You Know
By the time you’re at a stage where you’re creating reports based on hunches rather than concrete examples, you should already have quite a few reports under your belt. Often, your existing reports are the best source of ideas for new reports. In the process of identifying features for specific events and building queries for those events, you spent a lot of time finding a unique set of features for an event. If you leave out the most specific features but include some general indicators of “badness,” you can search through logs that are similar but much broader and more inclusive than events you already know about. These sorts of queries would usually make for poor investigative reports due to the number of benign events and false positives, but they can make great exploratory queries for you to try to find previously unknown events.
For example, if you’ve made a good set of reports based on HTTP logs, you’ll probably find a few reports looking for POSTs without a Referer header. The circumstances under which a web browser would legitimately POST to a server without a Referer header are rare and often convoluted. However, exclusively looking for matches with both features produces too many false positives for a playbook report. If you spot a suspect event with a broad query, you can then pivot and use that event for further exploration. The specific way to pivot is going to depend on the data source and the event(s) you find. Often, there are multiple possibilities, and you will have to select the likely best ones based on your experience and understanding of your data. The following query is an example of broad searching using the HTTP POST with no Referer header:
§ HTTP POST
§ No Referer header
§ Deduplicated events by the source host
As you can imagine, many results are returned. Sifting by hand through the first 50 results quickly turns up:
POST /index.php HTTP/1.1
Host: m0nplatin.ru
User-Agent: Mozilla/4.0 (compatible; MSIE 7.0; Windows NT 5.2; WOW64;
.NET CLR 1.1.4322; .NET CLR 2.0.50727; .NET CLR 3.0.4506.2152;
.NET CLR 3.5.30729; InfoPath.1)
Although there is nothing specifically malicious about this event, the domain looks highly suspect. By itself, the .ru TLD isn’t inherently malicious, but it has built up a relatively low reputation because a lot of malicious actors abuse it. Unless you’re a Russian-based organization, uses of .ru won’t be very common, so using it as a possible indicator of malice is reasonable. More significant than the .ru TLD, though, is the actual domain name text m0nplatin. Humans are expected to type, and usually don’t make use of l33t spe4k, so the zero in place of an “o” is unusual. Many common fonts used don’t have much difference between a zero and capital O, which can trick users (or security analysts!) into thinking they’re seeing one name when they’re actually seeing another. When you combine the suspect domain with a HTTP POST and no Referer, the event as a whole stands out as highly suspicious.
Other than the domain, though, there aren’t a lot of other identifying features that would make this event particularly great for a report. Without a useful pattern, you’d probably have to build a query looking for the specific domain. Even though the results would likely be a high-fidelity report, it’d also be highly specific and likely not useful for long. There is nothing intrinsically wrong with a highly specific report like this, but without more evidence that it’s a significant or prevalent threat, creating a report for it will just be a drop in the bucket. Instead of trying to build a one-off report for this event, adding the domain to your locally generated intelligence list should be effective enough at detecting identical subsequent infections.
You don’t have to stop at the most obvious indicators, though. Yes, a report looking for a POST with no Referer to the domain would work, but when you’re exploring, you should try to pivot on other features to see where they lead. One way to pivot on this event would be to notice that the POST is to a PHP script and add that criteria to your exploratory query to see what it gets you. We know from experience that this query is a good way to start exploring your HTTP logs for possible malicious activity:
§ HTTP POST
§ No Referer
§ File on server is a PHP script
§ Deduplicate by client host
Doing so would still be awfully generic, though, and wouldn’t take you much closer to the malicious activity the previous query returned. Another option would be to look at any similar activity from the same host to see if any other events have more features for identification:
§ HTTP POST
§ No Referer
§ Same source host seen performing previous malicious event to m0nplatin.ru
This query returns many interesting malicious events, including the following:
POST / HTTP/1.1
Host: pluginz.ru
User-Agent: Mozilla/4.0 (compatible; MSIE 6.0; Windows NT 5.1; SV1)
POST / HTTP/1.1
Host: yellowstarcarpet.com
User-Agent: Mozilla/4.0 (compatible; MSIE 6.0; Windows NT 5.1; SV1)
Of course, there are events showing connections to many other domains, too. The vast majority of the events use the same Internet Explorer 6 User-Agent string, though (for historical reasons, Internet Explorer and almost all other browsers claim to be a version of Mozilla). Experience will tell you IE 6 is ancient and has almost no legitimate deployment anymore. The same is rapidly becoming true of Windows NT 5.1 (XP). Adding these features to the initial query is quite effective:
§ HTTP POST
§ No Referer
§ User-Agent claims “MSIE 6.0” and “Windows NT 5.1”
Almost all of the results of this query look quite suspect, if not outright malicious. Depending on your data, you might find the results good enough to turn that query directly into an investigative report. It’s pretty easy for an experienced human to pick out the obviously unusual or malicious activity from the results, and many of the other results can be pivoted to turn other report-worthy activity. There is something to be said for the power of the human brain to spot unusual activity! The more events you look at, the more familiar you become with normal activity for your organization. Of course, if you’re a Russian organization with a big deployment of Internet Explorer 6 on Windows XP, your experience will probably be looking for other events that stand out. However, you should use other information to influence your analysis of activity. For example, if the system you use to collect HTTP logs can provide additional context like IP or domain or URL reputation, you can draw conclusions about the nature of the activity faster. If you augment the query to look for low reputation requests, you can further reduce the total number of results to explore. Another option would be to add features known to be common among malicious activity, like restricting the POSTS to just PHP scripts as a clause to create a new exploratory query:
§ HTTP POST
§ No Referer
§ User-Agent claims “MSIE 6.0” and “Windows NT 5.1”
§ URL uses IP address instead of domain name
§ File extension on URL is .php
As you go through the results this query digs up, you’re bound to spot patterns that can be further developed into reports of their own.
Inverting “Known Good”
When searching for unknown malicious activity, consider the sage advice of fictional character Sherlock Holmes: “When you have eliminated the impossible, whatever remains, however improbable, must be the truth.” The events in some data sources are much more regular and predictable. This regularity can be very useful for detecting anomalous activity because it sets an expectation for what events should look like. When it’s easy to quantify what a regular event is, then events that don’t match the expected pattern can also easily be found. This regularity can take on many different forms, and the type of regularity will vary from data source to data source. In some data sources, it’s easy to identify certain properties that all events of a particular type should always have. In other data sources, all legitimate events may use a specific format. Sometimes, data sources mostly have nonpatterned data, but a subset of events related to a specific behavior takes on a specific form.
For example, a common trick used by malware is to name itself the same thing other common processes are named on a system. On Windows, one of these common process names is explorer.exe (also svchost.exe, winlogon.exe, rundll32.exe, etc.), which on a standard install is always located at c:\windows\. All legitimate copies of explorer.exe that happen to generate host-based alerts in HIPS or AV software should match the known pattern; therefore, looking for all explorer.exe alerts where explorer.exe is not in c:\windows\ can be quite useful:
§ Process name ends with explorer.exe
§ Process directory is not c:\windows\
The results of this query will find malware masquerading as legitimate activity without perfectly matching all of the traits you’d expect from actual legitimate activity. Anytime you have events where two features should always coincide, there is an opportunity for a report that checks for one feature without the other.
Looking for Things Labeled as “Bad”
Oftentimes, a data source will have some reputation, threat, or severity metadata associated with events. For example, IDS events usually contain an alert level or severity score, HTTP proxy logs often contain domain or IP reputation information, HIPS or AV logs are only supposed to trigger on malicious activity, and so forth. If you were to throw all of your data in a SIEM, it is primarily the reputation metadata that would get used for alerting and prioritizing of security events. Building reports solely based on this metadata is fraught with pitfalls because most reputation scoring or other metadata changes over time, or the process used to generate it is a black box. Without intimate knowledge of how reputation metadata is built, you don’t have any ability to estimate the fidelity of a report if the report relies exclusively on black box threat scores.
Reputation metadata isn’t useless, though—it can often serve as a big red flag in your data saying “look here!” When you’re looking for new examples of malicious activity, a great place to start is by looking at the events another system already thinks is malicious. The actual value of looking at the low-reputation or high-threat events will depend a lot on the quality of whatever scoring/reputation source you have. The obvious place to start is to look for the events with the lowest reputation or highest threat score. When you’ve built a solid understanding and “gut feeling” about your data, you’ll be in a much better position to judge the reputation system associated with that data.
Taking the naive initial approach may pay off, and you may find actionable events that you can use as the source material for new reports, especially at the beginning. Even if your reputation metadata doesn’t yield good results all by itself, there are always ways to take a “blended approach.” A blended approach mixes the exploration tricks and techniques already discussed with reputation data to help further filter/prioritize what to review.
For example, in our HTTP proxy logs, domains are scored on a sigmoid curve in the range [-10, +10], where a score of 0 is a neutral reputation and a null score means no reputation data is available. Combining reputation information with another general query for unusual features can yield useful results. Suppose you have an exploratory query like the following:
§ HTTP POST
§ No Referer header
§ User-Agent header does not contain “MSIE” or “Firefox” or “Chrome” or “Safari”
A query like this is going to return a lot of results. Some of the events will be malicious, but many of them won’t be. Domain reputation metadata can help filter out many of the events and help you prioritize which events to look at first:
§ HTTP POST
§ No Referer header
§ User-Agent header does not contain “MSIE” or “Firefox” or “Chrome” or “Safari”
§ Domain has a reputation less than -3
For this query, the very first event turned up was:
POST /dron/g.php HTTP/1.1
Host: marmedladkos.com
User-Agent: Mozilla/4.0
For this request, the domain reputation score is -7.1, and the note accompanying the reputation is “Domain has unusually high traffic volume for a very recent registration.” Further investigation shows that the activity is actually the result of GameOver ZeuS, a sophisticated information stealing bot. By itself, the reputation score metadata isn’t high enough quality to be worth the time to sort through results where a low reputation score is the sole criteria. Although -7.1 is rather low, there are hundreds of thousands of requests every day with worse scores. When the reputation score is used to augment other features, though, the results can be quite actionable.
Whether you use the tricks outlined here or you come up with other ways of finding new malicious activity in your logs, log exploration is virtually guaranteed to lead to new reports. Don’t be afraid to go deep into the gold mine in pursuit of malicious activity, but understand that there isn’t always a nugget at the bottom. Even when you have no idea where to start, you can just look at the first dozen or even hundred events and pull things out of them at random to explore. There is no “right way” to do it; letting the data take you down interesting paths is likely to open up lots of areas for further exploration. An ancillary benefit of exploratory queries is an increased familiarity with a data source, and you’re likely to improve your ability to search and understand the events it contains, too. The more you explore a data source, the more efficient and effective you’ll be at creating reports based on the data source.
Intelligence: A smart addition to your playbook
As we discussed in Chapter 3, attacks and attackers are evolving at a frantic pace. To keep up, a vast landscape of data aggregators, indicator curators, and information sharing organizations have sprung up to fill the information void. Usually, the huge array of information available about individual attacks is referred to as intel. Whole books could be written about security intel management, preparation, vetting, automation, organization, sharing, and curation—intel is a rapidly evolving aspect of security monitoring. Intel isn’t a replacement for your playbook, and all of your playbook reports aren’t substitutes for using intel in your playbook.
To fit security intel and indicators into your playbook, the “rule” that all reports are based on patterns must be broken. Our approach to breaking the pattern rule, while retaining the easy maintainability of the playbook, is to group intel by fields or features such as domain names, IP addresses, or known malware MD5s, and then build designated intel-based reports for each category. For example, you’ll likely have many different data feeds providing information on malicious domains. To integrate all of the intel we have on malicious domains into the playbook, we programmatically extract all domains from our intel management system and build a single report with a query:
§ ANY of the following:
§ Domain is baddomain1.com
§ Domain is otherbadomain.org
§ Domain is verymaliciousdomain.biz
§ Domain is yetanotherbaddomain.com
§ [....]
The important difference between this report and most of the other reports in your playbook is that the query is not meant to be maintained by a human, and tuning the report doesn’t involve directly changing the query. Instead, all curation of the domain list for this report happens in the intel management system, and the query for this report is regenerated as needed. This approach works well for your own homegrown intel, too. As you’re hunting through your data looking to create new reports, any malicious indicators you see that don’t rise to the pattern level can still be added to your intel management system where they will be pulled into your playbook through your intel-based reports.
Basics are 90% of the game
None of the concepts covered in this chapter have been particularly sophisticated and yet, you will likely find the bulk of your playbook reports only make use of the basics covered in this chapter. It’s not that advanced plays are too hard to create—it’s that query simplicity often beats complexity for creating reports with good result fidelity. The simple tricks for exploring your data to find examples of malicious activity for the basis of new reports are effective and get the job done.
For a playbook to be effective, it must be your playbook tailored to your organization’s needs by detecting the threats your organization faces. By starting with specific examples of malicious activity, you can become familiar with the process and get comfortable with your data and creating plays. After you’ve built up a set of initial high-fidelity reports, you can branch off into uncharted territory by exploring your logs and trying to build more generic investigative reports. A corpus of high-fidelity detection logic utilizes your infrastructure to detect threats, freeing time for your human resources to create, analyze, and tune lower-fidelity detection techniques. You’ll never need advanced queries, but sometimes the basic ideas covered in this chapter aren’t the best way to find attacks. In that case, you may want to rely on statistics, correlated data, and other tricks to uncover malicious activity. Chapter 9 will help get you started building more advanced queries.
Chapter Summary
§ There are many ways to search through data, but starting with simple and broad queries can help to reduce large data sets to functional and actionable components.
§ False positives slow down your analysis, but with careful adjustment, they can be reduced.
§ Attacks happen in multiple stages with detection possibilities available in most of them.
§ Researching and developing unique features in your data will aid in constructing efficient queries.
§ Avoid serially processed indicators, as well as overly complex logical contingencies for plays that are easy to understand and execute.
§ Most reports should detect patterns and turn the highly specific items into indicators.
§ Specific indicators are better handled through an intel management system rather than being spread out in lists across many different reports.
All materials on the site are licensed Creative Commons Attribution-Sharealike 3.0 Unported CC BY-SA 3.0 & GNU Free Documentation License (GFDL)
If you are the copyright holder of any material contained on our site and intend to remove it, please contact our site administrator for approval.
© 2016-2026 All site design rights belong to S.Y.A.