Crafting the Infosec Playbook (2015)
Chapter 9. Advanced Querying
“The world is full of obvious things which nobody by any chance ever observes.”
Sherlock Holmes
In the preceding chapter, we laid out the basic foundations of creating queries for reports based on the data available. Most of the query ideas presented were limited, based on looking for specific indicators and previously known activity. Additionally, most of the queries were based on looking at events in a single data source, or events related to the activity of a single host. Certainly, using known indicators or finding indicators in your data to create new reports goes a long way. However, you can dig a little deeper by applying more sophisticated analysis to your event data to uncover indicators and additional patterns not evident through basic searching. Statistics provide tools and methods for sorting through your security event data in ways that are less obvious than matching an event to a single, static indicator. It will also help to find the outliers and the commonalities in the data, which can also yield valuable information.
In this chapter, we’ll cover:
§ More false positive elimination strategies
§ How to identify and filter common traffic
§ How to detect anomalous traffic
§ How to pair statistical formulae with security event data to discover incidents
Basic Versus Advanced
It probably comes as no surprise that there is no specific, objective “dividing line” between what makes a query basic or more advanced. It doesn’t matter either way, so long as the query achieves your report objective efficiently and effectively. For the purposes of this chapter, the general divider for advanced queries is that the query isn’t based on a specific known indicator or simple pattern. Queries that use multiple data sources in nonrelational ways or look for commonalities in behavior across multiple hosts are examples. Added query complexity can provide a lot more flexibility to find nuanced suspicious activity, but greater complexity often means more analysis and investigative work to understand and analyze the query results.
It is difficult to estimate the fidelity of an advanced query because instead of looking at one narrow set of indicators, the results are often woven together from multiple events, sometimes across multiple hosts or multiple data sources. Understanding the interaction between numerous, diverse events is nontrivial in the general case. With advanced queries, you often can’t predict all of the real-world scenarios that could manifest in your query results, so you can’t easily get a handle on the likelihood of false positives or estimate fidelity.
Other differences between basic queries and advanced queries are the nature, type, and impact of false positives on the results. When you build a basic report using known malicious indicators like domains, user agents, specific requests, or other unique data, you generally end up with a high-fidelity report. Even when an amalgamation of features in a basic query produce false positives, the analysis of those false positives can be easily tracked back to one or more of the features not being specific or unique enough. A lack of specificity in simple queries leads to a trade-off between generality and fidelity (see Figure 9-1). For most basic queries that make use of several unusual event features, the generality of the query tends to go up at the cost of the fidelity of the report going down.
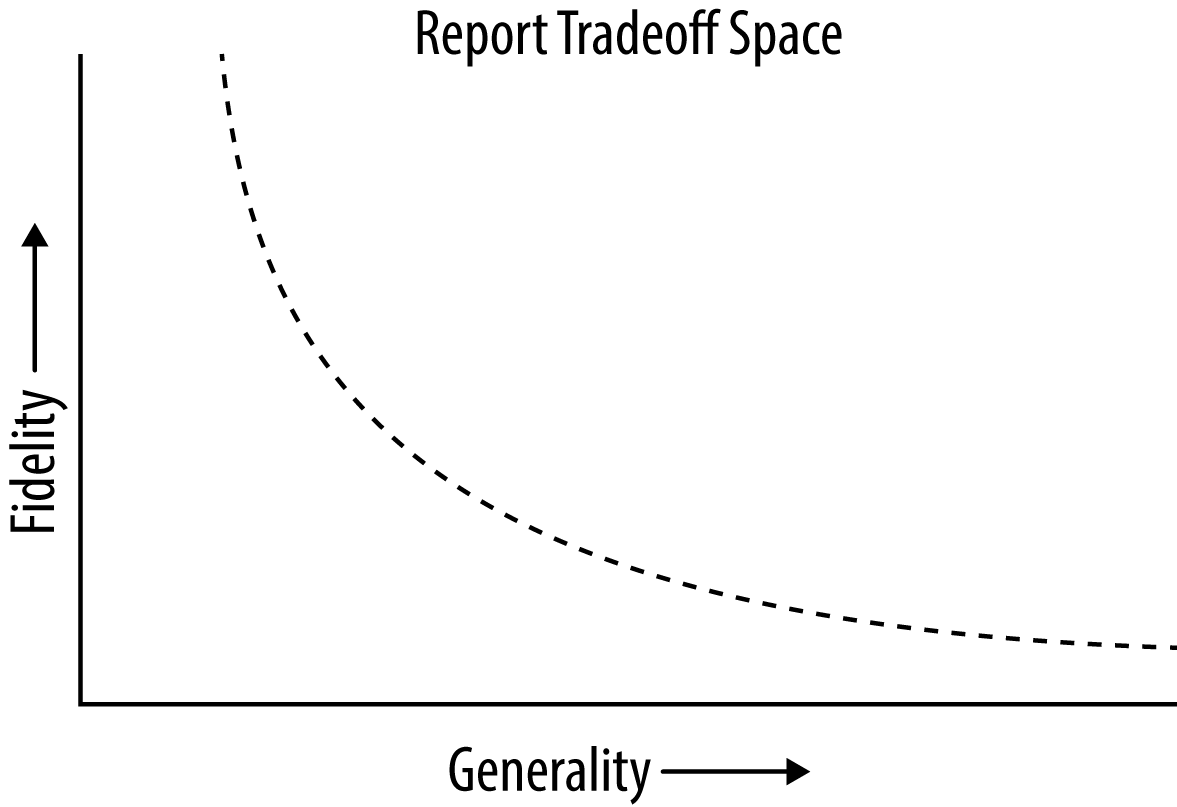
Figure 9-1. Most reports can be tweaked to be more general at the cost of a lower fidelity or more specific in return for a higher fidelity
Reports tend to lie on a curve where if you make them more generic, you increase the chance of false positives creeping in and reducing the overall fidelity of the results. There is no correct choice in this trade-off, and there is room in your playbook for highly specific high-fidelity reports as well as somewhat generic lower-fidelity reports. An added complication to this trade-off curve is that there is no way to know exactly where on the curve a report lies. False positives can sneak into reports in surprising ways. More advanced queries have to contend with false positives to a much greater extent, so a theoretical basis for the expected base rate of false positives is in order.
The False Positive Paradox
False positives and lots of benign results are the mortal enemy of your playbook, because they drown out true positive results and waste a lot of analysis time. Estimating the likelihood of false positives can be a tricky business and isn’t as easy as you may think. Statistics are a great tool in your report creation arsenal, but the math is not always on your side when it comes to avoiding false positives.
Suppose you have a busy web server under attack. As a result, you decide to write an IDS signature to detect the attack. The attack is easily detectable when real attack traffic goes by and your IDS signature successfully detects the attack 90% of the time. However, sometimes legitimate requests also look like the attack, so your signature triggers a false positive on legitimate nonmalicious traffic 0.015% of the time. Assuming only one in a million requests to your server are part of the malicious attack, what’s the probability that an alert from your signature is an actual attack? Intuition based on the 90% accuracy of your IDS signature would suggest it’s close to 90%; however, the actual probability that the detection is a true positive is only 0.59%. That is, there will be about 165 false positives for every true positive in your million results. Faced with a result like this, you may try to make the IDS signature 100% accurate at detecting true positives. However, if the false positive rate stays at 0.015%, this will only improve the chances of an alert being a true positive to 0.66%. If you reduce the false positive rate to 0.001%, the chance an alert is a true positive only rises to 9%. False positives seem a lot more treacherous now, don’t they!
If you overestimate the accuracy of a report because you neglect the expected rate of false positives, you’re committing what’s known as a base rate fallacy. When trying to estimate the overall efficacy of a query, the most important factor to consider is the chance that the query produces a false positive on benign events. In the preceding example, only one in a million events is malicious. Unless benign events trigger the query less frequently than about once in a million, the overall quality of the results will be very poor. In practice, though, you rarely know the actual percentage of malicious events in your logs (the base rate), and you’re even less likely to know the chance that a nonmalicious event could falsely trigger your query. Without knowing both of these values, you’re mostly left to guessing how accurate a query will be. Likely the only thing you’ll be certain of is that false positives defy intuition and sneak into results in unexpected ways.
InfoSec isn’t the only field that has to deal with the treachery of Bayesian statistics. Doctors know the chance of a false positive test on a rare disease is much more likely than an actual case of that disease. This is one of the reasons why doctors are often reluctant to report initial test results to patients without follow-up tests. Airport security is another glaring example of false positives drowning out true positives. There aren’t that many terrorists flying daily in comparison to the number of total nonterrorist passengers that pass through security. Factoring in the poor detection rate for true terrorists with the occasional flagging of an innocent traveler, nearly 100% of all passengers detained or questioned further are false positives.
Good Indications
When you’re creating a report, you must be mindful to minimize false positives. If you don’t have a good way to estimate the quality of a query, always assume it’s less accurate than your gut tells you it will be. Usually, the bulk of your query development effort will be carefully crafting a query that doesn’t return the nonmalicious events, but still captures the malicious ones. Put another way, most of your time won’t be spent in finding the malicious events, it will be spent avoiding the nonmalicious ones. Above all, the best indicator of the quality of a query is to run it against historical data to estimate the accuracy.
NOTE
If you have historical logs to search against, you have a report “time machine” that can tell you how a query would have performed had it been in place in the past. Even for brand-new attacks with no historical data containing traces of the attack, queries on historical data can help you estimate the number of benign and false positive results that could turn up.
Consensus as an Indicator (Set Operations and Outlier Finding)
Not all data sources are created equal. Even data sources that are rich in information may not be rich in useful features to aid in finding needles in the haystack. Information and feature-rich data sources like HTTP logs give you more query possibilities than what you get with feature-poor data sources. Feature-poor data sources tend to be the ones that provide sparse, record keeping-like information without nuance or flair. DNS query logs, NetFlow, DHCP logs, authentication logs, and firewall logs are all usually feature poor. Without many features to aid in query development, it’s easy to dismiss the data source as either not useful or only useful in specific circumstances, but fortunately there are query strategies that can work even without many features.
Just as you can’t look at individual spoonfuls of dirt to tell how bountiful a gold mine is, without specific known malicious indicators, it’s hard to look at events individually and gain much insight. In feature-poor data sources, it’s better to step back and look at events in aggregate to get a big picture view of activity. There are lots of ways to do this, so this chapter will only cover a few of the ones we’ve found to have a good effort-to-payoff ratio.
Set Operations for Finding Commonalities
Suppose during an investigation of DoS activity sourced from your network you learn that several machines have all been compromised, without knowing the specifics of the malware used or how it is controlled. It would be natural if your next step were to look for commonalities in the behavior of the hosts. This is where set operations come in.
Set operations are overly complicated mathematical constructs for what is a very simple idea: to manipulate groups of items (called sets) to form new groups based on some properties of the elements in the groups. The three most common set operations are:
§ Union
§ Intersection
§ Difference
Union combines two groups into one larger group comprised of all of the elements in each. Intersection produces a new group that only has items that are in both groups. Difference gives you all of the items in the first group that are not contained in the second group. Using these set operations, it’s easier to handle large amounts of data automatically, and that’s exactly what you want if you’re going to find what compromised hosts have in common.
To find what two DoSing hosts have in common, the intersection operation will be most useful. First, choose a data source to search for common behaviors and then gather the activity of each host into host-specific groups. For DNS queries, they may look something like:
|
Host 1 |
Host 2 |
|
accounts.google.com |
a.adroll.com |
|
ad.wsod.com |
a.disquscdn.com |
|
adfarm.mediaplex.com |
a.visualrevenue.com |
|
adserver.wenxuecity.com |
about.bgov.com |
|
aph.ppstream.com |
about.bloomberg.co.jp |
|
api-public.addthis.com |
about.bloomberglaw.com |
|
[...] |
[...] |
For most active hosts, the groups of activity will be quite large. Taking the intersection of the two cuts the results down significantly:
|
Host 1 intersect Host 2 |
|
accounts.google.com |
|
apis.google.com |
|
br.pps.tv.iqiyi.com |
|
cdn.api.twitter.com |
|
clients1.google.com |
|
cm.g.doubleclick.net |
|
connect.facebook.net |
|
edge.quantserve.com |
|
googleads.g.doubleclick.net |
|
ib.adnxs.com |
|
lh4.googleusercontent.com |
|
[...] |
Although the intersection in activity between the two hosts is usually much less data than the complete activity of either host, it’s often still too much to go through by hand. You can manually discard some of the more obviously nonmalicious domains (e.g., commonly known sites and content networks); however, that approach is slow, error-prone, and not scalable. Again, set operations can help. Uninfected (good) hosts lack the malicious behavior exhibited by malware infected hosts. This difference provides an opportunity for identifying the malicious activity common among infected hosts that isn’t shared with uninfected ones. Good hosts make it easy to build a whitelist of domains to ignore by taking the union of activity from several hosts you don’t suspect of being compromised.
How you select good hosts for the whitelist is only marginally important. Good hosts are most helpful when they have lots of nonmalicious activity in common with the hosts you’re investigating. The more legitimate activity they have in common, the better your good hosts will be at eliminating nonmalicious results from your query results. After you’ve grouped a bunch of benign activity together (union operation), take the set and subtract out the legitimate activity with a set difference operation. For the DoSing hosts, that results in only two domains: www.frade8c.com and vh12.ppstream.com.
Pictorially, this operation looks like Figure 9-2.
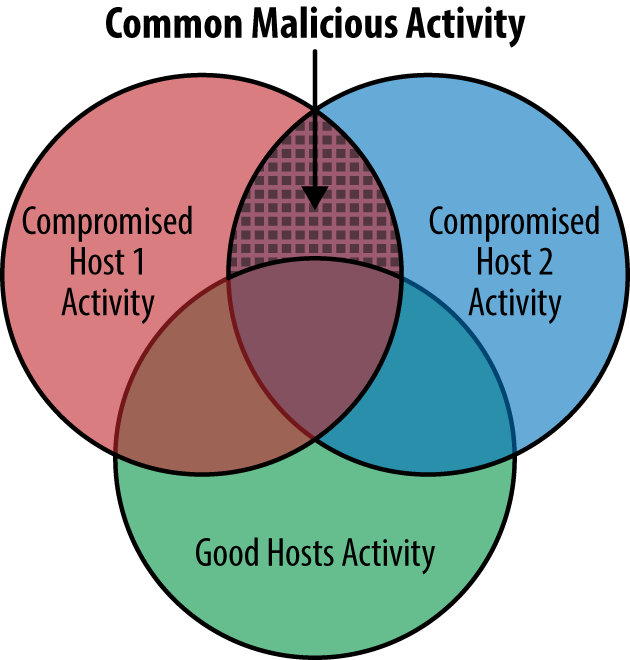
Figure 9-2. By taking the intersection of activity on two compromised machines and removing the activity also exhibited by hosts that aren’t compromised, you can quickly narrow in on what the malicious machines have in common
Any events from a similar “intersection + difference” operation must be confirmed to be malicious. From the preceding results, a web search reveals that www.frade8c.com is a known command-and-control domain for a DoS malware variant. Armed with this knowledge, you can find other compromised hosts exhibiting similar behaviors, deploy mitigation measures, and look for other related activity found in subsequent sets.
Finding Black Sheep
Another method of profiling unusual behavior is looking at a single host’s network activity. Newly infected hosts will deviate from their own regular pre-infection behavior enough to be actionable. For example, most client hosts are configured to use a small number of DNS nameservers (two or three is most common) for their query needs. There isn’t just one pattern of query behavior, because of differences in how machines are configured and how different operating systems balance their queries among nameservers. Even though there can be large differences between machines, the query pattern of individual machines should stay consistent over time. A typical host pattern might be something like:
|
Nameserver |
Queries |
|
172.30.87.157 |
1344 |
|
172.30.115.191 |
110 |
|
172.29.131.10 |
88 |
Though the query distribution isn’t uniform, there is no extreme outlier. For a host infected with malware that uses a hardcoded nameserver, the distribution does have an outlier:
|
Nameserver |
Queries |
|
172.30.166.165 |
1438 |
|
10.70.168.183 |
286 |
|
172.30.136.148 |
179 |
|
8.8.8.8 |
1 |
As you can see, even though query activity is highly uneven, a single query to 8.8.8.8 stands out. In this example, the domain queried is qwe.affairedhonneur.us, and the host shows many signs of malicious activity. The specific query criteria and thresholds to find this activity will depend on the type of hosts on your network and how they’re configured. If all of your hosts are to use a single nameserver, then detection is easy—any host querying two nameservers is doing something unusual. For other configurations, you’ll need to play with the query knobs to find something that works well. For nonuniform data like in the example table, you may want to look at the logarithm of the query counts to each nameserver instead of the absolute number of queries. Using the logarithm of the numbers, a reasonable threshold might be to look at the difference between the most queried and least queried nameserver, and if there is a difference above some threshold, flag the queries to the rare nameserver for further review.
NOTE
Using the log() of data works well when your data has an exponential distribution. In the case of nameserver query patterns, oftentimes the most queried nameserver is queried many times more often than the second most queried nameserver. Using the log() of data like this smoothes out the big differences and works better than the absolute difference between two data points.
There are additional DNS abuse detection methods beyond nameserver query counts. A common DoS strategy is the DNS amplification attack. These attacks send spoofed DNS query packets that appear to come from the chosen victim, to any nameserver that will respond. When the nameserver receives the query, it processes the request and responds to the victim with the answer. From the view of the nameserver, it received a query and provided the answer. From the perspective of the victim, there is a nameserver flooding it with DNS answers to queries it never sent. Besides hiding the actual attacker from the victim, this technique is popular because DNS questions can be very small, but DNS answers can be very large. This allows attackers to amplify their DoS ability by flooding their victim with more traffic than they actually sent. Amplification factors of better than 25-to-1 are common.
This sort of attack is easy to detect with NetFlow. The hallmark of a successful DNS amplification attack is a significant imbalance in traffic toward a DNS server compared to traffic out. If you look at historical activity to your authoritative nameservers, you’ll find that DNS responses out are, in general, about twice as big as the queries in. That is, about 33% of the total bytes across all flows will be queries in and about 66% of the total bytes will be answers out. Of course, there can be significant variation from server to server, depending on the types of queries it sees, but you’d never expect a server to account for more than 95% of the bytes out. However, for a DNS amplification DoS attack, you’ll likely see your server’s answers accounting for more than 95% of the total bytes. This is depicted in Figure 9-3.
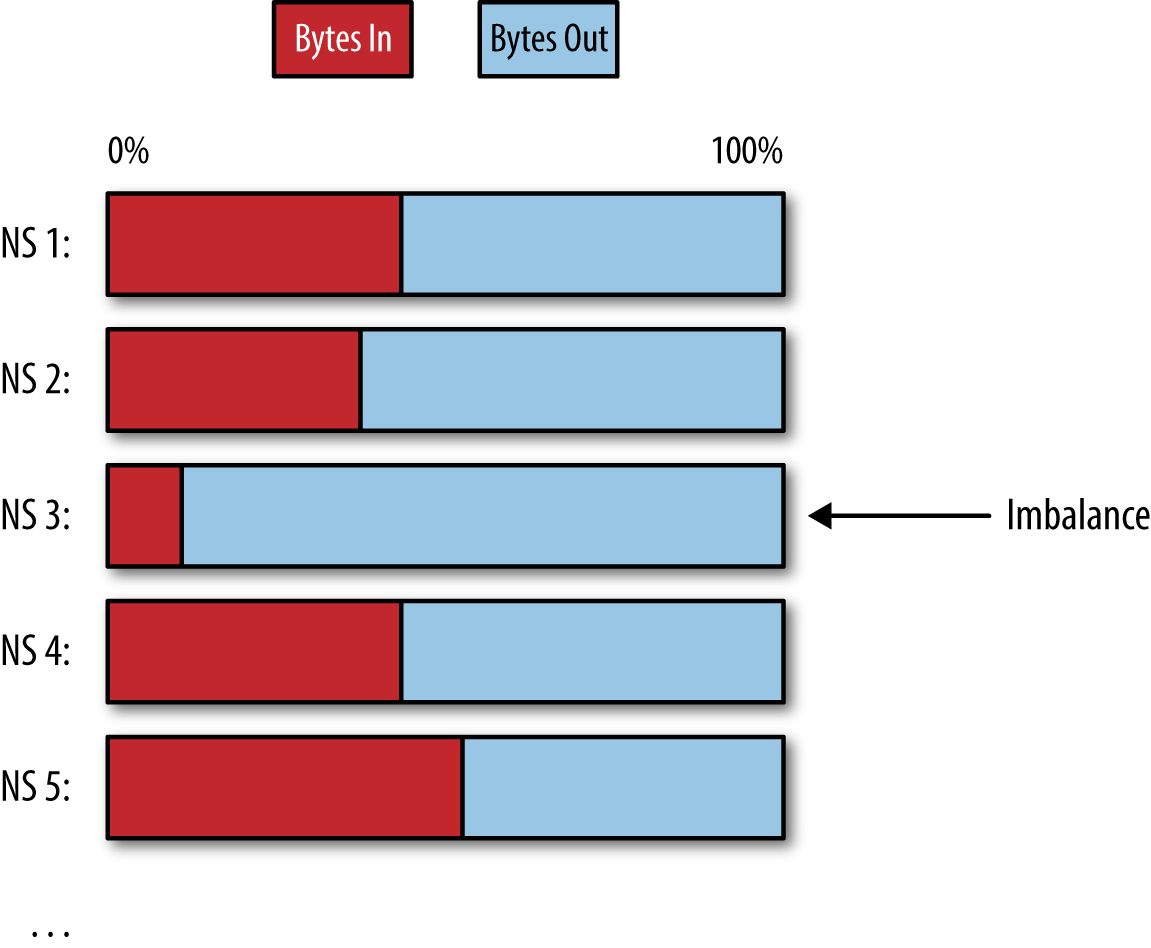
Figure 9-3. A breakdown of the percentage of traffic in versus out for nameservers will show an imbalance towards traffic sent out when a nameserver is being abused in a DNS amplification attack
Using NetFlow, there are a few signs you can look for to detect UDP amplification attacks:
§ A sudden positive deviation in the total packet count
§ A disproportionate number of UDP server response bytes compared to the client bytes sent
§ A positive deviation of the total amount of UDP service traffic
§ Any of the above indicators associated with deprecated services (chargen, daytime, echo, etc.)
Here is an example query using this technique:
§ UDP traffic with local network host using port 53
§ For each unique pair of outside host to inside host
§ Total packets between hosts is at least 1000
§ Total traffic between hosts is at least 1 megabyte
§ Server traffic accounts for at least 95% of total flow bytes
The fidelity of this query is quite high. It would be unusual to see your server sending significantly more traffic than the client. For small flows, the ratio can easily deviate from the norm a lot; however, for flows with many packets and bytes, normal behavior will average out and won’t cross the threshold. Some people like to call this the “law of large numbers,” but whether you think of this as a law or not, the more data you have, the more the statistics are on your side.
Statistics: 60% of the Time, It Works Every Time
Statistics and data aggregation are especially useful because high-fidelity “smoking gun” events are so infrequent and limited in scope. Statistics can get complicated fast, and a report that no one can understand is a real problem. As with basic queries, simplicity should be your goal wherever possible. In many cases, sums, averages, and standard deviations are often powerful enough to be useful in reports without the need for more sophisticated statistical machinery.
Some data sources benefit from statistical analysis more than others. Data sources where each individual event is relatively low fidelity are a prime target for statistics like counting events, unique event value aggregation, or finding event outliers. Even when a data sources contains events that are entirely unactionable individually, aggregating events together may still provide useful results. Two common data sources where statistics are often quite helpful are IDS events and NetFlow. Alerts from an IDS span a huge range of fidelities from purely informational events to highly specific malware signatures. After you’ve created reports containing the high-fidelity events, you’re left with—and will need to start looking at—noisy 'margin-top:30.0pt;margin-right:0cm;margin-bottom: 6.0pt;margin-left:0cm;line-height:normal;vertical-align:baseline'>Skimming the IDS Flotsam Off the Top
Traditional IDS signatures for exploit detection are notoriously noisy and often provide little value on their own. But taken in aggregate, even a bunch of very low-quality events can be a good indicator that something bad is happening. For the purposes of detecting malicious host activity on your network, you should prioritize hosts that are the source of attacks rather than the victim of attacks. One of the biggest flaws of exploit-detection signatures is that they’re usually very poor at telling you when a host has actually been exploited. No doubt every day your IDS sees hundreds of exploit attempts, such as Unix passwd file grab attempts, SQL embedded in web traffic, or port probes against your Internet-facing hosts. Instead of trying to guess at the success of attacks, you can look for IDS events where your hosts are the source of the attacks as an indicator of when hosts have been compromised on your network.
Even so, many IDS signatures trigger false positives enough that in some cases the false positives will obscure the actual malicious behavior. You still need a way of identifying the most suspect hosts. A great strategy for doing that is to aggregate your events in a one-to-many relationship. The idea behind aggregating events is to group all events from a single attacker into a summary of the behavior rather than getting bogged down with each individual event on its own. A lot of detailed information is lost when you aggregate events, but for a high-level overview of activity, details like the sequence of events aren’t very important. Often, thousands of events from a single source can be compressed into an easily digestible summary of what that machine is doing. Here is an example query using this technique:
§ IDS event attacker (usually source) is internal network host
§ For each unique attacker, aggregate all events sourced by that attacker
§ Count and record each unique IDS signature triggered with timestamp
§ Count and record each unique victim host
§ Count the total number of events fired
Instead of looking for some specific threat or activity pattern, this query is simply grouping results together for easier analysis of the high-level details. For the results to be useful, you still need a way to prioritize looking at the groups. Start by sorting the group from the most total events fired to the least total events fired. This will give you a feel for some of the noisiest and most invaluable signatures, which should be disabled or tuned. You can follow up by sorting the results by unique victim hosts, unique signatures, network location, host sensitivity, or other contextual factors for additional prioritization and detection possibilities.
When you’ve aggregated a bunch of different events from several hosts, your method of sorting will determine which hosts rise to the top of your results. If you sort by the total event count, the noisiest hosts by total event volume show up at the top. If you sort by the total number of unique victim hosts, then attackers scanning across a whole network will rise to the top. There are many ways to slice the data through sorting, but in many cases there isn’t a “best” choice for which aggregated field to sort on. What’s more likely is that none of the fields are particularly great for sorting on their own. In these situations, you’ll find yourself wanting to weigh each field equally, so hosts that stand out in multiple categories rise above hosts that stand out in just one. You could try averaging the values of various fields together, but you’ll find that usually just one number, total events, completely dominates the other numbers. This makes the average value useless. The same is true if you just add all the values together and sort by the sum. For example, 10 unique signatures might be a lot of signatures for a single host to fire, but 10 total events may not be that many at all. If a host fired 1,000 events with only one signature, the sum is 1,001. A host that fired 900 events and 6 unique signatures sums to 906. Sorting this way favors the first host, even though the latter host is more concerning because of the breadth of their attack profile (six signatures, lots of hosts). Instead of simple sums or averages, a good statistic to use for data like this is the geometric mean.
A geometric mean works best when you want to find an average-like value for a set of data but each element of the data uses completely different ranges. The geometric mean of the three items is the third root of the three items multiplied together. In general, the geometric mean of n items is the nth root of the product of all n items. The geometric mean of data is much less sensitive to one element dominating all of the others and naturally weighs each element equally.
Computing the geometric mean and sorting the preceding query by it produces actionable results near the top, as in the example shown in Table 9-1.
|
Attacker |
Event count |
Sig count |
Signatures |
Victim count |
Victims |
Gmean |
|
10.129.63.43 |
99 |
4 |
(DNS lookup and TCP/445 sigs) |
87 |
12.109.104.145 |
33 |
|
172.27.3.12 |
83 |
2 |
(TCP/445 sigs) |
82 |
128.79.103.57 |
24 |
|
172.17.20.151 |
972 |
1 |
(Active Directory Password Failure) |
2 |
64.100.10.100 |
12 |
|
72.163.4.161 |
1330 |
1 |
(ICMP Flood) |
1 |
89.64.128.5 |
11 |
|
Table 9-1. Example of sorting report results by geometric mean |
||||||
Notice that in this table the top two results are more balanced because they have a high number of events, signatures, and victims. The noise of a single signature firing repeatedly (like in the last result) doesn’t drown out other interesting results. The result with 972 password failures is a great example of the power of a geometric mean to normalize down highly repetitive events. Just sorting on the event count would place the most repetitive events at the top, which is likely to distract the analyst away from the behavior with more variety. It’s not uncommon to see a broken script or misconfiguration in an environment trigger thousands or millions of events. Even legitimate activity can sometimes generate a flood of events. In a lightly tuned report, analyzing noisy, repetitive events prevents you from getting to the more nuanced activity. Events regularly fire in a loop, but an event that fires ten times more often as another doesn’t equate to that event being ten times as bad. Where averaging and other naive sorting methods have trouble with extremely noisy events, the geometric mean may excel.
IDS events aren’t the only noisy data source. NetFlow benefits from statistics for useful detection. Rarely is a single flow a good indicator of anything. Instead, behaviors like P2P participation, port scanning (both vertical and horizontal), and various worm activities can all be detected by analyzing a large number of related flows.
WARNING
Another hurdle when using statistics can be your data storage and query system. Does your query system support simple statistics like computing an average or standard deviation? If you can’t apply the statistical function to the data in the way you want, you must be creative, sometimes working around your query system. Sometimes, the most reasonable way to apply statistics to your data is to export the data from the system. Once beyond the limitations of the query system, you can use alternative tools to apply the statistical functions. The practicality of this approach is specific to the data source, query system, and case. If you cannot pre-filter a very large data source before statistically processing it, the resulting output may be unreliable enough to be of no use. Where possible, your strategy should be to pre-filter the data by creating a query that only produces results directly useful as input to the statistics stage of the processing.
Pulling Patterns Out of NetFlow
Like any technical endeavor, to use statistics effectively, you must first carefully lay out the problem and your detection goals. This will allow you to clearly reason about how to detect a behavior and the limitations of that detection. For example, suppose that you want to detect port scanning behavior with your NetFlow data source. Before you can begin to think about any sort of detection logic based on statistics, you need to understand what the behavior looks like and how events could be aggregated to find that behavior. A few different activities fall under the port scanning umbrella.
Horizontal Scanning
A horizontal scanning host tries to connect to the same destination port on a large number of other hosts. For example, for SSH scanning, the destination port would be 22. Horizontal scanning isn’t limited to single port scans, though; many Windows-based worms scan on both ports 139 and 445 and sometimes even more. Horizontal scanning also isn’t restricted to trying IP addresses sequentially or in a small CIDR range; targets could be chosen at random. That said, sequential IP addresses are a dead giveaway of horizontal scanning, and sequential scanning is still quite common, even though random scanning tends to be less obvious and more stealthy.
Vertical Scanning
A vertical scanning host tries to connect to a large number of destination ports on another host. The port numbers may be noncontiguous, and the scan target can be more than one host.
Horizontal and vertical scans are idealized versions of the possible scanning behavior variations. A more complex scenario could involve horizontally scanning on port 445 and any host that responds with 445, open has all their ports vertically scanned. Applying detection logic to something as diverse as port scanning first requires that you carve out a specific pattern that you think is worthwhile to look for from all possible behaviors. Perhaps you want to detect “worm-like” rapid horizontal scanning from one host to a large number of other hosts. With that subset in mind, make a list of features:
§ Short period of time
§ For a given single source host
§ For a given single destination port and protocol
§ Large number of destination hosts
§ Relatively small packets
Notice that none of these features are highly specific concrete values to look for. Instead of searching for a specific string of bytes or some number, the features useful for statistical analysis are often fuzzy. To make them concrete, you need to pick a range of threshold for their values. With some features in hand, you can begin to construct a query to get at the interesting behaviors lurking in your data.
Looking for Beaconing with Statistics
One of the hallmarks of human behavior is that it’s mostly random. If you ask someone to press a button once per second, they’ll come close, but no matter how hard they try, there will still be significant random deviations from a regular interval. If, on the other hand, you program a computer to click a button once per second, it’s going to come darn close to perfect. The amount of effort needed to program the computer to emulate the imprecision of a human pressing a button is actually surprisingly significant. The contrast between humans and computer behavior is so stark that it offers a great way to detect automated behavior for further analysis.
Of course, not all automated behavior is malicious. Much of the background activity and network traffic is not human initiated. Software checking for updates is a prime example. Plenty of other software like stock tickers or weather forecast applets also periodically check in. Even though malware isn’t the only source of automated activity, by combining with other features, it’s possible to make reasonable fidelity investigative reports. Detecting automated communications to C2 servers, or beaconing, will quickly identify compromised hosts. Beaconing refers to malware’s regular and periodic “checking in,” “calling back,” or “phoning home” to a remote location. Fortunately, most beaconing is easy to detect with basic statistics.
To detect beaconing, you need a way of identifying the highly precise nature of computers. The first step is to measure the intervals between actions, which can be done with a lagged difference operator. Each operation has a timestamp associated with it; call them T1, T2, T3, etc. Then, using a lagged difference, the intervals I1, I2, etc. are I1 = T2 - T1, I2 = T3 - T2, and so forth. For automated beaconing traffic, these intervals will be consistent. To measure their consistency, you can use the intervals’ standard deviation normalized by their mean (the coefficient of variation). Normalization allows the comparison of the values derived from different activity.
Once normalized, sort the activity from most regularly periodic to least regular. After throwing in a few additional features, the following query works well:
§ HTTP POST
§ No Referer header
§ For each host
§ For each destination domain
§ Domain has at least 11 requests
§ Requests are spaced out at least 1 second
§ Compute lagged difference values
§ Compute coefficient of variation of lagged difference values
§ Sort output by coefficient of variation (low to high)
For a four-hour interval, many of the top results are as shown in Table 9-2.
|
Source |
Destination |
Request count |
Average |
Standard deviation |
Coefficient of variance |
|
10.19.34.140 |
204.176.49.2 |
14 |
903.122571 |
0.13807 |
0.000152881 |
|
10.79.126.41 |
portal.wandoujia.com |
14 |
299.976571 |
0.113251 |
0.000377533 |
|
10.99.107.11 |
militarysurpluspotsandpans.com |
14 |
617.416429 |
0.249535 |
0.00040416 |
|
10.51.15.199 |
6.1.1.111 |
48 |
149.470979 |
0.06968 |
0.00046618 |
|
172.20.14.241 |
militarysurpluspotsandpans.com |
21 |
616.192143 |
0.291051 |
0.000472338 |
|
10.99.38.68 |
militarysurpluspotsandpans.com |
17 |
616.951059 |
0.317271 |
0.000514256 |
|
10.21.70.121 |
addonlist.sync.maxthon.com |
10 |
601.6654 |
0.310379 |
0.000515866 |
|
10.155.1.142 |
militarysurpluspotsandpans.com |
21 |
616.27919 |
0.356551 |
0.000578554 |
|
Table 9-2. Example of beaconing hosts sorted by least precise to most precise time deviation |
|||||
After some digging, you’ll determine the requests to militarysurpluspotsandpans.com are associated with known malware. With a bit of tuning to ignore the nonmalicious beaconing, this query could be used by itself in an investigative play. It’s also a great start for exploratory querying to find additional malicious activity and indicators by searching for activity related to the beaconing results.
Is Seven a Random Number?
We saw in the previous section that spotting periodic behavior is easy when the behavior is regular. Of course, data isn’t always so clean. Sometimes, automated behavior involves multiple timers or some element of randomness like human activity mixed with automated activity. Event intervals can identify some types of regular or automated behavior, but there are many times when another test is needed. One such test is Pearson’s chi-squared test (for more information, see “Detecting and Analyzing Automated Activity on Twitter” by Chao Michael Zhang and Vern Paxson). This test can tell you how well one element of data correlates with another element, or how well a set of data matches an expected distribution.
For example, when a human browses the Web, you wouldn’t expect the specific second of the minute to have any relationship with which minute in the hour a web page is visited. The same goes with clicking links on pages, posting comments, sending emails, sending instant messages, and other common activity. If you gather enough activity from a host, you can start to look at the relationship between things that shouldn’t be correlated. Here is a graph of the activity of a bot’s C2 server where the specific minute of the hour is plotted along the vertical axis and the specific second of the minute is plotted along the horizontal axis. Each event from the bot is then plotted as a single circle (Figure 9-4).
Visual inspection alone identifies this activity as highly nonrandom. This type of analysis works well for detecting computer imposter activity masquerading as human activity. Malware posting blog comment spam or fake Twitter tweets is a common situation where this is the case.
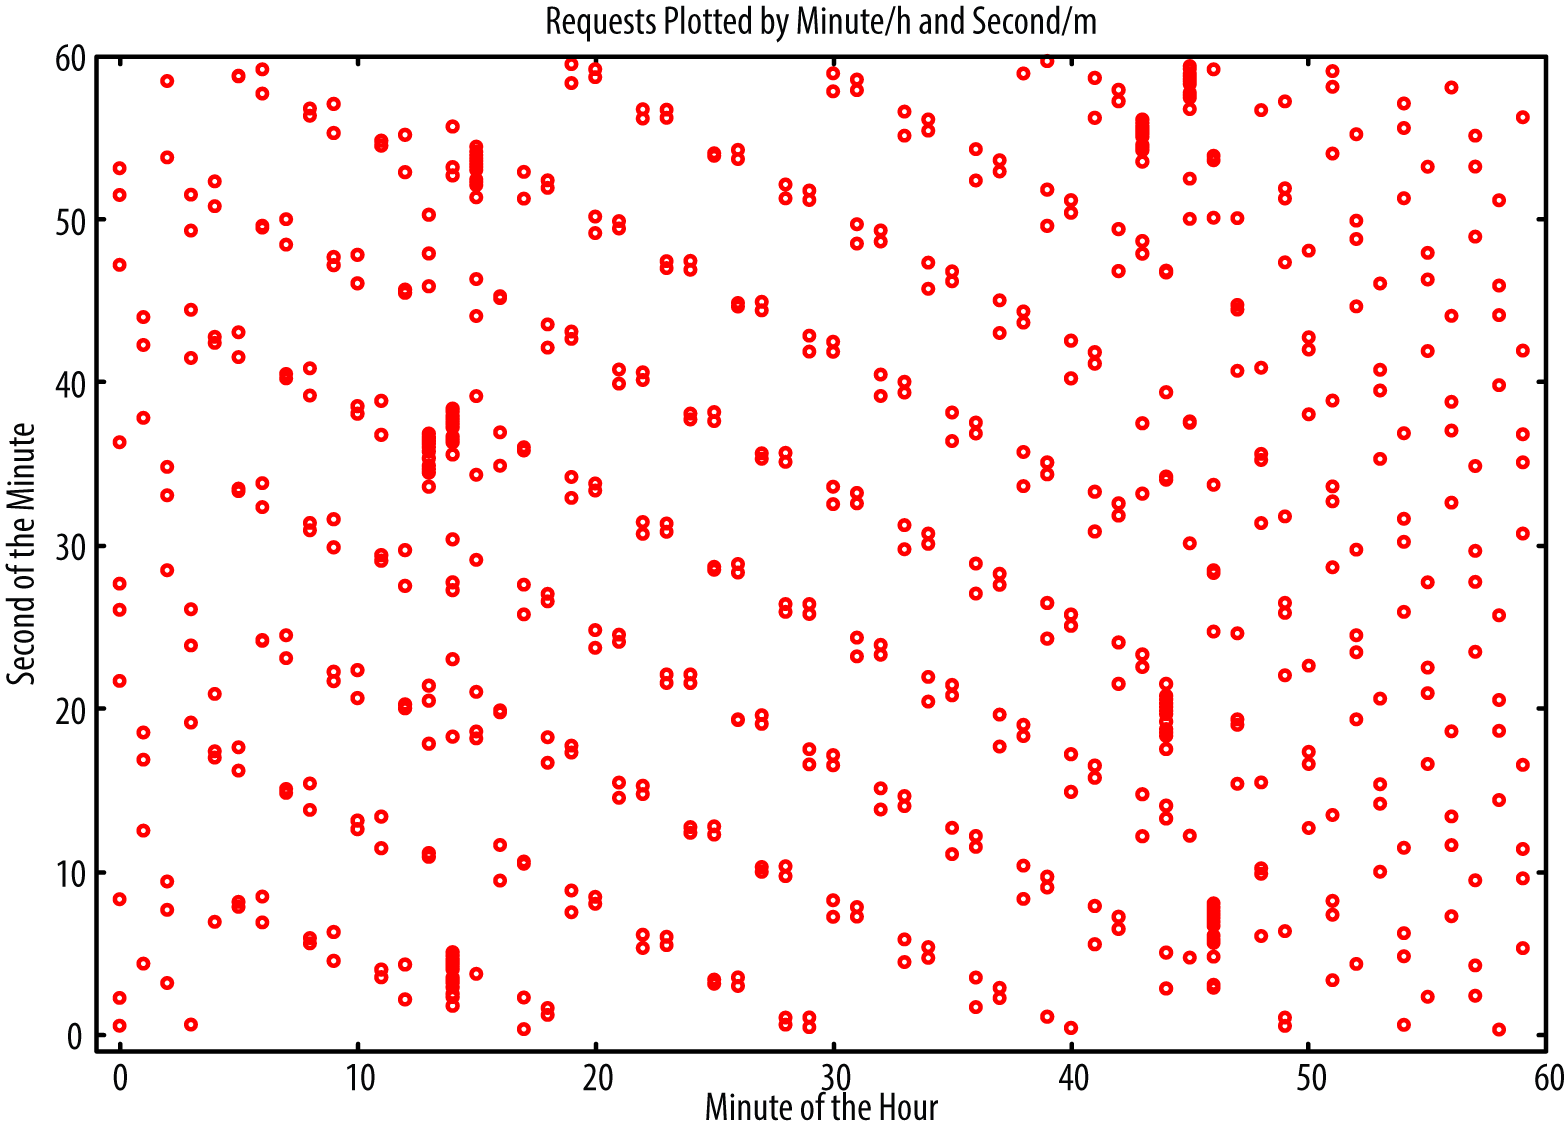
Figure 9-4. Automated request behavior plotted by the second of the minute and by the minute of the hour
There are more ways than just behavioral analysis to distinguish humans from computers. When you want to give a person your email address it’s much easier to say and share when it’s mikehockey85@gmail.com versus ythuaydiavdqvwu@gmail.com. The first looks normal, and the second looks random. The same goes for domain names. If you want anyone to remember a domain name, it should be something pronounceable or short, but certainly not long and random. If malware tried to generate real-looking email addresses or domain names, a frequent problem would be that they’re already registered. Random long strings are much easier to program and are less likely to collide with existing ones. One such type of evasive behavior is a domain generation algorithm (DGA). As we discussed in Chapter 3, the idea behind a DGA is that if the botmasters used www.mycommand-domain.com and coded their malware to look for that domain, as soon as the domain is taken down, the malware is useless. In the escalating malware arms race, some malware periodically generates new domains to use to stay one step ahead of the defenders. Today the malware may use www.ydyaihqwu.com, and tomorrow it might switch to www.fvjkpcmv.net. When the attackers employ a strategy like this, it limits the effectiveness of taking down or blocking a domain.
NOTE
In one extreme example, in 2009, a variant of the Conficker malware family switched to a DGA that produced 50,000 new domains across eight different TLDs every day. To thwart Conficker, defenders had to work with many countries and registrars across the globe to register or block every single domain.
The benefit to defenders when attackers use random-looking domains is that the domains stand out from most other domains—most domains look particularly random! To tease out random data from nonrandom, Markov chains are an ideal tool. Markov chains apply well to a wide variety of problem, but one area they particularly excel in is modelling the complexity of languages and identify the “randomness” of a string of text. A Markov chain is a probability table that describes the likelihood that a state will follow from a previous state. For natural language processing, each letter in a word is a state and then a probability table is created to describe which letters are most likely to come after others. For example, “h” is likely to come after “t,” but “b” isn’t very likely to come after “t.” The table for “q” is especially lopsided because “u” is the only likely letter to follow. A Markov chain encodes all of these relationships and then can detect how well a piece of input text matches the table. It is easy to train a Markov model with sample text like English words, common names, common domain names, and other sources of text. Then you can score domains against the model to determine how the sequence of letters matched the model. A domain like babybottles.com will have a relatively low score (high probability of matching the model), while fvjkpcmv.net will have a high score, meaning it doesn’t match the training set very well at all.
Markov chains can be applied anywhere text appears and a training set can be found. Domain names are easy because basic words, names, and common domain names can be used as training material. Other places Markov chains can apply are filenames, email addresses, scripts, page names in URLs, and other human-generated or human-consumed content. Malware commonly generate random filenames or random registry keys because randomness makes signature writing and artifact removal harder on defenders. If you don’t know what to search for, how will you have anything to write a signature against? When building a report using host data like HIPS logs, spotting random filenames can help prioritize analysis. You can create a training set by installing common software on a clean system and using all the filenames on the system to train the Markov model. While this method won’t catch malware named system32.exe, it will absolutely catch malware named yfd458jwk.exe.
Randomness (or a lack thereof when it is expected) doesn’t have to be a detection method on its own. You certainly could build an investigative report that just looks for the most random-looking domain names in your DNS or HTTP logs, but that’s likely to be only moderately effective because measuring randomness is highly dependent on your measurement model. Randomness measures work best when used in tandem with other features. Identifying or scoring behavior on a scale from not random to highly random can be integrated into a report as another feature. A common way you might use a random score as a feature alongside other nonstatistical features would be the following query:
§ HTTP POST
§ No HTTP Referer Header
§ Domain name looks highly random
Or even something like:
§ HIPS event detecting creation of new system service
§ AND ANY of:
§ Service name looks highly random
§ Executable name looks highly random
Correlation Through Contingent Data
The idea that there are hidden relationships between data is more prevalent than ever. Often, when data science or big data is explained (or marketed!), the word correlation is thrown around without a lot of time spent on what it really means. Pushing the idea that a product contains magical secret algorithms for finding hidden correlations in your data might sell better, but it isn’t a very accurate picture of reality. Most actionable reports are going to be based on queries that look at explicit relationships in data. Explicit relationships are easier to find, they’re easier to understand, and they’re less likely to be misleading or produce false positives. Even though data correlation isn’t all it’s marketed as, there are definitely situations where it can be very effective.
Feature-rich data sources usually have more possible hidden relationships in the data, but sometimes even low-feature data sources like NetFlow can have correlations between the features. For example, the transport protocol (TCP or UDP) is moderately correlated with the port. So, if you know the destination port is 80, it’s much more likely the protocol is TCP than UDP. It would be unusual to see UDP/80 traffic. If you know the destination port is 53, it’s much more likely the protocol is UDP. In fact, DNS is one of the biggest users of UDP, so if you know the protocol is UDP, then there is a high chance either the source or destination port for the flow is 53.
Hidden relationships in data are often advantageous for the defender. If you’re able to find data relationships hidden even to an attacker, surely you have the upper hand in detection. HTTP is an especially feature-rich data source where attackers regularly fail to adhere to hidden relationships. The HTTP specification is very forgiving and a lot of things just don’t matter. For example, HTTP request headers can be in any order. If the browser puts the User-Agent header above the Accept-Language header that will work just as well as if they’re reversed. If you have N headers, this results in N! (N factorial) possible orderings and usually any ordering is equally as good as any other, so the choice is arbitrary. But, if you built a profile of a specific version of Firefox, you’d find that in reality just a few different orders are actually present. This isn’t unique to Firefox—almost all code that makes HTTP requests is consistent in how it constructs the requests.
By sorting through your HTTP proxy data, you could build a header-order profile of all of the major browser versions. When a malware author tries to hide by masquerading as a browser, if the author uses different headers or the same headers in a different order, their HTTP request won’t match your profile for that browser. If you know Internet Explorer 9 always lists the Referer after the User-Agent header, if you see a request claiming to be from IE 9 listing the User-Agent first, the request isn’t actually from IE 9. Catching software in a lie doesn’t necessarily mean it’s malicious, but if you combine the knowledge that the request is spoofing IE 9 with other suspicious features, you’ll likely get a report that produces quality results.
Browsers tend to be consistent with their header ordering because software doesn’t do anything without being explicitly coded. So unless browser developers put in extra effort to randomize the header permutation, consistent orderings are a given. Heading ordering is a rather trivial feature that can be found through simple visual inspection of requests. For more complex relationships, other tricks are needed.
One such trick is to build a contingency table. The basic idea behind a contingency table is that if there is a correlation between two different features, then given the value of one, you will see a difference in the likelihood of the other. Suppose you’re looking at HTTP requests with Internet Explorer User-Agent strings, and you see a few different variations:
§ Mozilla/4.0 (compatible; MSIE 8.0; Windows NT 6.1; Trident/4.0)
§ Mozilla/5.0 (compatible; MSIE 9.0; Windows NT 6.1; WOW64;
Trident/5.0)
§ Mozilla/5.0 (compatible; MSIE 10.0; Windows NT 6.2; WOW64;
Trident/6.0)
There seem to be four different features that vary within the User-Agent header for IE: Mozilla version, IE version, Windows version, and Trident version. You may ask, “Is there any relationship between these version numbers?” Contingency tables are helpful at answering that question, as shown in Table 9-3.
|
Mozilla Version |
Internet Explorer Version |
|||||||||
|
1.0 |
4.0 |
5.0 |
5.5 |
6.0 |
7.0 |
8.0 |
9.0 |
10.0 |
11.0 |
|
|
3.0 |
0 |
27 |
0 |
0 |
0 |
0 |
0 |
0 |
0 |
0 |
|
4.0 |
0 |
0 |
30 |
504 |
1052 |
16912 |
902 |
520 |
24 |
1 |
|
5.0 |
1 |
0 |
0 |
0 |
0 |
0 |
7 |
8510 |
2842 |
0 |
|
TOTAL |
1 |
27 |
30 |
504 |
1052 |
16912 |
909 |
9030 |
2866 |
1 |
|
Table 9-3. ~30k requests claiming to be IE plotted by the Mozilla version vertically and the IE version horizontally |
||||||||||
A few things should stand out right away. First, versions of IE before 6 are so old they are not legitimately seen any more, so anything claiming to be these old versions of IE should automatically be suspicious. Second, IE versions 6 through 8 always claim to be Mozilla 4.0, making the 7 requests claiming to be IE 8 with Mozilla 5.0 suspicious. IE 10 always claims to be Mozilla 5.0, so the 24 requests that listed Mozilla 4.0 are suspicious. IE 9 is less conclusive, because 520 isn’t that small compared to 8510, so it may be that there is some normal variation in IE 9. There is no reason to stop at a single contingency table. Table 9-4 shows the IE version versus the Trident version.
|
IE Version |
Trident Version |
||||
|
3.1 |
4.0 |
5.0 |
6.0 |
7.0 |
|
|
4.0 |
0 |
0 |
0 |
0 |
0 |
|
5.0 |
0 |
0 |
0 |
0 |
0 |
|
5.5 |
0 |
0 |
0 |
0 |
0 |
|
6.0 |
0 |
3 |
0 |
0 |
0 |
|
7.0 |
2 |
574 |
6075 |
3891 |
55 |
|
8.0 |
0 |
453 |
5 |
1 |
0 |
|
9.0 |
0 |
0 |
4784 |
22 |
1 |
|
10.0 |
0 |
0 |
1 |
1727 |
0 |
|
TOTAL |
2 |
1034 |
10865 |
5641 |
56 |
|
Table 9-4. ~30k requests claiming to be IE plotted by the IE version vertically and the Trident version horizontally |
|||||
In Table 9-4, you can see IE 8 should only claim to be Trident 4. IE 9 should only claim to be Trident 5. IE 10 should only claim to be Trident 6. IE 7 is oddly inconsistent with the Trident version, but you can be sure that anything claiming to be Trident 3.1 or Trident 7 is bogus.
After you’ve found how various pieces of data relate to other pieces, you can start building logic to check for these relationships. Part of your query decision tree to check for impersonation of IE might look like this partial query:
§ If IE version is 7.0
§ If Mozilla version is not 4.0
§ If IE version is 8.0
§ If any of the following are true
§ Mozilla version is not 4.0
§ Trident version is not 4.0
§ If IE version is 9.0
§ If Trident version is not 5.0
If you built a contingency table between the IE version and the Windows NT version, the logic in the decision tree could be even more complicated. After you’ve built out your whole decision tree for IE User-Agent strings, you have a powerful tool for detecting obvious impersonations of IE. Combine that with other suspicious features in an event, and you’ll have a solid report for detecting activity warranting closer inspection.
Generating a contingency table for simple correlations involving a pair or few pairs of features in your events is easy to do by hand, as seen in the preceding query. What made reading the contingency table so easy was the strong correlation between versions. You could say with certainty and with no need for nuance that if you see IE version N, then the Mozilla version must be M. Sometimes, though, the relationships defining correlated data are murkier, and the breakdowns more difficult. Suppose you have a dataset with two parameters, as in Figure 9-5.
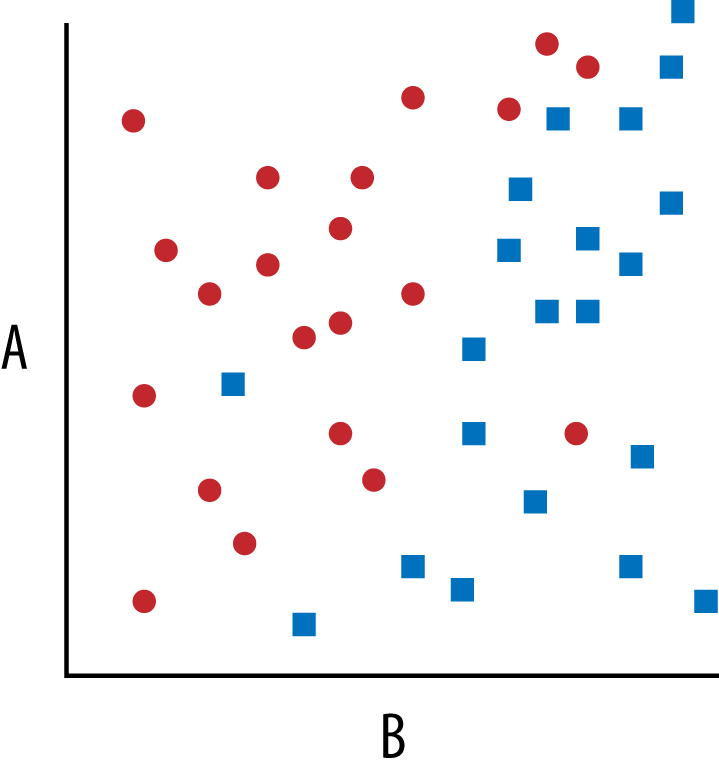
Figure 9-5. Hypothetical features A and B plot revealing their relationship
Here the A and B are two separate features and the circle and square points are malicious and nonmalicious activity. The division between the two groups is not a simple horizontal or vertical line, so you can’t build a decision tree with simple logic like if A > x, or B > y. There is a line that divides them, but it’s difficult to describe in simple Boolean logic and thresholds. You could build logic that does some simple algebra to figure out on which side of the line a point falls, but as your data sets grow or if you add additional parameters, this math quickly gets unwieldy. The machine learning tool of choice for classifying data separated like this is the support vector machine (SVM).
An SVM finds a linear divider between data even when the relationship is hard to pick out by hand. The divider for datasets with only two features, like the example shown, is a line. When you have three parameters, the divider is a plane, and when you have four or more, the divider is a multidimensional hyperplane. The biggest benefit to an SVM over a contingency table and manually built logic is that an SVM is automated and handles many parameters at the same time. Even indirect relationships between the parameters are easily handled by SVMs. Contingency tables are useful for visual inspection and spotting simple relationships, but SVMs can help you build a classifier when you have many parameters or the relationships between the parameters are hard to manually identify.
On the topic of machine learning, SVMs are not the only tool or even the best or most powerful tool for all situations. In the User-Agent example, we showed a manually built decision tree, but there are many machine learning algorithms for building decision trees automatically. If data doesn’t lend itself to plotting (e.g., if some of the parameters aren’t numeric), you may want to use decision-tree learning. If you have several different categories of activity and you want to group data into those categories based on similar behavior, a clustering algorithm may be the best option.
No one book could ever hope to cover the vast landscape of machine learning. The right machine learning model for your security events and your problems is best determined by you through experience and experimentation. Your playbook certainly won’t be built exclusively out of reports that use machine learning for all their logic. However, once in a while when you run into a tricky problem, looking for hidden relationships in the data and using machine learning to act on them will help you create a very powerful report.
Who Is Keyser Söze?
A great cliché from many crime investigation films is the obsessed detective with a wall covered in photos of people arranged by how they connect to each other. Law enforcement calls this a link chart, and their usefulness extends beyond just fictional crime fighting. The abstract idea behind a link chart is that events or pieces of data can be represented by nodes in a graph, and the way the events link or relate to one another are the edges in the graph. Viewing data as a graph is useful for a few fundamental reasons:
§ Connections between nodes mean they share some property
§ Individual nodes are rarely directly connected to all other related nodes
For security event data analysis, nodes can be any number of things:
§ Hosts causing an event to be fired (e.g., IDS or HIPS events)
§ Event targets
§ Domain names being looked up
§ IP addresses
§ Malware samples (by name, MD5 hash, AV hit, etc.)
§ Users
§ Individual features of events (User-Agent header, TCP port, etc.)
The primary property nodes should have is that they can be reused or may appear in multiple events. If a node doesn’t appear in multiple events, it won’t be connected to any nodes associated with other events, so placing it in a graph isn’t useful. For example, an exact timestamp makes a poor node because a specific timestamp will only be associated with one event. The more events a node is associated with, the more connected it will be. The edges in the graph that connect nodes reflect how the nodes relate to one another. For example, if you want to make a graph of HTTP activity, your nodes will include client IP addresses, server domain names, server IP addresses, User-Agent strings, and Referer domains. Then, a request by a client would have an edge from the client IP node pointing to the requested domain node, the server IP node, and the User-Agent and Referer nodes. In turn, the User-Agent node would also point to the Domain, Referer, server IP address, and domain nodes. Each event would have a tightly connected set of nodes associated with it. As more and more events are added to the graph, many events will reuse nodes already in the graph. The graph encodes all of the complex relationships between events in a highly structured format that can support sophisticated queries that are hard to perform without a graph.
Sticking with HTTP as an example, after you’ve built a graph out of your HTTP events, your graph traversal queries can range from simple to quite complex. On the simple side, for most normal HTTP activity, you’d expect most clients to be using only a small number of User-Agent strings. Considering the variability in User-Agent strings, you’d expect most clients making a request to a domain to be using unique User-Agent strings. Querying the graph for all User-Agent nodes and computing the median connectedness of User-Agent nodes to client nodes shows that most User-Agent nodes are only connected to a few clients. So, if most clients use a unique User-Agent string, it would be particularly odd if there was a big imbalance between the number of clients and the number of User-Agents talking to a domain (Figure 9-6).
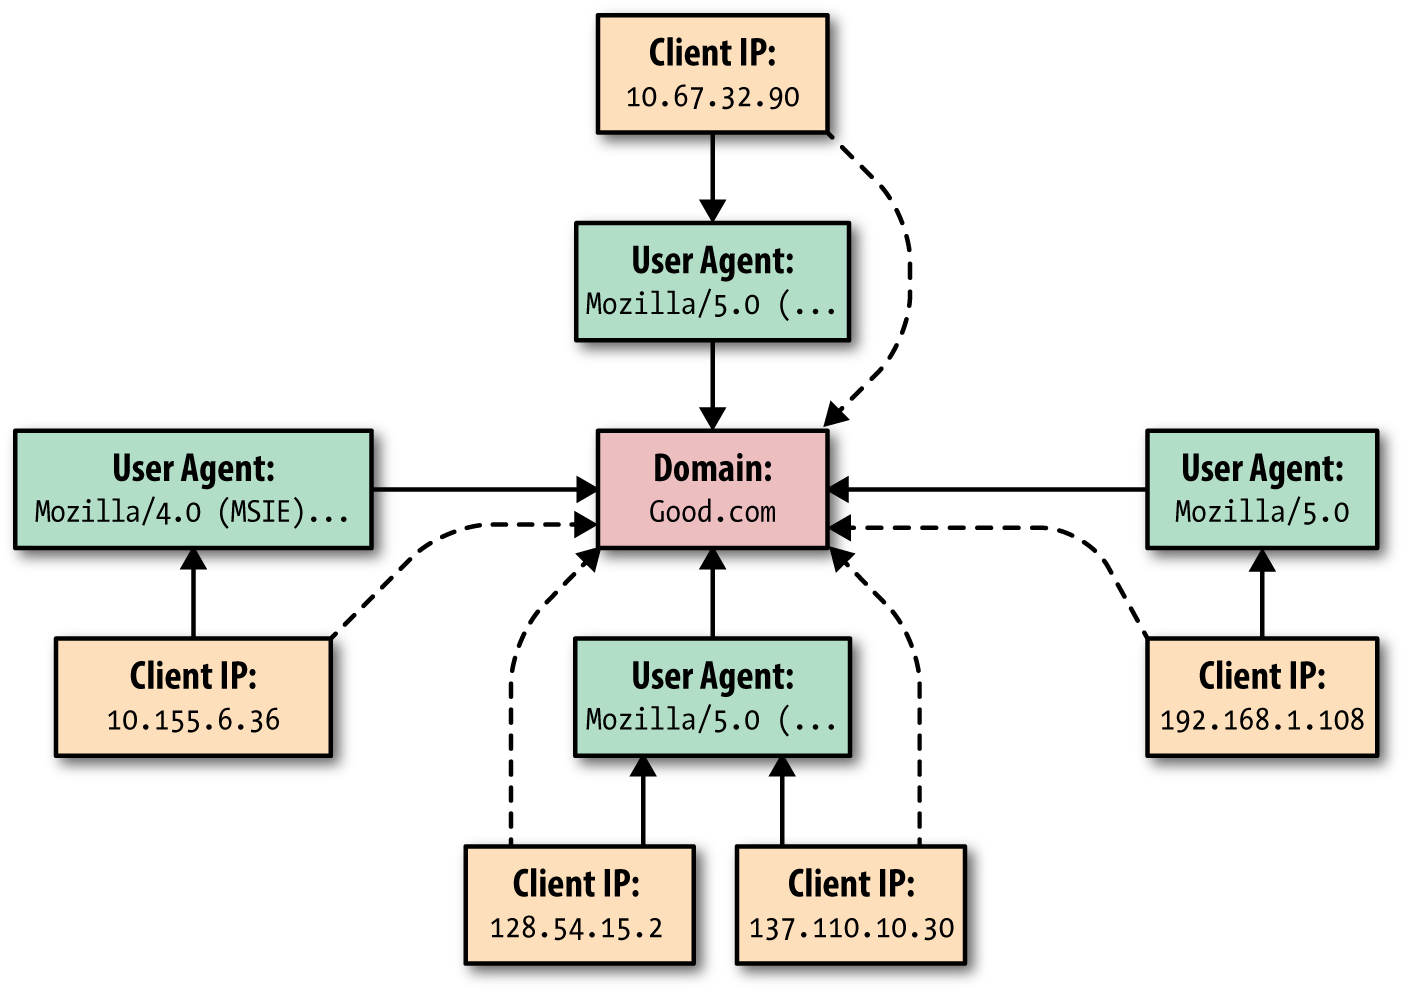
Figure 9-6. A typical domain doesn’t see a lot of overlap in User-Agent strings across many clients; shown here are five unique clients and four unique User-Agent strings associated with activity to a single domain (compare with Figure 9-7)
This translates naturally into a query:
§ For each Domain node in graph
§ Count the number of connected Client nodes as N
§ Count the number of connected User-Agent nodes as M
§ Compute the ratio N:M
§ If N:M is greater than 1.33 or less than 0.75, flag the domain for an imbalance
Of course, the threshold values of 1.33 and 0.75 values were chosen arbitrarily for illustrative purposes, and the actual thresholds would need to be adjusted for your data. Additional thresholds like a minimum number of connected client nodes would also be needed for real datasets. Although very simple, domains returned from this query have an unexpected imbalance between unique User-Agents that when coupled with additional information can make an actionable report. A domain being visited by the same malware on many machines may show an imbalance in the client to User-Agent ratio (Figure 9-7).
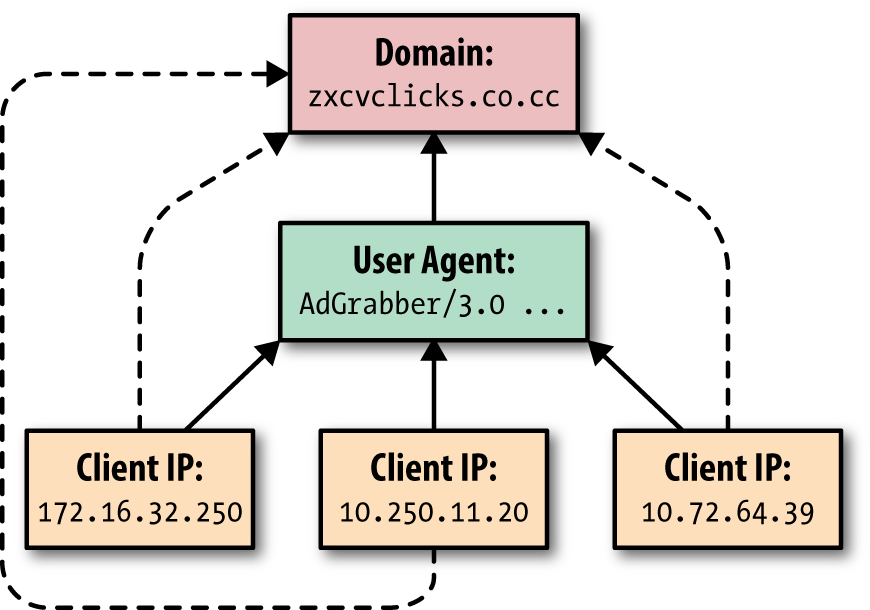
Figure 9-7. Many malware command-and-control domains have a single User-Agent string hardcoded into malware; shown here is one unique User-Agent and three unique clients making requests to a domain (compare with Figure 9-6)
One of the reasons why this type of query is so simple is that it doesn’t fully exploit the highly connected nature of the graph. The query only looks at the nodes directly connected to domain nodes and doesn’t explore the connections beyond that. Queries that traverse many nodes on the graph often require small amounts of code and a data structure to keep track of already visited nodes.
Guilty by Association
With your data in a graph, queries that make use of the interconnected structure are easy to implement, too. In many real-world scenarios, if you know an item like a domain is malicious, there is a good chance that related items like the IP addresses it points to are also malicious or the clients looking it up are compromised. In a simple case, if you assume all IP addresses associated with a malicious domain are also malicious, and you assume all domains that point to a malicious IP address are malicious, then starting from the known bad domains, you can find other bad domains by using the IP address they have in common. Using the HTTP graph described previously, a natural query for finding more malicious domains would be:
§ For each Domain node in known malicious set
§ For each connected server IP node
§ For each Domain node connected to IP node
§ Report found domain if domain is not already in known malicious set
This query finds all of the domains that share an IP address with a known malicious domain. As long as the malicious by association holds true, this query can find new malicious domains that would be incredibly time-consuming to find by hand. This type of query works for many other node relationships besides just domain and IP addresses. This query isn’t limited by a single step either. The newly found domains can be added to the malicious domain set, and the query repeated for the newly found domains until no more domains are found. This type of searching is known as breadth-first search, or BFS, and it allows you to find whole connected regions of malicious activity.
One of the trickiest aspects of graph-based queries is being cognizant about which edges you follow in well-connected graphs. Following all edges haphazardly can quickly expand the scope of your query. For the previous example, if a single “popular” or nonmalicious domain or IP slips into or is connected with the known malicious set, large numbers of nonmalicious domains may be found. For that reason, the malicious data set used with BFS-based queries needs careful curation. Instead of letting the algorithm extend the sets, a reasonable report may produce the next step of results in from the query for human analysis. Then as your analysts look at results, they can mark them as malicious or nonmalicious. After several iterations, a good set of malicious IP addresses and domains is created, and anytime a new IP address or domain is added, your report can fire an alert. We’ve found that queries like this are particularly well suited for tracking specific hacking groups, exploit kits, and pieces of malware.
Exploiting the interconnected nature of graphs extends beyond just hand-curated lists of malicious activity. BFS can produce too many results when edges between nodes don’t indicate a malicious connection. Connections that are less black-and-white can get tricky. When you’re building a graph of your data, it’s tempting to want to look for nodes that are connected to lots of different, possibly malicious nodes. That is, if you have a list of domains you think might be malicious, IP addresses pointed to by several of these domains are probably more suspicious than IP addresses pointed to by only one suspect domain.
In general, if you believe something about one node, you may want to propagate some of that belief to the nodes that connect to it. This is called belief propagation, and these algorithms can be powerful tools for finding malicious activity. The specifics are highly dependent on the data sources in your graph and the types of information you want to propagate between nodes. When properly implemented and carefully tuned, you can propagate negative and positive reputation data throughout the graph to assign other nodes a reputation based on the reputation of their peers, their peers’ peers, and so on. The specifics on how to implement belief propagation algorithms are well beyond the scope of this book.
Chapter Summary
§ Avoiding false positives aids your detection success rate by lowering the total time of analysis required for detecting and responding to security incidents.
§ Set operations can quickly reveal common activities hidden in large sets of data.
§ Contingency tables are a powerful tool for measuring correlations between event features and detecting forged or spoofed events.
§ Graph analysis, statistical relationships, and machine learning can take your playbook to the next level, giving you detection capabilities beyond simple event-by-event analysis.
§ Visualizing data through graphs and relationships makes it easier to detect unusual patterns that can lead to explicit malicious indicators or are pointers to additional indicators to research.
All materials on the site are licensed Creative Commons Attribution-Sharealike 3.0 Unported CC BY-SA 3.0 & GNU Free Documentation License (GFDL)
If you are the copyright holder of any material contained on our site and intend to remove it, please contact our site administrator for approval.
© 2016-2026 All site design rights belong to S.Y.A.