Applied Network Security Monitoring: Collection, Detection, and Analysis (2014)
SECTION 1. Collection
OUTLINE
Chapter 2 Planning Data Collection
Chapter 3 The Sensor Platform
Chapter 4 Session Data
Chapter 5 Full Packet Capture Data
Chapter 6 Packet String Data
CHAPTER 2. Planning Data Collection
Abstract
The first chapter in the Collection section of Applied NSM provides an introduction to data collection and an overview of its importance in the scope of NSM. This chapter introduces the Applied Collection Framework, a model that can be used to translate business concerns into quantifiable risk that can be used to make decisions regarding data collection. This framework is covered in theory, and with a practical example centered on a real-world organization.
Keywords
Network Security Monitoring; Collection; Applied Collection Framework; Risk; Collection Strategy; Threats; Probability; Impact; Risk Assessment
Collection occurs with a combination of hardware and software that are used to generate and collect data for NSM detection and analysis. If you are an analyst reading this book, you may think this section isn’t entirely relevant to you. That is all too wrong. An effective analyst can be described in a lot of ways (I prefer Packet Ninja), but ultimately, the analyst must be a master of their data. This means knowing what data is available, where that data comes from, how it is collected, why it is collected, and what you can do with it. A good analyst can make bad data useful and good data great.
All too often, analysts tend to pass the buck on collection. This typically results in an NSM team where collection is a process owned by a separate systems or networking group, or where a single analyst serves as “the collection guy”. Segmenting this knowledge to another group or creating isolated pockets of knowledge doesn’t serve the NSM mission and results in analysts who don’t fully understand the data they are analyzing.
Most organizations fit into one of three categories:
• Organizations with no NSM infrastructure in place that are just beginning to define their data collection needs.
• Organizations that already perform intrusion detection, but have never taken an in-depth look at the data they are collecting.
• Organizations that have invested a great deal of time in defining their collection strategy, and are constantly evolving that strategy as a part of the NSM Cycle.
This section is dedicated to collection from scratch in hopes that all three types of organizations can benefit from the concepts discussed.
The Applied Collection Framework (ACF)
Abraham Lincoln said, “If I had six hours to chop down a tree, I’d spend the first four hours sharpening my axe.” I can’t think of a more fitting quote to describe the importance of data collection.
I stated earlier that a skilled analyst must be a master of their data. This is often hard to do because many organizations don’t fully understand their data. They didn’t take a structured approach to defining the threats to their organization, but rather, simply grabbed whatever ad-hoc data they had available to build their program around. This over abundance of data can lead to servers with an insufficient amount of disk resources for data retention, where excess staffing is required to sift through too many events and false positives, or where detection and analysis tools can’t scale effectively with the amount of data they are expected to parse.
Playing the role of network defenders, we generally hate surprises. Although we often think that surprise is a function of uncertainty, it is also a function of complexity.1 Having an over abundance of data that may not be relevant to realistic organizational threats is a fast way to increase complexity.
Decreasing the complexity of data collection is where the Applied Collection Framework (ACF) comes into play (Figure 2.1). The ACF is a loose set of steps that help an organization evaluate what data sources should be the focus of their collection efforts.

FIGURE 2.1 The Applied Collection Framework (ACF)
The ACF is not completed in a vacuum. To be successful, it requires collaboration with senior leadership right from the start. The security team and other stakeholders will be responsible for taking information gleaned from these early meetings and making it actionable. The ACF involves four distinct phases: Identify threats to your organization, quantify risk, identify relevant data feeds, and refine the useful elements.
Define Threats
In order to practice threat-centric security you must have some ability to define what threats you face. In this case, I don’t mean general threats such as rival companies, script kiddies, hacktivism groups, or nations. Instead, you should identify threats specific to organizational goals.
When identifying threats associated with your organization, you should always start with the question, “What is the worst case scenario as it relates to the survivability of the organization?” The answer must come straight from the top, which is why it is crucial that information security personnel work with senior leadership during the initial phases of defining collection requirements.
It helps to frame these threats by whether they negatively impact confidentiality, integrity, or availability. Consider the following examples:
• A manufacturing organization relies on their production occurring on a 24 × 7 × 365 basis to meet demand by creating the products that generate revenue. When something occurs that interrupts production, it costs the organization dramatically. Therefore, production interruption might be the biggest threat to the organization. This is a threat to availability.
• A law firm expects that its information will remain confidential. Often times, legal firms handle information that could cost organizations millions of dollars, or even cost people their lives. The conversations between legal partners and their clients are of the utmost importance. The threat that a third party could intercept these conversations could be the biggest threat a law firm faces. This is a threat to confidentiality.
• An online reseller relies on website sales in order to generate revenue. If their website is inaccessible for even a few minutes, it may result in a large number of lost sales and revenue. In this case, inability to complete sales might be the biggest threat to the organization. This is a threat to availability.
• A commodity trading company relies heavily on the ability to communicate information to overseas partners during the trading day in order to execute trades that generate revenue. If this information is inaccurate, it could cause a ripple effect resulting in millions of dollars in losses based upon automated trading algorithms. The biggest threat to this organization would be a deliberate or accidental error in data fed into these algorithms. This is a threat to integrity.
• A biomedical company focuses all of its effort on researching new pharmaceuticals. The data generated from this research is the nest egg of the organization, and represents the combined results of the money provided by their investors. Should a competitor gain access to the information, it could potentially cause the entire organization to fail. The threat of theft of intellectual property could be the biggest threat faced by this biomedical company. This is a threat to confidentiality.
In reality, most organizations will have several threats that they are concerned about. In these cases, senior leadership should prioritize all of these threats so that they can be considered appropriately.
Once threats have been identified, it is up to information security personnel to dig deeper into these organizational threats so that the technology underlying them can be addressed. This is done by understanding the infrastructure within the network and asking the right questions to the primary stakeholders involved with the identified business processes.
Let’s more closely examine the biomedical company mentioned in the last bullet point above. This company is heavily invested in its intellectual property, and has identified that the greatest threat to its organization’s survivability is the loss of that intellectual property. Considering that, the following questions, could be asked:
• What devices generate raw research data, and how does that data traverse the network?
• From what devices do employees process raw research data?
• On what devices is processed research data stored?
• Who has access to raw and processed research data?
• Is raw or processed research data available from outside the network?
• What paths into the internal network are available externally?
• What level of access do temporary employees have to research data?
Depending on the answers provided, you should be able to start building a picture of what assets within the network are most critical to protecting this sensitive data. The goal is to systematically determine the methods by which the network could be compromised, possibly leading to a theft of the intellectual property. A broad resultant list may look something like this:
• Web Server Compromise
• Database Server Compromise
• File Server Compromise
• Disgruntled Employee Data Exfiltration
Quantify Risk
Once a list of potential technical threats has been identified, those threats must be prioritized. One way to achieve this is to calculate the risk posed by each potential threat by determining the product of impact and probability. This is represented by the equation Impact (I) × Probability (P) = Risk (R).
Impact takes into consideration how a given threat, should it manifest itself, could affect the organization. This is measured on a scale of 1 to 5, with 1 meaning that the threat would have little impact, and 5 meaning that the threat would have a large impact. Determining impact can take into account things such as financial loss, the ability to recover lost data, and the amount of time required to resume normal operations.
Probability represents the likelihood that a threat will manifest itself. This is also measured on a scale of 1 to 5, with 1 meaning that there is a low probability that the threat will manifest itself, and 5 meaning that the threat has a high probability of manifestation. The determination of probability can include consideration of an asset’s exposure or attack surface visible to the threat, the level of intimacy with the network required to execute an attack, or even the likelihood that someone would be able to gain physical access to an asset. Over enough time, the probability of a vulnerability being exploited increases. When we create probability rankings they represent the moment in time in which they are created, which means that they should be revisited over time.
The product of impact and probability is the level of risk, or the “risk weight” the threat poses to the security of the network in relation to the organization’s business goals. This is measured on a scale of 1 to 25. This is broken down into three categories:
• 0-9: Low Risk
• 10-16: Medium Risk
• 17-25: High Risk
In performing this assessment for the biomedical company, our prioritization of the technical threats could look like Table 2.1.
Table 2.1
Quantifying Risk for a Biomedical Company
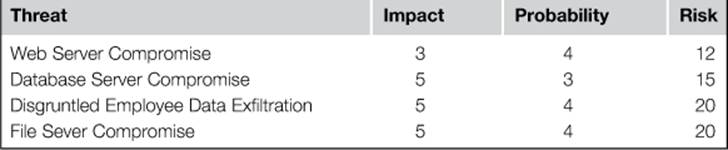
Although impact and probability are meant to provide some ability to quantify metrics associated with threats, these numbers are still subjective. Because of this, it is important that these numbers are generated by committee and that the same group of individuals participate in the ranking of all identified threats. Some organizations choose to elicit third parties to help quantify these risks, and I’ve seen this done successfully in conjunction with network penetration tests.
Identify Data Feeds
The next phase of the ACF involves actually identifying the primary data feeds that might provide NSM detection and analysis value. Starting with the technical threat that has the highest risk weight, you must consider where evidence of the threat’s manifestation can be seen.
Let’s examine the threat of File Server Compromise. While defining this threat, you should have identified this server’s architecture, its location on the network, who has access to it, and the pathways that data can take to and from it. Based upon this information, you can examine both network-based and host-based data feeds. This list might end up looking something like this:
• Network-Based:
• File Server VLAN - Full Packet Capture Data
• File Server VLAN – Session Data
• File Server VLAN - Throughput Statistical Data
• File Server VLAN - Signature-based NIDS Alert Data
• File Server VLAN - Anomaly-based IDS Alert Data
• Upstream Router - Firewall Log Data
• Host-Based:
• File Server - OS Event Log Data
• File Server - Antivirus Alert Data
• File Server - HIDS Alert Data
You’ll notice that this is broad, but that’s okay. The goal here is just to begin identifying valuable data sources. We will get more granular in the next step.
Narrow Focus
The final phase of the ACF is to get intimately granular with the data sources you’ve selected. This can be the most technically in-depth step, and involves reviewing every data source individually to gauge its value. You may find that some data sources have such a high storage, processing, or management overhead compared to the value they provide, that they aren’t worth collecting. Ultimately, your organization will have to perform a cost/benefit analysis of the desired data sources to determine if they value they provide is worth the cost of implementation and maintenance. From the cost perspective, this analysis should take into account the amount of hardware and software resources, as well as the support staff that are required to maintain the generation, organization, and storage of the data resource. To analyze the benefit side of this equation, you should examine the number of documented occurrences in which the data source in question was referenced or desired in an investigation. Your time spent performing this process might include doing things such as defining what types of PCAP data you explicitly want to capture or which Windows security log events are the most important to retain.
Common questions you will ask during this process might include:
• What can you filter out of PCAP traffic from a specific network segment?
• Which system event logs are the most important?
• Do you need to retain both firewall permits and denies?
• Are wireless authentication and association logs valuable?
• Should you retain logs for file access and/or creation and/or modification?
• Which portions of the web application do you really need web logs for?
You should also begin to define the amount and duration of each data type you would like retain. This can be phrased as an operational minimum and an operational ideal. The operational minimum is the minimum required amount necessary to perform near real-time detection, and the operational ideal is the preferred amount of data needed for retrospective detection and as an investigative data source for analysis.
Given the broad list we established in the previous phase, getting granular could result in this list:
• Network-Based:
• Full Packet Capture Data
- All ports and protocols to/from file server
- All SMB traffic routed outside of VLAN
• Session Data
- All records for VLAN
• Data Throughput Statistical Data
- Long-term data throughput statistics for file server
- Daily, Weekly, Monthly averages
• Signature-Based NIDS Alert Data
- All alerts for the segment
- Rules focusing on Windows systems and the SMB protocol
• Anomaly-Based NIDS Alert Data
- Alerts focusing on file server OS changes
- Alerts focusing on rapid or high throughput file downloads
• Firewall Log Data
- Firewall Denies (External → Internal)
• Host-Based:
• System Event Log Data
- Windows Security Log
• Logon Successes
• Logon Failures
• Account Creation and Modification
- Windows System Log
• File System Permission Changes
• Software Installation
• System Reboots
• Antivirus Alert Data
- Detected Events
- Blocked Events
• OSSEC Host-Based IDS
- Alerts Related to Critical System File Changes
- Alerts Related to Rapid Enumeration of Files
- Alerts Related to Account Creation/Modification
Given this list, you should be able to provide the details of what data you need to the appropriate systems and networking teams. At this point, infrastructure will need to be appropriately engineered to support your data collection requirements. Don’t worry too much about infrastructure cost at this point. That is a business decision to be made once you’ve completed the ACF. The goal of this framework is to identify the data you want to collect, and exactly how important you think it is. If budget limitations won’t allow for ideal collection, you should at least have a playbook that will tell you what you can sacrifice. This can be based upon a cost/benefit analysis as described earlier. They key here is that you can justify your collection needs by relating them directly to business goals and threats to business continuity.
If you’ve not had a lot of experience with NSM collection, then you may not know exactly how much value certain data sources can provide. This experience will come, and in the mean time you will run into instances where you decide there are certain data feeds that can be ditched, or where you find it pertinent to start collecting additional data in one form or another. The documents generated from this process are never finalized. It is crucial to understand that you are never “finished” with NSM collection. NSM collection is a living, breathing process, and as you do more detection and analysis and as your network grows you will constantly need to revisit your collection strategy.
The companion website to this book provides the templates shown in the images above that should help you perform the steps of the ACF. Once you’ve completed their first iteration, these templates are an excellent resource for your analysts to familiarize themselves with the data being collected.
Case Scenario: Online Retailer
Let’s examine a scenario where an online retailer is establishing an NSM capability for the first time. Our fictitious company, Purple Dog Inc. (PDI), uses their website to market and sell crafts and knick-knacks produced by other suppliers. They have no traditional brick-and-mortar stores, so their entire revenue stream depends upon their ability to make sales from their website.
I’ve included a diagram of the PDI network in Figure 2.2. This is a fairly typical network design with publicly accessible servers in a DMZ behind an edge router. Users and internal network servers reside in various VLANs behind a core router. You’ll notice that this diagram doesn’t include any sensors. That is because we have yet to establish our collection requirements.
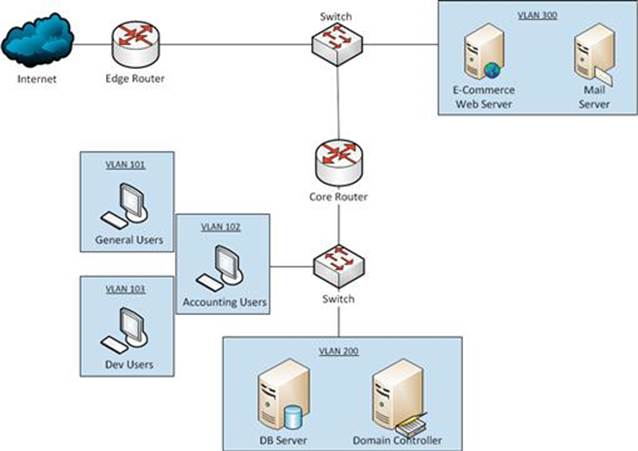
FIGURE 2.2 Purple Dog Inc. Network Diagram
Identify Organizational Threats
Since PDI produces no goods of their own, they are essentially a middleman for the sale and distribution of a product. If you were to ask their executive management what their worst fears are, it would probably result in a list like this:
Fear 1: “All of our customers credit card information getting stolen. We will have to pay huge fines, our customers won’t trust us anymore, and business will suffer.”
Fear 2: “Something bad happens to our website causing it to be inaccessible for an extended time. At a certain point, this might threaten the continuity of the business.”
Fear 3: “An individual finds a bug that allows them to place orders on the website without paying for them. This could result in lost revenues.”
Now, let’s convert those fears from “executive speak” to actual threats.
Theft of Customer PII (Confidentiality)
The PDI e-commerce site collects and stores customer Personally Identifiable Information (PII) data that includes credit card information. This database is not directly accessible from the Internet. In one scenario, an attacker could compromise the database that stores this information through a vulnerability in the web application connected to it. Alternatively, an attacker could access this information by compromising the workstation of an employee who can access this database, such as a developer.
Disruption of E-Commerce Service (Availability)
An adversary could perform an attack that makes the e-commerce website inaccessible to customers. This could occur through a denial of service attack that overwhelms the servers or the network they reside on. This could also occur if an attacker were able to compromise an externally facing asset and orchestrate an action that makes these services unavailable. Lastly, an attacker could compromise a portion of the internal network that would allow them to pivot into the network segment containing the e-commerce servers, and orchestrate an action that makes these services unavailable.
Unintended Use of E-Commerce Service (Integrity)
An attacker could perform an attack that allows them to utilize the web application in an unintended manner, which includes the purchase of products without the exchange of money. The most likely scenario would be that an attacker finds and exploits a bug in the e-commerce web application from an external vantage point. Alternatively, an attack of this manner could occur if an adversary were able to compromise an internal user who had access to the back-end database that supports the e-commerce site.
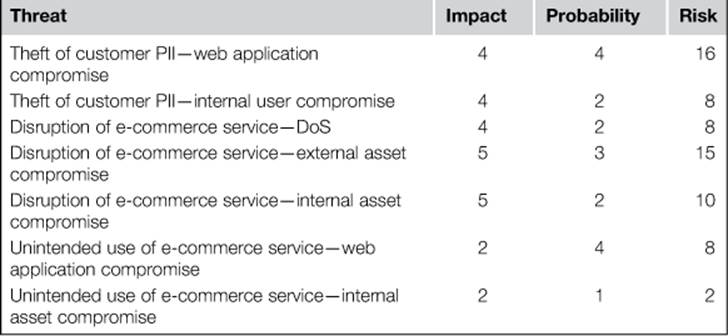
Quantify Risk
With a list of threats to the organization, we can prioritize these threats based upon the probability of a threat manifesting itself, and the impact of the threat should it come to reality. Based upon the threat identified in the previous step, the risk associated with each threat in this scenario is calculated in Table 2.2.
Table 2.2
Quantified Risk for PDI Threats
Now that this list has been created, it can be prioritized, as shown in Table 2.3.
Table 2.3
Prioritized Risk for PDI Threats
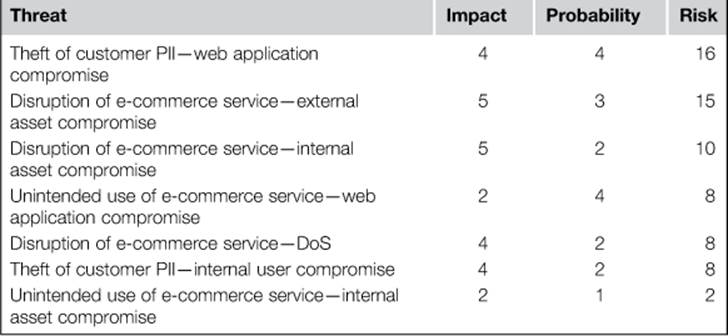
Based upon this table, we are now able to say that the greatest threat to the organization is the disruption of e-commerce services from the compromise of an externally facing asset, and the least concerning threat of these listed is the unintended use of e-commerce services as a result of an internal asset being compromised. We will use this information to shape the choices we make in the next step.
Identify Data Feeds
With priorities established, it is possible to identify the data sources that are useful for NSM detection and analysis. For the sake of brevity, we will look at just a few of the higher risk threats.
Theft of Customer PII – Web Application Compromise
The threat presenting the most risk to the organization is customer PII being stolen as a result of a web application compromise. This presents a potentially large attack surface from the perspective of the web application, but a rather small attack surface from the perspective of network assets.
Starting with the network side of the house, it’s crucial that we can collect and inspect web server transactions with external users so that we can detect any anomalous behavior. In order to do this, a sensor can be placed at the network edge to collect full packet capture data, session data, or packet string data. This will also allow for the use of signature and anomaly-based NIDS.
We can also gain visibility into the actions of the web server by collecting its application-specific log data.
Because the web application provides indirect user access to a back-end database, it is also critical that these transactions are inspected. The database server resides in the internal network, so this will require a second sensor placed so that it has visibility here. Again, this provides for collection of full packet capture data, session data, and packet string data, and allows the use of signature and anomaly-based NIDS.
Finally, the database server will likely generate its own application-specific logs that can provide visibility into its actions.
The result of this planning produces a list of the following data sources:
• DMZ Sensor – Full Packet Capture Data
• DMZ Sensor – Session Data
• DMZ Sensor – Packet String Data
• DMZ Sensor – Signature-Based NIDS
• DMZ Sensor – Anomaly-Based NIDS
• Internal Sensor – Full Packet Capture Data
• Internal Sensor – Session Data
• Internal Sensor – Packet String Data
• Internal Sensor – Signature-Based NIDS
• Internal Sensor – Anomaly-Based NIDS
• Web Server Application Log Data
• Database Server Application Log Data
Disruption of E-Commerce Server – External Asset Compromise
The next threat of high concern is that an externally facing asset will be compromised, leading to the disruption of e-commerce services. Since this could include a web application compromise, this aspect of the attack surface will be included in this assessment.
At PDI, the only two externally facing assets are the e-commerce web servers themselves, with ports 80 and 443 open for web services, and the company mail servers, with port 25 open for SMTP.
Starting with the existing network infrastructure, the collection of firewall logs can be incredibly useful as an investigative data source.
Next, because of the importance of these systems in the context of this threat, it is critical that a sensor exists to collect network data traversing their interfaces. The DMZ sensor described when assessing the last threat provides adequate placement for the coverage needed here.
If these systems are compromised externally, it will likely be done through the compromise of one of the externally facing services. In order to provide adequate detection and analysis of this type of issue, application specific logs will be collected. This includes web, database, and mail server logs.
Beyond the addition of another type of server, the concern of a compromise at the system level is what greatly expands the attack surface in this scenario. In order to ensure that adequate data exists for detection and analysis of events related to this type of compromise, we will also collect operating system and security logs, along with antivirus log data and host-based IDS alert data.
This planning produces this list of data sources:
• Edge Firewall Log Data
• DMZ Sensor – Full Packet Capture Data
• DMZ Sensor – Session Data
• DMZ Sensor – Packet String Data
• DMZ Sensor – Signature-Based NIDS
• DMZ Sensor – Anomaly-Based NIDS
• Web Server Application Log Data
• Database Server Application Log Data
• Mail Server Application Log Data
• Web and Mail Server OS and Security Log Data
• Web and Mail Server Antivirus Alert Data
• Web and Mail Server HIDS Alert Data
Disruption of E-Commerce Server – Internal Asset Compromise
The next highest priority threat on our list is that an internal asset compromise will lead to a disruption of e-commerce services. Because the e-commerce web servers are still the final targets for the adversary, that part of the attack surface will remain the same, resulting in a furthered need for a DMZ sensor.
The only VLANs that have access to the DMZ from within the internal network are the servers in VLAN 200 and the developer users in VLAN 103. This provides another reason to deploy a sensor at the network core so that data from these devices can be collected.
If an attacker were to compromise a developer’s machine, they would have access to the DMZ. This means that we should probably collect the relevant system and security logs from the developer workstations, along with HIDS and Antivirus alert data. We are also interested in what is actually traversing the link from the internal to DMZ network, so firewall logs from the core router are worth collecting.
If the attacker were able to compromise a machine on the internal network, one thing they would likely attempt to do is increase their foothold on the network by compromising the Windows Active Directory environment. As such, it is important that logs from the domain controller are collected as well. Assuming the primary domain controller is handling DNS for the enterprise, those logs are also incredibly useful in determining if clients are attempting to resolve potentially malicious hostnames related to an attacker downloading additional tools, or exerting some form of command and control on the network.
This planning produces this list of data sources:
Network-Based
• Edge Firewall Log Data
• Core Firewall Log Data
• DMZ Sensor – Full Packet Capture Data
• DMZ Sensor – Session Data
• DMZ Sensor – Signature-Based NIDS
• DMZ Sensor – Anomaly-Based NIDS
• Internal Sensor – Full Packet Capture Data
• Internal Sensor – Session Data
• Internal Sensor – Packet String Data
• Internal Sensor – Signature-Based NIDS
• Internal Sensor – Anomaly-Based NIDS
Host-Based
• Web Server, Database Server, and Domain Controller Application Log Data
• Web Server, VLAN 200, and VLAN 103 OS and Security Log Data
• Web Server, VLAN 200, and VLAN 103 Antivirus Alert Data
• Web Server, VLAN 200, and VLAN 103 HIDS Alert Data
The lists of data sources generated from these perceived threats aren’t meant to cover every possible scenario, but they do represent a fair number of potential defense scenarios.
Identifying a plethora of data sources that could be useful for NSM detection and analysis results in a modification of the original network diagram. This new diagram includes the placement of the DMZ and internal sensors, and outlines the visibility zones they create (Figure 2.3). We will talk more about sensor placement in the next chapter.
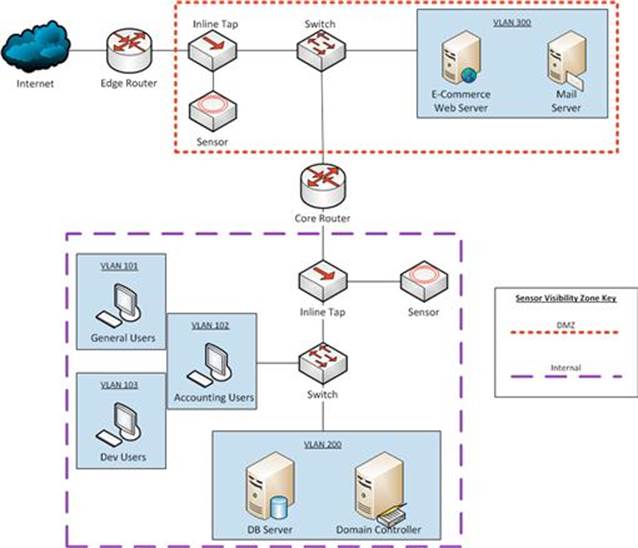
FIGURE 2.3 Updated Network Diagram Including Sensor Placement
Narrow Focus
The last step in this process is to take the primary data sources that have been identified and refine those so that only useful aspects of that data are collected. There are limitless possible ways to approach this, but in this case, our fictitious company decided the following subsets of data were deemed to be feasible for collection based upon their own cost/benefit analysis.
For this scenario, the following refined set of data sources has resulted:
Network-Based:
• Edge Firewall Log Data
• Internal → External Denies
• Core Firewall Log Data
• External → Internal Permits/Denies
• Internal → External Denies
• DMZ Sensor – Full Packet Capture Data
• External → Internal Web Ports
• External → Internal Mail Ports
• Internal → External Mail Ports
• DMZ Sensor – Session Data
• All Records
• DMZ Sensor – Signature-Based NIDS
• Rules focusing on web application attacks: SQL injection, XSS, etc.
• Rules focusing on web server attacks
• Rules focusing on mail server attacks
• DMZ Sensor – Anomaly-Based NIDS
• Rules focusing on web and mail content anomalies
• Internal Sensor – Full Packet Capture Data
• Internal → Web Server IPs
• Internal → Dev User VLAN 103
• External → Server VLAN 200
• Internal Sensor – Session Data
• All Records
• Internal Sensor – Packet String Data
• Dev User VLAN 103 → External
• Internal Sensor – Signature-Based NIDS
• Rules focusing on database attacks
• Rules focusing on domain controller administration actions and attacks
• General malware rules
• Internal Sensor – Anomaly-Based NIDS
• Rules focusing on anomalous database interaction
Host-Based:
• Mail Server, Web Server, Database Server, and Domain Controller Application Log Data
• Mail Server – Account Creation and Modification
• Web Server – Transactions from Billing Processing Subdomain
• Web Server – Transactions from Administration Subdomain
• Database Server – Account Creation and Modification
• Database Server – Billing Transactions
• Database Server – Administration Transactions
• Domain Controller – Account Creation and Modification
• Domain Controller – Computer Creation and Modification
• Mail Server, Web Server, VLAN 200, and VLAN 103 OS and Security Log Data
• Account Creation and Modification
• Installed Software Notifications
• System Update Notifications
• System Reboot Notification
• Mail Server, Web Server, VLAN 200, and VLAN 103 Antivirus Alert Data
• All Alert Data
• Mail Server, Web Server, VLAN 200, and VLAN 103 HIDS Alert Data
• Alerts Related to Critical System File Changes
• Alerts Related to Account Creation/Modification
Conclusion
In this chapter we introduced some of the driving forces behind data collection and discussed a framework for deciding what types of data should be collected. The case scenario here provides a high-level overview of the steps that an organization might take in determining what their data collection needs are, but this knowledge shouldn’t be applied in a vacuum. The concepts presented in the remainder of this book will help to strengthen the decision-making that goes into defining collection requirements.
1Bracken, P. (2008). Managing strategic surprise. Cambridge, MA: Cambridge University Press.
All materials on the site are licensed Creative Commons Attribution-Sharealike 3.0 Unported CC BY-SA 3.0 & GNU Free Documentation License (GFDL)
If you are the copyright holder of any material contained on our site and intend to remove it, please contact our site administrator for approval.
© 2016-2026 All site design rights belong to S.Y.A.