Learning Pentesting for Android Devices (2014)
Chapter 2. Preparing the Battlefield
In the previous chapter, we learned the basics of Android security and its architecture. In this chapter, we will read about setting up our Android Pentesting lab, which will include downloading and configuring Android SDK and Eclipse. We'll understand ADB in depth and learn how to create and configure Android Virtual Devices (AVDs).
We will cover the following aspects in this chapter:
· Android Debug Bridge
· Introduction and setting up of Burp Suite
· Introduction to APKTool
Setting up the development environment
In order to build Android applications or create an Android virtual device, we need to set up the development environment in order for those applications to run. So, the first thing we need to do is download Java Development Kit (JDK), which includes Java Runtime Environment:
1. To download JDK, we need to go to http://www.oracle.com/technetwork/java/javase/downloads/index.html and download JDK 7 depending on the platform we are on.
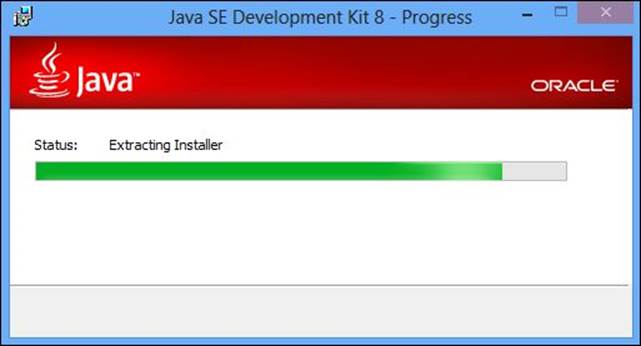
It is as simple as downloading it and running the downloaded executable file. In the following screenshot, you can see Java being installed on my system:
2. Once we have downloaded and installed JDK, we need to set up the environment variables on our system so that Java can be executed from any path.
For Windows users, we need to right-click on the My Computer icon and select the Properties option.
3. Next, we need to select the Advanced system settings option from the top tabs list:
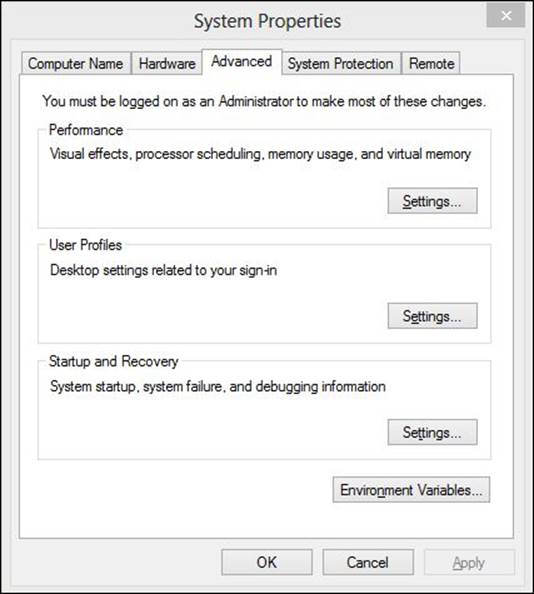
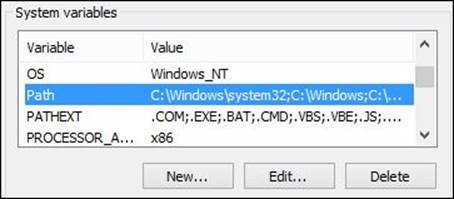
4. Once we are in the System Properties dialog, in the bottom-right corner we can see the Environment Variables... option. When we click on it, we can see another window opening up, containing the system variables and their values, under the System variables section:
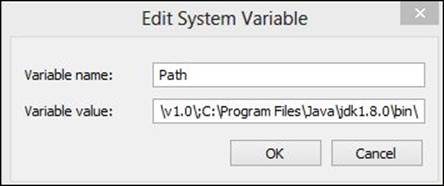
5. In the new pop-up dialog box, we need to click on the PATH textbox under Variables and type in the path of the Java installation folder:
For Mac OS X, we need to edit the ~/.bash_profile file and append the path of Java to the PATH variable.
In Linux machines, we need to edit the ./bashrc file and append the environment variable line. Here is the command to do that:
$ nano ~/.bashrc
$ export JAVA_HOME=`/usr/libexec/java_home -v 1.6` or export JAVA_HOME=`/usr/libexec/java_home -v 1.7`
You could also check if Java has been installed and configured properly by running the following command from the terminal:
$ java --version
6. Once we have downloaded and configured the environment variable for Java, the next step we need to perform is to download the Android ADT bundle available at http://developer.android.com/sdk/index.html.
The ADT bundle is a complete package prepared by the Android team, which includes Eclipse configured with the ADT plugin, Android SDK Tools, Android Platform Tools, the latest Android platform, and the Android system image for the emulator. This has significantly simplified the entire process of the earlier downloading and configuring of Eclipse with Android SDK, since everything now comes preconfigured.
7. Once we have finished downloading the ADT bundle, we can extract it and go to the Eclipse folder and open it.
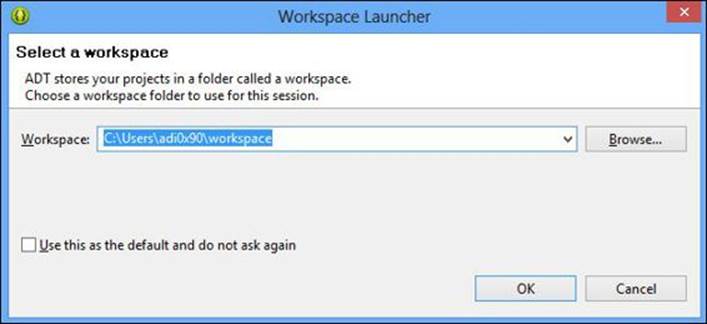
8. Upon launching, the ADT bundle will ask us to configure the workspace of Eclipse. A workspace is the location where all your Android application development projects and their files will be stored. In this case, I have left everything as default and also checked the Use this as the default and do not ask me again checkbox:
9. Once it has completely started up, we can go ahead and create an Android virtual device. An Android virtual device is an emulator configuration configured to a particular version of Android. An emulator is a virtual device provided along with the Android SDK bundle, using which a developer can run and interact with the applications of a normal device as he would do on the actual device. This is also useful for developers who don't have an Android device, but who would still like to create Android applications.
Note
An interesting feature to note here is that in the case of Android, the emulator runs on an ARM and emulates all the things exactly the same as a real device. However, in iOS, we have a simulator that just simulates the environment instead of having all the same components and platform.
Creating an Android virtual device
To create an Android virtual device, we need to do the following:
1. Go to the top bar of Eclipse and click on the device-like icon right next to the Android icon. A new Android Virtual Device Manager window will open up containing a list of all the virtual devices. It will be a good option to go ahead and create a new virtual device by clicking on theNew button.
2. We could also start the Android virtual device by running the android command from the terminal and going to Tools and then Manage AVDs. Or else, we could simply specify the AVD name and use the emulator –avd [avd-name] command in order to start the particular virtual device.
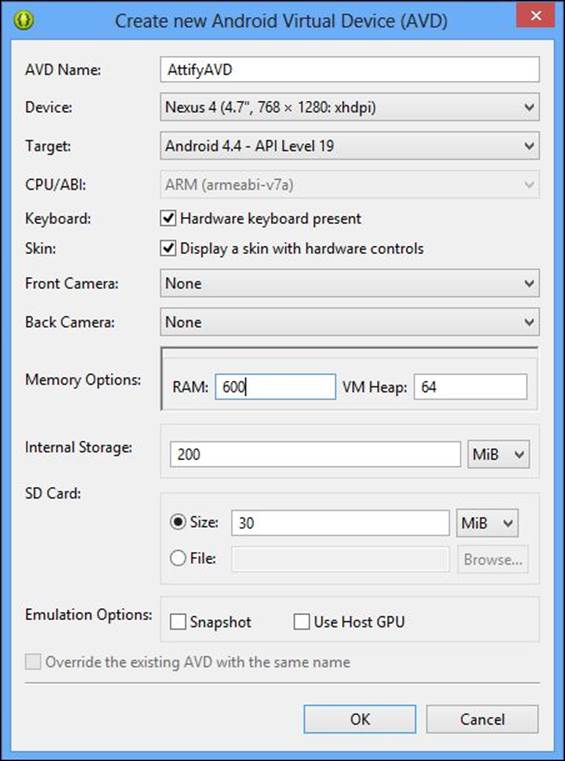
A new window will open up containing all the properties that need to be configured for the Android virtual device, which is yet to be created. We will configure all the options as shown in the following screenshot:
3. Once we click on OK and come back to the AVD manager window, we will see our newly created AVD.
4. Now, just select the new AVD and click on Start... in order to start up the virtual device we created.
It might take a long time for it to load the first time you use it, because it is configuring all the hardware and software configurations in order to give us a real phone-like experience.
5. It would also be a good choice to check the Snapshot checkbox in the previous configuration in order to save the boot time of the virtual device.
6. Once the device is loaded, we can now go to our command prompt and check the device configuration using the android command. This binary file is located the adt-bundle folder under the /sdk/tools folder in your installation.
7. We will also set up the location of the tools and platform-tools folders located in the sdk folder, just like we did before with our environment variable.
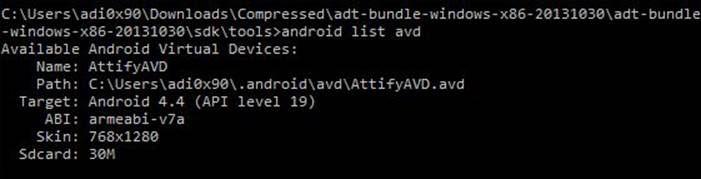
8. To get the configuration details of the connected (or loaded) device in our system, we can run the following command:
9. android list avd
As we can see in the following screenshot, the output of the preceding command shows us a list of all the existing Android virtual devices in our system:
9. We will now go ahead and start playing with the device using ADB, or Android Debug Bridge, which we have seen in the previous chapter. We can also run the emulator by executing the emulator –avd [avdname] command in the terminal.
Useful utilities for Android Pentest
Now, let us have a detailed look at some of the useful utilities for Android Pentest, such as Android Debug Bridge, Burp Suite, and APKTool.
Android Debug Bridge
Android Debug Bridge is a client-server program that allows the user to interact with the emulator or the connected Android device. It includes a client (that runs on the system), a server handling the communication (also running on the system), and a daemon running on the emulator and devices as a background process. The default port used by the client for ADB communication is 5037 in all cases where the device uses ports ranging from 5555 to 5585.
Let's go ahead and start interacting with the launched emulator by running the adb devices command. It'll show that the emulator is up and running as well as connected to ADB:
C:\Users\adi0x90\Downloads\adt-bundle\sdk\platform-tools>adb devices
List of devices attached
emulator-5554 device
In some cases, even when the emulator is running or the device is connected, you won't see the devices in the output. In those cases, we need to restart the ADB server by killing the server and then starting it again:
C:\Users\adi0x90\Downloads\adt-bundle\sdk\platform-tools>adb kill-server
C:\Users\adi0x90\Downloads\adt-bundle\sdk\platform-tools>adb start-server
* daemon not running. starting it now on port 5037 *
* daemon started successfully *
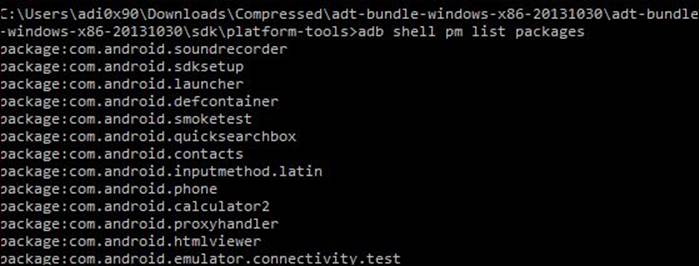
We could also get a list of all the installed packages using the pm (package manager) utility, which could be used in ADB:
adb shell pm list packages
As you can see in the following screenshot, we will get a list of all the packages installed on the device, which could prove useful during the later stages:
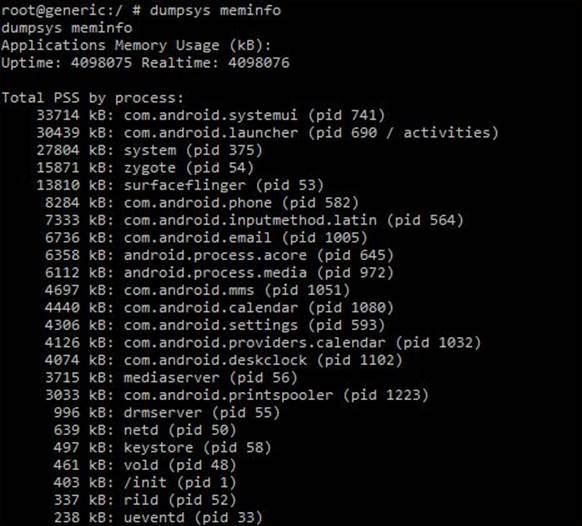
Also, we could get a list of all the applications and their current memory consumption using the adb shell command following the dumpsys meminfo command:
We could also get the logcat (which is a utility to read the logs of events of an Android device) and save it to a particular file instead of printing it on the terminal:
adb logcat -d -f /data/local/logcats.log
The -d flag here specifies dumps of the full log file and exits, and the -f flag specifies to write to a file instead of printing on the terminal. Here we are using the /data/local location instead of any other location because this location is writeable in most devices.
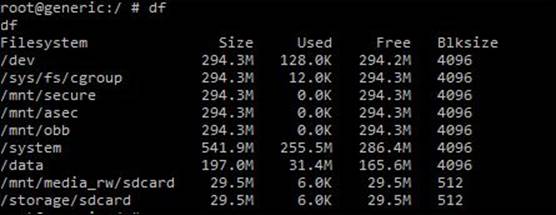
We could also check the filesystem and the available space and size with the df command:
There is also another great utility in Android SDK called the MonkeyRunner. This utility is used to automate and test Android applications and even interact with the applications. For example, in order to test the application with 10 automated touches, taps, and events, we can use the monkey 10 command in the adb shell:
root@generic:/ # monkey 10
monkey 10
Events injected: 10
## Network stats: elapsed time=9043ms (0ms mobile, 0ms wifi, 9043ms not connected)
These are some useful utilities and commands we can use with ADB. We will now go ahead and download some other tools which we will use in the future.
Burp Suite
One of the most important tools we will use in the upcoming chapters is the Burp proxy. We will use this in order to intercept and analyze the network traffic. Many of the security vulnerabilities in applications can be assessed and found out by intercepting the traffic data. Here's how to do it in the following steps:
1. We will now go ahead and download the burp proxy from the official website, http://portswigger.net/burp/download.html.
2. Once downloaded and installed, you will have the Burp window open, which will look like the following screenshot. You can also install Burp using the following command:
3. java –jar burp-suite.jar
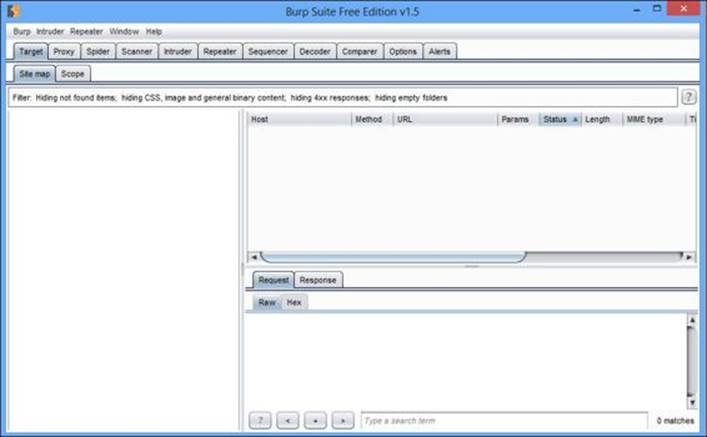
As we can see in the following screenshot, we have Burp running with its default screen in front of us:
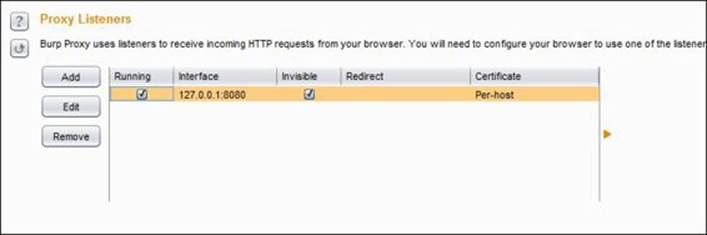
3. In the Burp Suite tool, we need to configure the proxy settings by clicking on the Proxy tab and going to the Options tab.
4. In the Options tab, we can see the default option as checked, which is 127.0.0.1:8080. This means all the traffic going from our system from port 8080 will be intercepted by Burp Suite and shown in its window.
5. We will also need to check the invisible proxying option by selecting the default proxy of 127.0.0.1:8080 and clicking on Edit.
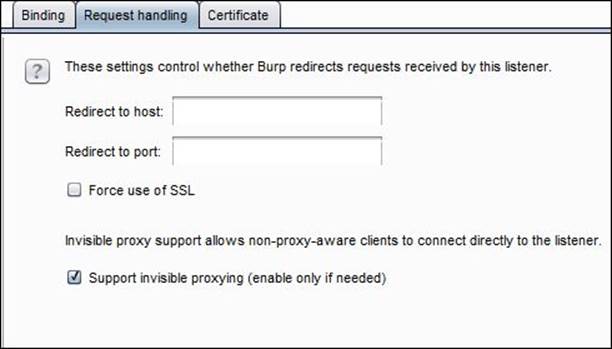
6. Next, we will go to the Request handling tab and check the Support invisible proxying (enable only if needed) checkbox:
7. Finally, we will have the proxy running with the invisible option:
8. Once the proxy is set, we will start up our emulator with the proxy that we have just set. We will be using the following emulator command using the http-proxy option:
9. emulator -avd [name of the avd] -http-proxy 127.0.0.1:8080
You can see how the command is used in the following screenshot:
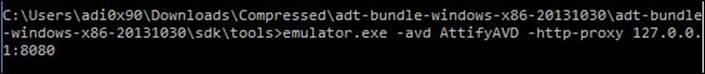
So, we have configured Burp proxy along with the emulator, as a result of which all the emulator traffic will now go through Burp. Here, you might face issues while dealing with websites that use SSL, which we'll cover in the later chapters.
APKTool
One of the most important tools in Android reverse engineering is APKTool. It is designed to reengineer third-party and closed binary Android applications. This tool will be one of our prime focuses in reversing topics and analyzing malware in the coming chapters. To start working on APKTool, carry out the following steps:
1. To download APKTool, we will go to https://code.google.com/p/android-apktool/downloads/list.
Here we need to download two files: apktool1.5.3.tar.bz2, which contains the main apktool binary, and another file depending on the platform—whether it is Windows, Mac OS X, or Linux.
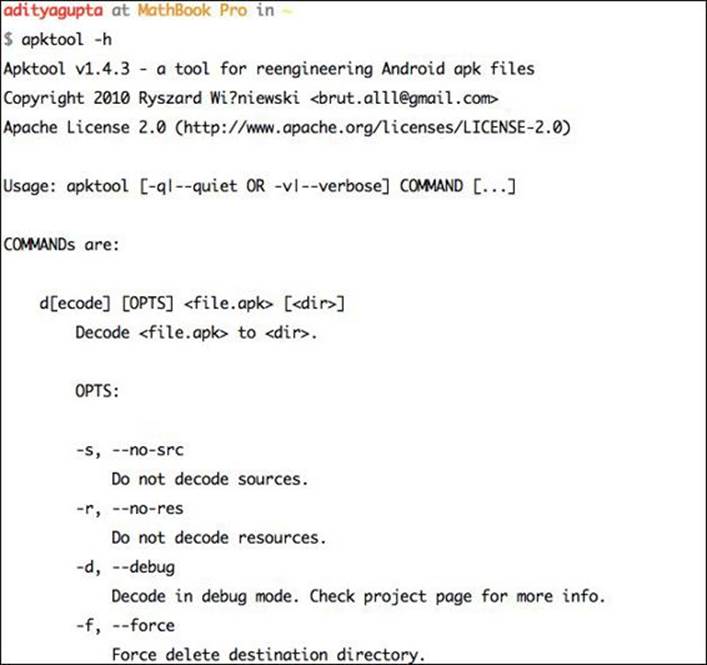
2. Once downloaded and configured, we also need to add APKTool to our environment variables for our convenience. Also, it's a good idea to set APKTool as an environment variable or install it in /usr/bin in the first place. We can then run APKTool from our terminal, which will show us something like the following screenshot:
Summary
In this chapter, we went through setting up an Android penetration-testing environment using Android SDK, ADB, APKTool, and Burp Suite. These are the most important tools with which an Android penetration tester should be familiar with.
In the next chapter, we'll learn how to reverse engineer and audit Android applications. We will also be using tools such as APKTool, dex2jar, jd-gui, and some of our own command-line kung fu.
All materials on the site are licensed Creative Commons Attribution-Sharealike 3.0 Unported CC BY-SA 3.0 & GNU Free Documentation License (GFDL)
If you are the copyright holder of any material contained on our site and intend to remove it, please contact our site administrator for approval.
© 2016-2026 All site design rights belong to S.Y.A.