Malware Analyst’s Cookbook and DVD: Tools and Techniques for Fighting Malicious Code (2011)
Chapter 16. Memory Forensics: Rootkits
A rootkit will often try to hide resources such as files, processes, Registry entries, and ports in order to remain stealthy. API hooking is one of the oldest and easiest methods to cause the OS to report false or inaccurate results about the state of the system; however, it is certainly not the only way. This chapter discusses the most common types of hooks and shows how you can detect them in memory dumps. It also presents some plug-ins for the Volatility platform that you can use to detect rootkits that hide and manipulate the system in various other ways besides using API hooks.
Recipe 17-1: Detecting IAT Hooks
![]()
You can find supporting materials for this recipe on the companion DVD.
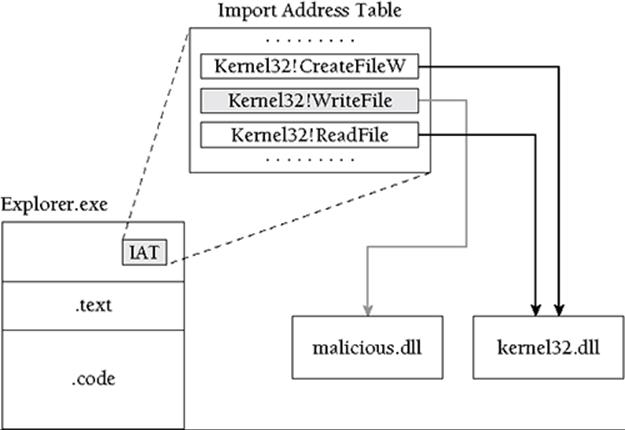
A PE file’s import table stores information about the API functions that a process uses at run-time. In particular, it stores (or stores pointers to) the name of the API function, the name of the DLL that contains the function, and the addresses of the API functions. The particular table that stores all of the addresses is called the Import Address Table (IAT).
To hook an IAT entry, malware typically injects a DLL into the target process. The injected DLL parses the process’s PE header to find which location in the IAT stores a pointer to the function to be hooked. Next, it overwrites that location in the IAT, thus forcing the process to call an attacker-supplied function instead of the API.
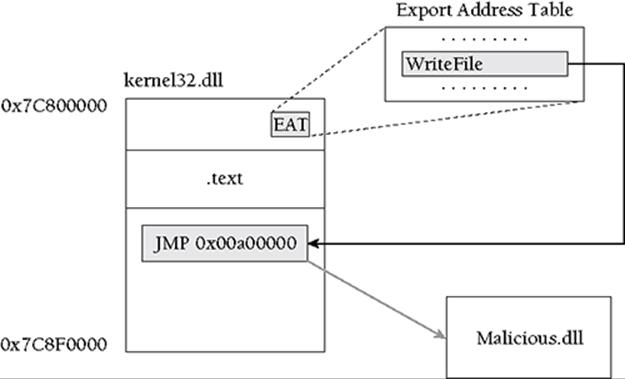
Figure 17-1 shows a simplified view of Explorer’s IAT. You can see that there is one entry for each function that Explorer imports. The entries are 32-bit pointers (on 32-bit systems), because they are designed to store the API function’s address. Thus, the entry for CreateFileW should point inside the memory range where kernel32.dll is loaded. The same goes for WriteFile andReadFile because they are also functions exported by kernel32.dll.
Figure 17-1: Diagram of a hooked IAT entry
Here are the steps involved in detecting IAT hooks in memory dumps:
1. Enumerate the active processes by walking the list of EPROCESS structures (see Recipe 15-5).
2. Enumerate the DLLs loaded into each process by examining the PEB or VAD (see Recipe 16-2). Record the names of the DLLs, along with their base addresses and sizes, so you know the range of memory the DLL occupies.
3. Dump and rebuild the process executable (*.exe) and all loaded DLLs (see Recipe 16-7) so that you can parse the PE header and locate the IAT.
4. For each imported function, make sure that the address in the IAT falls within the memory range occupied by the DLL that is supposed to contain the function.
An important fact to note about Step 3 is that you have to check the IAT for all DLLs, rather than just the IAT in the process’s executable image (the .exe). If a rootkit wants to hook a function process-wide, then it must overwrite the IAT entry for all PE files. Otherwise, some threads in a process might call directly to the legitimate function while others call through the rootkit, leaving quite a messy and unstable system.
Figure 17-2 shows how to use the apihooks plug-in to detect the presence of Zeus, based on its IAT hooks.
$ python volatility.py apihooks -f zeus.vmem
Figure 17-2: Detecting IAT hooks with the apihooks plug-in
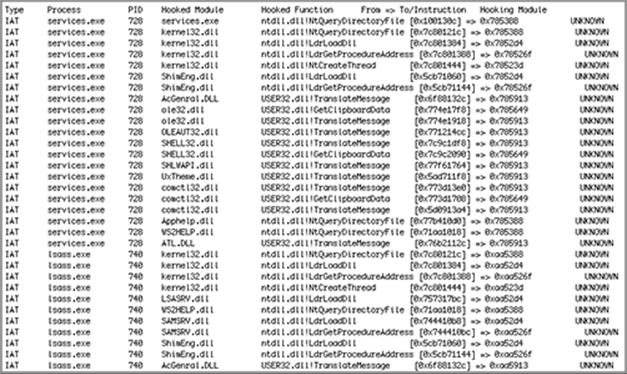
Based on the output, there are several IAT hooks in the services.exe process. Only one of them (NtQueryDirectoryFile) is actually in the IAT of the executable image—services.exe. All of the other hooks are in the IAT of DLLs loaded by services.exe. For example, because kernel32.dll also imports NtQueryDirectoryFile, Zeus has overwritten kernel32.dll’s IAT entry as well. On the right side of the arrow, you can see the destination address of the hook. Depending on the function, you can tell that the rootkit code (Zeus’s body) exists in the 0x785??? memory range. On the far right, you can see the name of the hooking module is UNKNOWN in all cases. That is because Zeus does not use LoadLibrary to inject the rootkit code into the target process. If it does not use LoadLibrary, then the DLL lists in the PEB are not updated and there is no memory mapped file name available from the VAD.
Recipe 17-2: Detecting EAT Hooks
The Export Address Table (EAT) stores the names of functions exported by a DLL and the relative virtual address (RVA) where you can find the function. The RVA is relative to the base address of the DLL when loaded in memory. For example, Figure 17-3 shows some of the functions exported by kernel32.dll. The RVA of WriteFile is 0x00010E27. Therefore, if the base address of kernel32.dll is 0x7C800000, then you can find WriteFile at 0x7C810E27.
Detecting EAT hooks is relatively straightforward. You follow Steps 1 through 3 from Recipe 17-1, but instead of parsing the IAT of dumped modules, you parse the EAT. If you add the RVA for each function to the base address of the DLL that exports the functions, and the resulting address does not fall inside the DLL’s memory range, then the function is hooked.
Figure 17-3: Examining function RVAs in CFF Explorer
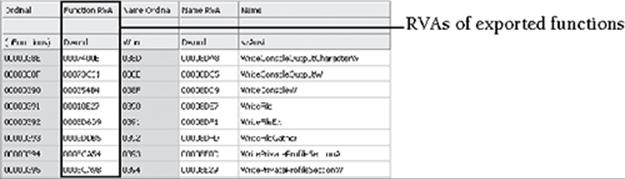
Figure 17-4 shows that CreateFileW and ReadFile are not hooked, because their EAT entries point within the module that is supposed to contain them (i.e., kernel32.dll). WriteFile, on the other hand, points at another DLL in the process’s memory.
Figure 17-4: Diagram of a hooked EAT entry
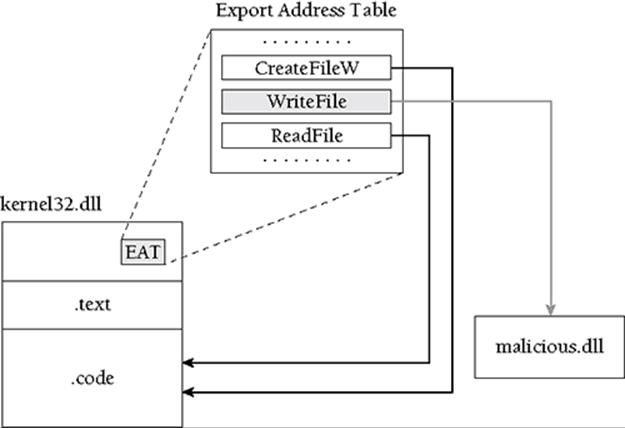
Malware authors do not use EAT hooks very often. One reason is that the process executable and any DLLs that were loaded prior to the EAT hook installation will have the legitimate function’s address in their IAT. The IAT entries are not automatically updated when a rootkit changes the corresponding function’s EAT value. Therefore, an EAT hook only becomes effective for modules loaded into a process after the hook installation or if a previously loaded module calls GetProcAddress to locate the hooked function.
Recipe 17-3: Detecting Inline API Hooks
Attackers use inline hooks (also called trampoline or detours hooks) more commonly than IAT and EAT hooks. Inline hooks require more work on the part of the programmer, but they are not necessarily difficult and there are many open source libraries that show you exactly how it’s done. Some examples of libraries based on inline hooks, although not all open source, are Microsoft Detours, Mhook, EasyHook, and madCodeHook (see Recipe 9-8 for more information). Instead of overwriting a single pointer value as in IAT and EAT hooks, inline hooks require you to disassemble instructions and write to a few different places in the process’s memory.
Figure 17-5 shows a simplified diagram of an inline hook. Notice how the kernel32.dll module occupies memory in the range of 0x7C80000–0x7C8F0000. The EAT entry for WriteFile points at the legitimate location inside kernel32.dll. However, the instructions in the WriteFile function’s prologue have been overwritten with a JMP to 0x00a00000—a memory location occupied by rootkit code.
Figure 17-5: Diagram of an inline hook
To detect inline hooks, you would start with the same Steps 1–3 from Recipe 17-1 and then continue with the following steps:
4. Parse each DLL’s EAT to find the RVA of exported functions. Add the RVA to the DLL’s base address, giving you the VA of the function.
5. Disassemble the first instruction in the exported function. If it is a JMP or a CALL, then proceed to Step 6. Otherwise, continue looping through the EAT until you’ve checked all functions.
6. Determine the destination address of the JMP or CALL. If the destination address is not occupied by kernel32.dll, then the function has been hooked.
The following is an example of performing Steps 5 and 6 with Python code (you can view the full source code in the apihooks Volatility plug-in). The function accepts two parameters: the virtual address of an exported function in the process memory, and an address space for the process. If the code detects a hooked function, it returns the destination address of the hook (i.e., the location in memory to which the API calls are redirected) and the instruction that performs the redirection (i.e. JMP 0x00a00000).
def check_inline(self, va, addr_space):
# Cannot check if the address space is invalid
if not addr_space.is_valid_address(va):
return None, None
# Get the function prologue
bytes = addr_space.zread(va, 24)
if len(bytes) != 24:
return None, None
# Disassemble the first instruction
i1 = pydasm.get_instruction(bytes, pydasm.MODE_32)
if not i1:
return None, None
dest = None
instr = None
# Check for JMP, CALL, or PUSH/RET
if (i1.type == pydasm.INSTRUCTION_TYPE_JMP):
# This is when we find an indirect JMP [ADDR]
if (i1.op1.type == pydasm.OPERAND_TYPE_MEMORY):
dest = (i1.op1.displacement & 0xffffffff)
jmp = struct.unpack("=I", addr_space.zread(dest, 4))[0]
instr = "jmp [0x%x] =>> 0x%x" % (dest, jmp)
dest = jmp
# This is when we find a direct JMP ADDR
elif (i1.op1.type == pydasm.OPERAND_TYPE_IMMEDIATE):
dest = va + i1.op1.immediate + i1.length
instr = "jmp 0x%x" % dest
elif (i1.type == pydasm.INSTRUCTION_TYPE_CALL):
# This is when we find an indirect CALL [ADDR]
if (i1.op1.type == pydasm.OPERAND_TYPE_MEMORY):
dest = (i1.op1.displacement & 0xffffffff)
jmp = struct.unpack("=I", addr_space.zread(dest, 4))[0]
instr = "call [0x%x] =>> 0x%x" % (dest, jmp)
dest = jmp
# This is when we find a direct CALL ADDR
elif (i1.op1.type == pydasm.OPERAND_TYPE_IMMEDIATE):
dest = va + i1.op1.immediate + i1.length
instr = "call 0x%x" % dest
elif (i1.type == pydasm.INSTRUCTION_TYPE_PUSH):
i2 = pydasm.get_instruction(bytes[i1.length:], pydasm.MODE_32)
if not i2:
return None, None
if (i2.type == pydasm.INSTRUCTION_TYPE_RET):
dest = i1.op1.immediate
instr = "push dword 0x%x; ret" % dest
return dest, instr
One important fact regarding Step 5 is that you can transfer execution to another location without using a JMP or a CALL instruction. Therefore, detection tools that only look for JMP or CALL instructions will not detect all types of hooks. For example, all of the following examples lead to 0x00a00000:
// Directly call the destination address
CALL 0x00a00000
// Directly jump to the destination address
JMP 0x00a00000
// Indirectly jump (the 4 bytes at 0x7C8D0F0 stores 0x00a00000)
JMP [0x7C8D0F0]
// The combination of PUSH/RET will transfer control
PUSH 0x00a00000
RET
// Jumps and calls to register values also work
MOV EAX, 0x00a00000
JMP EAX
// Combining instruction sequences complicates detection
MOV EAX, 0x00900000
NOP
NOP
ADD EAX, 0x00100000
CALL EAX
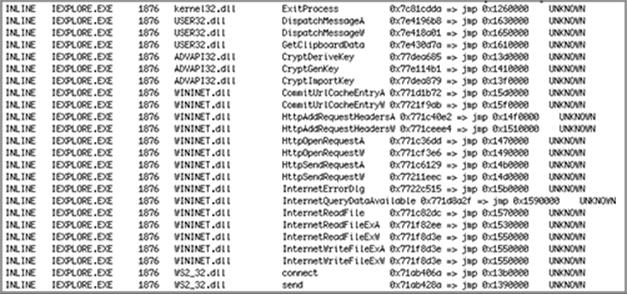
The command that follows shows how to use the apihooks plug-in against a memory dump infected with Silent Banker. The same command you typed to detect IAT and EAT hooks can detect the inline hooks that Silent Banker installs. According to the output (shown in Figure 17-6), the trojan has taken control of several networking and encryption functions in the Internet Explorer process. The hooks enable Silent Banker to steal login credentials, private key certificates, and cookies from websites.
$ python volatility.py apihooks -f silentbanker.vmem
Figure 17-6: Detecting Silent Banker’s inline hooks
Recipe 17-4: Detecting Interrupt Descriptor Table (IDT) Hooks
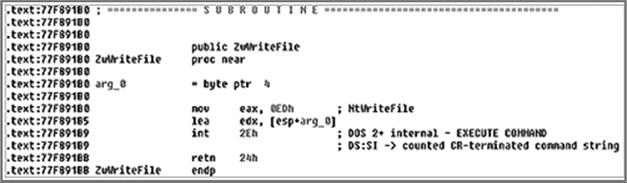
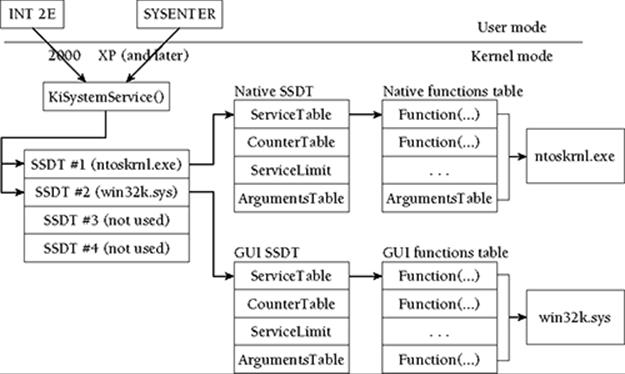
The Interrupt Descriptor Table (IDT) is a data structure that stores addresses of functions for handling interrupts and processor exceptions. Figure 17-7 shows a disassembly of ntdll!NtWriteFile from a Windows 2000 machine. This code executes when a user mode application calls NtWriteFile (or the Win32 WriteFile function) and handles the transition into kernel mode. It works by moving the code (0xED) for the kernel version of NtWriteFile into the EAX register and then issuing an INT 2E instruction. This causes the processor to continue executing at the address stored in the 0x2E slot of the IDT—which should point to KiSystemService. The KiSystemService routine looks at the code in EAX (0xED in this case) and uses it to find the actual address of the kernel’s NtWriteFile function.
Figure 17-7: Windows 2000 uses the IDT for calling into kernel mode.
Rootkits can overwrite the 0x2E entry in the IDT and gain control any time a call to a kernel mode API function is requested. They can literally intercept every call as it makes its way across the user-kernel boundary. However, starting with XP, Windows no longer uses the IDT for locating KiSystemService—it uses model-specific registers (MSRs) instead. Therefore, it is not very common to see rootkits hooking INT 2E anymore because they would only be compatible with older systems. The IDT is still used for other purposes, however.
Finding the IDT in Memory
You can find the base address of the IDT in memory dumps by referencing the_KPCR (see Recipe 15-5). The _KPCR stores a pointer to an array of 256 _KIDTENTRY structures. The following WinDbg output shows the format of the data structures that you need to parse:
kd> dt _KPCR
nt!_KPCR
+0x000 NtTib : _NT_TIB
+0x01c SelfPcr : Ptr32 _KPCR
+0x020 Prcb : Ptr32 _KPRCB
+0x024 Irql : UChar
+0x028 IRR : Uint4B
+0x02c IrrActive : Uint4B
+0x030 IDR : Uint4B
+0x034 KdVersionBlock : Ptr32 Void
+0x038 IDT : Ptr32 _KIDTENTRY
+0x03c GDT : Ptr32 _KGDTENTRY
[...]
kd> dt _KIDTENTRY
ntdll!_KIDTENTRY
+0x000 Offset : Uint2B
+0x002 Selector : Uint2B
+0x004 Access : Uint2B
+0x006 ExtendedOffset : Uint2B
kd>
To get the address of the function that handles a particular interrupt, you would create a 4-byte value using the ExtendedOffset field as the high-order 2-bytes and the Offset field as the low-order 2-bytes. The following example shows how you can detect IDT hooks with the idt plug-in for Volatility. To prepare a test environment, you can install the proof-of-concept interrupt hooking rootkit by Greg Hoglund1 and then dump memory.
$ python volatility.py idt -f hooked_int.bin
IDT# Address
00000000 ntoskrnl.exe!0x804df350
00000001 ntoskrnl.exe!0x804df4cb
[...]
0000002b ntoskrnl.exe!0x804dec95
0000002c ntoskrnl.exe!0x804dee34
0000002d SDbgMsg.sys!0xf8964f96
0000002e BASIC_INT.sys!0xf8bcd550
0000002f ntoskrnl.exe!0x804e197c
00000030 ntoskrnl.exe!0x804ddcf0
00000031 ntoskrnl.exe!0x804ddcfa
[...]
The output shows that the 0x2E slot in the IDT is pointing to an address owned by the BASIC_INT.sys driver. Because you already know that the 0x2E slot should point to KiSystemService, which is a function in ntoskrnl.exe, you should know immediately that something is wrong.
1 http://www.rootkit.com/vault/hoglund/basic_interrupt.zip
Recipe 17-5: Detecting Driver IRP Hooks
Applications in Windows communicate with drivers by sending I/O Request Packets (IRPs). An IRP is a data structure that includes a code to identify the desired operation (create, read, write, and so on) and buffers for any data to be read or written by the driver. Each driver has a table of 28 function pointers that it can register to handle the different operations. The driver usually configures this table, known as the major function table or IRP function table, in its entry point routine right after being loaded. You can see from the following WinDbg output below that the table of 28 pointers is part of every driver object:
kd> dt _DRIVER_OBJECT
ntdll!_DRIVER_OBJECT
+0x000 Type : Int2B
+0x002 Size : Int2B
+0x004 DeviceObject : Ptr32 _DEVICE_OBJECT
+0x008 Flags : Uint4B
+0x00c DriverStart : Ptr32 Void
+0x010 DriverSize : Uint4B
+0x014 DriverSection : Ptr32 Void
+0x018 DriverExtension : Ptr32 _DRIVER_EXTENSION
+0x01c DriverName : _UNICODE_STRING
+0x024 HardwareDatabase : Ptr32 _UNICODE_STRING
+0x028 FastIoDispatch : Ptr32 _FAST_IO_DISPATCH
+0x02c DriverInit : Ptr32 long
+0x030 DriverStartIo : Ptr32 void
+0x034 DriverUnload : Ptr32 void
+0x038 MajorFunction : [28] Ptr32 long
You can use the !drvobj command to print details about the IRP table for a given driver, such as the address assigned to each entry in the table and the corresponding function name. In the example that follows for the tcpip.sys driver, you can tell that it registers a central handler called TCPDispatch for almost all IRP operations. TCPDispatch inspects the IRP and determines what to do with it.
kd> !drvobj \Driver\Tcpip 2
Driver object (821b6340) is for:
\Driver\Tcpip
DriverEntry: b2f43d23 tcpip!GsDriverEntry
DriverStartIo: 00000000
DriverUnload: b2F17a58 tcpip!ArpUnload
AddDevice: 00000000
Dispatch routines:
[00] IRP_MJ_CREATE b2ef94f9 tcpip!TCPDispatch
[01] IRP_MJ_CREATE_NAMED_PIPE b2ef94f9 tcpip!TCPDispatch
[02] IRP_MJ_CLOSE b2ef94f9 tcpip!TCPDispatch
[03] IRP_MJ_READ b2ef94f9 tcpip!TCPDispatch
[04] IRP_MJ_WRITE b2ef94f9 tcpip!TCPDispatch
[05] IRP_MJ_QUERY_INFORMATION b2ef94f9 tcpip!TCPDispatch
[06] IRP_MJ_SET_INFORMATION b2ef94f9 tcpip!TCPDispatch
[07] IRP_MJ_QUERY_EA b2ef94f9 tcpip!TCPDispatch
[08] IRP_MJ_SET_EA b2ef94f9 tcpip!TCPDispatch
[09] IRP_MJ_FLUSH_BUFFERS b2ef94f9 tcpip!TCPDispatch
[0a] IRP_MJ_QUERY_VOLUME_INFORMATION b2ef94f9 tcpip!TCPDispatch
[0b] IRP_MJ_SET_VOLUME_INFORMATION b2ef94f9 tcpip!TCPDispatch
[0c] IRP_MJ_DIRECTORY_CONTROL b2ef94f9 tcpip!TCPDispatch
[0d] IRP_MJ_FILE_SYSTEM_CONTROL b2ef94f9 tcpip!TCPDispatch
[0e] IRP_MJ_DEVICE_CONTROL b2ef94f9 tcpip!TCPDispatch
[0f] IRP_MJ_INTERNAL_DEVICE_CONTROL b2ef9718
tcpip!TCPDispatchInternalDeviceControl
[10] IRP_MJ_SHUTDOWN b2ef94f9 tcpip!TCPDispatch
[11] IRP_MJ_LOCK_CONTROL b2ef94f9 tcpip!TCPDispatch
[12] IRP_MJ_CLEANUP b2ef94f9 tcpip!TCPDispatch
[13] IRP_MJ_CREATE_MAILSLOT b2ef94f9 tcpip!TCPDispatch
[14] IRP_MJ_QUERY_SECURITY b2ef94f9 tcpip!TCPDispatch
[15] IRP_MJ_SET_SECURITY b2ef94f9 tcpip!TCPDispatch
[16] IRP_MJ_POWER b2ef94f9 tcpip!TCPDispatch
[17] IRP_MJ_SYSTEM_CONTROL b2ef94f9 tcpip!TCPDispatch
[18] IRP_MJ_DEVICE_CHANGE b2ef94f9 tcpip!TCPDispatch
[19] IRP_MJ_QUERY_QUOTA b2ef94f9 tcpip!TCPDispatch
[1a] IRP_MJ_SET_QUOTA b2ef94f9 tcpip!TCPDispatch
[1b] IRP_MJ_PNP b2ef94f9 tcpip!TCPDispatch
Drivers are not required to handle all types of operations—only the ones they expect to receive. However, it is poor practice to leave the entries for unhandled operations in the IRP table as zero because that could lead to system instabilities. Therefore, sometimes you will see the IRP functions pointing at nt!IopInvalidDeviceRequest, which is just a dummy function in ntoskrnl.exe that acts as a fall-through (like a default case in a C switch statement).
Hooking and Hook Detection
As you might have guessed, rootkits can hook entries in a driver’s IRP function table. For example, by overwriting the IRP_MJ_WRITE function in a driver’s IRP table, a rootkit can inspect the buffer of data to be written across the network, to disk, or even to a printer. Jamie Butler2 wrote a proof-of-concept rootkit that hides ports by hooking IRP functions, which you can use for testing.
To detect IRP function hooks, you just need to find the _DRIVER_OBJECT structures in memory, read the 28 values in the MajorFunction array, and determine if the addresses point outside of the driver’s own memory (based on the driver’s base address and size). You can use Andreas Schuster’s driverscan plug-in to find the _DRIVER_OBJECT structures, as shown by the following command:
$ python volatility.py driverscan -f clean.vmem
Phys.Addr. Start Size Service key Name
0x02203818 0xf887a000 34560 NetBIOS NetBIOS \FileSystem\NetBIOS
0x02204218 0xf6e49000 138496 AFD AFD \Driver\AFD
0x0220fc00 0xf6e6b000 162816 NetBT NetBT \Driver\NetBT
0x022204f8 0xf6e93000 360064 Tcpip Tcpip \Driver\Tcpip
0x022232a8 0xf6eeb000 74752 IPSec IPSec \Driver\IPSec
[...]
The driverirp plug-in for Volatility extends the work that Andreas did with driverscan in order to print the IRP table for each driver. There are legitimate reasons for hooking IRPs, so just because you see an entry pointing to another driver does not necessarily mean that the hook is malicious. Likewise, just because all of a driver’s IRPs point back inside the owning driver does not mean the IRPs are not hooked! TDL3 is an example of a rootkit that defeats the common method of IRP hooks detection. In the output below, you can see that all of the IRP handlers for atapi.sys lead to a function at atapi.sys!0xf849cb3a. At first glance, it would appear that the IRPs are not hooked, right?
$ python volatility.py driverirp -f tdl3.vmem
Phys.Addr. Start Size Service key Name
0x023381e8 0xf8493000 96512 atapi atap \Driver\atapi
[0] IRP_MJ_CREATE 0xf849cb3a atapi.sys!0xf849cb3a
[1] IRP_MJ_CREATE_NAMED_PIPE 0xf849cb3a atapi.sys!0xf849cb3a
[2] IRP_MJ_CLOSE 0xf849cb3a atapi.sys!0xf849cb3a
[3] IRP_MJ_READ 0xf849cb3a atapi.sys!0xf849cb3a
[4] IRP_MJ_WRITE 0xf849cb3a atapi.sys!0xf849cb3a
[5] IRP_MJ_QUERY_INFORMATION 0xf849cb3a atapi.sys!0xf849cb3a
[6] IRP_MJ_SET_INFORMATION 0xf849cb3a atapi.sys!0xf849cb3a
[7] IRP_MJ_QUERY_EA 0xf849cb3a atapi.sys!0xf849cb3a
[8] IRP_MJ_SET_EA 0xf849cb3a atapi.sys!0xf849cb3a
[9] IRP_MJ_FLUSH_BUFFERS 0xf849cb3a atapi.sys!0xf849cb3a
[...]
Consider the diagram in Figure 17-8, which illustrates how the TDL3 rootkit evades hook detection.
Figure 17-8: TDL3 evades IRP hook detection
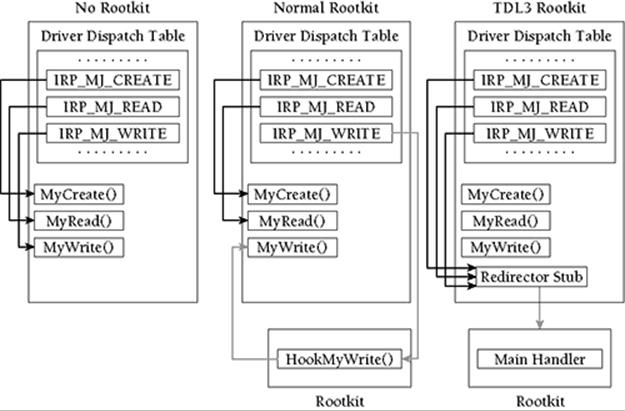
The diagram shows that normal rootkits overwrite IRP table entries and point them outside of the owning driver’s memory. TDL3, on the other hand, creates a small code block in the memory of the owning driver (atapi.sys in this case), which it uses as a launching point to jump to the rootkit code. In this scenario, the IRP functions still point inside atapi.sys, making it very difficult to determine if the driver has been compromised. One way to extend your defenses is by modifying the driverirp plug-in to disassemble the first few instructions of the destination address and determine if they lead to a location outside of the driver, in much the same way as the inline hook detection works (see Recipe 17-3).
2 http://www.rootkit.com/vault/fuzen_op/TCPIRPHook.zip
Recipe 17-6: Detecting SSDT Hooks
![]()
You can find supporting materials for this recipe on the companion DVD.
A System Service Descriptor Table (SSDT) contains pointers to kernel mode functions. In Recipe 17-4, we discussed how ntdll!NtWriteFile placed 0xED into the EAX register before issuing INT 2E to transfer control to KiSystemService. The 0xED value is an index into the SSDT where a pointer to the kernel mode version of NtWriteFile exists. Thus, the job of KiSystemService is to look up the value at that index. Even if you’re working on a newer system that uses MSRs (SYSENTER) instead of INT 2E instructions to cross the user-kernel boundary, both methods still lead to KiSystemService, which looks up the address of the requested kernel function in the SSDT.
The Role of the SSDT
The order of the functions in the SSDT, as well as the total number of functions in the SSDT, differs across operating system versions. Metasploit provides a handy call table reference3 that covers Windows NT SP3 through Vista. Also, note that there is more than one SSDT on every system. The first and most well-known SSDT stores native API functions provided by the kernel executive module (i.e., ntoskrnl.exe or ntkrnlpa.exe). The second SSDT, known as the shadow SSDT, stores GUI functions provided by win32k.sys. The other two SSDTs are unused by default.
Figure 17-9 shows the role that the SSDTs play in the system call dispatching procedure. Because the data structures are undocumented by Microsoft, the names of members such as ServiceTable and ServiceLimit might not be the same as other sources. However, the important part is that ServiceTable points to the array of functions and ServiceLimit specifies how many functions exist in the array.
Hooking and Hook Detection
To hook functions in the SSDT, you need two key pieces of information—the base address of the functions table in kernel memory (from ServiceTable) and the index of the function that you want to hook. There are several ways to find the functions table, but malware often calls MmGetSystemRoutineAddress (the kernel version of GetProcAddress) and locates the KeServiceDescriptorTablesymbol, which is exported by ntoskrnl.exe. Using WinDbg, you can see how resolving this symbol can help you locate the functions table:
kd> x nt!KeServiceDescriptorTable
8055a220 nt!KeServiceDescriptorTable
kd> dd 8055a220
8055a220 804e26a8 00000000 0000011c 80510088
8055a230 00000000 00000000 00000000 00000000
8055a240 00000000 00000000 00000000 00000000
8055a250 00000000 00000000 00000000 00000000
8055a260 00002710 bf80c339 00000000 00000000
8055a270 f824fa80 f822db60 821753b0 806fff40
8055a280 00000000 00000000 fffd9da6 ffffffff
8055a290 f0d47d66 01ca9f59 00000000 00000000
kd> dps 804e26a8
804e26a8 8058fdf3 nt!NtAcceptConnectPort
804e26ac 805756d8 nt!NtAccessCheck
804e26b0 80588d69 nt!NtAccessCheckAndAuditAlarm
804e26b4 8059112e nt!NtAccessCheckByType
804e26b8 8058ee53 nt!NtAccessCheckByTypeAndAuditAlarm
804e26bc 806380ec nt!NtAccessCheckByTypeResultList
[...]
According to the WinDbg output, the base address of the function table for the native API is 804e26a8 and it contains 11c (a hex value) number of entries. The index for NtAcceptConnectPort is 0, the index for NtAccessCheck is 1, and so on. All addresses in the native function table should point inside the kernel executive module. Likewise, all addresses in the GUI function table should point inside win32k.sys. Detecting SSDT hooks is simple in this regard because you can just check each of the 11c entries and determine if they point in the right memory range.
Figure 17-9: Diagram and layout of the SSDT
There is a catch, however. SSDTs are assigned on a per-thread basis. That means that each thread can be “looking” at a different SSDT, depending on the value in its ETHREAD.Tcb.ServiceTable member. For example, malware could create a copy of the native function table (the one we just looked at with WinDbg) with a few hooked functions and then overwrite theETHREAD.Tcb.ServiceTable value for a specific thread, or all threads in a specific process. In this case, many tools will fail to report SSDT hooks because they check only the original function table and do not check for any existing copies.
Brendan Dolan-Gavitt’s ssdt plug-in for Volatility works by enumerating all threads and building a unique list of SSDTs from the ETHREAD.Tcb.ServiceTable values. You can use the plug-in to print out the addresses for all entries in the table (or filter the ones that point inside ntoskrnl.exe and win32k.sys). This is a quick way to isolate the hooked functions. In the following example, we’re analyzing a memory dump infected with the BlackEnergy 24 trojan.
$ python volatility.py ssdt -f be2.bin | egrep -v '(ntoskrnl|win32k)'
Gathering all referenced SSDTs from KTHREADs...
Finding appropriate address space for tables...
SSDT[0] at 814561b0 with 284 entries
Entry 0x0041: 0x81731487 (NtDeleteValueKey) owned by 00000B9D
Entry 0x0047: 0x8173116b (NtEnumerateKey) owned by 00000B9D
Entry 0x0049: 0x81731267 (NtEnumerateValueKey) owned by 00000B9D
Entry 0x0077: 0x817310c3 (NtOpenKey) owned by 00000B9D
Entry 0x007a: 0x81730e93 (NtOpenProcess) owned by 00000B9D
Entry 0x0080: 0x81730f0b (NtOpenThread) owned by 00000B9D
Entry 0x0089: 0x81731617 (NtProtectVirtualMemory) owned by 00000B9D
Entry 0x00ad: 0x81730da0 (NtQuerySystemInformation) owned by 00000B9D
Entry 0x00ba: 0x8173156b (NtReadVirtualMemory) owned by 00000B9D
Entry 0x00d5: 0x81731070 (NtSetContextThread) owned by 00000B9D
Entry 0x00f7: 0x81731397 (NtSetValueKey) owned by 00000B9D
Entry 0x00fe: 0x8173101d (NtSuspendThread) owned by 00000B9D
Entry 0x0102: 0x81730fca (NtTerminateThread) owned by 00000B9D
Entry 0x0115: 0x817315c1 (NtWriteVirtualMemory) owned by 00000B9D
The output shows that BlackEnergy 2 hooks 14 different SSDT functions—mostly related to controlling access to the Registry, processes, and virtual memory. The rootkit loads a driver named 00000B9D.sys, which contains the functions that a thread would execute before (or in lieu of) the legitimate function. You can take your investigation even further by using thessdt_by_threads plug-in, which identifies which threads on a system are using an SSDT that has hooked functions. Using this plug-in, you can not only tell which SSDT functions are hooked, but you can tell exactly which threads in which processes are affected by the hooks!
$ python volatility.py ssdt_by_threads -f be2.bin
Gathering all referenced SSDTs from KTHREADs...
Finding appropriate address space for tables...
Unique SSDT: 0 80501030 11c 80552180
Unique SSDT: 1 bf997600 29b 80552140
Unique SSDT: 0 80501030 11c 80552140
Unique SSDT: 0 814561b0 11c 81740630
Unique SSDT: 0 81882980 11c 81414b40
Unique SSDT: 1 bf997600 29b 81740630
Number of total SSDTs: 6
Number of hooked SSDTs: 2
Printing SSDT by thread:
Pid Tid Name SSDT
4 8 System 80552180
4 c System 80552180
4 10 System 80552180
4 14 System 80552180
4 18 System 80552180
4 1c System 80552180
[...]
294 4e0 winlogon.exe 80552180
294 518 winlogon.exe 80552180
294 548 winlogon.exe 80552140
294 7c4 winlogon.exe 80552180
294 7c8 winlogon.exe 80552180
294 7cc winlogon.exe 80552180
294 7dc winlogon.exe 80552180
294 7e0 winlogon.exe 80552180
294 69c winlogon.exe 81414b40 [!]
294 784 winlogon.exe 81414b40 [!]
294 7ac winlogon.exe 81414b40 [!]
[...]
378 1ac svchost.exe 80552180
378 1b0 svchost.exe 80552180
378 5c0 svchost.exe 81414b40 [!]
378 6b4 svchost.exe 81414b40 [!]
378 71c svchost.exe 81414b40 [!]
3c4 3c8 svchost.exe 80552140
3c4 3cc svchost.exe 80552180
[...]
The exclamation marks in the right-hand column indicate that API calls made by the specified threads pass through an SSDT that has one or more hooked functions. How does BlackEngery 2 choose which threads to target and which threads to leave alone? Easy—it only targets threads that start after BlackEnergy 2 is installed. The majority of the threads on the system are using a clean SSDT, but that’s just because the memory dump was taken shortly after installing BlackEnergy 2. After a reboot, many more, if not all, of the threads will use an unclean SSDT. At this point, you can dump the 00000B9D.sys driver using the moddump command (see Recipe 16-9) or you can continue reading the next recipe about how to automate several actions at once.
3 http://www.metasploit.com/users/opcode/syscalls.html
4 http://www.secureworks.com/research/threats/blackenergy2/
Recipe 17-7: Automating Damn Near Everything with ssdt_ex
![]()
You can find supporting materials for this recipe on the companion DVD.
This recipe is a continuation of the previous discussion about SSDT hooks installed by BlackEnergy 2. Now that you know which functions BlackEnergy 2 hooks, you need to figure out why it hooks those functions. Based on the purpose of the hooked function, you can usually make a guess. For example, NtOpenKey opens a Registry key, so the rootkit probably hooks that function to prevent processes from reading or writing to a particular key. However, you do not want to top off your analysis with a guess. The ssdt_ex plug-in gives you the ability to perform static analysis (IDA Pro is required for this plug-in) of the rootkit driver after executing a single command:
$ python volatility.py ssdt_ex -f be2.bin
Behind the scenes, the ssdt_ex plug-in does the following:
· Generates a list of unique SSDTs (same as the ssdt plug-in)
· Records the names and addresses of any hooked SSDT functions
· Extracts the kernel drivers or memory segments that contain the rootkit code
· Rebuilds the IAT for extracted drivers
· Creates IDC code from the list of hooked function names and addresses that can be imported into IDA Pro
· Automatically creates an IDA database (IDB) from the extracted driver (using IDA’s command-line interface), and runs the IDC scripts
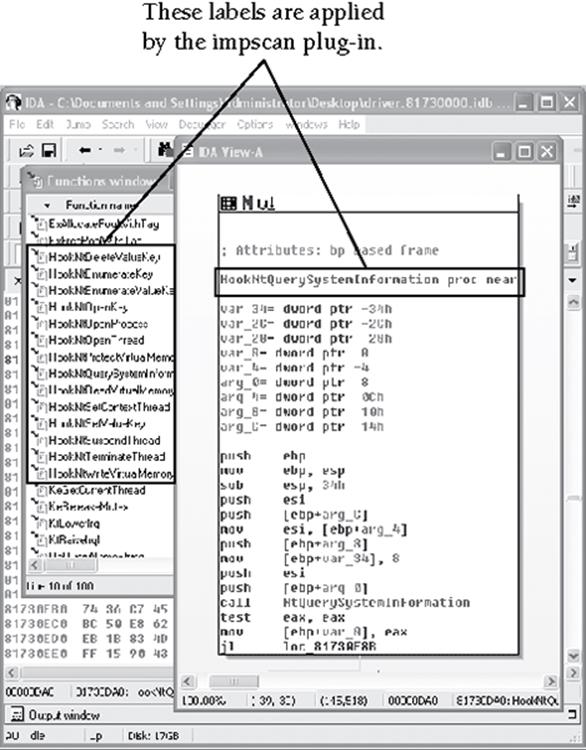
After running ssdt_ex, if the plug-in detected any hooks, you will have a dumped copy of the rootkit and a corresponding pre-labeled IDA database. As soon as you open the IDB, you can investigate every detail of the rootkit’s hooks. Figure 17-10 shows how the output appears—the 14 automatically labeled functions are preceded with the term “Hook” followed by the name of the API function that they replace.
Figure 17-10: ssdt_ex automatically labeled the IDB according to the rootkit’s hooks.
Recipe 17-8: Finding Rootkits with Detached Kernel Threads
![]()
You can find supporting materials for this recipe on the companion DVD.
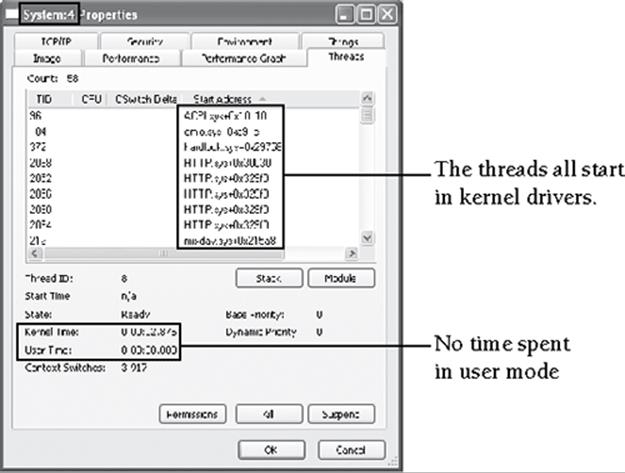
When kernel modules create new threads with PsCreateSystemThread, the System process (PID 4 on Windows XP and 7) becomes the owner of the thread. In other words, the System process is the default home for threads that start in kernel mode. You can explore this fact with Process Explorer and see that the starting addresses for threads owned by the System process are offsets into kernel modules such as ACPI.sys and HTTP.sys (see Figure 17-11). Note that although the System process runs in user mode, its threads spend all their time in kernel mode.
Figure 17-11: Examining the System process’s threads with Process Explorer
Hiding in the Kernel with Threads
Malware families such as Mebroot5 and Tigger6 attempt to hide their presence in the kernel. When the rootkit drivers initially load, they allocate a pool of kernel memory, copy executable code to the pool, and call PsCreateSystemThread to begin executing the new code block. Once the thread is created, the malware hides its driver by unlinking it from the loaded modules list (similar to unlinking DLLs—see Recipe 16-2) or by unloading the driver entirely. These actions help the rootkit remain stealthy because it survives off threads running from untagged pools of memory.
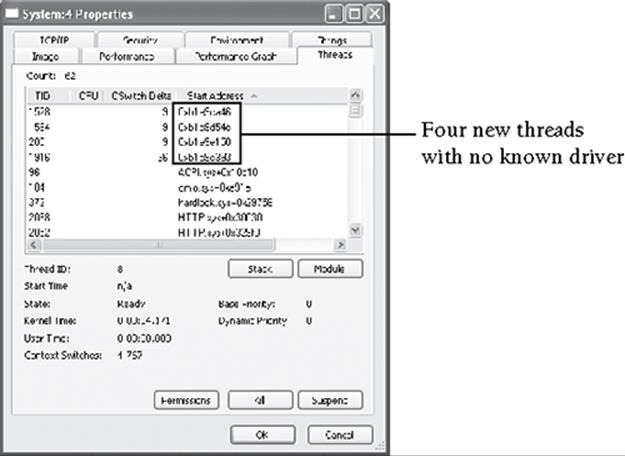
Figure 17-12 shows the threads owned by the System process of a machine infected with Tigger. You can see how there are four new threads that did not exist in Figure 17-11. Process Explorer just shows the thread’s start address instead of the normal format such as driverName.sys+0xabcd, because the start address does not fall within the memory range of any loaded drivers.
Detecting Detached Threads in Memory Dumps
The orphan_threads plug-in can identify attempts to hide in the described manner. The plug-in starts by enumerating loaded drivers, along with their base addresses and sizes. Then it scans for ETHREAD objects using the same pool scanner that the built-in Volatility command thrdscan2 uses. For each thread, it records the ETHREAD.StartAddress value and determines if the thread’s start address is within the range of a loaded driver. If the plug-in is not able to pair a thread with its owning driver, then it assumes the thread is detached or hidden.
Figure 17-12: The System process ends up owning Tigger’s kernel threads.
You can also configure the plug-in to calculate a safe range of memory based on the lowest and highest starting addresses of detached threads. It dumps the memory range so you can analyze the content for other clues. Here is an example of using the orphan_threads plug-in to detect Tigger:
$ python volatility.py orphan_threads -f tigger.bin
PID TID Offset StartAddress
------ ------ --------- ------------
4 248 0x2029da8 0xb1e9d54e
4 996 0x206fb90 0xb1e9e393
4 1372 0x2095700 0xb1e9ca46
4 564 0x209d3f8 0xb1e9e150
Thread memory range: 0xb1e9c000 - 0xb1e9f000 (0x3000 bytes)
Dumped thread memory range to dumped-b1e9c000.dmp
$ strings dumped-b1e9c000.dmp
KdSendPacket
[syringe]> error: 004
[syringe]> error: 005
KiFastSystemCallRet
get eproc
eproc=0x%.8x
attach
usermode mem alloc
copy memory
create thread
thread created
CMD_GET_DRV_PATH
CMD_INJ_DLL (%d)
CMD_HIDE_DISK_DATA
CMD_UNHIDE_DISK_DATA
CMD_BLOCK_FILE
CMD_UNBLOCK_FILE
CMD_HIDE_KD_MEMORY
CMD_UNHIDE_KD_MEMORY
CMD_DEINIT
CMD_KILL_PC
drv_base=0x%.8X drv_size=0x%.8X
Z:\Zorg\sys\objfre\i386\syringe.pdb
!This program cannot be run in DOS mode.
As shown in the output, the plug-in located the four hidden threads that you saw in Figure 17-12 and then dumped the memory around the threads’ starting addresses. By using the strings command, it is easy to see that there is malicious code executing in those threads. The plug-in’s ability to dump memory based on thread start addresses is mostly proof-of-concept at this point; however, it shows the type of investigative power that you can build into your tools. It is also worth noting that rootkits can easily bypass this detection technique by patching the ETHREAD.StartAddress values (once the threads have started) to point at a known driver. In their VB2008 presentation,7 Kimmo Kasslin and Elia Floria noted that the third generation of Mebroot started applying these patches to increase its stealth.
5 http://www2.gmer.net/mbr/
6 http://mnin.blogspot.com/2009/02/why-i-enjoyed-tiggersyzor.html
7 www.f-secure.com/weblog/archives/vb2008_kasslin_florio.pdf
Recipe 17-9: Identifying System-Wide Notification Routines
![]()
You can find supporting materials for this recipe on the companion DVD.
In the dynamic analysis chapter (in particular, Recipe 9-10), you learned how to use notification routines to monitor process, thread, and image load events. We also discussed the fact that malware installs notification routines to inject malicious DLLs into new processes or assign a hooked SSDT to new threads from the moment they are created. This recipe covers how to detect malicious notification routines in memory dumps with the notifyroutines Volatility plug-in.
Finding Out Where to Look
As a brief reminder of what you learned in Recipe 9-10, kernel drivers can install notification routines using the following API functions:
NTSTATUS PsSetCreateProcessNotifyRoutine(
IN PCREATE_PROCESS_NOTIFY_ROUTINE NotifyRoutine,
IN BOOLEAN Remove
);
NTSTATUS PsSetCreateThreadNotifyRoutine(
IN PCREATE_THREAD_NOTIFY_ROUTINE NotifyRoutine
);
NTSTATUS PsSetLoadImageNotifyRoutine(
IN PLOAD_IMAGE_NOTIFY_ROUTINE NotifyRoutine,
);
If you wanted to see what happens when a driver calls these API functions, you could open the module that exports them (ntoskrnl.exe) in IDA Pro and examine the code. Figure 17-13 shows a disassembly of the prologue for PsSetCreateProcessNotifyRoutine.
Figure 17-13: Disassembly of the PsSetCreateProcessNotifyRoutine API
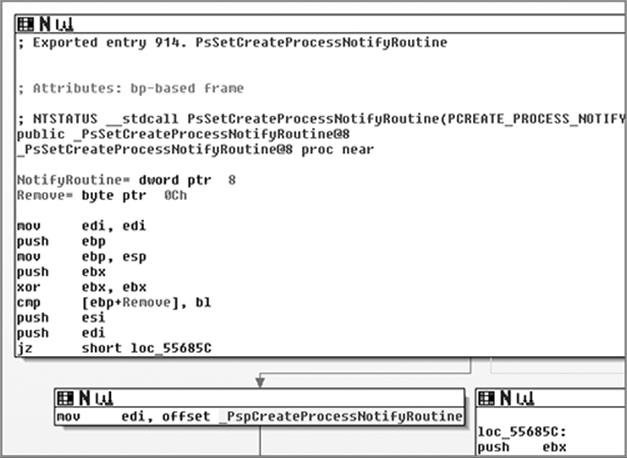
In the image, you can see that the API function references a global variable named _PspCreateProcessNotifyRoutine. The API functions for thread and load image events reference global variables named _PspCreateThreadNotifyRoutine and _PspLoadImageNotifyRoutine, respectively. Each variable represents an array, or structure, that can hold up to eight callback routines. For example, they might look like this in the Windows source code:
struct _PspCreateProcessNotifyRoutine {
PCREATE_PROCESS_NOTIFY_ROUTINE Routines[8];
};
struct _PspCreateThreadNotifyRoutine {
PCREATE_THREAD_NOTIFY_ROUTINE Routines[8];
};
struct _PspLoadImageNotifyRoutine {
PLOAD_IMAGE_NOTIFY_ROUTINE Routines[8];
};
Now you know where and how the kernel stores the addresses of any registered callback functions. In memory dumps, you can extract ntoskrnl.exe and parse its export table to find the three API functions. Then you can use a disassembler such as pydasm to find the instructions that reference the global variables. Once you have the address of the global variables, you simply determine if any of the eight slots are non-empty, in which case the slots would contain the address for a callback function. If the address does not point inside the driver for an antivirus program or monitoring tool (as we discussed in Recipe 9-10, Process Monitor also installs notification routines), then the registered callback is probably being used by a rootkit.
Using the notifyroutines Plug-in
You can use the notifyroutines plug-in for Volatility to automate the previously described steps. In the following example, the be2.bin memory dump is infected with BlackEnergy 2 (see the previous recipes for details on the malware). Take a look:
$ python volatility.py notifyroutines -f be2.bin
_PspCreateThreadNotifyRoutine: 0x805593a0
Entry[0]: 0xe1dbb6c0 => 0x81731ea7 (00000B9D)
Entry[1]: (NULL)
Entry[2]: (NULL)
Entry[3]: (NULL)
Entry[4]: (NULL)
Entry[5]: (NULL)
Entry[6]: (NULL)
Entry[7]: (NULL)
_PspCreateProcessNotifyRoutine: 0x805593e0
Entry[0]: (NULL)
Entry[1]: (NULL)
Entry[2]: (NULL)
Entry[3]: (NULL)
Entry[4]: (NULL)
Entry[5]: (NULL)
Entry[6]: (NULL)
Entry[7]: (NULL)
_PspLoadImageNotifyRoutine: 0x80559380
Entry[0]: (NULL)
Entry[1]: (NULL)
Entry[2]: (NULL)
Entry[3]: (NULL)
Entry[4]: (NULL)
Entry[5]: (NULL)
Entry[6]: (NULL)
Entry[7]: (NULL)
According to the output, there is one registered callback on the system. As a result, Windows will call the function at 0x81731ea7 (owned by driver 00000B9D.sys) any time a new thread is created. You might remember from Recipe 17-6 that BlackEnergy 2 hooks functions in the SSDT, but it only applies the hooked SSDT to threads that start after the rootkit loads. Guess how it knows exactly when threads are created throughout the system? That’s right—it uses notification routines.
Recipe 17-10: Locating Rogue Service Processes with svcscan
Service processes on Windows are usually non-interactive (they do not accept user input), run consistently in the background, and often run with higher privileges than most programs launched by users. Examples of services include the event logging service, the print spooler, the host firewall, and the Windows time daemon. Many antivirus products, including Microsoft’s own Windows Defender and Security Center, run as services.
The services.exe process that always seems to be running is the Service Control Manager (SCM). The SCM is responsible for making sure the registered services load in a particular order according to their dependencies; it also maintains information about the current state of services on the system (for example, if they are paused, running, stopped, and so on).
How Malware Abuses Services
Malware can abuse services in various ways. The first way that comes to mind is by stopping existing services. For example, some variants of Conficker stop the following services, so that it can operate more freely on the victim computer:
· Wscsvc (Windows Security Center Service)
· Wuauserv (Windows Automatic Update Service)
· BITS (Background Intelligent Transfer Service)
· WinDefend (Windows Defender Service)
· WerSvc (Windows Error Reporting Service)
There are several ways to stop a service. Two such methods include the use of the ControlService API function and dropping a batch file that contains commands like net stop SERVICENAME. Malware can also just use TerminateProcess, but that will not allow the service process to shut down cleanly or notify the SCM of the service’s new status.
Malware can also use services to load drivers into the kernel. Microsoft recommends using the CreateService and StartService API functions to load drivers because you can then easily unload the driver by calling ControlService with a stop signal. The one factor that deters malware authors from using this method is that it creates entries in the Registry, particularly in the HKLM\System\CurrentControlSet00x\Services key.
Obviously, for stealth reasons, leaving traces in the Registry is not good. However, once the service starts, the malware can delete its Registry entries to hide the fact that they ever existed. Without the corresponding Registry entries, users cannot stop the service with net stop or by using the Microsoft Management Console (MMC).
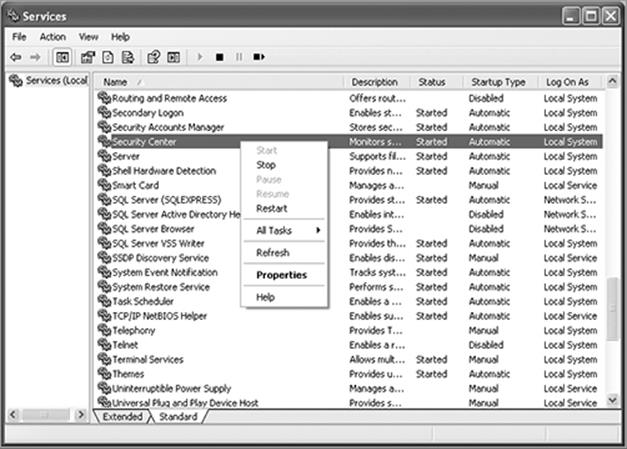
Figure 17-14 shows the MMC that you can use to investigate or control the services on a system. To bring it up, go to Start ⇒ Run and then type services.msc and press Enter.
Figure 17-14: Starting and stopping services from the MMC
The SCM’s Service Record Structures
If you encounter malware that creates a service and then deletes its Registry entries, how can you determine that it ever started a service in the first place? One method is to recover the event logs and see if there are any messages from the SCM about a newly started service. However, this assumes you have access to the event logs and that the malware did not use theClearEventLog API to remove that evidence as well. Another option is to scan the memory of services.exe looking for its service record database (see “How to Really, Really hide from the SC manager”8).
The SCM process maintains a doubly linked list of structures that contain information about running services. Even more useful, the structures contain a member at a fixed offset with a fixed value of sErv, which makes them easy to find. Unfortunately, Microsoft does not document these structures, so a few fields are subject to one’s own interpretation. Therefore, the format shown in the following code is not guaranteed to be accurate.
'_SERVICE_LIST_ENTRY' : [ 0x8, {
'Blink' : [ 0x0, ['pointer', ['_SERVICE_RECORD']]],
'Flink' : [ 0x4, ['pointer', ['_SERVICE_RECORD']]],
} ],
'_SERVICE_RECORD' : [ 0x70, {
'ServiceList' : [ 0x0, ['_SERVICE_LIST_ENTRY']],
'ServiceName' : [ 0x8, ['pointer', ['unsigned short']]],
'DisplayName' : [ 0xc, ['pointer', ['unsigned short']]],
'Order' : [ 0x10, ['int']],
'TagSignature' : [ 0x18, ['int']],
'FullServicePath' : [ 0x24, ['pointer', ['unsigned short']]],
'ServiceType' : [ 0x28, ['int']],
'CurrentState' : [ 0x2c, ['int']],
} ],
'_SERVICE_PATH' : [ 0x14, {
'ServicePath' : [ 0x8, ['pointer', ['unsigned short']]],
'ProcessId' : [ 0xc, ['int']],
} ],
The _SERVICE_RECORD structure contains several critical fields, such as the following:
· ServiceList: This doubly linked list connects one service structure to all other service structures. Compared with other doubly linked lists (such as processes and DLLs), this list uses a modified version of the standard _LIST_ENTRY structure that has the Flink and Blink values swapped.
· ServiceName: This member points to a Unicode string that contains the service name (such as “spooler” or “Security Center”).
· TagSignature: This member contains the fixed value of sErv that identifies service record structures.
· FullServicePath: This member can have different meanings depending on the type of service. If the service is for a file system driver or kernel driver, then the FullServicePath member points to a Unicode string containing the name of the driver object (for example, \Driver\Tcpip). If the service is for a Win32 process, then the FullServicePath member points to _SERVICE_PATHstructure that contains the full path on disk to the executable file and its current process ID if the service is running.
· ServiceType: This member identifies the service type. It is typically one of the following values:
SERVICE_TYPES = dict(
SERVICE_KERNEL_DRIVER = 0x01,
SERVICE_FILE_SYSTEM_DRIVER = 0x02,
SERVICE_WIN32_OWN_PROCESS = 0x10,
SERVICE_WIN32_SHARE_PROCESS = 0x20,
SERVICE_INTERACTIVE_PROCESS = 0x100,
)
· CurrentState: This member identifies the service’s current state. It is typically one of the following values:
SERVICE_STATES = dict(
SERVICE_STOPPED = 0x01,
SERVICE_START_PENDING = 0x02,
SERVICE_STOP_PENDING = 0x3,
SERVICE_RUNNING = 0x4,
SERVICE_CONTINUE_PENDING = 0x5,
SERVICE_PAUSE_PENDING = 0x6,
SERVICE_PAUSED = 0x7,
)
Enumerating Services in Process Memory
There are a few ways to enumerate services by parsing process memory. A programmer named EiNSTeiN_ wrote a tool called Hidden Service Detector (hsd), which runs on live Windows systems. It works by scanning the memory of services.exe for PServiceRecordListHead—a symbol that points to the beginning of the doubly linked list of _SERVICE_RECORD structures. In particular, hsd scans services.exe for the pattern of bytes that make up the following instructions:
// WinXP, Win2k3
56 8B 35 xx xx xx xx = MOV ESI, DWORD PTR DS:[PServiceRecordListHead]
// Win2k
8B 0D xx xx xx xx = MOV ECX, DWORD PTR DS:[PServiceRecordListHead]
This is an interesting method, but like other linked lists, malware can unlink entries to hide running services. In fact, the Blazgel trojan does exactly that, as described next.
The Case of Blazgel
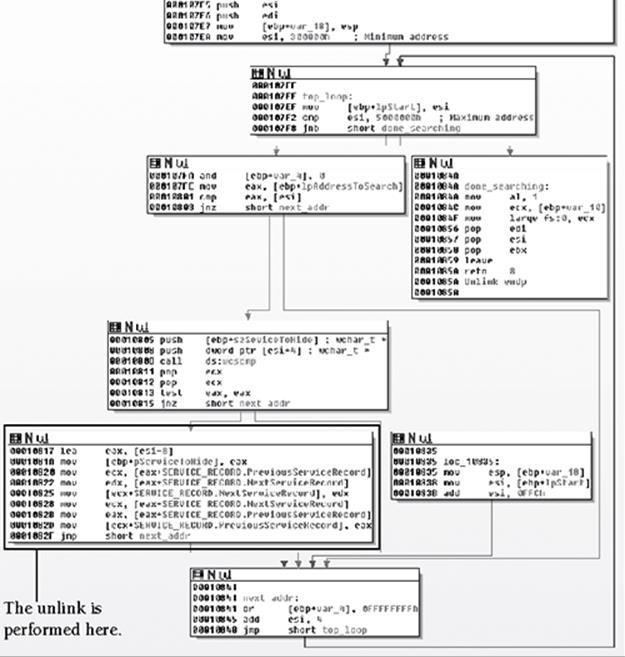
The Blazgel trojan9 scans the memory of services.exe from 0x300000 to 0x5000000 in search of the name of the service to hide. Figure 17-15 shows a disassembly of the trojan’s kernel driver that performs the malicious unlinking. When it finds a positive match, it subtracts 8 (see the lea eax, [esi-8] instruction) because the ServiceName member is at offset 8 of the _SERVICE_RECORDstructure. This gives the trojan a pointer to the base address of the _SERVICE_RECORD structure. Next, it overwrites the Flink and Blink values, which effectively makes the service “disappear” from all service listings. Users can no longer use the EnumServices API function or type sc query into a command shell to get information about the hidden service.
Figure 17-15: The Blazgel Trojan hides services by unlinking them.
Using the svcscan Volatility Plug-in
You can use the Volatility plug-in called svcscan to find unlinked services in memory dumps. The plug-in works by finding all occurrences of sErv in the addressable memory space of services.exe. It applies a few sanity checks to ensure that each instance of sErv is, in fact, the TagSignature member of a _SERVICE_RECORD structure and not just a false positive. Using svcscan, you can enumerate service processes from a memory dump, even if the malware deleted Registry entries, cleared the event log, and unlinked the list structures. You can use it in the following manner:
$ python volatility.py svcscan –f memory.bin
[...]
Order: 0x8f
Service Name: ProtectedStorage (Protected Storage)
Service Path: C:\WINDOWS\system32\lsass.exe
Process ID: 716
Current State: SERVICE_RUNNING
Service Type: SERVICE_WIN32_SHARE_PROCESS|SERVICE_INTERACTIVE_PROCESS
Order: 0x90
Service Name: PSched (QoS Packet Scheduler)
Service Path: \Driver\PSched
Process ID:
Current State: SERVICE_RUNNING
Service Type: SERVICE_KERNEL_DRIVER
[...]
The textual output is useful for searching by key terms to see if particular services are running. However, if you pass the --output=dot flag to svcscan, then it will print the doubly linked list in a dot graph form that you can visualize. In the next example, you learn how to apply all this service-related information into an investigative scenario.
Consider a system that runs the Windows Security Center service. You can get details about the service by typing sc query wscsvc on the command line:
C:\>sc query wscsvc
SERVICE_NAME: wscsvc
TYPE : 20 WIN32_SHARE_PROCESS
STATE : 4 RUNNING
(STOPPABLE,NOT_PAUSABLE,ACCEPTS_SHUTDOWN)
WIN32_EXIT_CODE : 0 (0x0)
SERVICE_EXIT_CODE : 0 (0x0)
CHECKPOINT : 0x0
WAIT_HINT : 0x0
As you can see, the service is running. Now stop the service with net stop and then re-query for the service’s status. You should see that it is in the stopped state.
C:\>net stop wscsvc
The Security Center service is stopping.
The Security Center service was stopped successfully.
C:\>sc query wscsvc
SERVICE_NAME: wscsvc
TYPE : 20 WIN32_SHARE_PROCESS
STATE : 1 STOPPED
(NOT_STOPPABLE,NOT_PAUSABLE,IGNORES_SHUTDOWN)
WIN32_EXIT_CODE : 0 (0x0)
SERVICE_EXIT_CODE : 0 (0x0)
CHECKPOINT : 0x0
WAIT_HINT : 0x0
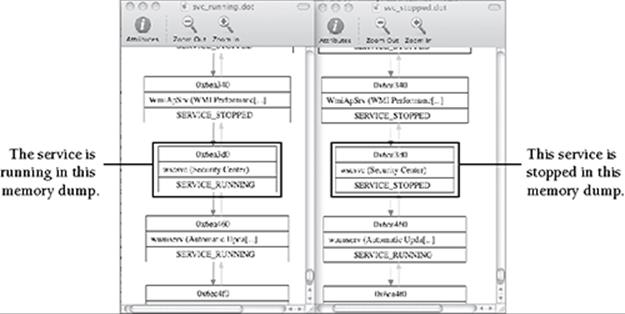
Figure 17-16 shows how the output of svcscan appears (using the Graphviz dot format) when the wscsvc service is in the running and stopped states. In both cases, wscsvc sits between WmiApSrv and wuauserv in the doubly linked list.
Figure 17-16: The wscsvc service in a running and stopped state
Now, to simulate what would happen when malware hides a service, you can use a proof-of-concept program to perform the unlinking. The following output shows that immediately after unlinking wscsvc, the sc query command produces an error.
C:\>UnlinkServiceRecord.exe wscsvc
[!] Service to hide: wscsvc
[!] SCM Process ID: 0x28c
[!] Found PsServiceRecordListHead at 0x6e1e90
[!] Found a matching SERVICE_RECORD structure at 0x6ea3d0!
C:\>sc query wscsvc
[SC] EnumQueryServicesStatus:OpenService FAILED 1060:
The specified service does not exist as an installed service.
Because wscsvc is unlinked from the list, it does not show up in the sc query output, the MMC list, or the list of running services produced by third-party applications such as GMER and Process Hacker. However, as shown in Figure 17-17, the _SERVICE_RECORD structure for wscsvc still exists in the memory of services.exe. Furthermore, the Flink and Blink values for wscsvc still point to WmiApSrv and wuauserv, but nothing points to wscsvc, thus isolating it from the linked list.
Figure 17-17: The wscsvc service has been unlinked from the list.
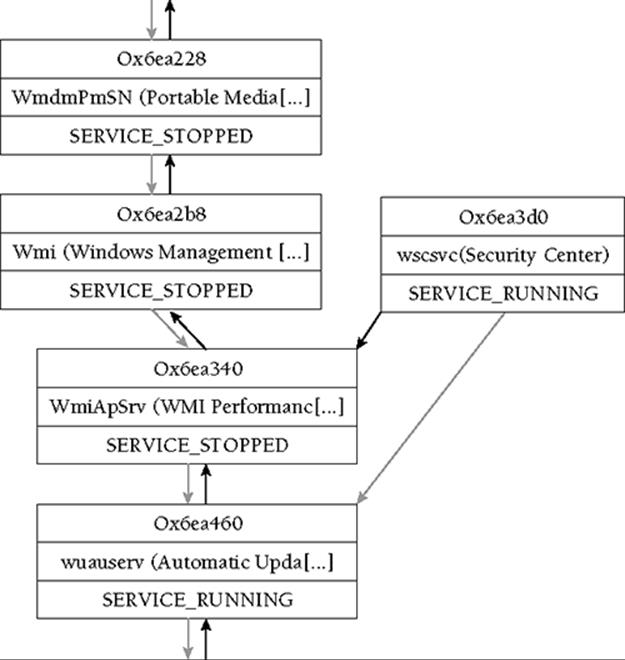
You can take a few important facts away from this discussion about hidden services. First, a service remains in the doubly linked list even when it is in the stopped state. Second, a service process remains active even when a malicious program unlinks its _SERVICE_RECORD structure.
8 http://www.rootkit.com/newsread.php?newsid=419
9 http://www.threatexpert.com/threats/backdoor-win32-blazgel.html
Recipe 17-11: Scanning for Mutex Objects with mutantscan
![]()
You can find supporting materials for this recipe on the companion DVD.
Applications can create mutexes (short for mutual exclusion) to avoid the simultaneous use of a common resource. For example, one thread might create a mutex before it opens a particular file for writing. Other threads in the same process or within another process on the system would check if the mutex exists before opening the file for reading. Clearly, it could cause problems if one thread attempts to read from a file at the same time another thread writes to the file. The Windows Object Manager ensures that only one thread owns a given mutex at any particular time.
How Malware Uses Mutexes
Many malware families use mutexes to mark their presence on a system. The point is to prevent multiple copies of the same trojan family from running simultaneously on the same machine. In these cases, the malware author either programs the mutex name into each variant, or programs the malware to generate a machine-specific mutex name based on some combination of variables (for example, the logged-in user’s name, computer name, IP address, or volume serial number, to name a few).
As with other objects, you should get familiar with the mutexes that legitimate applications create so that it is easier to spot suspicious ones. Be warned, however, that mutex names just need to be unique; they do not need to make sense or even describe their purpose—and this makes it difficult to distinguish legitimate ones from malicious ones. You can use Andreas Schuster’s mutantscan plug-in for Volatility to list the mutexes that exist on a system. If you supply the -s (silent) flag, then the plug-in prints only named mutexes (un-named mutexes are only accessible by threads within the same process, so they are less suspicious).
$ python volatility.py mutantscan -f zeus.vmem –s
Phys.Addr. #Ptr #Hnd Signal Thread Name
0x0165eb28 2 1 1 0x00000000 03B2757801C91950000005D02
0x01714808 2 1 1 0x00000000 047D1D5A01C91950000006E82
0x01756560 2 1 1 0x00000000 04CBCAF401C91950000006FC2
0x0175d008 2 1 1 0x00000000 01E3ED4401C91950000002E42
0x017730a8 2 1 1 0x00000000 02A2A96401C91950000003CC2
0x018b6c58 2 1 1 0x00000000 __SYSTEM__7F4523E5__
[...]
The output shows the first six out of about 100 mutexes that were active on the system. As previously mentioned, the names do not need to describe their purpose, thus making all of the shown mutexes suspicious to the untrained eye. The last entry in bold, however, should jump out at anyone familiar with the Zeus family of malware because many variants use a mutex that begins with __SYSTEM__ (or _AVIRA_). Table 17-1 shows some common mutex names, just to give you an idea of how they can differ between malware families:
Table 17-1: Examples of Mutex Names
|
Mutex name |
Malware Family |
|
_AVIRA_[chars] or __SYSTEM__[chars] |
Zeus |
|
svchost_test_started |
TDL3 |
|
Flameddos |
Bifrost |
|
__b4ng__b4ng__38 |
Tigger |
|
Jo1ezdsl |
Bankpatch.C |
|
Op1mutx9 or Ap1mutx7 and *exeM_* |
Sality |
|
Jhdheddfffffhjk5trh |
Allaple |
|
1337bot |
Spybot |
|
Rootz |
Sdbot |
As you can see, some malware families use mutex names that are rather obnoxious and easy to spot. You will not always get that lucky, but nonetheless it would not hurt to start making a list of mutexes that you see malware using. In fact, that is the whole idea behind the general-purpose artifact database that you created in Recipe 4-12. Just to refresh your memory and show a practical scenario, you can follow these steps:
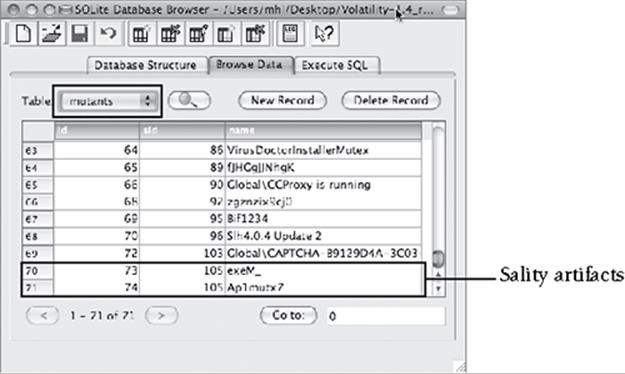
1. As you conduct investigations and find patterns among mutex names, add the mutex names to your artifact database. For example, based on Table 17-1, you can see that variants of Sality will create a mutex such as Op1mutx9 or Ap1mutx7. Sality also creates one mutex for each process on the system named in the format [PROCESS]exeM_[PID]_. The PROCESS and PID fields vary per process, but the exeM_ part is consistent. Thus, you can add these criteria to your database, as shown in Figure 17-18.
Figure 17-18: Adding mutexes to your artifact database
2. Pass your database to a Volatility command and have it automatically highlight mutexes in the memory dump that are also in your database. This is a quick, re-usable method to associate artifacts with samples that you’ve analyzed in the past and to cut down on the repetitive manual procedure of sifting through hundreds of mutexes on a system. The command below shows an example of using the mutantscandb plug-in for Volatility 1.4. Figure 17-19 shows the results.
$ python volatility.py mutantscandb -f sality.vmem --silent
--output=html --output-file=mutants.html
--database=artifacts.db
Figure 17-19: Using Volatility with your artifact database
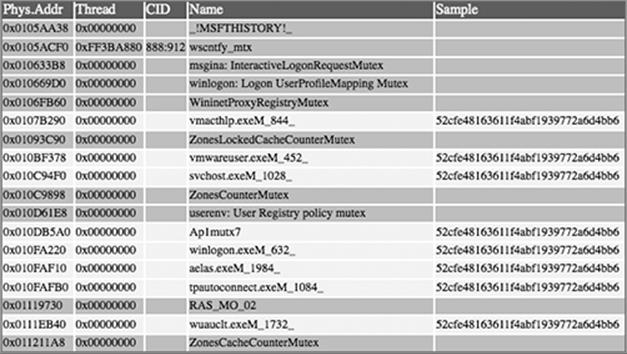
As you can see, the mutantscandb plug-in highlighted the Ap1mutx7 mutex and all of the process-specific mutexes. It also prints a column containing the MD5 hash of the sample that created the artifacts as a reference. There are many other uses for using an artifact database with Volatility, including highlighting suspicious file handles, Registry keys, network sockets, kernel drivers, and so on. You may have to put in a bit of work initially to build the plug-ins that you desire (if they don’t already exist), but you’ll continue to benefit from using the plug-ins well into the future.
All materials on the site are licensed Creative Commons Attribution-Sharealike 3.0 Unported CC BY-SA 3.0 & GNU Free Documentation License (GFDL)
If you are the copyright holder of any material contained on our site and intend to remove it, please contact our site administrator for approval.
© 2016-2026 All site design rights belong to S.Y.A.