Blender For Dummies (2015)
Part V
The Part of Tens

 Visit www.dummies.com for great Dummies content online.
In this part . . .
· Solutions for common problems.
· Tips for working more effectively.
· Resources for Blender users.
· Visit www.dummies.com for great Dummies content online.
Chapter 16
Ten Problems (and Solutions) for Newbies
In This Chapter
![]() Identifying common problems for new users
Identifying common problems for new users
![]() Finding solutions
Finding solutions
The community forums and Web pages for Blender are brimming with questions from new users. Many of them are the same question, or derivatives of the same question. The purpose of this chapter is to identify some of the most common ones and give you solutions to them so that you don’t have to dig through these websites (unless you really, really want to).
Blender’s Interface Is Weird or Glitchy
Blender uses OpenGL, an accelerated 3D programming library, for its entire interface. Because of the extensive use of OpenGL (and some rather old versions of it), Blender often uses parts of the library that other programs may never touch. Depending what video card you have in your computer, the drivers for that card may not effectively implement these little-used library features that Blender needs.
On some machines, Blender may run very slowly, or you may see weird screen glitches around the mouse pointer or menus. The first thing to check is the drivers for your video card. Go to the website for the manufacturer of your video card to see whether any updates are available.
 You may want to turn off any fancy effects that your operating system adds, such as transparent windows, shadows on the mouse cursor, or 3D desktop effects. Because all these little bits of eye candy tend to be hardware accelerated, they may be conflicting with Blender a bit. At the very least, turning them off usually makes your computer use fewer resources like processor power and memory, thereby making more of those resources available to Blender. If you’re using an NVIDIA video card, make sure that the Flipping check box in your OpenGL settings isn’t enabled and that full-screen anti-aliasing is disabled.
Within Blender itself, go to the System section in User Preferences (Ctrl+Alt+U) and find the Window Draw Method drop-down menu in the center column. The default setting is Automatic, which normally works pretty well. However, on some Intel-based and ATI-based video cards, you may have better luck manually changing this menu to Overlap or Overlap Flip. Play with the different options here to see which one works best for you. Blender updates immediately when you make the change, so you don’t need to restart anything.
A Notorious Black Stripe Appears on Models
Often when modeling, you run into a situation where a strange black crease goes along some edges. The stripe is usually most apparent when modeling with the Subdivision Surface modifier turned on and you're looking at your mesh in Solid viewport shading. What’s happening here is that the normals for one of the faces adjoining this edge are pointing the wrong direction.
Usually, the quickest way to fix this problem is to have Blender recalculate the normals for the model and attempt to have them all face outside. To do so, go into Edit mode, select all, and press Ctrl+N. Typically, pressing Ctrl+N alleviates all issues. If it doesn’t, however, you may have to go in and manually flip the normals yourself. Manual flipping of normals is easiest to do from Face Select mode with face normals visible. To make face normals visible, enable the Face toggle (its button shows a cube with a highlighted face) under the Normals label in the Mesh Display panel of the Properties region of the 3D View (N). With that set, a cyan line points out from all faces in the direction of their normals. Now you can see which normals are pointing the wrong way. From there, select the offending faces and press W⇒Flip Normals.
If that still doesn’t solve your problem, it could mean that you have multiple vertices in the same place, or you have faces inside your mesh. You can fix multiple vertices by pressing W⇒Remove Doubles. Internal faces are harder to auto-detect, but if you view your mesh in Wireframe viewport shading (Z), it may be more apparent. You can also use the Select Non Manifold operator (Shift+Ctrl+Alt+M) to help find internal faces.
Objects Go Missing
Occasionally, you might run into a problem where not everything shows up in your 3D View, even though you’re positive you didn’t delete anything. The first thing to do is to make sure that nothing is hidden. Pressing H in the 3D View hides whatever you’ve selected, and it’s easy to accidentally hit it when you’re actually trying to press G and grab an object. Fortunately, you can unhide all hidden objects pretty quickly by pressing Alt+H. You can also look in the restrict columns on the right side of the Outliner. If your object is hidden, the first icon — the eye icon — appears closed. Left-clicking the eye icon unhides it. The camera icon on the far right controls whether your object is visible when rendering.
If you’re sure that nothing is hidden, next try to make all layers visible and check to be sure that you didn’t inadvertently move your object to a different layer. You do so by pressing the Tilde (~) key. You may also want to press Home in the 3D View to bring all objects into view.
One last thing to check is whether you’re in Local View, the view that isolates all objects except for a few that you select. The hotkey that toggles this view is Numpad Slash (/), and it can be pretty easy to accidentally hit it when using the numeric keypad to change views. One quick way to tell whether you’re in Local View is to look at the header for the 3D View. If no layer buttons are where they’re supposed to be, you may be in Local View. In the upper left corner of the 3D View, text also tells you how you’re viewing your scene. If you’re in Local View, (Local) appears as the last part of that text.
If none of these things work, there actually is the chance that you deleted your object by accident. Fortunately, if you haven’t closed your file, you can recover from this mistake as well. See, when you delete an object in Blender, it doesn’t actually get completely deleted until you close the file or open a new file, so it still exists in Blender’s internal database for this file.
I’m writing the next few steps under the assumption that your object was a Mesh, but the same technique works for curves, text, and other types of objects. To recover a deleted object, use the following steps:
1. Create a dummy object that’s the same type as the one you’re trying to recover.
For meshes, use any of the options in Shift+A⇒Mesh.
2. Bring up that object’s Mesh Properties and look in the Context panel at the top; in the datablock, left-click the button on the left side.
You see a list of all the objects in the scene that share the current selected object’s type. Anything you delete has an empty circle to the left of it. Figure 16-1 shows what this screen might look like.
3. If your deleted object is in this list, select it and the dummy object you added in the first step is instantly replaced with the mesh for your deleted object.
Neat, huh?
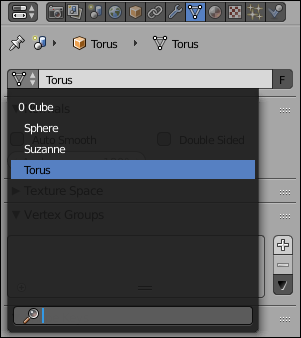
Figure 16-1: Deleted objects in the datablock at the top of Mesh Properties.
Edge Loop Select Doesn’t Work
The issue of Edge Loop Select not working happens the most on Linux machines. The Blender hotkey for doing a loop selection in Edit mode is Alt+right-click. Unfortunately, in Gnome 2 and a few other window managers, this key sequence pops up a menu for controlling the window.
You can fix this issue in two ways. The easiest one is to use Shift+Alt+right-click. You typically use this combination to select multiple loops, but if nothing is selected, it works exactly the same as the Alt+right-click combination.
Of course, that’s a bit of a kludge. A better solution is to modify the window manager’s settings and bind the function that it ties to the Alt key to another key, like the infamous “super” or Windows key that most modern keyboards have. Because the method varies from one window manager to another, you'll need to consult the documentation on your window manager to see the exact steps on how to do this.
A Background Image Disappears
When using a photographic or drawn reference to base your models on, it’s a common practice to load the reference image in the background of the 3D View (see Chapter 5). However, when working this way, you may orbit your view to do a spot-check and then when you return to side (or front or top or camera and so on) view, the background image may disappear, even though the Background Images panel in the 3D View’s Properties region says it’s still there.
The answer here is that you’re viewing the scene through Perspective view rather than the Orthographic one. Blender doesn’t show the background reference image in Perspective view. Switch back to Orthographic by pressing Numpad 5. It makes sense to use Orthographic for reference images because a Perspective view introduces distortion and scaling to the way the scene is viewed, so it wouldn’t be a good idea to model from reference in this type of view even if you could. The Orthographic view is much more effective at getting a model to match a reference image.
Alternatively, you could an Empty with Image set as its display type. This ensures that your reference image is visible at all times and from all angles.
Zooming Has Its Limits
When working in Perspective view, you may notice that occasionally you can’t zoom in on your scene as much as you’d like. This limitation is because you’re zooming toward a center point, and you’re very near it. You can take advantage of four workarounds:
· Place the 3D cursor at the location you’d like to zoom to and press Ctrl+Numpad Dot (.). This workaround centers the view on the 3D cursor and gives you a clearer target to zoom in on.
· Select the object (or sub-object element, like a vertex or edge in Edit mode) that you want to zoom in on and press Numpad Dot (.). This workaround centers the view on that selection so that you can now use that as your zoom target.
· Try popping quickly into Orthographic view by pressing Numpad 5. Because Orthographic view has no perspective distortion, the way it zooms is somewhat different, which may give you a better angle.
The only downside to this method is that you can't get a view from inside your mesh, if that's something you want.
· Enable the Auto Depth check box in the Interface section of User Preferences (Ctrl+Alt+U). Enabling this option tells Blender to dynamically change the point you’re zooming in and avoid this problem altogether.
Lost Simulation Data
As mentioned in Chapter 13, Blender saves some simulation data to your hard drive. Unfortunately, if that simulation data isn’t where Blender expects it to be, your simulation won't show up in your .blend file. Generally, lost simulation data happens for one of three reasons:
· You work on more than one computer. If you work in Blender on more than one machine and only copy the .blend file between the two, the simulation data isn’t where it needs to be on the second computer. You need to copy that simulation data to the same place relative to your .blend file on the second computer for it to show up properly.
· You accidentally changed or deleted the path to the simulation data. This reason isn’t common, but it does happen. Fortunately, the fix is simple for fluid simulations. Select the domain object for your fluid simulation and go to Physics Properties. In the Fluid panel, the path to your simulation data is the last field. Enter the proper path here or left-click the folder icon to the right of the field and find the proper directory with the File Browser.
· You’re using the /tmp directory for your simulations. Initially, using /tmp doesn’t seem like that big of a deal. However, on some operating systems, the /tmp directory is periodically purged, deleting everything in it. If that directory gets purged, your simulation won’t show up and your only option is to rebake it.
Using /tmp all the time also has another nasty side effect: Different .blend files overwrite the simulation data that’s in there. So you may run into a situation where you open one .blend with a fluid simulation only to see the simulation results from another file. Again, the only solution in this case is to rebake your simulation. This time, however, set the path somewhere else so this doesn’t happen again.
Objects Don't Appear When Rendering
Sometimes, when you render, you might notice that some objects are perfectly visible in the 3D View, but they don't show up in your render. There are a few reasons that this may happen:
· Camera clipping: Just like with Spot lamps, as described in Chapter 9, cameras have a clipping distance (a range of visible area with a start and an end). The default clipping distance for the 3D View goes from 0.1 to 5000. However, the default camera only has a clipping distance from 0.1 to 100. This means that an object that's 101 Blender units away will show up in the 3D View, but it may not appear when you render.
The fix for this is to either change the position of the object that's too far away or increase the end clipping distance for your camera object (Camera Properties⇒Lens⇒Clipping).
· Restricted rendering: Blender's Outliner gives you the ability to restrict (disable) rendering for specific objects. While this can be useful for animation purposes, it isn't difficult to forget that you've made that toggle.
Fortunately, the fix is easy. Go to the Outliner, find your object, and re-enable renderability on it by left-clicking the rightmost icon next to it (the icon looks like a camera).
· Non-rendered layers: Render layers are an incredibly powerful tool for compositing. However, with that power comes the need to be more fastidious in how you manage your scene. It's very possible to disable a scene layer from being used in a render layer. The result is the functional equivalent of enabling restricted rendering on every object in that scene layer.
To fix this issue, go to Render Layers Properties and double-check the scene layers that you have assigned to your render layers. If you know which layers an object is on, you should be able to ensure those layers are enabled.
No GPU Rendering for Cycles
One of the biggest appeals for using Cycles as a renderer is its ability to leverage your video card's GPU to speed up calculations (and, by extension, the overall rendering process). Unfortunately, depending on your computer hardware, you may not be able to take advantage of this speed boost. The first thing to check is whether you're currently using GPU computing at all. If you're using Cycles (by picking Cycles Render from the Engine drop-down menu in the Info editor's header), look at the Render panel in Render Properties. There should be a drop-down menu there labeled Device and it should be set to GPU Compute. If it's set to CPU or that drop-down menu isn't there, that's the first sign that you aren't using your GPU for rendering with Cycles.
Your next step is to look at the System section of User Preferences (Ctrl+Alt+U). At the bottom of the leftmost column is a little section labeled Compute Device. The first set of radio buttons beneath that should give you the options of None, CUDA, or OpenCL. You want to pick CUDA (currently, that's the only one where Cycles' GPU computing works reliably). CUDA is a GPU computing technology developed by NVIDIA to run on their cards. Cycles uses CUDA for its GPU computing features. This, of course, means that Cycles currently is limited to only working on relatively modern NVIDIA video cards. Once you pick CUDA, you should be able to pick your specific video card from the drop-down menu below those radio buttons.
If you don't have CUDA as an option, you may be in one of small handful of scenarios:
· You don't have an NVIDIA video card. If this is the case, your only options are to either stick with CPU-only rendering or get a new video card.
· You have an NVIDIA video card, but its CUDA support is too old. Again, your only options in this case are to stick with CPU rendering or upgrade your video card.
· You have an NVIDIA video card, but you haven't fully installed drivers and CUDA support. Consult the documentation for your specific operating system on how to properly update your drivers and enable CUDA support. After you do that (and go through the start/restart dances that your operating system requires), you should be able to fire up Blender and enable GPU-accelerated rendering in Cycles using CUDA.
Funky Deformations in Animation Rigs
This isn't necessarily specific to animation rigs, but animation rigs are where you most often see it. The effect is easy to recognize. You'll have a mesh set up to be controlled by an armature, for example; when you grab or rotate any of the bones, the mesh stretches, skews, and scales wildly, like it isn't even really being controlled by the armature at all.
A few different things may cause this behavior, and it may happen any time you add a deforming modifier (such as Armature, Curve, Lattice, or Mesh Deform) or nearly any constraint to an object. If this is happening to you, check for these red flags:
· Non-applied transformations.
It's possible that you grabbed, rotated, or scaled your mesh (or worse, your armature) in Object mode prior to adding the modifier or constraint. This might not seem like a big deal, but the problem is that modifiers and constraints tend to operate on the original data (the Edit mode data). If you change the location, orientation, or size of that data in Object mode, the modifier or constraint doesn't have a valid frame of reference.
The remedy for this is to apply your transforms (Ctrl+A) or back them — particularly scale and rotation — out to base values (1,1,1 for scale and 0,0,0 for rotation).
· Doubled-up modifiers.
You can run into this problem with the Armature modifier in particular. It sometimes occurs when you use the parenting shortcut for adding an Armature modifier to a mesh (Ctrl+P⇒Armature Deform). If you aren't careful, you could be adding multiple Armature modifiers, each one adding to the influence of the previous one. This results in an effect where you rotate a bone and the mesh ends up moving twice as far as it should.
Fortunately, the fix for this is easy. Check your Modifier Properties and make sure you haven't doubled up.
· Cyclic dependencies.
This one is probably the most difficult to track down. You may have a situation where a bone in your armature is influencing the location of a hook that, in turn, is the parent of the armature object. Cyclic dependencies like this one can be very difficult to track down, but they're a sure way for a rig to go haywire in all kinds of interesting ways. Blender does its best to advise you of potential cycles by printing warnings to the system console (this is why it's wise to rig with a version of Blender that's launched from the terminal), but it currently can't catch everything.
A good test for cyclic dependencies is to grab (G) a control and move it around, then cancel that operation (right-click). If you have a cyclic dependency, not everything will snap back to its previous position. If you see this happening in a rig of yours, you'll need to sit down and meticulously work your way through the rig to suss out the source of the problem.
All materials on the site are licensed Creative Commons Attribution-Sharealike 3.0 Unported CC BY-SA 3.0 & GNU Free Documentation License (GFDL)
If you are the copyright holder of any material contained on our site and intend to remove it, please contact our site administrator for approval.
© 2016-2026 All site design rights belong to S.Y.A.