Customer Analytics For Dummies (2015)
Part III
Analytics for the Customer Journey
Chapter 12
Measuring Customer Loyalty
In This Chapter
![]() Tooling up to measure loyalty
Tooling up to measure loyalty
![]() Estimating future growth
Estimating future growth
![]() Measuring with the Net Promoter Score
Measuring with the Net Promoter Score
![]() Assembling the key drivers of customer loyalty
Assembling the key drivers of customer loyalty
Do you find yourself buying the same products over and over again? Do you have a preferred airline? The last time you chose a new computer, did you ask a friend for a recommendation?
Consumer decisions are heavily based on prior experience and on the experience of friends and colleagues. A once happy customer is likely to be a customer again and to recommend a specific company to the people around him.
If a friend or family member helps you when in need, you are happy to reciprocate. You may feel a sense of duty, a sense of loyalty to people who have been there for you. The emotions that cement a customer’s relationship with a company are similar. If the computer you purchased four years ago met or exceeded your expectations and customer service was outstanding, you’ll purchase a similar model again. When a friend asks what computer you have, you’re happy to recommend it. When you rent a car and the car is clean, the price is fair, and the pick-up and drop-off experiences are easy and quick, you’re much more likely to use the same rental car company in the future.
In this chapter, I help you understand the importance of customer loyalty and explain common ways of measuring it. I also introduce methods for identifying what makes customers more likely to recommend a company’s products or services.
Measuring Customer Loyalty
Understanding how to measure customer loyalty is an essential first step in predicting the potential future growth or decline of a product, service, or company.
The “best” metric for measuring customer loyalty depends on the industry, company, and type of product or service. Two that are applicable to most products and industries are the repurchase rate and the likelihood to recommend.
Repurchase rate
Probably the first way to gauge customer loyalty is to compute the percentage of customers who are repurchasing, reusing, or returning to a product or service. This data can be collected from past sales or from surveying customers about their past or future intent. Data can also be obtained from historical purchasing records, which are often captured in Customer Relationship Management (CRM) systems.
Valuing customer loyalty
Loyal customers are more likely to repurchase, reuse, and say good things about their experience to their friends and colleagues. Products, websites, software, and services that have more loyal customers therefore possess an advantage over competitors with less loyal customers.
Shareholders of companies care most about top-line revenue, profit, and growth. It’s therefore important for company managers, employees, and owners to also strive for higher profits and growth. Crocs footwear, Lulu Lemon, Netflix, and the car service Uber are examples of companies that deliver a product or service that grew in popularity largely due to customers repurchasing and telling their friends. But Crocs, Lulu Lemon, and Netflix are examples of cases where the company’s signature products fell in popularity: The same word of mouth that led to their rise contributed to their demise.
Stories of Crocs shoes being stuck in escalators spread, as did problems with the transparency of Lulu Lemon’s yoga pants. As for Netflix, it split the company’s products into two services and angered customers.
In all three cases, revenues took a hit, but even worse, the popularity of the products and brands suffered substantially. Therefore, what management, employees, and shareholders want to know is whether a product or company is going to grow or decline before it actually does.
Measuring customer loyalty is one way of estimating how well a company or product is positioned to grow or shrink. While not a perfect measure of actual future growth, there is some evidence that positive measures of customer loyalty correlate strongly with increasing earnings.
For example, a 2013 survey of smartphone users by the Yankee group found that 91 percent of iPhone owners indicated they will repurchase another iPhone.
In contrast, the repurchase rate for Android customers is a much lower 76 percent. Of the 24 percent of current Android customers who said they’d switch, 18 percent are considering purchasing an iPhone.
Repurchase habits are measured differently, depending on the type of product or service offered:
· For rental car companies, the repurchase rate is a good indicator of loyalty as certain customer segments rent multiple times per year and have many companies to choose from.
· For car dealerships, a variation on the repurchase rate as a measure of loyalty is repeat repair and maintenance visits.
· For software companies, a similar measure of repurchase loyalty is the maintenance contract renewal rates.
At many software companies like the software giant Oracle where I worked, customers purchase new database, accounting, and human resource software packages about only once every decade, because the installation and the migration processes are costly and disruptive. The large time span between sales means the repurchase rate lags too much to gauge loyalty. While the original sales brought in revenue, the real value was having customers sign and resign service agreements. Such agreements typically bring in around 20 percent of the original sales price and were lucrative, as they are paid annually. One of the earliest indicators of the likelihood that a customer would purchase from a competitor was the canceling or non-renewal of service agreements. Consequently, this is one of the key measures of loyalty the company tracked.
 Watch out for “false-profits.” Customers who repeatedly purchase may be unsatisfied with their experience but feel they have no choice but to continue purchasing. Merge both purchase history and customer attitudes to help determine if the profits are from satisfied and truly loyal customers or customers who have no choice.
A repurchasing matrix takes the repurchase rate and displays the relative rates for a set of competitors or comparable products within the same company. To build one, compute the percentage of customers who repurchase a product or a competitor’s product.
Table 12-1 is a repurchasing matrix for laptop computers using hypothetical data:
· The first cell indicates that 68 percent of customers who bought a Lenovo computer ended up buying a second one.
· The second cell indicates that 3 percent of the customers who first bought a Lenovo laptop chose Dell the second time around.

The values on the diagonal (the large numbers where each brand’s column and row intersects) are the repurchase rates. The values off each diagonal are the competitors to which the customers are defecting.
 The values often don’t add up to 100%, because not all competitors are considered.
In looking at this example data, you can see that Apple customers are about twice as loyal as Asus’s customers. Apple has a repurchase rate of 77% compared to 38% for Asus.
Given that actual repurchase rates can take years to collect, especially for products that aren’t purchased frequently, building a repurchasing matrix can take years. To speed up the process and gauge your customers’ loyalty before they defect, you can ask their intent to repurchase as well as their likelihood to refer a friend, which is the metric I discuss next.
Net Promoter Score
Word of mouth is a powerful and organic force that can’t easily be controlled like an advertising campaign:
· On one hand, when customers continue to purchase and tell their friends about a positive experience, word of mouth can spread as fast as the norovirus in winter through social media and in-person conversations.
· However, ill will and customer defection spread like a virus, too, if customers have bad experiences.
The Net Promoter Score (NPS) is a popular way of measuring customer loyalty through understanding word-of-mouth marketing. It is based on a single question: “How likely are you to recommend [product or service] to a friend or colleague?” This type of question was found to be the best or second-best predictor of repeat purchases or referrals in 11 out of 14 industries. Net Promoter, NPS, and Net Promoter Score are trademarks of Satmetrix Systems, Inc., Bain & Company, and Fred Reicheld.
Most companies I work with use or have used the Net Promoter Score. Because of its popularity, I explain the scoring and its usage in more detail in the next section.
Computing the NPS
One of the most appreciated aspects of the Net Promoter Score is how it’s presented as a percentage, which is appealing to executives.
Follow these steps to calculate the Net Promoter Score:
1. Ask your customers how likely they are to recommend your product or service to a friend or colleague.
Use an 11-point scale: 0 = Not at all likely and 10 = Extremely likely. Figure 12-1 shows a layout example for this question.

Figure 12-1: The Net Promoter Score.
2. Compute the proportions of promoters, passives, and detractors.
Part of the research into building a Net Promoter Score is finding which numbers on the scale map to customers who are more likely to say good things, more likely to say bad things, or not say much of anything to friends about an experience.
They can be divided into three groups:
· Promoters are customers who rate a 9 or 10 on the response scale.
These are the customers who were found to be most likely to speak favorably and recommend your product or service based on the research by Bain and Fred Reicheld. You want to have as many promoters as possible for your product or service.
· Passives are customers who rate a 7 or 8 on the response scale.
Passive customers are generally satisfied with their experience and are loyal. However, they are less likely to recommend your product or service to friends. The goal is to turn passives into promoters.
· Detractors are customers who rate a 0 to 6 on the response scale.
These customers are not only the least loyal, but also the most likely to actually discourage friends and colleagues from purchasing or using your product. Some detractors can be turned into passives or promoters by identifying their dissatisfaction and fixing it. Some detractors, however, are “lost” customers and no amount of product improvement will keep them.
Once you identify who the promoters, passives, and detractors are, convert them to percentages by dividing the number in each category by the total number of customers who answered the likelihood to recommend question. For example, if 100 customers answered the likelihood to recommend question and 10 responded with numbers between 0 and 6, then 10 percent of the sample are detractors.
3. Compute the NPS.
To compute the NPS, subtract the percentage of detractors from the percentage of promoters.
For example, if 50 out of 100 customers responded with 9's or 10's, then 50% of the sample are promoters. If 10 responded with numbers between 0 and 6, then 10% of the sample are detractors. The Net Promoter Score for this sample of data is then 50% - 10% = 40%. The NPS can range from -100% (all detractors) to 100% (indicating all promoters).
A sample of data from a 2014 survey of customers to the United Airlines website is displayed in Table 12-2. Customers were asked whether they would recommend using the United Airlines website to a friend or a colleague on the 11-point likelihood to recommend scale. Although more than 100 customers were surveyed, this example shows only the answers of the first 10 respondents.
Table 12-2 United Airlines Website NPS Data
|
Respondent |
Response |
Category |
|
1 |
6 |
Detractor |
|
2 |
10 |
Promoter |
|
3 |
8 |
Passive |
|
4 |
7 |
Passive |
|
5 |
9 |
Promoter |
|
6 |
10 |
Promoter |
|
7 |
8 |
Passive |
|
8 |
10 |
Promoter |
|
9 |
9 |
Promoter |
|
10 |
9 |
Promoter |
This data sample shows six promoters and one detractor out of the ten respondents. Therefore, the promoter percentage is 60% and the detractor percentage is 10%, making the NPS 50%.
Like all survey data, the Net Promoter Score has a sampling error and fluctuates from sample to sample. A very different Net Promoter Score could have been obtained in the preceding example if more (or less!) data had been used in Table 12-2. Sampling error depends primarily on the sample size, because most companies cannot survey their entire customer base. Only a small fraction of the customers, a sample, is considered. Usually, the larger the sample, the more its answers are representative of the whole customer base. Therefore, a larger sample translates into smaller sampling errors. Knowing the sampling error, confidence intervals can be calculated.
Due to the way the NPS is calculated, however, the confidence intervals are actually twice as wide as when using a simple proportion or computing the average score. Why? Because there is an uncertainty on both the percentage of promoters and the percentage of detractors.
 The simplest thing to do is to compute a confidence interval around the mean score and calculate the confidence interval around that. Otherwise, contact your favorite statistician to help you compute the confidence intervals.
What’s a good NPS?
As with any metric, you want to know what constitutes a good score and bad score. While a repurchase rate has its own intuitive appeal (people can understand that 48% means a bit less than half of customers are repurchasing), the NPS is less obvious because it involves two percentages.
In general, you want your NPS to be positive, which indicates there are more promoters than detractors. A negative NPS means there are more detractors than promoters, and consequently, a lot of negative word of mouth relative to positive word of mouth.
The best way to assess your NPS is to compare it to
· Other products or services in your company
· Published industry benchmarks
The average NPS varies quite substantially between industries and between business-to-consumer (B2C) and business-to-business (B2B) companies, so look to find the most relevant comparison. More NPS benchmarks for software can be found at https://www.measuringu.com/blog/software-benchmarks14.php or on the Satmetrix website (http://www.satmetrix.com/net-promoter/industry-benchmarks)
Table 12-3 shows the average NPS for some different classes of businesses and products from my company’s internal data and publicly available benchmarks on experiencematters.wordpress.com.
Table 12-3 Example Net Promoter Scores for Industries and Specific Brands
|
Category |
NPS |
|
USAA Insurance |
80% |
|
Amazon.com |
77% |
|
Apple |
76% |
|
Airline Industry |
23% |
|
Consumer Software Industry |
22% |
|
Internet Service Providers |
5% |
|
Websites |
-6% |
|
Time Warner Cable |
-10% |
|
HSBC Banking |
-42% |
Tracking the NPS over time
Getting access to competitive data can be difficult for some industries and products. Even without competitive data, though, the best comparison is often measuring the same product, service, or company over time.
For example, in 2011, Netflix was one of the most recommended and poplar companies in the database of Net Promoter Scores my company tracked. In February 2011, the Netflix NPS was a very high 73%. In the fall of 2011, the company decided to split off its home delivery of DVDs and the streaming service into two companies. While this switch might have made sense to the company, it angered customers, who took to the web and social media to air their complaints. We surveyed Netflix customers a month after the change and the found the NPS plummeted 70 points to -7%. Netflix at this point had more detractors than promoters.
Figure 12-2 shows the results of the NPS survey of customers over time. The lines on top of the bars in the graph show the 95% confidence intervals, which indicate how much to expect the NPS to fluctuate from sample to sample. See Chapter 2 on how to compute and interpret confidence intervals.
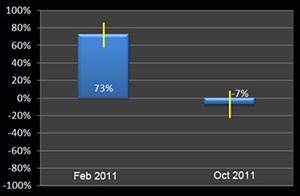
Figure 12-2: The Net Promoter Score for Netflix measured in February and October 2011 after a major product delivery change.
Predicting with the NPS
The Netflix example shows that the NPS does track changes that occur in products or companies — in this case, for the worse. Netflix ultimately reversed its decisions based on word of mouth, and soon, data from another company showed the Netflix NPS hovering around 50%.
The value of measures like the NPS is that they help estimate what will happen to word of mouth while something still can be done to avoid disasters. One way to estimate the effect of splitting the company would have been for Netflix to test the idea on a subset of customers and then measure the Net Promoter Score. More than testing the idea, Netflix could have tested a small sample of users on its new website and product categories and then seen how that group’s Net Promoter Score differed from the larger control group.
Perhaps Netflix did perform such testing and anticipate losing customers. The much larger loss is likely due to other factors and perhaps to untested customer correspondence and the geometric effect of negative word of mouth. But using the Net Promoter Score as a predictive analytic tool can help prevent disasters and identify winners early.
You use the NPS as a key measure to understand the effects of product changes before they are released to customers. You can test feature changes and user interface design changes, as well as changes in pricing and services. For example, I worked with a large mobile phone maker to determine which phones customers would like.
A key metric for this company was the return rate of the phones. Customers had up to 30 days to return their phone without incurring a fee. Naturally, returned phones cost the company money and in some cases, lost customers. The company wanted to predict which phones would have too high of a return rate before being released into thousands of stores in the U.S. We had a sample of customers use a series of phones they were considering and had them respond to a number of measures, including the Net Promoter Score (as well as the System Usability Scale; see Chapter 14 for measures of usability). We collected data for months and found that the Net Promoter Score had a high association with return rates. That is, phones with lower Net Promoter Scores in the testing had higher rates of customers returning them within 30 days.
Phones with average Net Promoter Scores below -25% had twice the return rate as phones with Net Promoter Scores above 30%. These Net Promoter Scores became a new benchmark for testing new phones, and the return rate and NPS score correlation continued to be monitored.
Finding the reason for the ratings
Collecting the NPS is the first step in measuring customer loyalty. But just knowing the NPS for your product or company is not enough. You immediately want to know why some customers are defecting and what about the experience makes others promote it.
One of the easiest and most effective ways to collect the “why” behind the numbers is to simply ask participants to provide some rationale for their ratings:
· At the very least, allow customers to tell you the reason for their rating using an open-ended question.
· A slightly more sophisticated approach is to customize the questions you ask to promoters, passives, and detractors:
· For promoters: What about their experience makes them most likely to recommend it to friends?
· For passives: What can be done to get them to be more likely to recommend?
· For detractors: What can be done, fixed, or improved to get them to recommend the product or service to a friend?
You should spend time reading through the open-ended comments to look for patterns in each of the three categories. Look also to find some quick wins on how to fix problems with detractors. As datasets get larger, it can take longer to review each open-ended comment, so you may consider separating out the responses between multiple analysts.
One of the best ways to take action from Net Promoter Score data is to send those responsible for the product or specific functions the raw open-ended comments customers provide and their Net Promoter Scores. Even better, have a system in place so customers who have a problem are contacted to let them know you’re trying to fix it.
Combining qualitative and quantitative data
A powerful way of making qualitative, open-ended comments more actionable is to combine them with a closed-ended rating scale response question, like the Net Promoter Score.
In addition to the open-ended reasons from the likelihood to recommend question, I often ask customers to name what could be improved. This way, I collect suggestions, even from promoters who are happy but still might have ideas to help improve the experience.
An example is shown in Figure 12-3. A survey on an automotive website netted 110 open-ended comments from customers. Customers were asked to name one thing they would improve on the website.
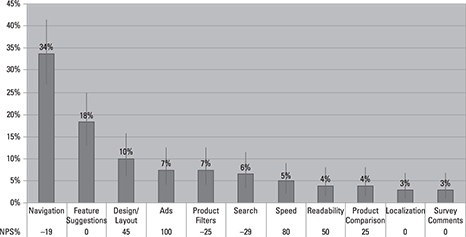
Figure 12-3: Associating the Net Promoter Score to open-ended comments helps prioritize what to address.
My team took the open-ended comments about what to improve and put them into categories. We then computed the Net Promoter Score for each of the suggestion categories.
To help prioritize what areas to focus on, we saw that comments related to website navigation and product filters are high in frequency and come from users who are likely generating negative word of mouth (notice the negative NPS). In contrast, design/layout comments and advertisements, while relatively high in frequency, appear to be minor issues for the users. This was an important finding for the company, as it had just introduced ads and wanted to know how much of a burden those ads would be for its customers. This analysis suggested that while customers didn’t like the ads, they didn’t seem to mind them based on the high Net Promoter Scores from customers who said they’d like them removed.
Bad profits
How does it feel to pay the check at the restaurant where you had terrible service and bad food? Or how do you feel when you pay your cable bill each month? And how about paying $150 to change your airline ticket reservation?
In all cases, the companies get your money. It’s revenue in their books. But if you’re like me, you aren’t happy about the experience and will remember it next time you have a choice. Nobody likes to pay for a subpar or overpriced product or for bad service. Bad profits are made when companies financially benefit from these negative experiences.
Bad profits are a ticking time bomb. They lead to customer resentment and a decrease in customer loyalty, and eventually impact profits negatively.
Each company generates a certain share of bad profits and it is useful to know how much it represents to re-orient the company’s strategy. But how are bad profits effectively and objectively measured? In the next section, I present two methods to do just that.
By combining Net Promoter Score data with customer-by-customer revenue data, you can estimate the amount of revenue derived from bad profits. Even if you don’t have access to financial data for your company or a competitor, you usually can estimate the percentage of revenue from bad profits. For example, when my company measured customers of consumer software products a couple years ago, we found that about 17 percent of Adobe Photoshop users were detractors. Assuming that everyone pays around the same price for a Photoshop license, then around 17 percent of Adobe’s revenue from Photoshop comes from detractors.
While it’s bad to generate revenue from dissatisfied customers, it’s worse if a large proportion of your revenue comes from detractors. With too much detractor revenue for a product or entire company, you are more susceptible to new competition, alternatives, or abandonment.
With cable companies, government services, or utilities, there often isn’t much of a choice. So even though these industries have some of the lowest Net Promoter Scores, they continue to survive. However, competition from satellite, other cable providers, and now content delivered via the Internet (called OTT) threatens the revenue models of cable providers.
If a product is sold for one price, then it’s easier to estimate the percentage of revenue that comes from detractors. When there are multiple products and prices, you need to match up customers’ attitudes with their historical revenue. This isn’t as easy as it sounds. Customer revenue data is often tightly controlled by companies’ finance gurus, and other departments, usually marketing or customer experience, run the surveys. But even a sample of customers will give you some idea about revenue and how it relates to customer experience.
As another example, I helped analyze the survey data from a large software company. It has dozens of products, different pricing models, and sales channels. After merging the sales data for the prior year with the Net Promoter Scores, we found that around 17 percent of revenue came from detractors.
So how much revenue is too much from detractors? While that depends on the industry and the switching costs (more competition leaves less room for detractors), a common threshold is to obtain no more than 10 percent of revenue from detractors.
If more than 10 percent of company or product revenue comes from detractors, there are two things you can probably do:
· Stop selling to these customers. While that may seem crazy, in some cases, getting rid of mismatched customers may better your reputation and increase your profits in the long run.
· Find out the reasons these customers are spreading negative word of mouth and attempt to fix it:
· Start by analyzing the comments of these detractors in surveys to identify the low-hanging fruit.
· Next, conduct a key driver analysis using multiple regression to understand what factors in their experience have the biggest effect on customers’ likelihood to recommend.
Understanding the reasons for detractors is the first step. Doing something about the information is usually a lot harder because it often involves adjusting the price, quality, and features to meet the customers’ expectations. But that’s usually what separates the best-in-class companies from the rest — their ability to make changes based on data.
Working with the NPS
The Net Promoter Score is a useful but imperfect tool. It is used in numerous companies. In fact, some companies take it so seriously that they pay bonuses based on how much they manage to increase their Net Promoter Scores. While it has often been referred to as the “only number you need,” it has some drawbacks:
· People are poor predictors of their own behavior. The Net Promoter Score is meant to be a forward-looking indicator: Without looking at any actual facts, the score is solely based on what customers say they will do. However, just because people say they will do something doesn’t mean they will.
As a way to gauge how many customers who say they will actually recommend a product or website, you can also ask customers if they have in the last 12 months. This percentage most likely differs substantially from the percentage of customers saying they will recommend. But it’s less important to nail down the exact number of customers who will actually recommend than to understand how that estimate, with its imperfections, differs across companies and products. As with most measures, scores make much more sense when compared.
· The scoring inflates the margin of error: By converting an 11-point scale into a 2-point scale of detractors and promoters (throwing out the passives), information is lost. What’s more, this new binary scale doubles the margin of error around the net score (promoters minus detractors). Unfortunately, that means that if you want to show an improvement in Net Promoter Scores over time, it takes a sample size that is around twice as large to calculate the difference; otherwise, the difference won’t be distinguishable from the sampling error.
· Some organizations look at NPS dashboards and investigate why the NPS has gone up or down over a period of time. In too many cases, adding some error bars to the graphs shows that the changes are within the margin of error. The simple work-around is to use the raw mean and standard deviation when running statistical comparisons. The mean likelihood to recommend responses can predict the Net Promoter Score quite well. You can use the net scoring system for the executives, but use the raw data for the statistics.
· Use other ways of measuring customer loyalty. While the NPS is sold as the “only” measure you need, there are other ways of measuring customer loyalty and customers’ likelihood to recommend.
For example, if you’re interested in estimating how many customers are likely to positively or negatively talk about your company, take a look at another way to measure word of mouth, called the word of mouth index (WoMI) from Larry Freed. It distinguishes between positive and negative word of mouth by asking customers both the likelihood to recommend question and if they would discourage others from doing business with a company. Top 100 U.S. brands, the WoMI index score, and the Net Promoter Scores have a high average correlation of r = .8.
Finding Key Drivers of Loyalty
One of the most effective ways to understand what drives customer loyalty is to conduct a key driver analysis. A key driver analysis uses a statistical technique employing multiple regression analysis. It tells you which features or aspects of a product or service have the largest statistical impact on customer loyalty. It can be conducted for all customers but also for each of your different customer segments (see Chapter 2 for more on finding customer segments).
Here are three steps to conducting a key driver analysis:
1. Obtain a baseline set of Net Promoter Scores (or whatever measure of loyalty you use).
If you aren’t doing so already, survey your customers to get a current baseline of how likely customers are to recommend the product to a friend. Ask the 11-point LTR (short for “likely to recommend”) question about both the brand and the product. In fact, you can extend the LTR question down to feature and functional areas if you have a lot of functionalities. Include an open-ended question to ask what’s driving users to give the ratings they gave. These surveys should be conducted monthly or quarterly or set up to collect data in some systematic way. You can email customers, use a pop-up window on the website, or use a third party to gain perspective. Ideally, use all three approaches — they all provide different perceptions of the experience.
Ask a handful of key questions about features and functions: Many products and websites have vast amounts of features and functions. While you can’t expect to obtain detailed metrics for every one of these, you should be able to collect data at a level that allows you to narrow your focus. For example, are poor quality reviews, advertisements, check-out forms, or shipping costs driving detractors?
2. Conduct a multiple regression analysis.
With the NPS scores and items about features and the experience, you likely can identify the pool of candidates who are driving word of mouth for better or worse.
To determine which are having the biggest impact, you can use a multivariate technique called multiple regression analysis. It can determine statistically what aspects are having the biggest impact on NPS and allow you to prioritize. More details on conducting a key driver analysis are provided in the appendix.
The chart in Figure 12-4 shows an output of a key driver analysis for a publishing company’s educational software product. Over 3,000 customers were asked to rate their satisfaction on 20 features and aspects of the product, including its speed, accuracy, and usability. Customers’ impressions of usability had the largest impact on their likelihood to recommend this software product to friends and colleagues. What’s more, their overall satisfaction with the usability was relatively low (at about 75%), indicating that poor usability is reducing the probability that customers will recommend the product.
3. Identify the most popular or unpopular features or aspects of your product or service and have customers rate that experience as well.
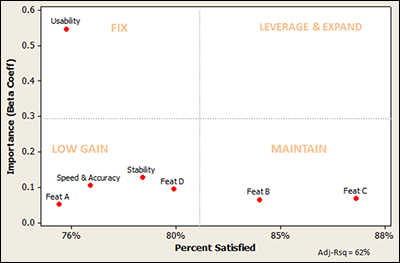
Figure 12-4: Output of a key driver analysis from a web-based software application.
By understanding both the value of positive word of mouth and the cost of negative word of mouth, you can estimate the net value of word of mouth for a product or services for a group, or for all customers.
Valuing positive word of mouth
While companies should strive to obtain as many promoters as possible, it’s often helpful to understand how valuable a promoter is, both in terms of revenue and in how many new customers a promoter brings to a company. With the lifetime value of a customer understood (see Chapter 6), money and effort can be spent to turn detractors and passives into promoters if it makes financial sense.
The best way to understand how much revenue a promoter generates is to tie actual sales to survey responses to see how many promoters actually recommended someone, and how many of those people who heard the recommendation actually became customers.
Reading a key-driver chart
Here’s how to read a key-driver chart, such as the one shown in Figure 12-4. In this case, it’s a chart showing the relationship between two variables, customer satisfaction with a feature, and how much the feature contributes to customer loyalty:
· The vertical (y-axis) in Figure 12-4 shows the relative importance of each item, using the beta coefficient from the multiple regression analysis.
This is a standard output that your statistician and most statistical programs provide. It tells you how much each item contributes to the users’ likelihood to recommend. For example, the customers’ satisfaction with the usability of the software was the biggest driver (highest on the y-axis). A one-point increase in satisfaction with usability results in a .55-increase in customers’ likelihood to recommend.
Usability is about five times as important as the next most important driver, stability, which increases likelihood to recommend by .12 points for every point increase in customer satisfaction.
· The horizontal axis (x-axis) shows the relative customer satisfaction with each feature.
For example, a particular feature of the software (Feature C) has the highest relative satisfaction of the drivers, at around 87 percent compared to the other features. It has a smaller impact on customer loyalty, likely driving positive word of mouth.
Common key drivers of customer loyalty
What customers value in your company may vary widely. Results of NPS surveys across multiple industries reveal that four main areas affect customer loyalty:
· Quality: Are you products and services of a high quality or are they unreliable and don’t work as expected?
· Value: Customers don’t like to feel ripped off and like a bargain (some segments more than others). The total cost and the price relative to what customers receive for their money can generate a lot of detractors or promoters, especially for business-to-consumer products and services.
· Utility: Do your products offer all the essential features your customers need and value? A product doesn’t have to do everything, but it should do the right things for your customers.
· Ease of Use: A product or website can have all the bells and whistles, but if it’s hard to use, or an otherwise frustrating experience, the features might as well not work.
However, the databases in many companies can be so fragmented that connecting customer survey data to sales data is too difficult. It isn’t that it’s technically difficult; it’s usually because the data and initiatives are owned by different teams (usually marketing and IT) who work on different projects. But Owen and Brooks, in their book Answering the Ultimate Question (published by Jossey-Bass), provide a good way to estimate the value of a promoter from survey data alone.
Here are six steps to estimate the value of a promoter from customer survey data.
1. Positively Referred: Ask all customers in a survey if they recall actually referring anyone to consider using a product or service in the past year. People have notoriously inaccurate memories but this can give you a rough idea of a historic referral rate.
As shown in the upper-left corner of Figure 12-5, it was 61% from a sample of TurboTax customers (2011 data).
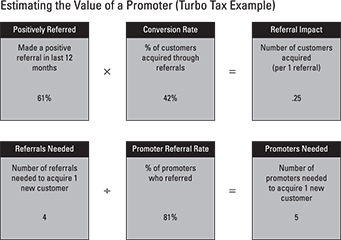
Figure 12-5: The estimated value of a promoter from data collected on the tax preparation software TurboTax.
2. Conversion Rate: Ask each customer if a friend or colleague referred him/her to the product. Again, memories are faulty, but this gives you some idea about the percentage of current customers who visited the website or purchased the product or service based on a referral.
For TurboTax, it was 42%.
3. Referral Impact: By multiplying the percentage that made a positive referral by the percent of current customers who were referred, you have an idea about the number of customers you get through each referral.
0.61 x 0.42 = 0.2562
Note: The slight difference from 25% shown in Figure 12-5 to 25.62% is due to rounding.
4. Referrals Needed: Because there aren’t quarters of people walking around, it helps to get a whole number of customers you need to generate a referral.
Dividing 1 by the referral impact gets you the total number of referrals you need to generate one new customer, like this:
1/0.25 = 4
5. Promoter Referral Rate: Keep in mind that despite the guidance that answers of 9's and 10's are more likely to recommend a website or product, it doesn’t necessarily mean all the respondents actually will recommend.
While people’s ability to recall past behavior can be poor, their ability to predict future behavior is even worse. To help account for that uncertainty, look at which promoters say they referred someone else in the last year and use that as a proxy for those who are more likely to refer someone in the future.
I also call this the Promoter Efficiency Rate.
For TurboTax, 81% of the sample of promoters said they referred someone else to the product in the last year.
6. Promoters Needed: By dividing the Referral Impact Rate by the Promoter Referral Rate, you get the number of promoters needed to gain a new customer.
This works out to be five new promoters needed to generate one new TurboTax customer.
With some estimate of the number of promoters you need to gain a new customer, you can then weigh the cost of new programs, features, pricing, and promotions to determine if the benefit from new customers outweighs the cost. For websites, a new “customer” might just be a new visitor or subscriber, so the cost of gaining new promoters can be important.
The estimates used in the preceding TurboTax example are based on survey data and, therefore, aren’t as reliable as actual internal numbers. If actual referral rates or conversion rates are available from historical data, then those can be used to supplement or supplant the survey data. Keep in mind that past behavior is no guarantee of future success, so having data on the past and potential future is a prudent approach.
With any survey data comes a margin of error because you almost always are dealing with a small fraction of the customer population. As an added step, I also like to compute a conservative estimate of the value of the promoter. For the boxes labeled “Positively Referred,” “Conversion Rate,” and “Promoter Referral Rate,” I also use the lower boundary of the confidence interval.
For example, from the sample of 117 TurboTax customers surveyed, while 61% said they referred someone in the past year, the 90% confidence interval is 52% to 68%. So the more conservative estimate is to use the lower end of 52% instead of the average of 61%.
Valuing negative word of mouth
While companies should strive for more promoters, it’s often the customers who are least satisfied with their experience who have a much larger impact on referrals and the brand. Research supports that customers who are dissatisfied with a product or service experience are actually more likely to be vocal and tell more friends and colleagues about their bad experience than generally satisfied customers.
For example, I have been an avid user of the online personal finance website Mint.com for years. Its website allows you to see your personal and small-business finances, expenses, and investments all in one place. Unfortunately, the product team recently turned off the small-business categorization feature with no notice to customers. This meant hundreds of hours of logging small-business expenses were lost and unrecoverable. Understandably, a lot of loyal customers were upset and let the company know. While it’s unclear what will happen to the product, the experience has been so frustrating that I’ve shared it with at least a dozen close friends who manage small businesses and track their personal finances with Mint.com. This one change turned a promoter into a detractor.
The negative effects of detractors can outweigh the positive effects of promoters. You can estimate this negative effect by using a similar procedure for estimating the value of promoters.
1. Negative Word of Mouth Rate: Ask all customers in a survey if they recall actually discouraging anyone from using or purchasing the product. Convert this to a percentage.
For example, if 20 out of 100 people discouraged someone else from using the product, the rate is 20%.
2. Number Discouraged: Ask customers to estimate approximately how many people they discouraged from purchasing.
If you don’t have this information from customers, use the number 4 as a placeholder. There’s some evidence that dissatisfied customers tell on average four friends and colleagues about their poor experience.
3. Conversion Rate: Use the same conversion rate used in estimating the value of a promoter. This is calculated as the percent of respondents (from a survey) that were referred to a product by a friend or colleague.
In the TurboTax example, it is 42%.
4. Cost of Discouragement: Multiply these values to compute the cost of a discouragement:
· Negative word of mouth rate
· Number discouraged
· Conversion rate
For this example, the negative word of mouth rate (20%), the number discouraged (4), and the conversion rate (.42) work out to be 34%.
You can divide 1 by this number to get the number of discouragements that result in one lost customer. In this case, it’s 3.
5. Detractor Discouragement Rate: Not all detractors will discourage customers from using a company’s product, especially those detractors who score higher, such as 5's and 6's on the LTR question. Find the percentage of detractors who also negatively referred to friends from the survey data.
Use as an example that roughly 50% of detractors actually discouraged others. Divide 3 by 50%, and you get 6. That means for every six detractors, on average one customer is lost. The calculations are shown in Figure 12-6.
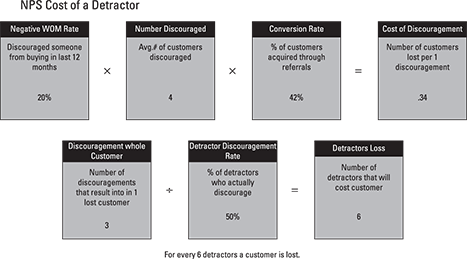
Figure 12-6: Calculate the detractor discouragement rate.
All materials on the site are licensed Creative Commons Attribution-Sharealike 3.0 Unported CC BY-SA 3.0 & GNU Free Documentation License (GFDL)
If you are the copyright holder of any material contained on our site and intend to remove it, please contact our site administrator for approval.
© 2016-2026 All site design rights belong to S.Y.A.