Customer Analytics For Dummies (2015)
Part II
Identifying Your Customers
 Visit http://www.dummies.com/extras/customeranalytics for great Dummies content online.
In this part …
· Segment your customers for better targeting.
· Know your customer segments better with personas.
· Find what value different customers bring to your company.
· Visit http://www.dummies.com/extras/customeranalytics for great Dummies content online.
Chapter 4
Segmenting Customers
In This Chapter
![]() Applying the advantages of segmenting customers
Applying the advantages of segmenting customers
![]() Following the segmentation process
Following the segmentation process
![]() Transforming customer data into segments
Transforming customer data into segments
Unless you have only one customer, you’ll want to understand how your customers differ and how you can adapt to the differences. Customer segmentation is a powerful technique to focus efforts and serve customers better.
A customer segment is a grouping of customers that share certain characteristics. Understanding your customers — their similarities and differences — is one of the most fundamental and essential steps in quantifying the customers’ relationship with your product and company. Not only does segmenting customers tell you how to better serve current customer demographics, but it also allows you to discover any unmet needs and deliver better products and services in the future.
In this chapter, you discover how customer segmentation can improve the way you do business and increase your profits. First, I discuss the advantages of customer segmentation. Then, I introduce you to the type of information you need about your customers in order to build a sound segmentation strategy. Finally, you discover how to objectively segment your customers and determine which segments are the most profitable.
Why Segment Customers
Customer segments enable you to understand the patterns that differentiate your customers. However, collecting and analyzing data just to understand patterns and differences is not useful unless you’re going to do something with the information. Analyzing customer segments enables you to customize your products, services, prices, and marketing strategies to better increase profitability and customer satisfaction for your segment. Some of the valuable results of segmentation enable you to effectively:
· Identify the most and least profitable customers. All customers are not created equal. An examination of revenue by customer segment usually reveals that a minority of customer segments is responsible for the majority of profits. This is called the Pareto Principle.
Identifying more profitable segments allows you to focus your efforts on keeping these customers happy while increasing their purchases. What’s more, segmenting can reveal underserved customers for whom specially designed and marketed products or services can be created.
· Improve marketing focus. Segments often have different interests, values, tastes, and reasons to purchase what you offer. Vastly disparate segments may not respond to the same marketing messages or campaigns.
· Predict future purchase patterns. Knowing that certain customers are more likely to purchase other products based on past purchases helps with planning and marketing. If you’ve ever watched a show on Netflix or purchased a book on Amazon, then you’ve seen the value of segmenting to predict and encourage future purchases.
This practice is called predictive analytics.
· Build loyal relationships. Fully meeting the customers’ expectations through customized service and uniquely designed products at a price they can afford helps build customer loyalty. Loyal customers are more likely to do business with you again and recommend you to their friends and colleagues.
In addition, segmentation may reveal what kinds of incentives cause each segment to choose your business over the competition over and over again.
· Price products differently. Why lose money by reducing prices if some customers aren’t motivated by price? By acquiring an in-depth knowledge of customer motivations and gauging how much they are willing to spend (price sensitivity), you can develop more effective pricing strategies.
· Develop better products and customize products or service features. Segmentation provides the knowledge you need to tailor your products and services to maximize your profits within each segment:
· Do you lose sales because your product lacks prestige for the target segment?
· Is the product’s large number of features making its price prohibitive?
· Are customers more interested in the competition’s products because it has better features?
· Do you need to develop a whole new line of products?
Properly customizing products for each segment becomes easier as more understanding of the target segments is acquired.
· Create personas. A persona is a fictional person who represents the characteristics and goals of a customer segment. Personas are used to help make better product development and marketing decisions. See Chapter 5 for more information on creating personas.
This list is not exhaustive. The advantages of segmentation depend on the type of product or service you offer. Once you become more acquainted with the process of segmenting and researching your customers, you will find which ones apply to your business and possibly discover other unexpected advantages. For now, identifying a few objectives and positive outcomes is a good place to start.
 One of the first steps to take in customer segmentation is to think about what makes sense for your organization. Is the gender of a customer something that determines what products he or she buys or is it the time of purchase? Or is gender just a proxy for another important variable? For example, an online sports website typically has men purchasing shirts and jerseys most of the year. During the Christmas shopping season, however, the gender balance shifts to women. Is that because women start appreciating sports around the holidays or are customers purchasing gifts for the men in their lives? Gender in this case is just a proxy for the time of purchase.
As another example, airlines want to segment their customers by how frequently they fly. A customer who flies once a year for pleasure is different from a customer who flies over a hundred thousand miles a year for business. The occasional traveler spends a lot less money with the airline, less time on the website and with customer service, but also has different needs and expectations. Email marketing and promotions should be tailored differently to both types of travelers. While airlines, like most companies, want to retain as many customers as possible, some segments are more valuable in terms of annual and lifetime revenue, something I cover in Chapter 6.
It is helpful to decide what you want to know about your customers before starting. While the type of product or service determines the customer attributes that are worth segmenting, there are some fundamental attributes most organizations should be familiar with. These are key areas on which data should be collected.
Tips for successful customer segmentation
Customer segmentation is more than a simple process. It requires a combination of facts and intuition to put yourself in your customers’ shoes. Follow these guidelines to success:
· Start with the end goal in mind.
Define what you will do with the segmentation data before you begin. If your segmentation goal is to increase the sales of one of your product’s optional features, data should be gathered about who buys the feature, which income bracket they belong to, and what their motivations are (low-cost solution or a premium high-quality option).
· Be open-minded.
Patterns emerge from data analysis. It’s fine to have preconceived ideas about what to expect, but don’t let that dictate how you look for patterns. Let the data do the talking.
One of the goals of segmentation is to learn new and possibly unexpected things about how your customers are similar. For example, when my company wanted to understand the most important features to customers on a healthcare web application, the stakeholders felt they already knew what those features were. However, the survey results from a representative set of customers showed the top three features were different from what the stakeholders were sure they knew.
· Use existing data.
The data you need may already exist. There’s no need to commission an expensive survey if the data is already collected, say, for example, during the process of a sale or while on a call to customer service. What’s more, you don’t want to overburden your customers with questions about their details if you already have them. When my company wanted to know which versions of a software product customers were using, instead of asking them, we were able to find the information by reviewing the software purchase data.
· Use multiple sources of data.
Try not to rely on a single source of data. Look at existing customer lists, surveys, and third-party reports.
For example, on a customer segmentation survey my company conducted for a software company, we looked at the response rates by product lines and compared them to actual sales by product line. We ensured that the composition of customers responding to questions about their product usage would match the actual breakdown by product. Running smaller surveys with open-ended questions and conducting a few interviews can provide a lot of insight into what questions to ask. Customer surveys are usually easy to implement. Some companies offer perks such as drawings or a discount on a future purchase as a reward for participating in a survey.
When possible, use more than one source and plan on cross-referencing data.
Segmenting by the Five W’s
Segmenting customers can seem daunting: Where do you start and how do you segment? While the answer depends on your goals and products, it can be helpful to think in terms of the five W’s (who, where, what, when, why,and how) when segmenting.
 Okay, it’s actually five W’s and an H.
Who
At the most basic level, you should know the demographics of your customers. Characterizing customers based on demographics is the simplest and easiest way to start segmenting. Demographic questions are not subjective: They give you real, verifiable information about your customers.
The core “who” demographic subjects include:
· Gender
· Age
· Income
· Education level
· Occupation
· Marital status
· Number and ages of children
Knowing these basic demographics is interesting in itself. For example, an airline company interested in determining who the most frequent users of its company-brand credit card are may find that they are high-paid men who travel for business. This type of information helps with identifying effective sources of advertising or products that this group is more likely to purchase.
Figure 4-1 displays two core demographics, gender and age, for a photography company. The data came from 4,000 responses to a customer survey. The results show an even split in gender. One consequence of this split is that gender-based marketing messages or targeted selling would likely exclude half the customer base. If the gender split was more like 80% to 20%, targeting one gender would likely make more sense.
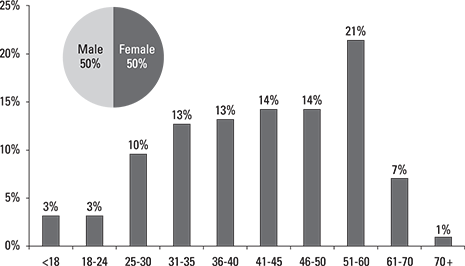
Figure 4-1: Gender and age distribution for a photography business from a survey of 4,000 customers.
However, it’s clear from the data that around 92% of the customer base is between 25 and 70 with the largest age segment being baby boomers between the ages of 51 and 60.
When analyzing demographic customer data, one strategy is to understand where your customer segments are disproportionate relative to the total population. In comparing this age distribution to the latest U.S. Census data, the age groups from 25 to 60 represent a higher percentage than the general U.S. population. While this age range is a bit wide, it can still narrow the focus of marketing activities and product strategies to this age range. It may also suggest to the company that there is an underserved market for younger and older photography enthusiasts.
Where
Knowing where customers live isn’t just an exercise in placing pins on a map. Instead, it’s about understanding the geographic diversity or concentration of your customers. It helps with locating better business locations, decreasing delivery time/distance, and so forth. If most of your customers live far away from your physical location, you may decide to open a new location that is closer to them.
Geographic attributes can include:
· Rural versus urban
· Domestic versus international
· City names and market size (for example, San Francisco versus St. Louis)
· Regions and states
· Zip codes
My company conducted a study for a U.S.-based mobile phone carrier to understand problems customers had when purchasing phones and paying bills online. As part of the study, the company wanted to understand the geographic breakdown of its online customers so it collected the zip codes of the participants. Figure 4-2 shows the locations of customers who participated in the study, which enabled the company to see the urban concentration and geographic diversity of the participants.
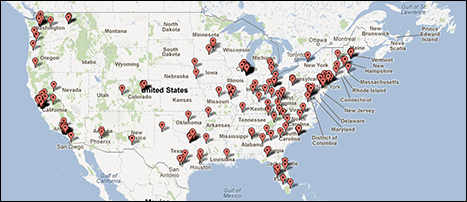
Figure 4-2: Locations of U.S.-based mobile phone customers who responded to a survey about their online account activity.
What
In thinking about the “what,” you should think about past, present, and future. What have customers done, what are they doing, what are they thinking, and what are they likely to do?
What they have done
The easiest place to start is the past. What have customers done that distinguishes them? If helpful, think in terms of recency, frequency, and monetary value (revenue and profits) for segments:
· Most recent purchase
· Total number of transactions
· Product experience
· Total revenue
· Total profit
· Time spent with support
· Actual number of referred customers
From the answers to these questions, you learn how your customers interacted with your business in the past, and who your best customers were. Comparing this data with the data from other W’s, you will be able to identify the characteristics of your least and most profitable customers.
For example, Figure 4-3 shows the amount of experience customers have with a software product used for drawing and design. The responses from almost 2,000 customers reveal that most customers have more than ten years of experience using the product.
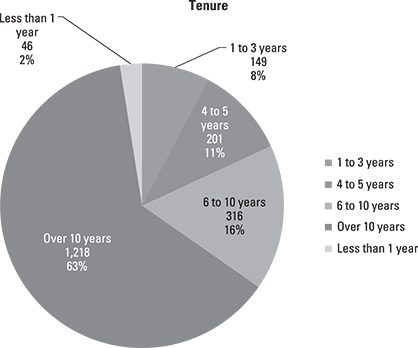
Figure 4-3: The number of years of experience customers have with a software product used in the design industry.
As another example, the retailer L.L.Bean sends different catalogs to customers based on how recently customers have purchased, how frequently they purchase, and the type of products they purchase. That means your neighbor probably has a different L.L.Bean catalog than you do.
What they are doing
Understanding the context, goals, and motivations of customers will help you to identify gaps in product features and opportunities for improvement. Use segmenting to define key areas such as:
· Motivations: Business or pleasure
· Experience level: Power versus novice user
· Goals: Perhaps looking for a lawyer versus getting answers to a legal question
A customer who uses only a few features of a software product has different needs than a “power user” who uses all the functionality. Power users may be more interested in new features and upgrades than the more occasional or novice user.
What they think
Look to identify attitudes and psychographics that differentiate the following:
· Lifestyles: Traveler versus homebody
· Values: Frugal versus spendthrift
· Technology: Early adopter versus tech laggard
· Personalities: Risk seeking versus risk averse
· Overall product satisfaction: Low versus high
· Investing habits: Active versus occasional investor
These questions are more subjective than objective, but are nonetheless fundamental. For example, if a majority of your customers typically wait until all their friends have a technology before making a purchase (tech laggard) then marketing that emphasizes cutting-edge technologies won’t be appealing.
What they are likely to do
You also want to think in terms of long-term relationships and the lifetime value of a customer. Using a combination of surveys and past behavior can help you estimate:
· Likelihood to recommend to friends
· Likelihood to repurchase
This helps you identify the customer segments with whom you can reasonably expect to benefit from long-term relationships. Identifying loyal customers is instrumental in keeping them. Offering perks such as discounts when using your company-brand credit card, participation in sweepstakes, or free products and services for their loyalty is an effective way to get customers to choose your company over the competition. Customer loyalty is covered in detail in Chapter 12.
When
There are often significant differences in the types of customers you have, based on when you measure.
· Seasons: Christmas shopping versus ordinary time
· Weekends versus weekdays
· Life events: After a baby, marriage, or move
· Daytime versus evening
· Periodic activities: Get haircuts and buy toothpaste every five weeks
Why
The “why” is pretty obvious, isn’t it? The customer wants or needs what you have to offer!
As touched on in the beginning of this chapter, customer segmentation can help answer many business questions. Among those include:
· What are my customer segments and how are they defined?
· How many distinct groups do we serve — and how are they different?
· What customer segments deliver the most revenue and profit?
· What products and services appeal to which customer segments?
· How can I tailor communication to better address customers’ needs?
· Which consumers tend to shop/interact exclusively online and why?
· How and where should I leverage my customer loyalty program further?
How
How do customers interact with the product or service?
· Online versus in store
· Phone versus in person
· Through a reseller versus direct
Knowing how customers already interact with your business gives insight into what can be improved and what is already working to its full potential. For example, say you are trying to improve the sales of your software and you realize that most users buy it from a reseller. Perhaps that means that your website is difficult to use and so less tech-savvy people therefore turn to a third party. This is very valuable information and could indicate that your website needs improvement in order to meet the needs of your less tech-savvy customer segment.
It isn’t essential to collect every one of these attributes about your customers: Some may not apply and some may not make a huge difference. It all depends on the kinds of products or services you offer and the goals you have in mind. Are you looking for an optimal store location to reach wealthy clientele? Focus on geographical and demographic questions to identify where the well-to-do segment of your customer base resides or shops. Use your judgment and knowledge of your own business to pinpoint the attributes that are the most meaningful to your study.
Analyzing the Data to Segment Your Customers
After you’ve collected the data, you can do a number of things to make your segmentation as realistic and objective as possible. Customer segmentation, especially when dealing with large volumes of data, needs to be well thought out and organized. Predictive analytics technology can discover automatically which groupings exist in customer data and find relevant patterns that are likely to be much more subtle, extracting much greater predictive insight than traditional segmentation. However, you don’t need sophisticated software to uncover the major customer segments. You can manage it by following these four steps.
Step 1: Tabulate your data
The first step is to organize the data in a way that is simple to analyze. It can be helpful to tabulate your data in a spreadsheet.
For example, the data shown in Table 4-1 is a small sample from a larger survey of United Airlines website customers that my company performed in May 2014. In this table, each row is from a different customer and each column contains the answers to specific questions about how each customer typically interacts with the United Airlines website.
Where possible, survey responses should be coded with simple numeric responses. For example, customers who have a United Airlines credit card are coded 1 and those who don’t have one are coded 0. For categories that have a natural ordering, maintain the sequence by coding categories from low to high or from high to low. For example, the most frequent visitors in the survey represented in Table 4-1 are coded with a high frequency of 1, for visiting on average once a day, and 5 for once in the last year (low frequency).
Table 4-1 Characteristics of Flyers
|
Possess an airline credit card 1: yes; 0: no |
Frequency of website visits 1: once a day 2: a few times a week 3: a few times a month 4: a few times a year 5: once |
High frequency of website visits (1: yes; 0: no) |
|
1 |
3 |
0 |
|
1 |
4 |
0 |
|
0 |
2 |
1 |
You can then create new variables to simplify the segments. The column “High frequency of website visits” is created by reducing the multiple levels in the “Frequency of website visits” column to just high and low frequency (a binary variable). Customers who visit at least a few times a week (scores of 1, 2, or 3) are coded a 1 and those visiting less frequently (scores of 4 and 5) are coded a 0.
Step 2: Cross-Tabbing
Now that your data is tabulated, the next step is to refine your analysis by “crossing” more than one variable. Cross-tabbing helps you visualize interrelations between two variables by explicitly revealing that some customer attributes usually appear (or do not usually appear) in conjunction with other attributes. Table 4-2 illustrates this concept by showing the interrelation between the customers’ ownership of an airline credit card and the frequency of their visits to the airline website.

Each cell in Table 4-2 contains the number of customers who fit in the category on the top and side of the table. For example, 29 customers own an airline credit card and visit the airline website frequently. Next, to facilitate analysis, the numbers in Table 4-3 can be converted to percentages, using the following simple equation:
![]()
Here, the total number of customers surveyed is 111. Therefore, a new table with percentages can be created and is easier to interpret:

A lot of useful information can be drawn from Table 4-3. For example, there appears to be no association between owning an airline credit card and the frequency of website use (12% low frequency, 12% high frequency). For customers who do own a credit card, a counterintuitive result emerges: A majority of them visit the website infrequently (50% low frequency, 26% high frequency). This initial analysis suggests that airline credit card ownership is not associated with more frequent visits to the airline website.
 This data comes from just a sample of customers. Any sample has random variation. To know if the difference between card ownership and website frequency is statistically significant (beyond what you would expect from random variation), you would conduct a Chi-Square Test of Independence. See the appendix on on how to conduct and interpret this statistical test.
When cross-tabbing, look to mix many of the different dimensions to find patterns or valuable segments. You may uncover surprising trends and learn something new about your customers!
Step 3: Cluster Analysis
A more advanced technique used to identify segments is based on clustering algorithms such as cluster analysis, factor analysis, and multiple regression analysis. These techniques identify statistical patterns that are hard to detect intuitively. You’ll want to call in the professionals to help with this because it involves both sophisticated software and statistical know-how. You may encounter some output of cluster analysis, however. There is more discussion on finding similarities with customer analytics in the appendix and in the book Predictive Analytics for Dummies (Wiley).
A common output of a cluster analysis is a visual map (called a dendrogram) that shows how customers cluster based on responses to the same questions. For example, Figure 4-4 shows an example of a dendrogram for how customers shop for consumer electronic devices on their smartphones. Each line represents a particular feature that consumers find important, such as reading consumer reviews, or the capability to customize products or watch product videos. The closer the lines are, the more similar customers each feature. So customers find similar importance with features A, B and with features C, and D. However, features C and D aren’t closely related with either feature A or B as they are far apart in the dendrogram.

Figure 4-4: Example of a dendrogram output from a cluster analysis.
Step 4: Estimate the size of each segment
When your data is organized, you can estimate how many customers are in a particular segment. The purpose of estimating the size of the segment is to understand the total percent of current customers who make up each and to estimate the total size of the segment for non-customers too. If the potential market size is large, then it presents more opportunity for growth.
To estimate the size of each segment, you need to know the total size of your market and some data about the appropriate segment. For example, if marketers at United Airlines want to calculate the size of the segment of its customers who frequently visit its website, United Airlines can use the following equation:
· Estimated # of customers
· x % of customers who frequently visit the website
· = # of customers who frequently visit the website
Unless you survey every single customer, there is a sampling error with your percentages. The best way to understand the sampling error is to use confidence intervals (as covered in Chapter 2). Confidence intervals put boundaries around the upper and lower percentages to understand how much percentages could fluctuate based on your sample. For example, if 5 out of 100 survey respondents are over age 65, a good estimate about this segment is 5%. Using confidence intervals, you can be 95% confident that the actual percentage of all customers over age 65 is between 2% and 11%. In other words, it’s highly unlikely more than 11% or fewer than 2% of customers are over age 65.
To compute confidence intervals with binary data, use the free calculator online at http://www.measuringu.com/wald.htm. Figure 4-5 shows a screen shot of what you enter and the results. Enter 5 in the “Passed” box and 100 in the “Total Tested” box. The row labeled “Adj. Wald” provides the confidence interval.
Step 5. Estimate the value of each segment
To determine which customer segments are economically the most important to you, estimate the percentage of customers in a specific segment who are going to purchase your product within a specific time period and the amount of revenue you expect from each sale. Ideally, you already have good estimates from the experience of operating your business and from the information gathered in the preceding steps. The following equation can be used to calculate the revenues expected from a specific segment:
· # of customers in the segment
· x % of customers who will purchase your product
· x revenue per sale of your product (in $)
· = potential revenues (in $) from this segment
For example, if there are an estimated 100,000 potential customers in a segment and 5% will likely purchase a $100 product, the potential revenue is 100,000 × .05 × 100 = $500,000.
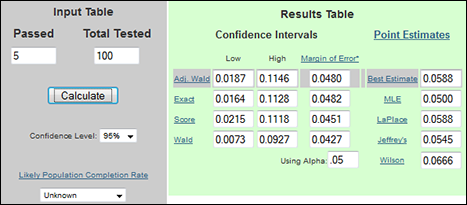
Figure 4-5: Compute confidence internals.
Use both the lower and upper boundaries of the confidence intervals to create “conservative” and “best-case” scenarios for estimating the value of a segment.
Using attitudinal variables like the Net Promoter Score (NPS) is useful to differentiate between “good” and “bad” profits. The NPS is an indication of how likely customers are to recommend your product or service to a friend or coworker. The scale ranges from 0 (not at all likely to recommend) to 10 (very likely to recommend). If a customer’s NPS is:
· 9 or 10: The customer is called a promoter and is likely to talk positively about your product.
· 7 or 8: The customer is called passive and probably will not talk positively or negatively about your product.
· Below 7: The customer is called a detractor and will likely talk negatively about your product.
The data in Table 4-4 are a small subset from a survey of customers at a large software company.
Table 4-4 Net Promoter Score
|
Likelihood to Recommend |
Category |
|
5 |
Detractor |
|
10 |
Promoter |
|
8 |
Passive |
|
7 |
Passive |
|
… |
… |
The proportions of promoters, passives, and detractors among your customers reveal how customers and their friends and colleagues view your product. Customers who generate a high proportion of revenue but who have a bad experience are more likely to say negative things and lead to decreasing revenue streams (bad profits). This topic is discussed in Chapter 12.
You can cross-tab responses to the Net Promoter question with other important questions about future revenue and include confidence intervals. For example, say you want to understand how software renewal rates would differ based on how likely customers are to recommend a product to a friend. Figure 4-6 shows the percentages of customers who said they would renew their software licenses based on whether they were promoters, passives, or detractors. Only 18% of customers who are detractors are likely to renew their licenses. In contrast, 53% of promoters are likely to renew. The small lines that are placed on top of each bar in the graph are visualizations of the confidence interval. They tell you that between 50% and 55% of all customers who are promoters would renew their licenses.
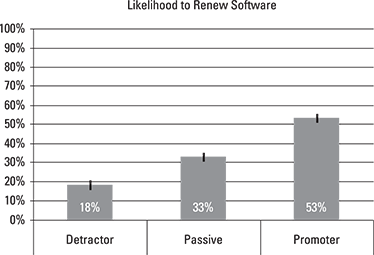
Figure 4-6: Percentages of detractors, passives, and promoters who plan to renew their software licenses.
Don’t try to do everything at once. Collect enough data to get a good handle on your customers, but don’t hesitate to go in stages. Finally, try to focus your efforts by having some research questions and hypotheses to answer before collecting data, but don’t be afraid of following the patterns that emerge from the analysis.
All materials on the site are licensed Creative Commons Attribution-Sharealike 3.0 Unported CC BY-SA 3.0 & GNU Free Documentation License (GFDL)
If you are the copyright holder of any material contained on our site and intend to remove it, please contact our site administrator for approval.
© 2016-2026 All site design rights belong to S.Y.A.