Customer Analytics For Dummies (2015)
Part III
Analytics for the Customer Journey
 Visit http://www.dummies.com/extras/customeranalytics for great Dummies content online.
In this part …
· Define the journey a customer undertakes with your company or product.
· Find out what customers think of your company and brand.
· Question customers about their attitude regarding a product or service experience.
· Quantify the customer decisions and conversion process.
· Track customer’s post-purchase behavior.
· Measure customer loyalty and understand what drives it.
· Visit http://www.dummies.com/extras/customeranalytics for great Dummies content online.
Chapter 7
Mapping the Customer Journey
In This Chapter
![]() Connecting the marketing funnel to a customer journey map
Connecting the marketing funnel to a customer journey map
![]() Following the stages of a customer journey
Following the stages of a customer journey
![]() Visualizing the steps a customer goes through
Visualizing the steps a customer goes through
![]() Quantifying pain points
Quantifying pain points
![]() Identifying customer “touchpoints”
Identifying customer “touchpoints”
In this chapter, I discuss the importance of mapping out customer journeys and walk you through an example showing how to create one for yourself. A customer journey map is a visualization of the stages customers go through as they become aware of, purchase, and use a product or service. It has clearly defined stages and details customer touchpoints and metrics that quantify each stage.
The goal of a customer journey map is to identify problem areas customers have while engaging a product or service and identify opportunities for improvement. It can also help unify often disparate and competing efforts within the same organization by providing different departments with a single document that maps the customer’s entire experience with a product or service.
Working with the Traditional Marketing Funnel
For about as long as people have been selling products, they’ve been thinking about where to find customers and how to reach them. The classic sales and marketing funnels date back to the late 1800s and provide a simple metaphor to think about the path a customer takes on the way to purchase. The sales funnel in Figure 7-1 is a common example of how a funnel can map the journey a person takes from prospect to customer. It can also be used as a starting point in building a journey map.
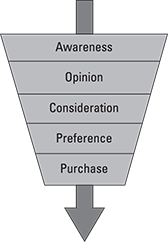
Figure 7-1: An example of a typical purchase funnel.
Funnels, like the one shown in Figure 7-1, show that people move from becoming aware of a product or company to becoming interested to eventually making a purchase. They provide some clear stages for understanding the customer journey and targeting marketing, advertising, and sales efforts accordingly. For example, it doesn’t make much sense to talk about pricing when people don’t want or haven’t heard of your product.
Just about every marketing organization has or should have a funnel. In fact, the funnel concept of AIDA (Awareness, Interest, Desire, and Action) was at the center of a famous scene with Alec Baldwin in the movie Glengarry Glenn Ross.
Organizations likely have different names for each of the stages. Table 7-1 shows some popular examples of marketing and sales funnels your organization might use. Despite some minor differences, funnels generally share a similar pattern of customer 'margin-top:6.0pt;margin-left:18.0pt;text-indent:-18.0pt; line-height:normal'>1. Contemplate a purchase.
2. Narrow down on a choice.
3. Purchase the chosen product.
4. Experience post-purchase effects.
It’s a theme you’ll use with the customer journey map you create as well. Table 7-1 compares different types of marketing funnels to illustrate their similarities.

The marketing funnel is a linear process as the metaphor suggests. People start at the large end of the funnel and then make their way through the stages. The narrowing of the funnel conveys the smaller percentage of people who make their way through. Linearity in mapping the customer journey can be limiting because it assumes every customer starts in the same spot, proceeds through the same steps, and finishes at the same end point. You can overcome this challenge by incorporating loops back through earlier stages.
Another adaptation to the model, like one from McKinsey in Figure 7-2, emphasizes that customers’ loyalty is less of an end point, but the beginning of a loop where the customer goes back to the consideration phase before the next purchase point. This is especially the case with products and services that are purchased regularly, like rental cars, coffee, computers, or hotel reservations.
I always thought the funnel metaphor was a bit odd. After all, as any kindergartner will tell you, everything that goes in one end of the funnel comes out the other. That would be like every prospect turning into a purchaser. If that were true, all you’d need to do is make and advertise a product and you’d be the next Bill Gates!
So unless you’re working for the IRS or have some sort of mandatory product, customers will drop out of the funnel at some stage. A better metaphor might be the marketing filter or marketing sieve.
Despite some recent criticism of the linearity of the marketing funnel (and the flaw with the metaphor), the marketing funnel will probably continue to endure. One reason is that modifications to the model are still generally linear, as you see with the customer journey map.
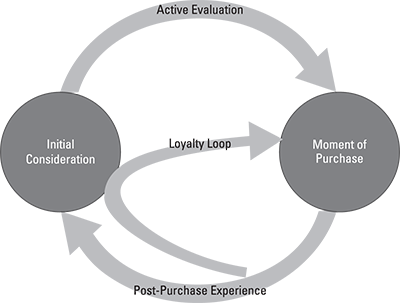
Figure 7-2: A purchasing funnel that illustrates the non-linearity of the process.
What distinguishes a journey map?
The customer journey is a natural extension of the marketing funnel and shares many of the same components and goals. Both attempt to map the process a customer goes through with a product or service. Here are four main areas that differentiate a customer journey map from a marketing or sales funnel:
· More detail: A journey map is like Google Earth: You can go from a 30,000 foot view to get high-level insights but still zoom into the street-level view to understand the micro-interactions in each stage. The typical sales funnel focuses more on the macro view (say above 10,000 feet) and leaves the micro interactions to separate departments.
· Focus on touchpoints: The moments of friction or delight where companies can differentiate themselves are hallmarks of the journey map and aren’t typically addressed by the sales funnel. Touchpoints happen well before, during, and after a sale and across media.
· More emphasis on post -purchase 'font-size:9.0pt;font-family:"Arial",sans-serif;color:black'> There isn’t much direct selling going on when a customer is using most products, yet long-term usage, usability, and experience impacts a user’s intent to repurchase and recommend the product to his or her networks. Journey maps provide this detail to identify opportunities for improvement.
· Not just for the sales and marketing teams: The customer journey may be one of the only documents that shows an organization how a customer interacts with it from beginning to end. Typically the marketing and sales teams are only the ones that care about converting leads into sales, while the product team is primarily concerned with fixing problems and adding new features. The customer journey map should, and can, act as a unifying document for disparate departments with different goals.
What Is a Customer Journey Map?
Like a marketing funnel, a customer journey map is a visualization of the phases a customer goes through when engaging with a product or service. Almost any experience can be mapped, including the following examples:
· The shopping experience at Whole Foods, from parking to unpacking
· The birthing experience: Admittance to the hospital to taking home baby
· New customer download experience: From software trial download to installation to long term customer
But unlike typical marketing funnels, a customer journey map illuminates stages in the journey with touchpoints. Touchpoints are moments when a customer comes in contact with things like a website, a physical store, a support representative, or an advertisement. The journey map should also have some way of quantifying the experience for each step in the journey.
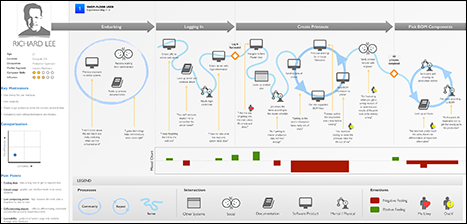
Photo courtesy of Alan Ho (https://www.behance.net/gallery/User-Journey-of-a-Shop-Floor-User/15650709)
Figure 7-3: Journey map for a shop-floor supervisor.
Another example, shown in Figure 7-4, shows “Sarah’s” journey as she selects a new Internet and phone service provider after moving into a new house.
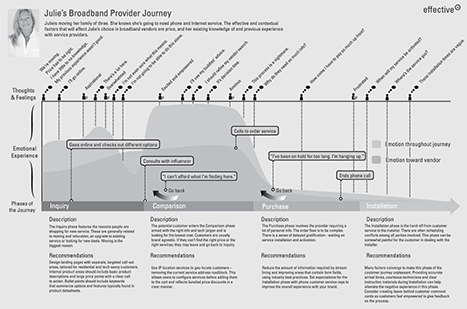
Journey map courtesy of Effective UI (effectiveUI.com)
Figure 7-4: Journey of a consumer selecting an Internet and phone service provider.
Customer journeys can map an experience from minutes to years. An example of the journey a customer goes through when purchasing a laptop computer is shown in Figure 7-5. Notice how this journey starts before the customer has engaged with a company or product. You work on building this customer journey map throughout the rest of this chapter.
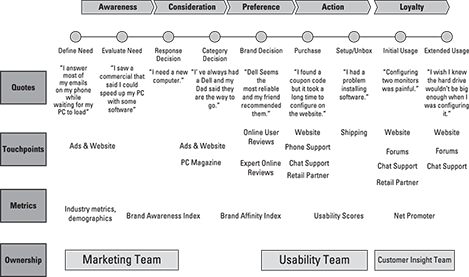
Figure 7-5: Journey of a consumer purchasing a laptop computer.
One of the core ideas behind mapping the customer journey is that it helps employees understand how their role has an impact on sales and revenue, even if they don’t directly sell or market to customers. The map should provide ideas for stakeholders to develop ways of treating the customer more holistically, rather than perpetuating a fragmented experience where each department rules an isolated fiefdom. It’s like telling your story to one person on a phone call, getting transferred to someone else (of course, being placed on hold first, for who knows how long — ugh!), waiting for the next person to talk to, and then having to restate your information all over again to that individual!
Define the Customer Journey
Building a customer journey can sound like something akin to writing Homer’s Odyssey — a lengthy, complicated and time-consuming exercise. While it’s important to do research and include the relevant stakeholders when mapping a customer’s journey, it doesn’t have to be overly complicated. In fact, it should be just detailed enough to communicate the stages, touchpoints, and influences that lead to actions.
 Ernest Hemingway is attributed with writing a six-word story: “For Sale: baby shoes, never worn.” He considered it his best work. If the Nobel Prize winning author of The Old Man and the Sea finds such value in only six words, then surely a customer journey doesn’t have to be long, either. When mapping the customer journey, start simple and think Hemingway instead of Homer.
Finding the data
The customer journey should be based on data that describes reality, not any idealistic image or impression you might have. Here are approaches for gathering data to build the customer journey:
· Look for existing data: Before planning an extensive research campaign, look for existing sources of information.
Surveys, customer interviews, and call logs to customer support usually have great insights into what the customer experiences. When the data’s already collected, there’s no reason not to use it.
· Follow Me Home: One technique for conducting your own primary research is a technique called Follow Me Home. As the name suggests, you follow customer volunteers to their house or workplace and observe them.
Intuit (maker of QuickBooks and TurboTax) used this extensively at one time. The idea is to immerse yourself into your customers’ typical lives to understand how they use and perceive your products and company.
This is a great opportunity to get quotes and interview people face to face. Most importantly, it gives you an opportunity to observe what customers do rather than rely on what customers say.
· Analytic thinking: If you have a good idea about how the process works, you can start by putting yourself in the customer’s shoes and walking through his journey.
This can be an easy way to get a journey map off the ground, but be prepared to validate your thinking and make room for corrections. You don’t want the journey to be based just on what you think.
· Stakeholder interviews: Interview the sales team, the marketing team, accounting, a support person — anyone who has direct contact with customers at different stages.
Look for patterns but don’t immediately dismiss one-off data points — look to corroborate them with later methods and data.
· Survey customers: Surveys are one of the most efficient ways for collecting data from customers. Find a way to survey current, former, and prospective customers, and have them describe their process for deciding, purchasing, and using a product.
Look for patterns and consider using third-party research firms that can present a more objective face to customers who may engage with your organization and its competition.
Sketching the journey
With some data at your disposal, it’s time to sketch the journey. Start with a persona, or at least a specific customer segment, and then work from general to specific details. You can sketch out the journey using paper and pen, a whiteboard, or a charting program like Microsoft PowerPoint. You can follow along with the figures in this section by using PowerPoint.
1. Pick a persona or segment
With customers segmented by demographics and behavior, you have many of the important pieces of the customer journey ready. It helps to create a customer journey map for each of your personas. In many cases, some or all of your personas will share similar goals, touchpoints, and journeys, so you can consolidate later. (See Chapter 5 for more detail on creating personas.)
Let’s start with a persona called Pragmatic Phil for a consumer electronics device like a laptop computer. Phil’s computer takes a long time to boot up, crashes frequently, and has limited memory, causing Phil to delete files to make room for new software. The details of Phil’s persona suggest that he’s value-oriented (seeks out deals) and is not a technology laggard, but doesn’t need cutting-edge technology, either. His goal is to have one PC that he can use for both work and personal use. It should be durable but also compact enough to take on airplanes and watch movies with his kids.
2. Determine the stages
As the name “journey” suggests, journey maps are usually constructed around a sequence of events that happen in a timeline. The timeline can then be broken into stages and then smaller steps.
For each stage, be sure to focus on the goals of your customers and what they are trying to accomplish.
If there are some existing stages from prior research, use those. It’s likely they’ll be similar to the five phases discussed in the sales funnels (Awareness, Consideration, Preference, Action and Loyalty); that’s what we’ll start with, as shown in Figure 7-6:
· Awareness: Phil’s computer is getting slow and he’s contemplating getting a new computer or perhaps just trying to get it fixed. He talks to his friends about their computers and what he should do. He eventually decides he needs a new laptop.
· Consideration: Next Phil starts doing research to see what new laptops cost and what the features are. He’s price conscious but wants something that will last. At this stage, he’s researching many different product models.
· Preference: Phil narrows his choices down to a few brands and products based on research and recommendations from his friends.
· Action: Phil makes his decision to purchase a new laptop from the Dell.com website. He receives it a few weeks later, takes it out of the box, sets it up, and begins to get used to the fast, new machine.
· Loyalty: Phil’s been using his Dell computer for several months. He’s taken it on trips, on airplanes, and back and forth from work and his home. There are parts of the hardware and software he likes and parts he wishes were better. He’s mentioned to a friend that he wishes the hard drive had more space and that it was lighter, but he’s already recommended it to two colleagues.
![]()
Figure 7-6: Start with the stages of the journey.
3. Define the steps
From the research, construct a sequence of major steps the customer takes from awareness to post-purchase. The steps are basically more finely grained segments to describe the sequences through the journey. The steps often, but don’t always, align with the higher level stages.
Figure 7-7 shows the stages Phil goes through when considering a new laptop. I use a circle to differentiate the steps from the stages used in Step 2.
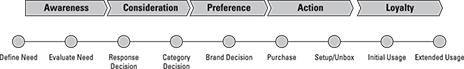
Figure 7-7: Add more finite steps to the stages.
4. Identify the touchpoints
A touchpoint is a physical or digital interaction your customers experience during their relationship life cycle with your product or service. Here are some examples of common touchpoints:
· Website
· Salesperson
· Store
· TV and radio advertisements
· Search engine results
· Direct mail
· Social media platforms such as Twitter and Facebook
The example PC purchasing journey identifies the touchpoints as advertisements, the product/company website, and different support channels like chat, phone, and forums, as shown in Figure 7-8.
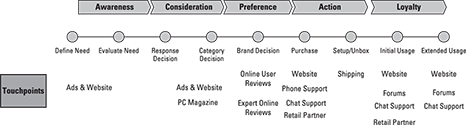
Figure 7-8: Touchpoints added to the customer journey.
5. Identify customer questions at each stage
During the research stage, such as when conducting the “Follow Me Home” technique, ask your target customers what questions they have about the product or service. This helps craft branding messages, opportunities for product improvements, and the metrics to collect to determine how well you’re addressing each stage. Figure 7-9 shows examples of representative customer quotes to capture the sentiments at each stage.
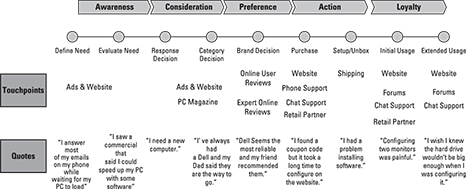
Figure 7-9: A few quotes can shed light on opportunities for improvement.
It’s good practice to use the most precise metrics available to quantify an experience. However, a single quotation from a user will often convince and compel more people to action than any metric ever could. Look for representative quotations that indicate the challenges and opportunities at each stage.
6. Find the pain points
At each step, understand where the customer, or prospective customer, encounters barriers or friction to making a purchase.
Here are several pain points you can identify through the PC journey for Phil:
· Awareness Stage
· Prospective customers aren’t aware of the company.
· Prospective customers don’t know a product exists.
· Prospective customers aren’t aware of their need for a product.
· Consideration
· Customers misunderstand features and product offerings.
· The perception of quality is low.
· The perception of value is low.
· Customers are unable to find information about your company/product.
· Preference
· It’s unclear what features differentiate the products.
· Technical review details don’t resonate.
· Competitors appear stronger.
· Action
· Configuring a PC is complicated online.
· It takes three to five weeks to receive the laptop.
· The setup process is difficult and time-consuming.
· Loyalty
· Certain software downloads corrupt the operating system.
· The hard drive fills up fast.
7. Define metrics for each stage
It’s likely that your organization collects at least a few metrics already. In defining the metrics for each stage, look for metrics that are already being collected in your organization or by a third party, or attempt to collect them yourself. I cover metrics for the different phases of the customer journey in detail throughout Part III.
Here are some examples of metrics for the stages in the PC journey.
· Awareness Stage
· Annual Computer Sales: Understand the current market of how many PCs are sold and the average sales amount.
· Average Life Span of a Laptop Computer: Knowing the typical churn rate helps to anticipate the need for existing customers.
· Advertising Recall: Understand if prospects recall your advertising message or associate your brand to features and products.
· Consideration
· Product Market Share: Track which models are sold the most and what the trends are. This information is often publicly available for many industries.
· Feature Affinity: Identify which features are driving sales and word-of-mouth.
· Preference
· Brand Leaders & Laggards: Quantify how often a brand is mentioned relative to its competition (see Chapter 9).
· Social Media: Find the number of mentions, especially positive ones, on social media platforms like Twitter and Facebook. Use a free version of a social analytics tool such as Topsy (http://topsy.com/) or Social Mention (http://socialmention.com/) to help you determine what customers are talking about and their sentiment toward your company or product.
· Action
· Click-Through Rates (CTR): The percent of visitors who are clicking on call-to-action buttons like “buy,” “register,” or “add to cart.”
· Shopping Cart Abandonment Rate: The percent of visitors who had items in their carts but never purchased them.
· Average Time on Site: This is a measure of engagement. If users don’t spend much time browsing a website, there’s less opportunity to connect with them and convert browsers to buyers. Time on site and other engagement metrics can be measured with website analytics tools, including Google Analytics.
· Loyalty
· Net Promoter Score (NPS): Asking how likely customers are to recommend a product is a good way to measure word-of-mouth. For details about measuring customer loyalty, see Chapter 12.
· Likelihood to Repurchase: For products and services that are used repeatedly (for example, rental cars and hotel visits), you’ll want to have as many customers with a high propensity to repurchase the product.
8. Identify who is accountable for each stage in the journey
A final step in completing your journey map is to be sure someone is accountable to each stage — and ideally, each step. Different disciplines, from product development to marketing to usability, know their domain and metrics best. These teams will likely be familiar with relevant third-party research on customer habits and demographics, and know how to measure the touchpoints.
One of the key goals behind the journey map is to identify opportunities for improvement. If you find problems and have some ideas but no one is accountable for implementing them, then the full potential of the journey map won’t be realized.
9. Uncover the opportunities
One of the main goals of the journey map is to fix problems and propose solutions that aren’t as readily noticeable when the journey is fragmented.
In a “Follow Me Home” conducted at Intuit (I describe this earlier in the chapter), small-business owners were observed at their location of business while checking out customers on their point-of-sale (POS) registers. At the end of the day, the merchants would then export their data from the POS machine and import it into QuickBooks. This was a clear pain point for the customers, even if some didn’t directly articulate it. The design team wondered if they could eliminate that step and came up with QuickBooks POS — an integrated check-out and accounting solution. Be honest about identifying and mapping the pain points. From pain comes opportunity. Look at each of the pain points as an opportunity for innovation and improvement — not just as damage control.
10. Periodically validate
When you create your first journey map, you’ll likely have made some assumptions and worked off data that will become stale over time. Plan on revisiting your journey map to see what information has changed and needs to be updated.
If critical pieces of information become invalid, like shifting customer demographics or new competition, an out-of-date journey map may be worse than no journey map at all.
Flag areas that change frequently and be sure people who are accountable for the stages have a way of getting the latest data and can update the journey map.
Making the map more useful
Here are three important guidelines to make your journey map more useful and effective.
· Make the journey map interactive: As more work goes into a journey map, it will inevitably get bigger and packed full of information. Trying to fit all that on one flat page may get unwieldy.
Consider having an HTML version of your journey map that allows your organization to drill into the stages. Some organizations even connect their internal sales and metrics systems right into the stages of their journey maps.
· Make it interesting: You don’t have to stick with the typical flow-chart shapes of circles and squares.
If you need inspiration, look at a subway map with symbols and how a lot of information can be conveyed in a dense graphic.
· You don’t have to include everything: The more dimensions you add, the more complex the journey map becomes. For some phases, you’ll need to drill down to many details, such as in the online purchase process.
It may make more sense to include these details on an auxiliary map (hyperlinked from an electronic version) that allows the organization to access it without getting bogged down in the details.
All materials on the site are licensed Creative Commons Attribution-Sharealike 3.0 Unported CC BY-SA 3.0 & GNU Free Documentation License (GFDL)
If you are the copyright holder of any material contained on our site and intend to remove it, please contact our site administrator for approval.
© 2016-2026 All site design rights belong to S.Y.A.