Marketing Automation For Dummies (2014)
Part IV. Mixing, Scoring, and Reporting
Chapter 13. Generating Reports
In This Chapter
![]() Understanding the correct metrics to use
Understanding the correct metrics to use
![]() Defining MQL reports
Defining MQL reports
![]() Leveraging SQL reports
Leveraging SQL reports
![]() Gauging the true value of marketing
Gauging the true value of marketing
Understanding how to prove the value of your marketing efforts is the best way to grow your department. Marketing used to be a very subjective art. Still today, most marketers are looked at as money pits, where money goes in and no tangible results come out. But marketing automation changes the notion that marketing has no value, because lead tracking and CRM integration allow you to see every touch point and the resulting impact to your organization and bottom line.
Marketing automation includes many of the same metrics you have without marketing automation. Open rates, click rates, and bounce rates are all the same. The major difference between your current reporting and reporting with marketing automation is the fact that the reports generated with marketing automation can help you understand your lead flow and the value of a campaign. You can measure the size of your lead funnel, the speed at which a lead moves through the funnel, and the efficiency of your funnel to convert a lead into an opportunity.
 Marketing automation gives you more data than you are probably used to having. With a single tool doing the job of many former tools, you have the ability to see a lot of information you never had access to before. Don’t try to dig too deep at the beginning. You can easily get analysis paralysis with marketing automation reporting because you can get lost in the amount of data you need to sift through. Keep your reports short, simple, and easy at this stage.
In this chapter, I show you how to craft your marketing automation campaigns so that you can generate these reports. I also help you better show the value of your efforts by setting up Marketing Qualified Lead reports, and you see how to read these reports to refine your programs.
Understanding Appropriate Reporting Methods
Marketing automation allows for new ways of marketing and reporting. Following are three appropriate reporting methods that you can use to measure your results, evaluate how people move through your marketing stages, and track how effective your marketing is:
· ROI reporting: Return on Investment (ROI) reporting tells you how much money your marketing campaign returned for each dollar spent. To use ROI reporting appropriately, use it only when money is spent at the start of a campaign and money is returned at the end. ROI reporting is usually a long-term report for lead sources.
For example, if you paid $100 to acquire a lead with a paid search campaign, your ROI reporting could last for months if it takes months for a lead to make a purchase. I discuss ROI reporting in more detail a little later in this chapter.
· Velocity reporting: Velocity reporting tells you the speed at which a lead moves through your funnel. This is a very important metric, with no way of being tracked without marketing automation. Using velocity reporting appropriately allows you to increase the speed at which a lead converts. That way, you can increase the number of leads in a given time period and close more leads sooner.
Closing more leads faster means having money in your bank sooner, which has more value than money in the bank later. This is especially true for software-as-a-service (SaaS)-based or recurring revenue businesses. Money in hand today is worth more than money in hand tomorrow. I explain velocity reporting later in this chapter, in “Gauging Future Lead Flow by Tracking Lead Stage.”
· Efficiency reporting: Efficiency reporting compares the number of leads generated to the number of leads lost as a percentage over time. For example, if you generate 100 leads today, and 50 leads convert to sales-ready leads while the rest are lost, your efficiency of leads is 50 percent.
Using efficiency reporting appropriately helps you understand whether you’re attracting the correct people as leads. Because good leads have a much higher efficiency than bad leads, your efficiency reporting helps by showing you whether you are wasting money attracting leads who never convert.
Implementing Marketing Qualified Lead Reports
Marketing-qualified leads (MQLs) are leads that meet the basic requirements to leave marketing’s hands and be passed to sales. Most leads that come in to your funnel will, you hope, be converted to an MQL that is passed to the sales team. After the sales team members agree that the lead is qualified, they accept it and change it to a Sales Qualified Lead. (I discuss Sales Qualified Leads in the upcoming “Implementing Sales Qualified Lead Reports” section of this chapter.)
MQL reports can tell you a lot about your lead flow. The next sections show you how to understand and set up MQL reports, and how to use velocity and efficiency to evaluate your MQL leads.
MQL is a standard term used in marketing automation. If you use another term to denote a lead passing to sales, make sure that you also understand the MQL terminology and what it means to your lead funnel so that you can measure and report on your growth.
Understanding an MQL report
MQL reports are tools to help you manage and measure your lead hand-off process. When passing MQL leads to sales, you need to keep track of the number of leads you pass and the number of MQL leads accepted by sales. Giving sales the ability to accept or reject the MQL leads gives you a check and balance on your lead qualification process.
Most organizations have a set goal of leads they need to produce each month, and MQL is the report used to measure this goal. MQL reports tell you whether your department needs to produce more or fewer leads in the future. The efficiency of your MQL stage helps you determine whether your qualification for MQL is correct. Figure 13-1 shows the formula for determining your efficiencies within your MQL stage.
![]()
Figure 13-1: Use an MQL formula to determine the efficiency of your MQL stage.
To measure MQL efficiency, take the number of leads that reach the MQL stage and divide it by the number of leads that make it to the SQL stage. The closer you are to 100 percent, the better your efficiency.
 If you’re not currently being measured on MQL efficiency, consider advocating for this metric. Many companies find value in the percentage of leads moving from MQL to SQL as a measure of how good your marketing efforts are.
Setting up your first MQL report
Your MQL report is easy to set up in your marketing automation tool. The ways to do this differ according to your tool. Some tools have prebuilt MQL reports that automatically track all the leads you mark as sales ready. Other tools require you to manually set up MQL reporting.
To set up your MQL report, you need to obtain the following three data points:
· How many people are MQL at a given time. You need the ability to see the number of leads marked MQL over a period of time. A basic list with a sort-by-date field is fine. If your tool has a built-in MQL report out of the box, you don’t need to do anything. If it doesn’t, you need to create a custom list or create segmentation to keep up with this data for you.
· How long it takes people to leave the MQL stage. Time is used as a part of the formula. Just pick the time frame you want to measure results in. I suggest quarterly, biannually, and annually.
· The cost of generating each lead in the MQL stage. The simple way to calculate your ROI is to take your marketing budget over a period of time and divide it by your MQL number to arrive at what you’re paying for each MQL lead. You should use this number to see whether you are spending more or less money over time to generate the same result. This number is a much more accurate representation of your direct results from specific actions, taking into account the time it takes for those results to yield results.
You need to use a rolling average of costs over a period of time. So, for example, if you want to track how much it cost you to produce the MQL leads in Q1, and your average velocity of net new leads to MQL is 30 days, you need to account for your 30-day lag in results. To do so, account for your costs beginning 30 days prior to Q1, and stop 30 days prior to the end of Q1. The result tells you how much money you spent to generate the majority of the MQL leads.
Remember that the ROI report of a stage is not 100 percent accurate. You are assuming a lot of averages, and in marketing, people don’t operate as averages. They operate as individuals. So use ROI reports as a guide. You’ll notice that sometimes ROI can’t explain why you had more leads, or fewer leads, during a time period. So look for large trends and understand this report as a guide, not a fact.
Creating SLAs with sales
A service-level agreement (SLA) is an agreement with your sales team to ensure that they are working leads in an appropriate time frame. Harvard University studied the follow-up times from leads after they were sales ready, along with the effect of follow-up times on close rates. The report shows that companies that try to contact potential customers within an hour of receiving queries are nearly seven times as likely to have meaningful conversations with key decision makers as firms that try to contact prospects even an hour later. Yet, only 37 percent of companies respond to queries within an hour.
Your SLA helps ensure that the work you are doing is not going to waste. Your SLA is your check and balance with the sales team to hold them accountable for following through on your efforts.
When you create your SLA, remember that the leads you pass over are qualified based on what you and your sales team agree on. So the leads should be good and should be accepted. Leads that are not called within the SLA time frame should be counted as wasting company assets and accompanied by repercussions of some kind. The duration of a lead in the MQL stage should be fixed by your SLA. That way, your velocity report will tell you whether the sales team is adhering to their SLA. If your SLA states that sales reps have two days to accept or reject any MQL lead, and your velocity is three days, you know that the sales team is dropping the ball and not holding up their end of the bargain.
Implementing Sales Qualified Lead Reports
Sales Qualified Leads (SQLs) are MQLs that the sales team accepts. After an MQL becomes an SQL, it is out of the hands of the marketing team and all reporting is based on the sales opportunity stage until closed. The next sections show you how to understand and set up SQL reports and how to use velocity and efficiency to evaluate your SQL leads.
Work with your sales team to craft an SQL workflow. Let them know how they will receive MQL leads, where to mark them as accepted or rejected, and what to do with the SQL lead after they get it. Usually, these parameters are up to you to dictate and set up. To mark the MQL leads as SQL, most companies use a field in the CRM tool that is synced back to the marketing automation tool. Lead Status is a good field to use for this purpose.
Understanding an SQL report
The SQL report tells you how efficient you are at creating leads for the sales team. Your MQL report lets you know how many you are creating, but SQL reporting lets you know whether the sales team agrees with your choice of leads. Because two teams are involved, the check and balance system has proven very effective at helping both departments work together.
When measuring SQL, use an acceptance rate to measure your efficiency. Your acceptance rate is the number of leads that reach the MQL stage divided by the number of leads that make it to the SQL stage, as shown in Figure 13-2. The closer you are to 100 percent, the better.
![]()
Figure 13-2: Use an acceptance rate to determine the efficiency of your MQL stage.
Setting up your first SQL report
Your SQL report uses some of the same data as your MQL report, but it can be a bit tricky to set up because it is dependent on data from sales. Here are the steps involved in setting up this report:
1. Figure out how many people make it to SQL over a period of time, and calculate the cost of generating each lead in the SQL stage.
2. Choose a field to use for tracking SQL in your CRM.
I suggest using Lead Stage as the field for passing MQLs and asking sales to change the Lead Stage field from MQL to SQL. Use an automation rule. That way, when a lead is marked as sales ready, the Lead Stage field is also marked as MQL. This setup passes the leads to the CRM for the sales team to easily filter on, and then changes the field to SQL after salespeople accept the leads. Figure 13-3 shows a lead being marked MQL and SQL.
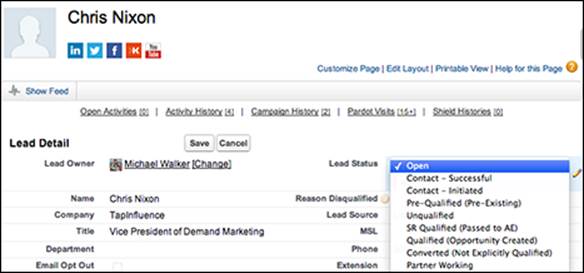
Figure 13-3: Pass leads to the CRM as MQL so that the sales team can change them to SQL.
3. Measure lead flow into the SQL stage.
If your tool has this report out of the box, you do not need to do anything. If it doesn’t, you need to create a custom list or segmentation to keep up with this for you.
You also need the ability to see the number of leads marked SQL over a period of time. A basic list with a Sort by Date field is fine. Creating this list is an easy automation or segmentation that looks at a custom field in your CRM Lead Stage field and puts these people on a list.
4. Measure your costs.
You have two ways to measure costs: simple and advanced. The simple way to calculate your ROI is to take your marketing budget over a period of time and divide it by your SQL number. For a more accurate representation of your direct results from specific actions, taking into account the time it takes for those results to yield results, you need to use a rolling average of costs over a period of time.
For example, if you want to track how much it cost you to produce all SQL leads in Q1, and your average velocity of net new leads to SQL is 33 days (MQL average time plus your SLA from sales), you need to account for your 30-day lag in results. So account for your costs beginning 30 days prior to Q1, and stop 30 days prior to the end of Q1. This is the money that generated the majority of the SQL leads.
5. Measure time.
Time is used as a part of the formula. Just pick the time frame over which you want to measure results. I suggest quarterly, biannually, and annually.
The SQL lead reports show you how many leads you are passing to the sales team and how many they are accepting. Many SQL reports are just a continuation of the MQL reports. So, if you have MQL reports, copy them and tweak them to get your SQL reports.
Tracking marketing-sourced leads
Many marketers are measured on how many leads they pass to sales, as well as the percentage of those leads converted into opportunities. Getting visibility into the leads after submitting them to the sales team is a bane for many marketing departments. After implementing a marketing automation tool, both sales and marketing will have a singular view of a prospect, lead, account, and opportunity. Marketing can easily see whether leads are being followed up on, worked, and created into opportunities.
The benefit for marketing is more than just presales lead visibility. On average, only a small percentage of leads passed to sales ever make it to a phone call with a salesperson. You can attribute this situation to the fact that salespeople want to work only the opportunities that offer the best chance to close this quarter, and don’t want follow-up on fresh leads. Or sales reps might distrust the quality of the leads being passed on to them. Either way, a large number of leads passed to salespeople either can’t or won’t be worked for various reasons. By giving marketing the visibility to leads that are in the salespeople’s hands, the marketing team can see the leads falling through the cracks and bring them back into the marketing funnel.
This capability can easily help the marketing team reach their revenue goals by getting more value out of leads already created. With the long length of many B2B sales cycles, the ability for the marketing team to pull leads back and track what happens to marketing-sourced leads has allowed many companies to drive more revenue out of their existing performance.
Looking at the Influence of a Campaign on a Lead
Determining what makes a lead take a specific action is, honestly, a fool’s errand because it assumes that a lead exists in a vacuum and the only factor in the lead’s actions is the campaign. However, I meet a ton of people who have to show campaign influence to a boss to prove their efforts. The following sections show you the best way to show the influence of your marketing efforts on your company’s bottom line.
I don’t recommend this theory of reporting, but I still show you how to create this report in case your company requires you to include it in your reporting.
Creating influencing campaign reports
You have many ways and many different types of reports to use to gather campaign influence data. The main factor for determining how you generate this report is your tool set. Some marketing automation tools can report on this easily; some can’t. To know whether your tool has what it takes, ask the following questions of your vendor:
· Is campaign influence built-in? If your vendor says yes, ask one of the follow-up questions in the following bullets to further confirm the capabilities. If your vendor says no, see whether your CRM can determine the campaign influence, or ask your vendor what it would take to make this capability work in your marketing automation system.
· How do I configure it? If configuring the campaign influence capability is too complicated, evaluate your CRM as the option. A good tool should allow you to tag a prospect with every campaign and easily see the last campaign the prospect was engaged with before she converted. Even good tools that can track the last campaign can’t always report on this, so be aware.
· Can I use my CRM? To use your CRM tool for this feature, make sure that your CRM can integrate with your marketing automation tool to pass on campaign information. Depending on your CRM, this process can be easy or complicated. Either way, you need your CRM admin to help set up this capability, as shown in Figure 13-4.
Figure 13-4: Your CRM may substitute as an influencing campaign reporting tool.
Limiting factors of influencing campaign reports
Many issues crop up with using influencing campaign reporting. If you are the department asking for this report, I suggest asking yourself what you really want to find. If you are trying to find a silver bullet, you are on a fool’s errand. Statistical averages are great to see on a large scale, but determining whether a campaign had a direct influence is very hard to prove. If 100 percent of your leads all convert on the same campaign, I suggest running the campaign to everyone. However, that still does not suggest that it had any bearing on a single deal closing. Using influence to identify effective campaigns is not always the best way, and there are other ways to identify great campaigns, which I walk you through. The reasons I’m against using influence reporting to evaluate the effectiveness of your campaigns are as follows:
· People live in bubbles. This type of report lacks in accounting for outside influences. Such influences can never be accounted for. So you run the risk of attributing significance to a campaign that might not have been significant at all.
· Singular channels get the credit. You can tie this report to only a single campaign, but you’re marketing across multiple channels at one time. What if a lead is affected by social media, email, and your website all in the same day? In such a case, the last interaction shouldn’t receive all the credit.
· Attribution modeling doesn’t work. A conversion is not a singular action; instead, it’s a combination of many smaller interactions moving someone toward a final action. Attributing all the work to a single campaign neglects the effort of your supporting campaigns and may lead you to rely too heavily on your “silver bullet” campaign. See the “Be aware of the core flaws in attribution modeling” sidebar for more about the problem with reading too much into one campaign’s apparent effects.
Be aware of the core flaws in attribution modeling
Despite its wide adoption and good intentions, attribution modeling has not done marketers any favors. This sidebar explores why attribution modeling devalues your role, points out the major flaws in its assumptions, and suggests other ways to consider looking at your data.
Attribution Modeling Assumes Too Much
Attribution modeling uses a linear progression of events to attribute value to each campaign in succession. If you saw this campaign and then bought the product, the purchase must have been a result of your previous marketing engagement, right?
This is the basic premise of attribution modeling. It assumes that all other events are held constant and that the only impact on your decision was the marketing campaigns you touched. This is the model’s first major flaw.
The attribution model doesn't account for social perceptions, society's norms, personal beliefs, or any of the thousands of other influences we have in our lives. Marketers cannot — and should not —assume that a single campaign is the only reason a person engages.
This truth has been proven with multiple bits of research. A famous example you may remember is the "theory of seven touches," which stated that after being exposed to an idea seven times, it becomes a part of your evoke set. Being in an evoke set means that you would know, understand, and remember the stimulus or idea the next time you were exposed to it. If you asked people to list fast-food places, they would quickly be able to ramble off a list from memory. This list would represent their evoke set of fast-food places. However, if a person sees campaign number eight, and marketers attribute all revenue to this last campaign, they are neglecting the other seven campaigns, which did the majority of the work for them.
Attribution modeling does take multiple campaigns into account by suggesting that ROI should be shared across all of them. But this amounts to another giant fallacy because it assumes that each campaign had an effect on the prospect, or that she even noticed it at all. Marketers have no easy way to tell the effect of an ad on a person without asking that person, and even then, you never know, so you’re making a lot of big assumptions on things that can never be proven.
Attribution Modeling Overemphasizes ROI
ROI allows you to prove the direct return on dollars spent. In the marketing world, this means showing the value of any campaign by tracking its direct impact on revenue. Now you come to the second big problem with attribution modeling: The model's focus on ROI forces a marketer to look only at spending, which is an unactionable, lagging indicator that is not tied to any core business goals or representative of any real marketing value.
ROI can be useful in planning, but only to the extent that it allows you to ask, "Do we do this again?"
ROI does not tell marketers what they should change within their campaign. It does not tell marketers why the campaign failed, nor does it tell the business anything about its future. ROI tells a company only about its past. Companies' main goals are usually tied to their future rather than their past, because they value things that can make them money faster, help them better predict future outcomes, or maximize efficiencies. ROI is not used to help accomplish any of these goals, yet it is the way we prove our value and is the only number attribution modeling focuses on.
When attribution modeling attempts to break up revenue and attach it to a campaign to prove value to a company, it does so only by showing how well the money was spent, not how well it helped accomplish business goals. This type of reporting keeps marketers from proving their real business value because it doesn't account for all the value marketing is actually producing — only how well marketers spent their budget in the past.
There Is a Better Way
A much better way exists to show the value of your efforts; you just have to look to find it.
Consider matching your efforts to core business goals. This alignment will help you to be truly indispensible, rather than be viewed as a cost center. Here are some items to measure and consider when it comes to proving the value of your marketing campaigns:
· Know the time value of money (TVM). This basic economic principle should be one of your major marketing value propositions. The TVM principle states that a dollar that comes in today is more valuable than a dollar that comes in tomorrow. This is because it can be put to work much more quickly, yielding a higher return. As a marketer, if you can help speed up the revenue cycle and bring money into the organization faster, you are driving real value.
To speed the revenue cycle, you need to track the average speed of a lead moving though your life cycle. Knowing that your campaign has shortened the sales cycle by days equates to serious dollars over the course of a year. Think about it this way: If you have a 30-day sales cycle and you shorten it by two days, you gain an extra month of revenue each year. That's a massive increase in revenue!
· Predict the future. Knowing what the future holds is another major business goal. CEOs pay a lot of money to get reports on future outlooks, and many people are dedicated to predicting future trends. You should be one of them. Instead of just reporting on current lead flow, report on future lead flow. You can easily report on future lead flow with modern marketing technologies. Having the power to predict and deliver will help you become a valued asset to your business, taking the focus away from your efforts and keeping the focus on your results.
At its core, attribution modeling tries to answer some very complex questions quickly and easily. If you subscribe to the attribution model, make sure that you are aware of its shortcomings and consider investigating other ways to prove your value. Otherwise, you'll always just be looked at as a cost center and not a business driver.
Gauging Future Lead Flow by Tracking Lead Stage
One of the best uses of marketing automation is gauging future lead flow. Marketing automation can gauge future lead flow because it gives you visibility into your leads, telling you where they are and the average time you can expect them to move to the next stage. Tracking by lead stage allows you to plan for resource allocation and future business direction.
The following sections show you how to track your future lead flow by crafting a lead stage model and creating a baseline. You can create your lead stages at various levels, so I discuss the specifics. I also show you how to create a baseline to gauge your progress or failures.
Creating lead stages
Start by creating three lead stages. According to a research paper I published, titled “State of Demand 2013” and put out by ExactTarget in 2013 (http://pages.exacttarget.com/EN-StateDemandGen), the average lead goes back to Google to research a purchase three times before talking to a salesperson. The research also states that the higher the price of your product/service, the more stages you are likely to have. So start with three stages, as explained in the following list, and move up or down from there as time goes on if you feel it is necessary.
· Lead stage 1 — No identified need: Use your first stage to identify leads who are just beginning their journey for a solution. This means that most of the time, leads don’t have a refined pain point yet. For example, when searching for marketing automation, it’s common to search first for email marketing or something other than marketing automation.
· Lead stage 2 — Identified need, no B.A.N.T.: The second stage of a lead in your marketing cycle is a lead who knows what he needs but can’t purchase yet. Remember, most B2B purchases happen with a committee, so a single person might push for the idea, but he has to have agreement from the entire team before he can set up demos or have the Budget, Authority, Need, or Timeline (B.A.N.T.) to purchase.
· Lead stage 3 — The short list: Leads in stage three have B.A.N.T. and are ready to set up their demos. A great statistic to keep in mind at this stage comes from the Consumer Executive Board. Its research states that after a lead gets to a conversation with a salesperson, he is already two-thirds of the way to a purchase. This means that he has a short list of solutions in mind well before reaching out to set up a demo. So the last stage of marketing is used to prove why the prospect should set up a demo with you.
Creating your lead stages is very easy. Either your tool is set up to run this report, or it is not. If it is not, you just need to create three custom segments to drive your reporting on lead stages. Ask your vendor before you start building anything to see how the vendor suggests accomplishing this report.
Understanding how to measure velocity through stages
Measuring the velocity of a lead through the stages is very important because each lead moves at a different pace. Understanding the group average makes it easy to predict with a great degree of certainty what will happen in the future. This is how you will calculate your future lead flow. To create this report accurately, you need to set up the following criteria:
· Create lead stages. Your lead stages need to be set up prior to developing a velocity report. You can either create a special report in your tool, if you can, or simply use lists to keep up with this information. I discuss lead stages in the previous section in this chapter.
· Measure leads into each stage. The number of leads that move into each stage is the first step to generating the velocity report. You need to be able to look back on this number as well so that you can compare lead volumes from one time period to the other.
· Measure when the prospect moves to the next stage. The difference between being in and out of a stage gives you your average time.
· Use the lead score to measure stage. Lead score is a great way to measure a person’s lead stage. Score is great because it is a gross representation of a prospect’s activity. The more activity the prospect engages in, the farther along in the cycle you can assume the prospect is. You can also get more advanced and use a lead score and a stage as separate data points in your tool. Lead stage in this case is changed only if the person starts to engage with content tailored for the next stage.
· Measure average time in a stage. This number gives you the core metric you are after. Knowing the average time spent in each stage tells you whether you are speeding up your leads through the marketing funnel.
You can take this report to the next level by also looking at the number-one conversions that drive someone into each stage and out of each stage. This tells you on average what the number-one actions or campaigns are that get someone into and out of a stage.
Building a velocity report
If your tool is set up for advanced reporting, you should have a velocity report available to you. If not, you need to build it. Building this report can be easy or hard depending on the tools you have at your disposal. Here are a few easy ways to generate the report you need:
· Using a list. If you can create custom lists in your application, you can create this report on a very basic level. It will require a lot of manual work, but it is possible. Begin by creating three different lists, one for each lead stage. The lists need to be fully dynamic so that people can be added and removed based on a data point such as a score.
If you’re just starting with stages, you might want to consider breaking your total sales-ready score into three equal parts. Lead stage 1 would be all leads with a score of 32 and under. Lead stage 2 would be scores of 33–66, and stage 3 would be 67–100.
When using basic lists to keep up with your lead stages, remember to use a spreadsheet tool. Most lists don’t keep up with how many people are on them every day. They can show you this number each day, but not record it for analysis. You need to log in to your application and log this data into a spreadsheet for analysis.
· Using custom reporting. Custom reporting can open many doors for you. In the case of trying to determine your velocity of leads through your marketing funnel, customized reporting can automatically give you the analysis you require when you need it.
This reporting will be more complex than using a list, and it will give you more data, but it will also require a better knowledge of your tool and your specific requirements. I suggest going with this option only if you know your tool very well and want to take your marketing automation reporting to the next level. Customized reporting does have a few benefits.
You don’t want to start out with customized reporting. This type of reporting is for those who want to know how to grow their reporting in the future, and to be able to figure out what can be accomplished with their tool down the road. I suggest waiting for six months at the minimum before you begin messing with custom reporting, because it adds another layer of complexities to your tool and can be very cumbersome to figure out.
· Using tags or data cards. A tag, also known as a data card, is a feature in a few different marketing automation tools that allows you to add unstructured data to a person’s database record. Unstructured data is data that does not require you to set up a custom field, but is searchable and reportable. You can use tags instead of having to set up a custom field for a lead stage. This approach would be more flexible over time and is compatible with custom reporting.
Many custom reporting tools can keep up with your data and send you an email of the report on a daily basis if you prefer. This method takes time to set up, but over the long run it saves you time over using spreadsheets and doing the reporting manually.
Proving Value with ROI Reporting
Return on Investment (ROI) is a measurement of the money you spend on marketing compared to the money returned by your customers when they make purchases. Sometimes these reports can be very hard to generate because of
· Unclear data
· Multiple tools in use
· Spending and purchases happening over a long time
· Lack of a clear way to attach marketing efforts to an opportunity
When using ROI reporting, make sure that you set up your reports correctly and fully understand their limitations. You can then report on your value more accurately. Before diving into the next sections to learn about ROI reporting, consider the following points:
· Return does not always have to measure a financial return. For example, if you have the ability to measure Likes on your Facebook page, you can use that measurement as a return on your marketing investment. You can also assign a financial valuation on a Like, follow, or other engagement so that you can calculate a financial ROI on those actions.
· Consider large and small reports. Your measure of ROI can be for large items, such as the total budget this year, or for small items, such as the ROI of a specific campaign. When creating large ROI reports that encompass many smaller efforts, make sure that you use a consistent time frame. When using ROI to evaluate single campaigns, consider all the impact, including backlinks and other social sharing. When adding other outcomes, you should have a standard set of ancillary outcomes to evaluate so that you have a standard way to compare the ROI of different campaigns.
· Investment isn’t limited to money. Your investments in a campaign are not always strictly financial. Consider the time and other elements that go into the production. Adding your time into the equation helps you look at the campaign in terms of the full production cost, not just what you spent on the campaign.
Beginning with ROI reporting
Most marketing automation tools have built-in ROI reporting for the majority of your marketing campaigns. You want to keep a few things in mind when setting up your ROI reporting. The following ROI reporting is available for the most utilized marketing channels:
· ROI from email: I’m not a huge fan of ROI reports on email because many times email is used as a supporting campaign. I prefer to look at how effective my email was at moving someone to the next step in her marketing life cycle.
If, however, you are being judged on ROI, set up a few reports within your ROI reporting. Set up ROI reports for each type of email you send. This generally includes ROI on nurturing specific campaigns, ROI for newsletters, and ROI set up for other email blasts.
· ROI from social campaigns: Tracking the ROI on your social campaigns can be a very tricky task. The best way to track ROI on your social campaigns is to use custom redirects or special URLs for your social assets. You can accomplish these tasks out of the box with some tools or by using UTM parameters.
· ROI from SEO: When setting up your ROI reporting for SEO, you must attribute keyword searches to prospects. Doing so ensures that you can run a full ROI report on each key word. To set up your ROI reporting, use your default SEO report in your tool, or use URL parameters to parse this information.
 A person is likely to have many SEO searches throughout his or her research cycle. Keep track of the first SEO search term as well as all other search terms. These terms clue you in to which search terms are the most effective for finding new leads and supporting the buying cycle.
· ROI from Google AdWords: You can set up reporting by account, campaign, ad groups, keywords, or individual ads. Looking at each of these levels helps you to prove the value of your marketing. Figure 13-5 shows the structure of an AdWords account so that you can see how the ads are grouped together.
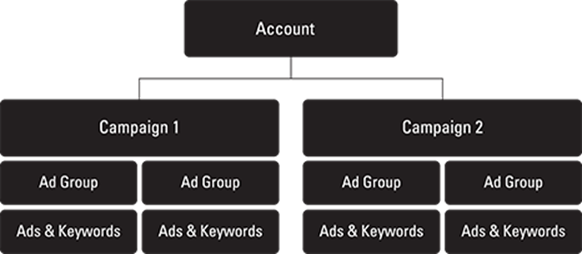
Figure 13-5: Set up reporting on multiple levels in Google AdWords campaigns.
· Account: Evaluating ROI on paid-per-click (PPC) marketing as a whole is best done by looking at the account level. This shows you the total ROI on all Google AdWords so that you can judge the effectiveness of your PPC marketing as a whole channel if you’d like.
· Campaign: Reporting for campaigns controls your settings and your budget. Looking at the ROI of campaigns helps you to understand whether you should refine your targeting. You can set up the ROI on campaigns natively, through your tool, or by passing information in the URL, as Figure 13-6 shows.
· Ad groups: You can set up your ad groups reporting by customizing your reporting tool inside your marketing automation tool, as shown in Figure 13-7, or by setting it up the same way as campaign tracking, using URL parameters.
· Keywords: Evaluating the ROI on the keywords in your paid search programs is accomplished out of the box with your marketing tool, or you can set it up by adding parameters to your URL, as in campaign reporting.
· Advertisements: Setting up the ROI for your advertisements is either a default in your tool or requires setting up custom URL parameters or custom reporting. I do not suggest evaluating the ROI on your ads, but rather the engagement and the amount of opportunities being created. These aspects should be much easier to track than ROI if you do not have this as a standard report in your tool.
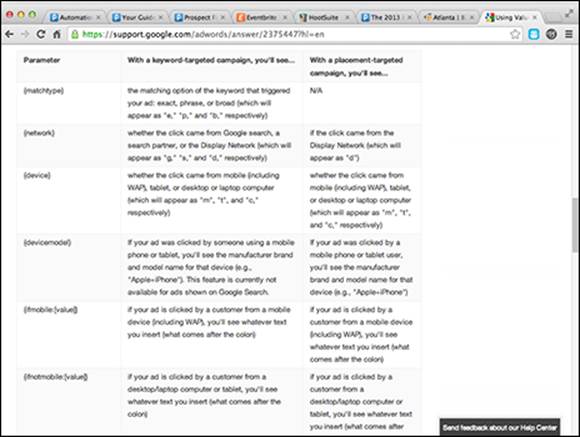
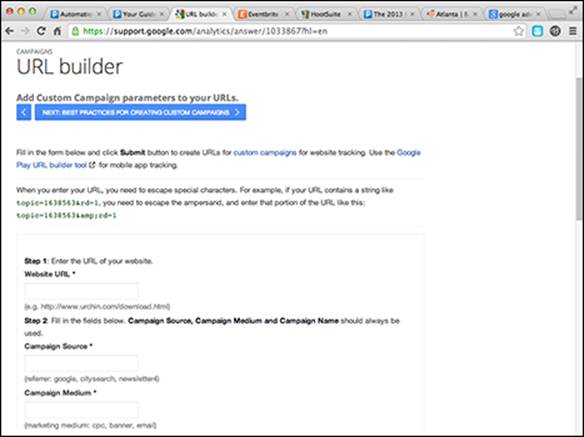
Figure 13-6: Use URL parameters on Google AdWords to track campaigns.
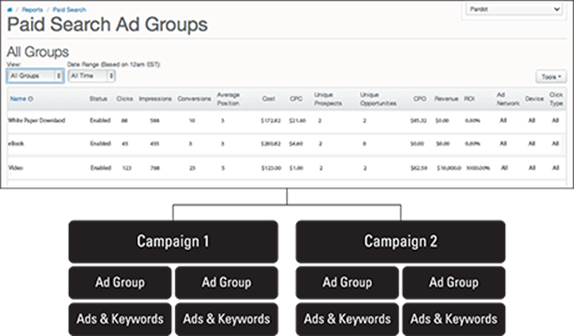
Figure 13-7: Set up ad groups by customizing your reporting tool.
The easiest way to track any PPC campaign is always by tracking the URL. Learning to use custom redirects and setting up specific campaigns for each is by far the simplest way to track ROI on a paid search campaign. Creating a specific campaign for each keyword is done manually, which is why it does not scale to hundreds of search terms, but works for those who have a limited number of paid search ads. You won’t need to create a specific campaign for each keyword if your marketing automation tool is integrated with your PPC channel, but most marketing automation tools integrate only with Google AdWords, which means that creating a specific URL for other PPC channels may be the best and only way to track those PPC channels’ effectiveness.
ROI reporting on paid search campaigns will be very difficult to do at scale if you don’t have this as a standard feature in your marketing automation tool. I’ve mentioned the use of parsing URL parameters, but it’s not an entry-level task, although tech-savvy marketers can handle it. If, however, you are at this level of reporting, I suggest making sure that you choose a tool that can accomplish parsing URL parameters out of the box. Doing so will remove a ton of manual labor from your workflow.
Adding and parsing URL parameters
Some marketing automation tools include URL parameters to allow for custom information to be passed via a URL. The main reason you need this feature is to have multiple URLs pointing to a single location and tracked at each entry point for each lead. Using multiple URLs to point to a single asset is commonly used for tracking which partner drives the most leads, tracking different channels’ effect on driving traffic to a specific event, and tracking multiple paid-search ads to a single landing page.
If your marketing automation tool does not support this feature, you can use the Google URL generator. Some of the more robust marketing automation tools allow you to integrate with the Google URLs to track extra data you want to pass along with your lead to make it easier to track multiple lead source elements such as source, campaign, medium, or type. This allows you to set up a URL from which you can distribute and track leads coming directly from it. The additional information you add into the URL will follow the lead along, making it easier to track where the lead came from, segment more effectively on the additional information, and report more effectively as well.
The main reason to use additional URL parameters is to save time and make tracking and segmenting easier. The URL parameters can automatically add further information to a lead record. For example, if you created a URL that drove leads from Facebook for your white paper, you might want to add on to each lead record that it was a white paper campaign and came from Facebook. All this information can be included in the URL so that when a lead clicks the link in Facebook, and then converts to download the white paper, the lead enters your system with all the information you need to prove the value of your efforts. The following figure shows the Help page from Google to help you set up your URL. Google’s tool makes setting up the URL very easy and opens your reporting doors much wider than they were before.
Limitations of ROI reporting
You have many types of reports in a marketing automation tool to help you evaluate your efforts. ROI is used for a very specific purpose, and it has limitations. Here are a few limitations of ROI reporting to be aware of:
· Does not account for time. ROI accounts for only the direct investment of capital, not all your investments of time or your opportunity costs. I suggest looking at time as part of your evaluations concerning where you should be focusing your time. Just because something has a high ROI doesn’t mean that it’s a great campaign to run. If your time cost is too high, your opportunity costs are high as well.
· Does not easily prove value of nonrevenue-generating campaigns. ROI can tell you an exact number only when you have money at the beginning and at the end. In the case of email, I advocate against using ROI as the measuring tool because there is no cost to the campaign and no direct cash in hand as a result. These nonrevenue campaigns are usually supporting a life cycle instead of generating a sale. It is better to use velocity and efficiency reporting to measure the effectiveness of these campaigns.
· Does not show the full value of a campaign. ROI puts too much emphasis on a single number, even though marketing is not a singular action. A marketing effort has hundreds of moving parts, and a single campaign might have many positive results. ROI is only one of the benefits to an organization. Branding, funnel management, and thought leadership efforts cannot be measured with ROI.
Keeping up with Marketing-Sourced Opportunities
Marketing-sourced opportunities (MSOs) are opportunities that marketing can prove are 100 percent generated by marketing efforts. In other words, MSOs would not have happened if the marketing team had not been involved. Most companies have a minimum threshold of MSOs that they need to meet. MSOs are usually shared with the sales team so that each salesperson knows how many leads to expect to receive from marketing over a given period of time.
MSOs can be tricky to keep up with but also very easy to keep up with if you know what you want to report on. The basic report for MSO leads can be very basic or a bit more complex, depending on your needs. Here are three easy ways to set up a basic MSO report:
· Using lists: You can easily set up an MSO report by using lists. Lists are the easiest way besides a prebuilt report that your tool may or may not have. To set up a list, simply use an automation rule to add people to a list after they have been passed along to sales. This approach gives you a list of all sales-ready leads. Then you can get a list of all opportunities the sales team creates and cross-reference the two against each other in Excel. Having the lists in Excel helps you see the number and value of MSOs easily even if your marketing automation tool doesn’t have this report as an out-of-the-box feature.
· Using CRM tools: Because your CRM has all your opportunity information, you can easily set up a custom field in the lead record to help you with tracking your MSO leads. Figure 13-8 shows an opportunity in Salesforce.com that includes a Lead Source field. The custom field is marked “Marketing” when any new lead is passed from marketing to sales. Having this field marked correctly means that the data will follow the lead to the opportunity stage, giving you the data in your CRM to correctly make your MSO report. Salesforce allows you to automatically populate fields in an opportunity record based on the contact record. Populating fields may require AJAX coding (or any special coding that your CRM may require), depending on your edition of Salesforce.
· Using automated methods: If your marketing automation tool is tied to your opportunities in your CRM system, you may have MSO reports automatically created for you out of the box. You should consult your vendor to see whether an automatic MSO report is possible and to find out what you might need to do to set it up. The good news is that this feature is available in most advanced marketing automation tools, so you should be able to have this report without too much work.
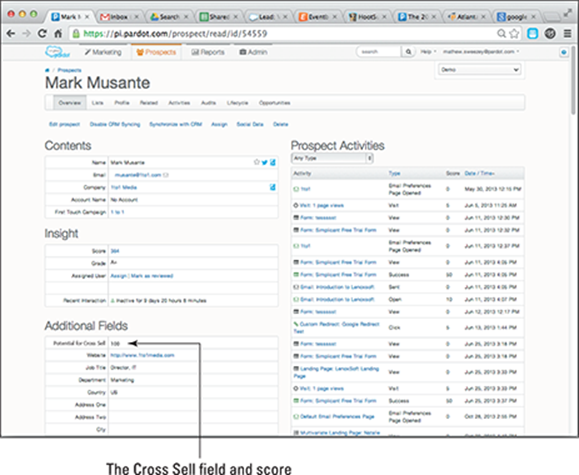
Figure 13-8: You can have a custom Lead Source field marked as “Marketing” when a new lead is passed on.
Looking at Smaller Metrics for Better Campaigns
You can use some very specific reports to evaluate smaller tactics and measure their specific impact so that you can improve the small tactical items for larger gains on the entire campaign. Here are some other types of reports to consider:
· Completion by goal demographic: Completion by goal demographic is a measurement of a very specific segment of your database. When you can track the people who are not completing your form as well as the people who are, you can get a better idea of how your goal demographic is engaging. Use the following formula to determine your true completion rate by goal demographic. You should target for a ratio of 1:1 completion by goal demographic, which would mean that 100 percent of your conversions are from your goal demographic. So if you had a form that 100 people converted on, and 90 of them were in your core demographic, you would have a ratio of 9 out of 10, or 90 percent. With marketing automation, you’ll easily see which of your conversions are in your goal demographic due to your new lead tracking abilities. If you are close to 1:1, your offer and form are perfectly optimized for your goal demographic.
![]()
· Open-to-click ratio: Your email open rate on its own tells you how good your subject line is. A click on a link on its own tells you how good your call to action is. Your open-to-click ratio tells you whether your call to action meets your prospect’s expectation when the prospect opens your email. To get your open-to-click ratio, just divide the number of clicks an email had by the number of opens it had. This is a manual way to run this report; many advanced marketing tools have this feature built in. The goal is to reach 100 percent of opens to clicks. The more congruent your two actions are, the better aligned your subject line and call to action are. The farther away you are from a ratio of 1, the more work you need to do in making sure that your subject line and call to action work together.
![]()
Evaluating your cold lead nurturing campaign
Evaluating your cold lead nurturing campaign can be very easy or very complicated, depending on what you’re looking for. I suggest that you keep things easy at the beginning of your implementation of marketing automation and evaluate yourself on only a few key goals. First, don’t think ROI; instead, think value created. I talk more about other ways to prove value other than just ROI in Chapter 10, but to keep this section specific to nurturing, consider my suggestions for valuing your nurturing campaigns.
· More engagement than before: If you got more opens and clicks, and fewer bounces, you’re taking a step in the right direction. Continue to strive to do better and your nurturing programs will be successful.
· Found new leads: Many times, nurturing cold leads will also help you uncover leads you may have missed, or who fell through the cracks. Finding any new leads or opportunities from this campaign should be looked at as a giant win. Many people might use these opportunities to prove ROI, but I recommend against it because you will be training yourself to always value a campaign on ROI, which is not always the best measuring method.
· Less work to manage your cold leads: You should also be working less now on managing your cold leads. This should have helped you to set up a process for identifying them, segmenting them, and keeping them engaged. If you can remove these items from your daily tasks, you can focus on higher-priority issues.
Looking at the results of your white paper campaign
After you have made your list, sent out emails, driven people to a form, and completed a white paper campaign, you can choose among a few great and easy ways to measure it. You need to correctly track three basic engagements for your white paper campaign:
· Form completion rates: Form completion rates tell you how many people fill out your form after they have it in front of them. You can also track abandonment rates, but for B2B, I don’t recommend looking at abandonment rates.
· Email open rates: Email open rates are very easy to track, and as I’ve mentioned before, they’re not a great metric; they can, however, generally tell you some good things. You should have close to 100 percent open rates on a white paper campaign. If you are below this number, take a look at your subject line as the reason.
· Click-through rates: If you are sending a mass email, expect your click-through rates to be low, well below 5 percent. If you’re sending an auto responder email, expect these rates to be very high. It is not uncommon to see them above 50 percent because the lead asked for the email and is expecting it.
Tracking Twitter Engagements
Tracking Twitter engagements can be very helpful in tracking the effectiveness of your Twitter marketing efforts. Here are a few ways to specifically track engagements on Twitter:
· Basic: The most basic way to track engagements on Twitter and prove their value is to use a landing page. The landing page should have a form on it and a special automation rule so that anyone who fills out the form is marked as having come in from a Twitter campaign.
· Moderate: If you’re more advanced and can use custom redirects (or Google UTM parameters), you can create a custom URL for each tweet. These URLs should be taking people to content or another web page that you are tracking. This is where landing pages can come in handy. I talk more about how to set them up in Chapter 9. Your marketing automation tool will be able to pick up the information from people clicking the links and report on where they are in the buying cycle, the effectiveness of your campaigns, and so on.
· Advanced: If you are highly advanced with social media and Twitter, you can get into more advanced options for tracking engagements. For example, you can use Twitter Cards and connect them to your marketing automation tool. Currently, Twitter Cards are not easily connected to other applications. I expect this to change in the near future, either through applications that make connecting easier or through Twitter opening a more robust API.
All materials on the site are licensed Creative Commons Attribution-Sharealike 3.0 Unported CC BY-SA 3.0 & GNU Free Documentation License (GFDL)
If you are the copyright holder of any material contained on our site and intend to remove it, please contact our site administrator for approval.
© 2016-2026 All site design rights belong to S.Y.A.