Learning Qlik Sense The Official Guide (2015)
Chapter 6. Contributing to Data Discovery
In the previous chapter, we outlined data discovery consumption requirements, which provided an overview of key Qlik® Sense capabilities for users who wish to consume an application that is prebuilt. This chapter's goal is to highlight key features in the context of the specific user requirements that Qlik® has identified as being needed by a data discovery contributor, or someone who seeks to share key findings from their analysis.
In this chapter, we will cover the following topics of Qlik Sense:
· Data discovery contributor requirements
· Bookmarks
· Private sheets
· Private stories
· Publishing to an existing application
Realities of the data discovery contributor
One of the strengths of Qlik Sense applications is the ability to share and extend the value of applications with other members of the stream. As noted in Chapter 4, Overview of a Qlik Sense Application's Life Cycle, there are number of useful ways to share key business discoveries. These include the following:
· Bookmarks
· Private sheets
· Stories
Each of these capabilities help analysts not only consume Qlik Sense applications but also share and spur additional conversation and insights. The stream administrator covered in the Chapter 8, Administering Qlik Sense, enables these contributor capabilities. Let's take a closer look at each of these capabilities through the role of an analyst named Pat.
Creating private bookmarks
A private bookmark is the beginning of an analysis that drives collaboration across an organization. Bookmarks allow a developer and contributor to save the state of a sheet within a Qlik Sense application. In the previous example, the Executive Dashboardapplication, the author defined approved bookmarks. These public bookmarks are part of the published application to help users start their data discovery process. This capability is also available to contributors to save key business discoveries for a later time.
For example, say Pat conducts a sales analysis on products sold in key cities, as shown in the city's sales analysis in the following screenshot:
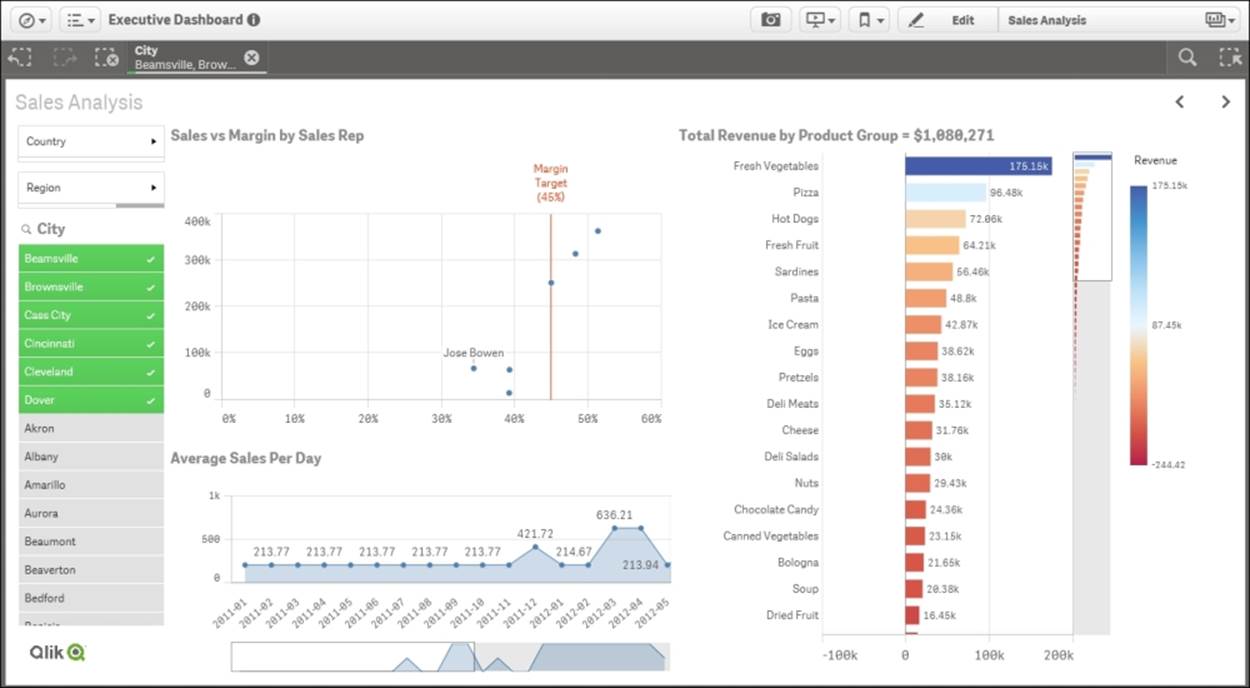
Pat has selected six key cities for analysis of sales rep resentative performance and products sold. This view is interesting so Pat decides to bookmark this sheet with these selections. Note that when selecting the bookmark icon, all approved and saved private bookmarks are available for navigation. Additionally, the Create new bookmark button is available and will automatically create a default title based on the sheet name and selections:
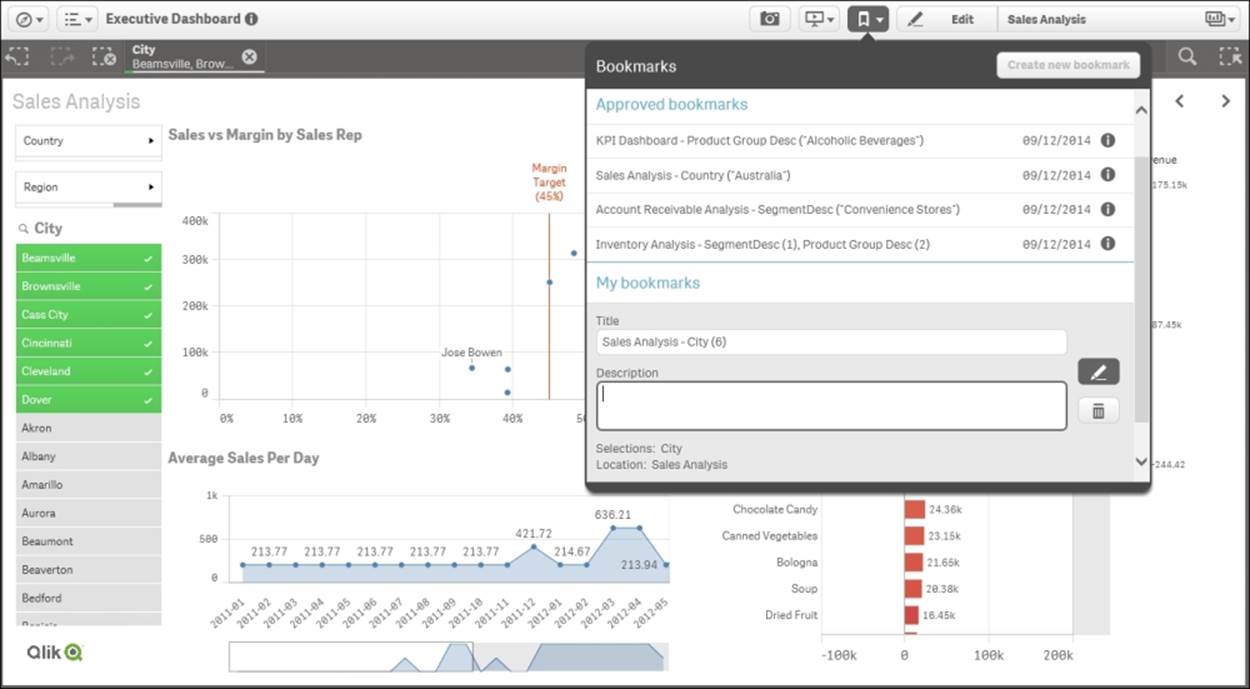
City sales analysis bookmark
Once saved, the bookmark becomes a part of the application under My bookmarks and can only be accessed by the creator, which in this case is Pat.
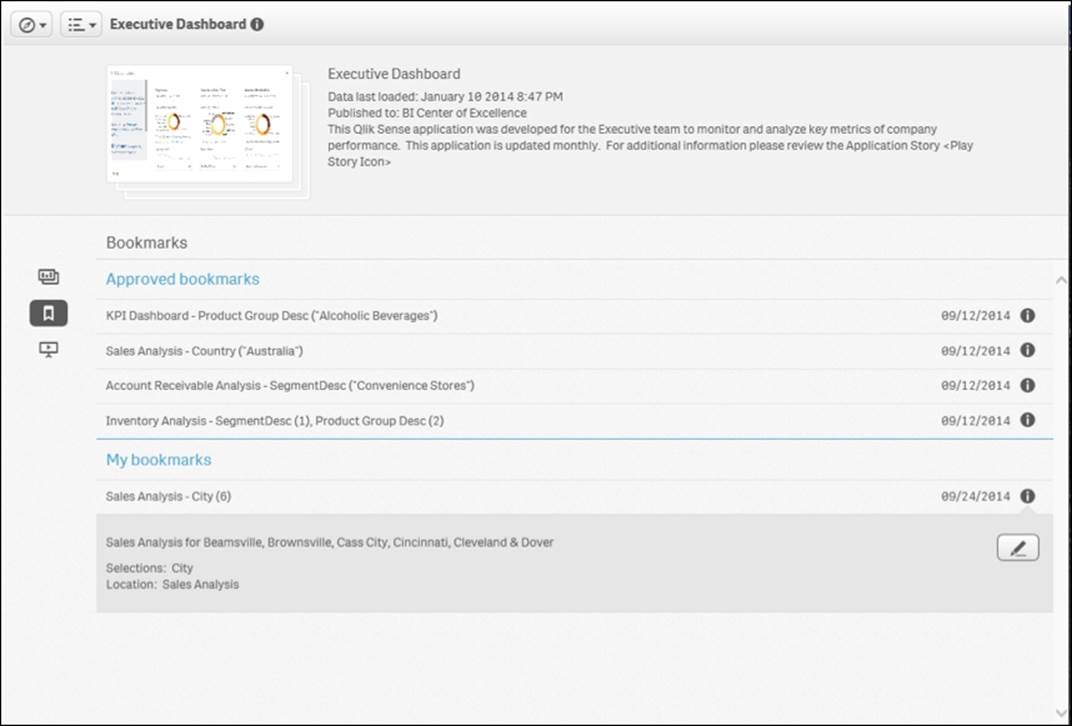
Executive Dashboard bookmark
To summarize, simple Qlik Sense Bookmarks can play an important part in bringing context to the beginning of an analysis as well as saving key insights gained from an analysis. Although separate features, Qlik is seeing early adopters use Bookmarks as the start of building critical mass with insight that can be shared through published sheets and stories, which are the topics of our next sections.
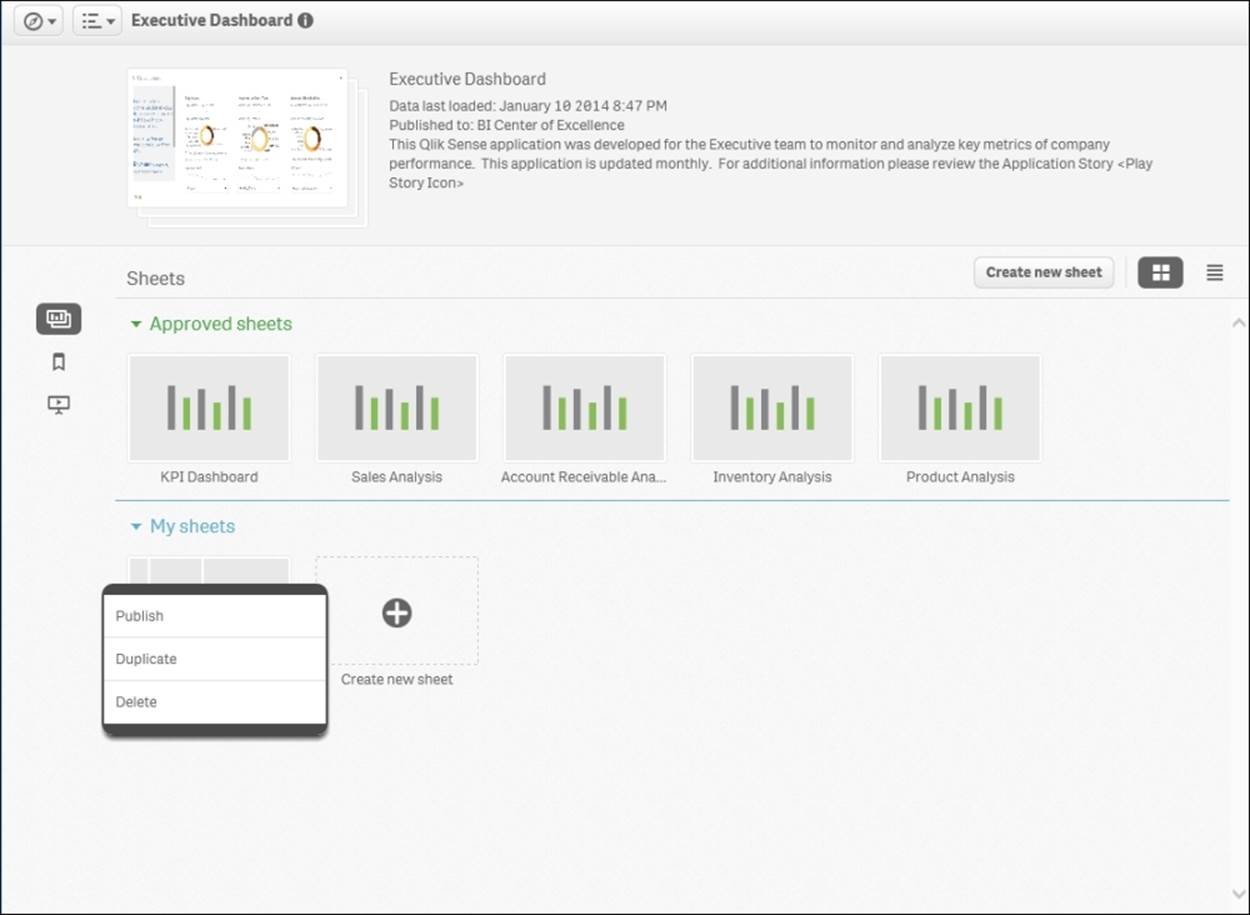
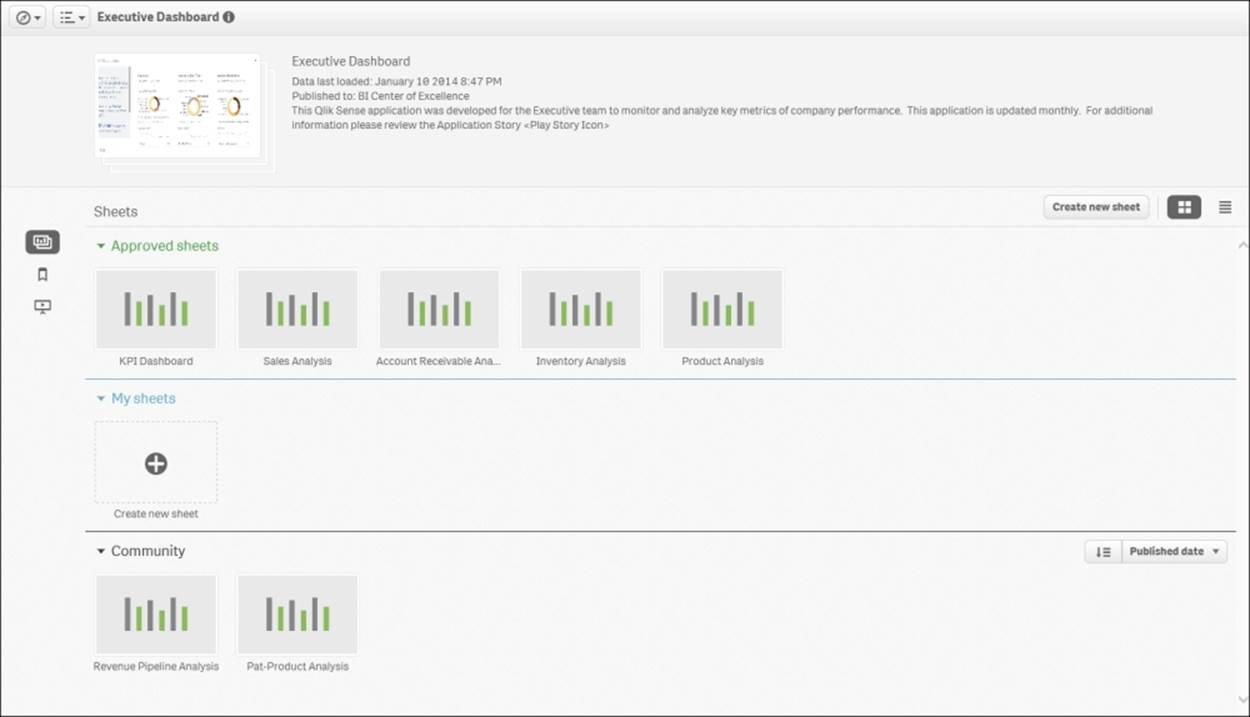
Creating and sharing private sheets
As discussed in Chapter 4, Overview of a Qlik Sense Application's Life Cycle, the building block of a Qlik Sense application is a sheet. In the Executive Dashboard community, we can see the sheets associated with the Executive Dashboard application. These include Approved sheets (published by the application author), My sheets, which are private sheets defined by the contributor (Pat), and finally, Community, which are private sheets published by other contributors.
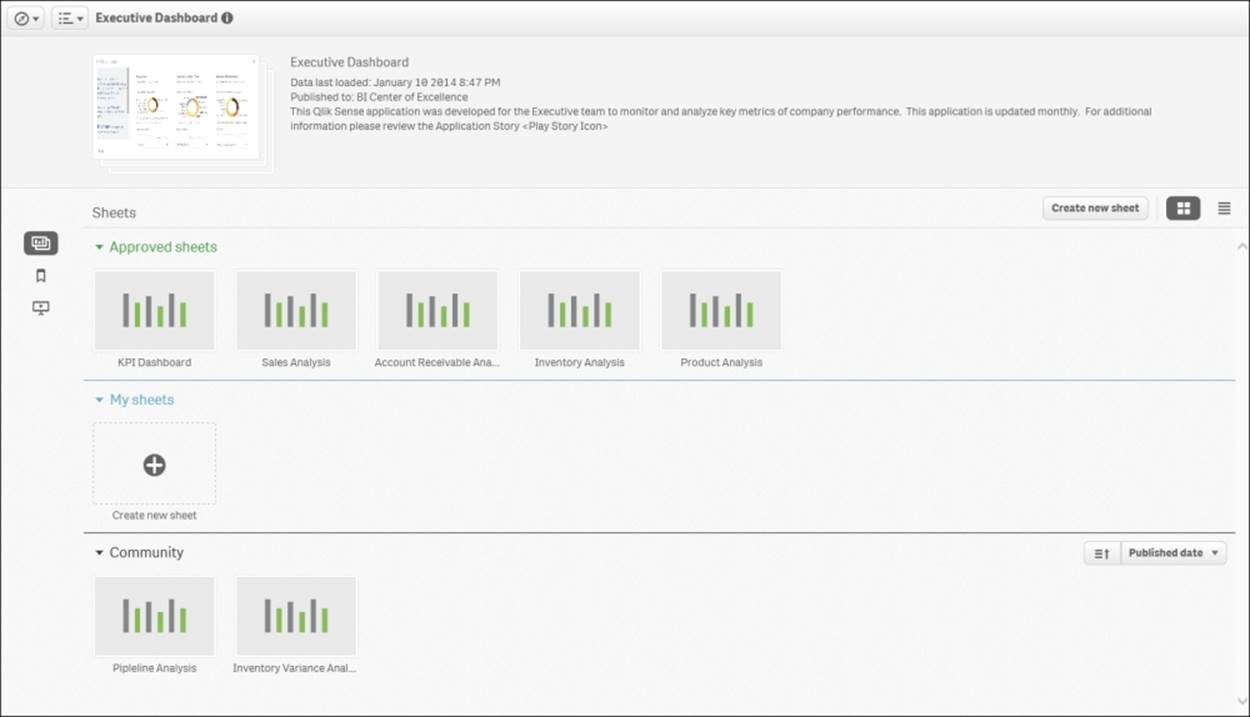
Executive Dashboard community
Let's now dig a bit deeper into how these sheets are built. There are two main ways in which private sheets are built, as follows:
· Duplicate an approved sheet
· Create a new sheet
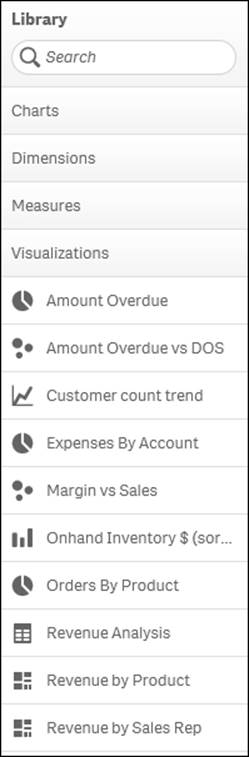
In both cases, a key feature that allows a contributor to build strongly governed private sheets is the Qlik Sense Library. The Qlik Sense Library is a key component of an application that allows the author to expose key portions of the associative model in the form ofDimensions, Measures, Charts, and predefined Visualizations. How the Qlik Sense Library is created will be covered in more detail in the next chapter. The following screenshot shows Library:
Creating a private sheet
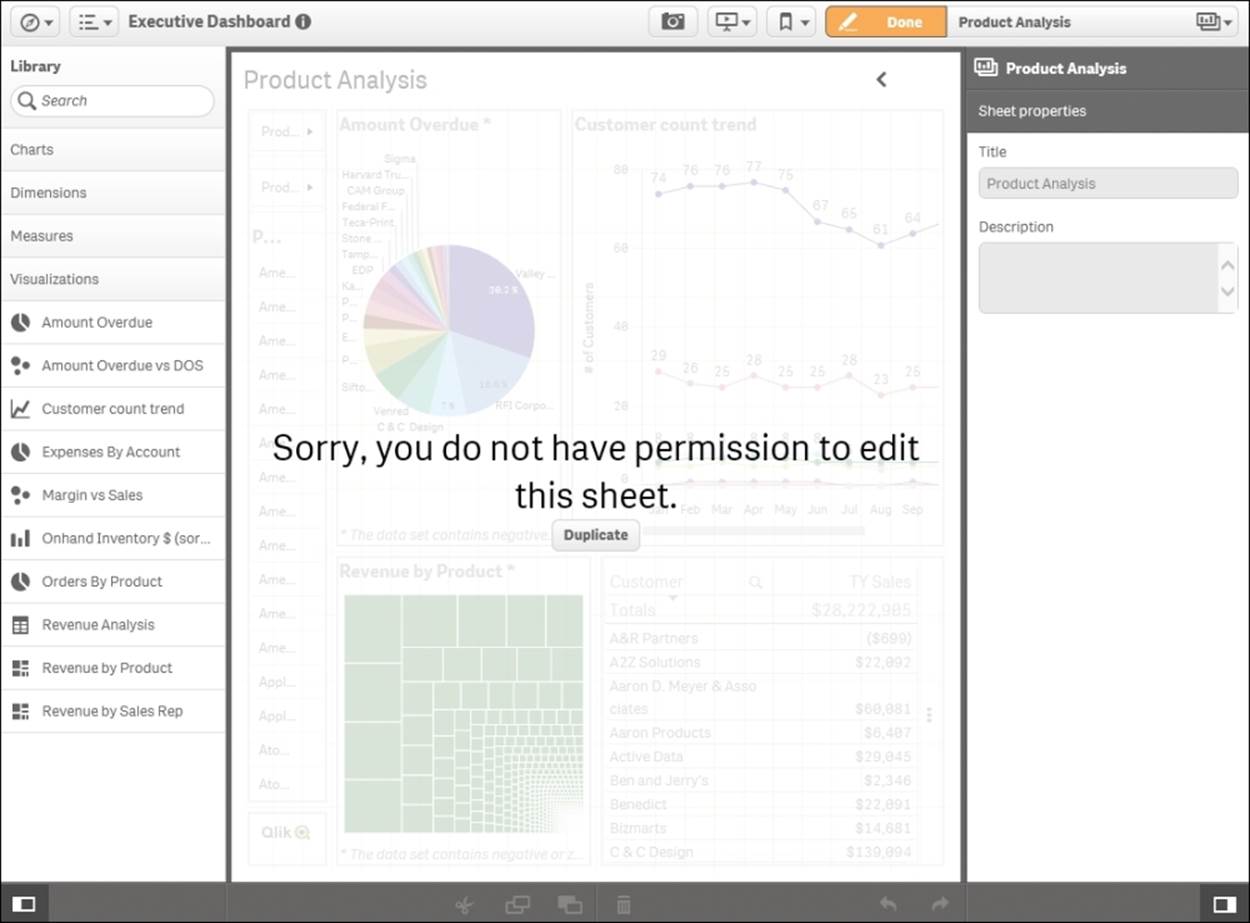
Let's now turn our attention to creating a private sheet by the first method, duplicating an existing sheet, and then editing it to meet your requirements. The advantage of this method is that Pat can start the creation of her product analysis based on the approvedProduct Analysis sheet. The process begins with selecting the sheet that best aligns with the content you wish to analyze. In this case, Pat wishes to create a product analysis that integrates the inventory on hand with the approved Product Analysis sheet. As the Product Analysis sheet is an approved sheet, it cannot be edited and must first be duplicated before changes can be made.
Duplicating Product Analysis sheet
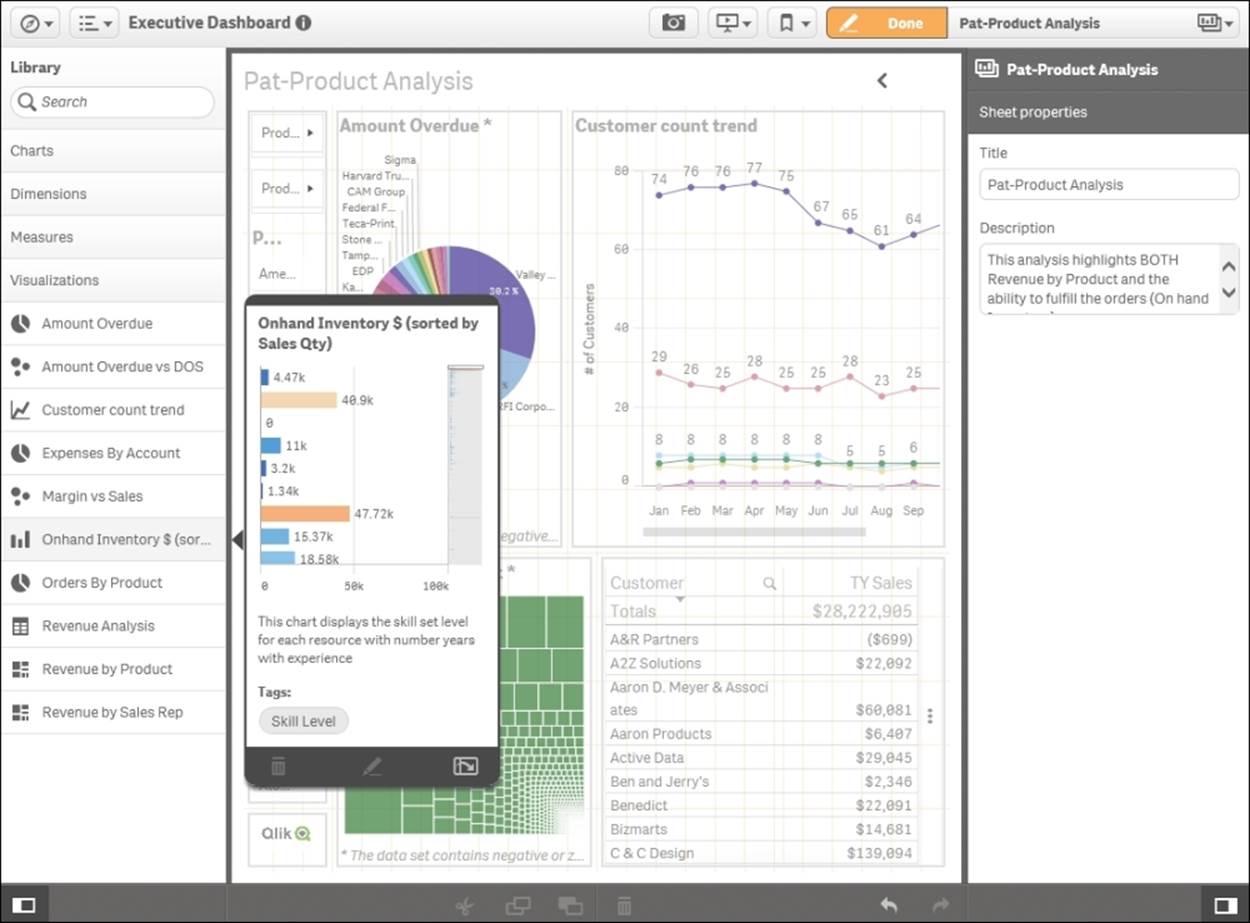
Once the sheet is duplicated, it is automatically converted into a private sheet, where Pat can rename and alter the content and layout of the sheet through the use of Library. Please note that Pat has renamed the sheet to Pat-Product Analysis as well as added a helpful description, which highlights the goals of this sheet, which is This analysis highlights both Revenue by Product and the ability to fulfill the orders (On hand Inventory$) to recognize revenue. Additionally, there is a wide selection of preconfigured charts as well as dimensions and measures she can take advantage of in Library. In this example, Pat will replace the customer count line chart with the Onhand Inventory $ (sorted by Sales Qty) horizontal bar chart from Library. This is one example of a variety of governed changes available to Pat in designing a new sheet. We will explore the breadth of changes to develop private sheets in the next section.
Creating the Pat-Product Analysis sheet
With the Onhand Inventory $ (sorted by Sales Qty) chart from Library dragged and dropped onto the sheet, Pat is ready to end the editing process. Since this process is all server-based, there is no need to save the sheet but rather just click on the Done button.
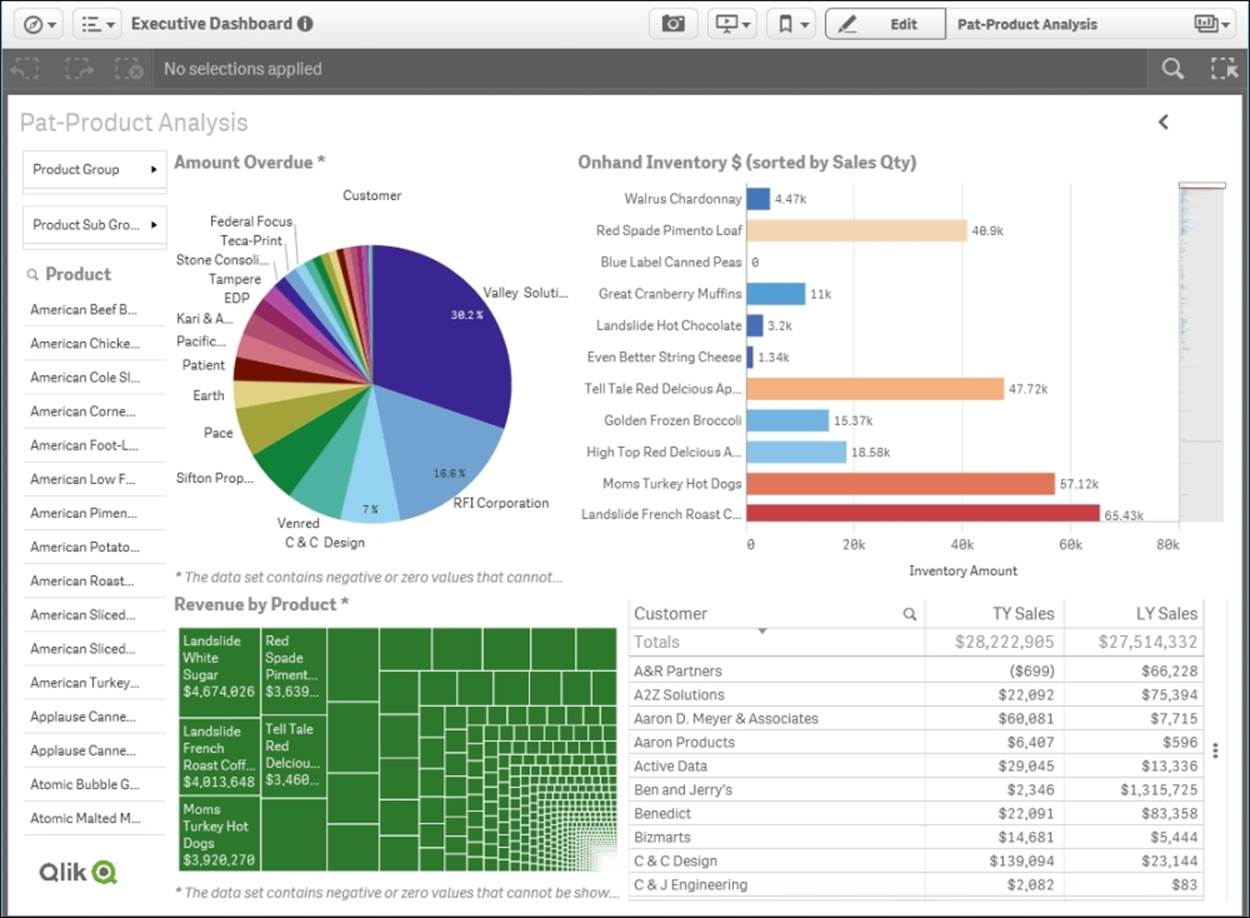
The Pat-Product Analysis sheet
Publishing a private sheet
Now that the sheet is complete, let's return to the application overview. As you can see in the following screenshot, My sheets now contains a new sheet called Pat-Product Analysis, and with a right-click, it is ready to be published to the community:
Publishing the Pat-Product Analysis sheet
When the sheet is published, a new section will appear called Published by me that contains all published sheets by Pat. Also, note that Pat has a number of sheets that are in progress in the My sheets section.
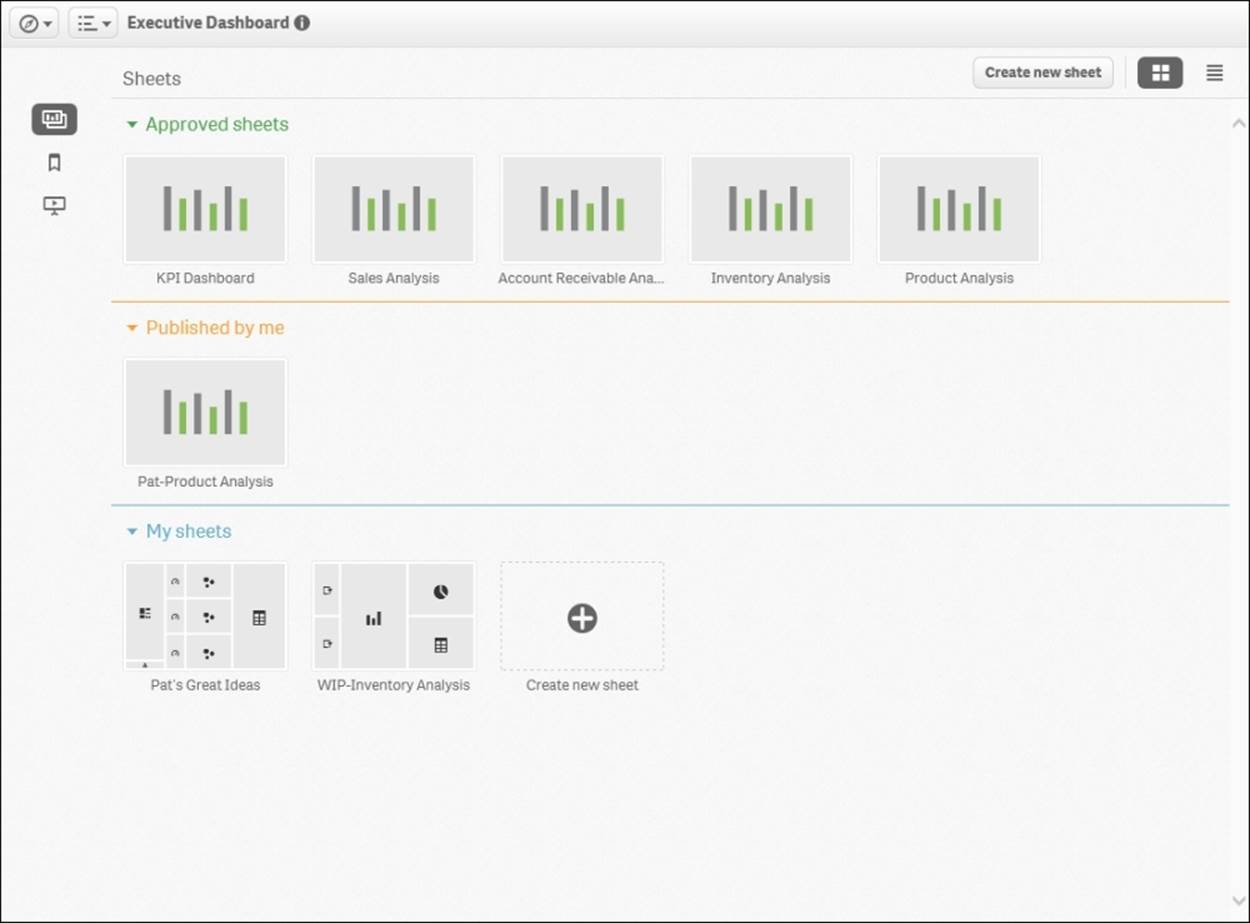
Pat's sheets
In summary, a duplicated approved sheet is an excellent way to start the creation of a private sheet as it has the advantage of leveraging the existing defined sheets from the published application or the work of other analysts in the community. Now let's turn our attention to creating a new sheet.
Creating a new sheet
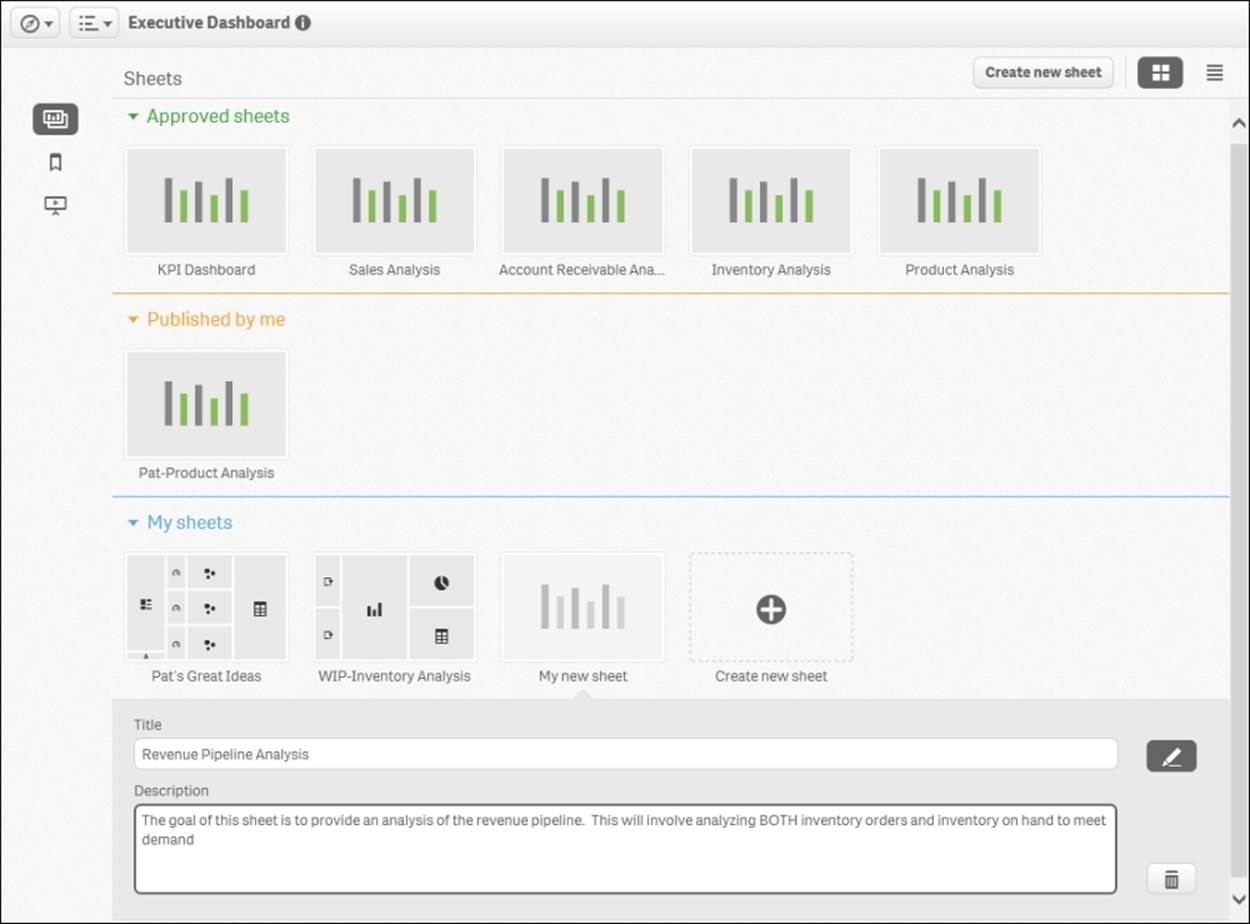
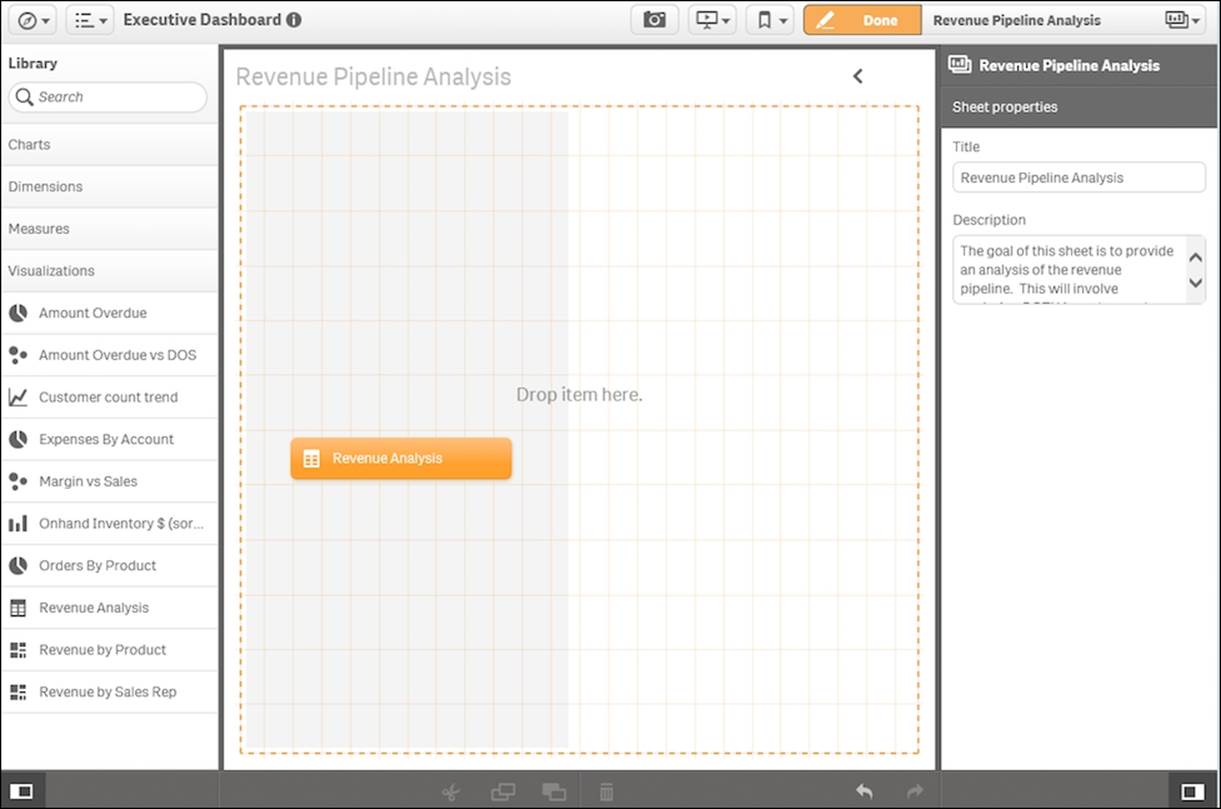
A second approach to sharing key business insights is to create a new sheet. As shown in Creating a New Sheet in the following screenshot, Pat creates a new sheet called Revenue Pipeline Analysis, which contains both order information and inventory on–hand information to meet customer demand. This allows Pat to create and share new information across the organization.
Creating a new sheet
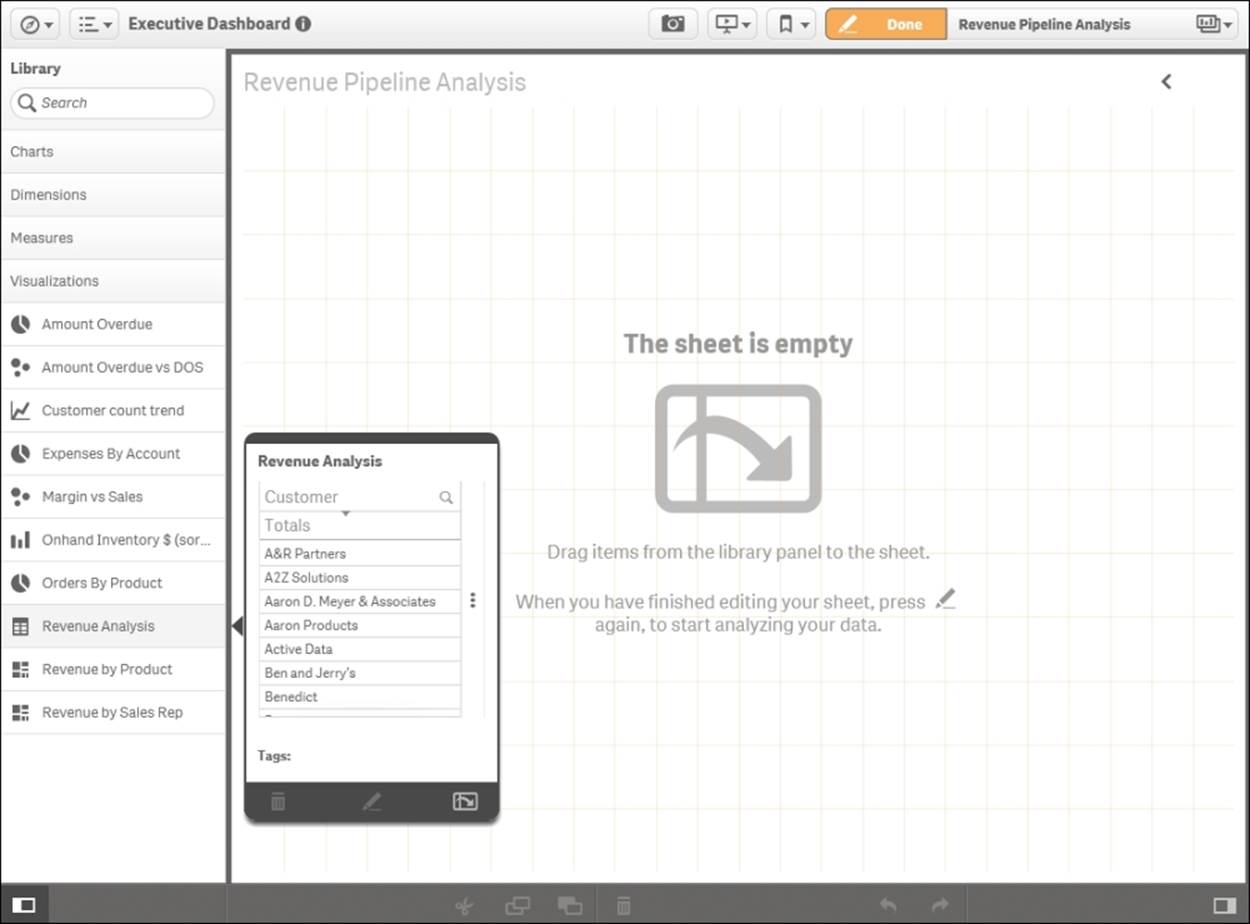
Once the sheet is created, Library and sheet properties are exposed and the sheet appears with a faint grid. This grid is a part of the responsive web design experience and facilitates the orientation and placement of objects from Library. This not only helps in the creation of the sheet but also plays a key role in how the objects will be viewed and consumed across multiple devices. Also, note that the creation and assembly of new objects is easily done by users due to the associative engine. Because of the associative model, every object is connected and no developer prewiring is required. The associative engine permeates the use of Qlik Sense, not only its use, but also the creation of compelling solutions.
Adding a predefined visualization to a new sheet
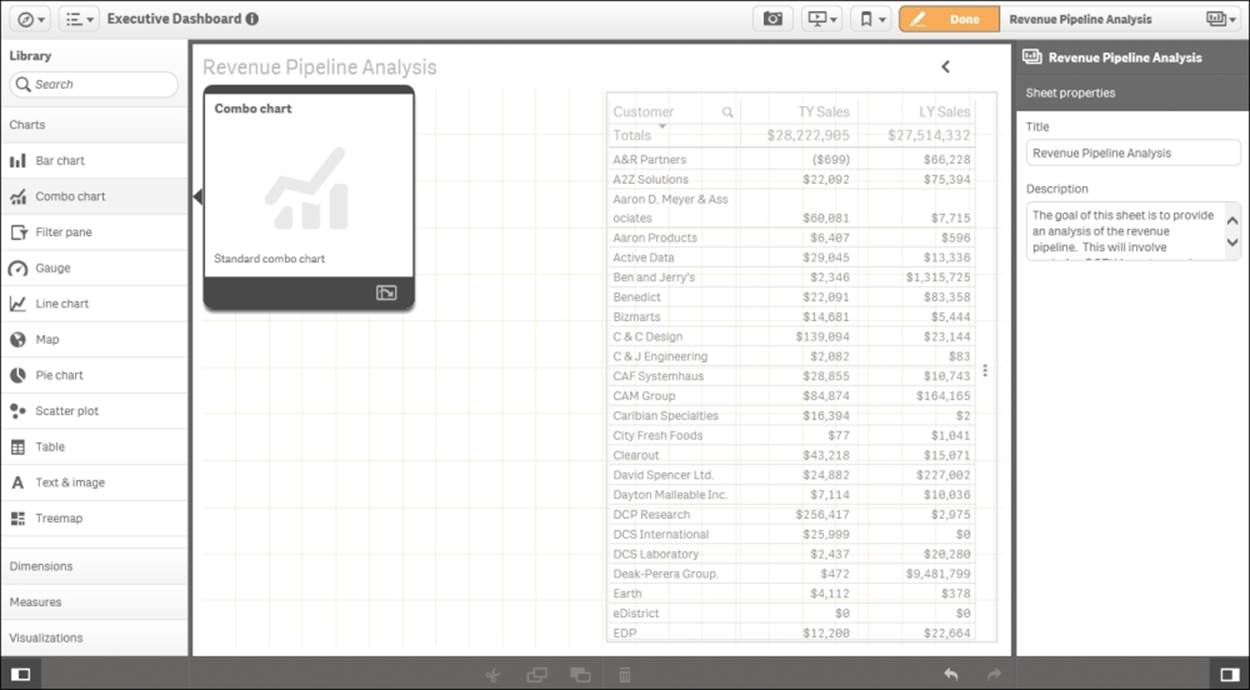
One of the key areas Pat is interested in is the customer revenue this year and in the previous year to help her better anticipate customer demand. Hopefully, the author of the application anticipated this common request and stored a table chart underVisualizations in Library. Specifically, the Revenue Analysis table chart is available in Library with a thumbnail shown to help Pat evaluate its applicability to the sheet content.
Adding a predefined visualization to a new sheet
Adding the Revenue Analysis object is a simple drag and drop movement. Please note that the sheet grid will automatically make recommendations on the placement of the object.
Drag and drop the object
Creating a Combo chart object
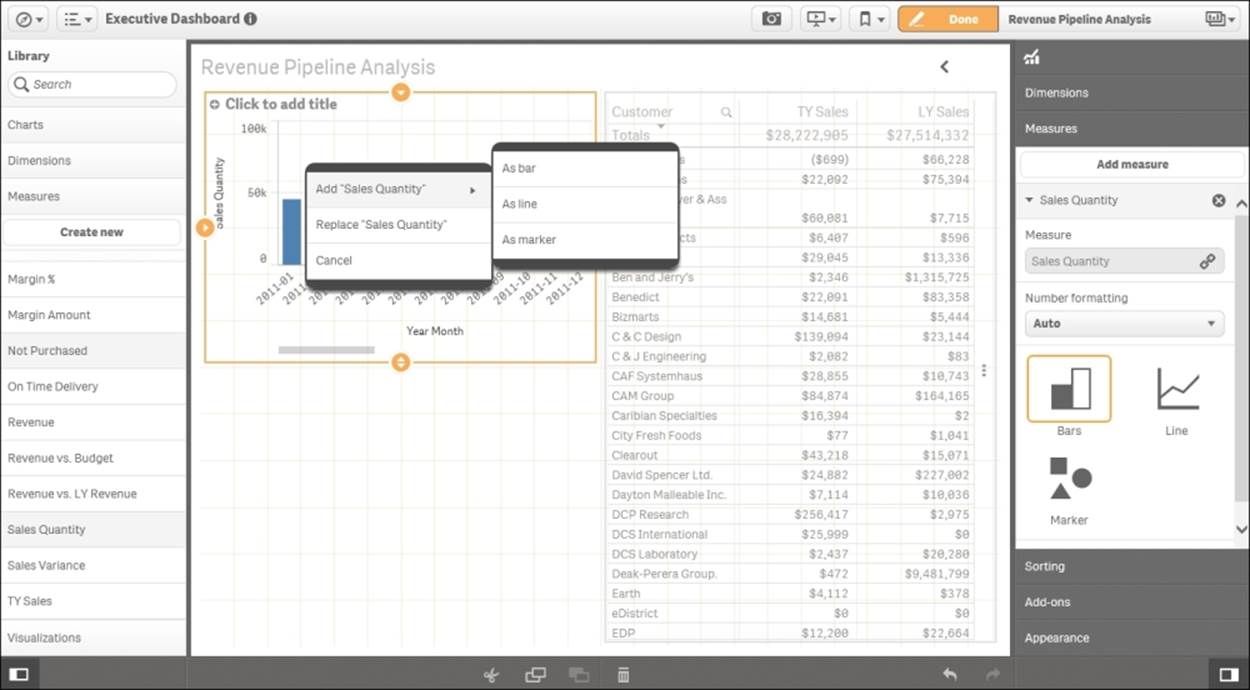
Once the object is placed, Pat notices that there are no visualizations available that allow her to see the trend of inventory on hand and sales orders. This requires her to create a new chart based on dimensions and measures defined in Library. So to begin this process, Pat selects and drags Combo chart to the sheet noted in the following screenshot:
Creating a Combo chart object
Once the Combo chart is in position, the object guides Pat on the requirements for visualization. The object highlights the requirement of at least one dimension and a measure. To speed the task, the Qlik Sense search capability can be used to find the dimension; in this case, Year Month.
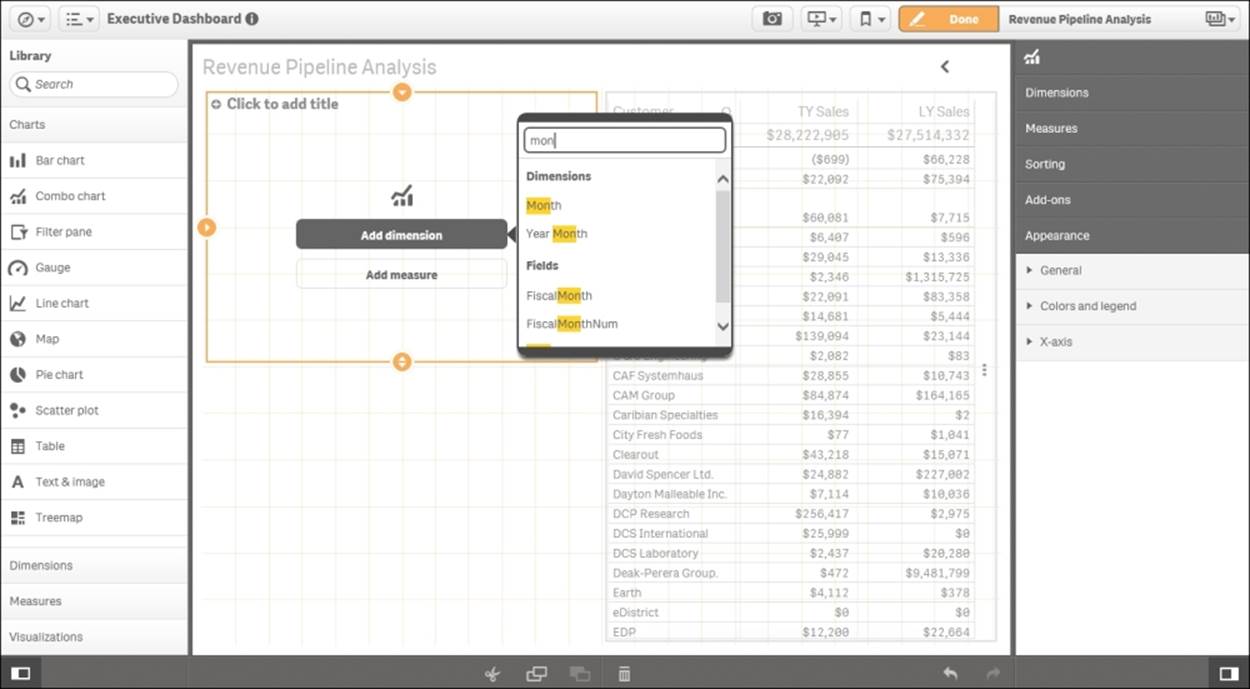
Adding a dimension
The next step is to add the measures; as this is Combo chart, there will be two measures. The first measure added will be Sales Quantity. Sales Quantity is available in Measures and a tooltip reveals the expression, which defines how it is defined.
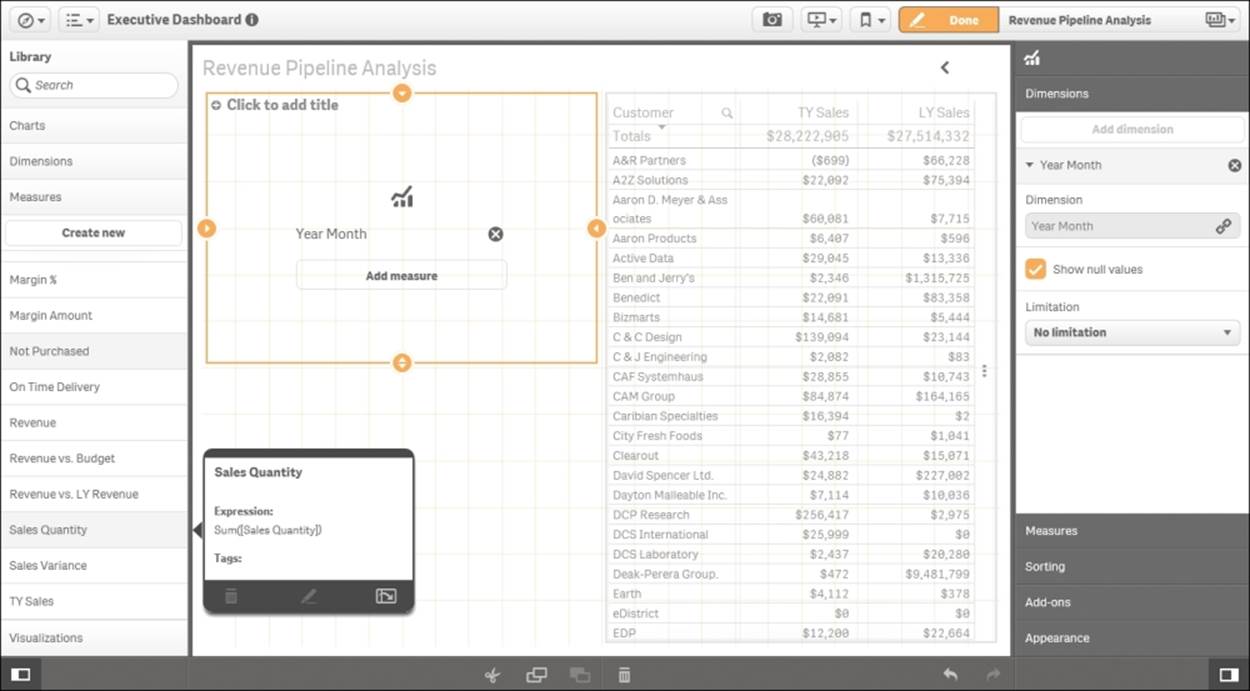
Adding a Sales Quantity measure
Additionally, as the measures are dragged and dropped on Combo chart, the object continues to guide Pat on how to visualize the data. Qlik Sense provides guidance to add the inventory quantity and options for display. Combo chart supports bar, line, and marker chart types. In this case, Pat selects a line to compliment the Sales Quantity measure that is already displayed as a bar.
Adding the Inventory Quantity measure
Finally, Pat completes the sheet layout by adding the Onhand Inventory $ (sorted by Sales Qty) chart available in the Visualizations portion of Library, shown as follows:
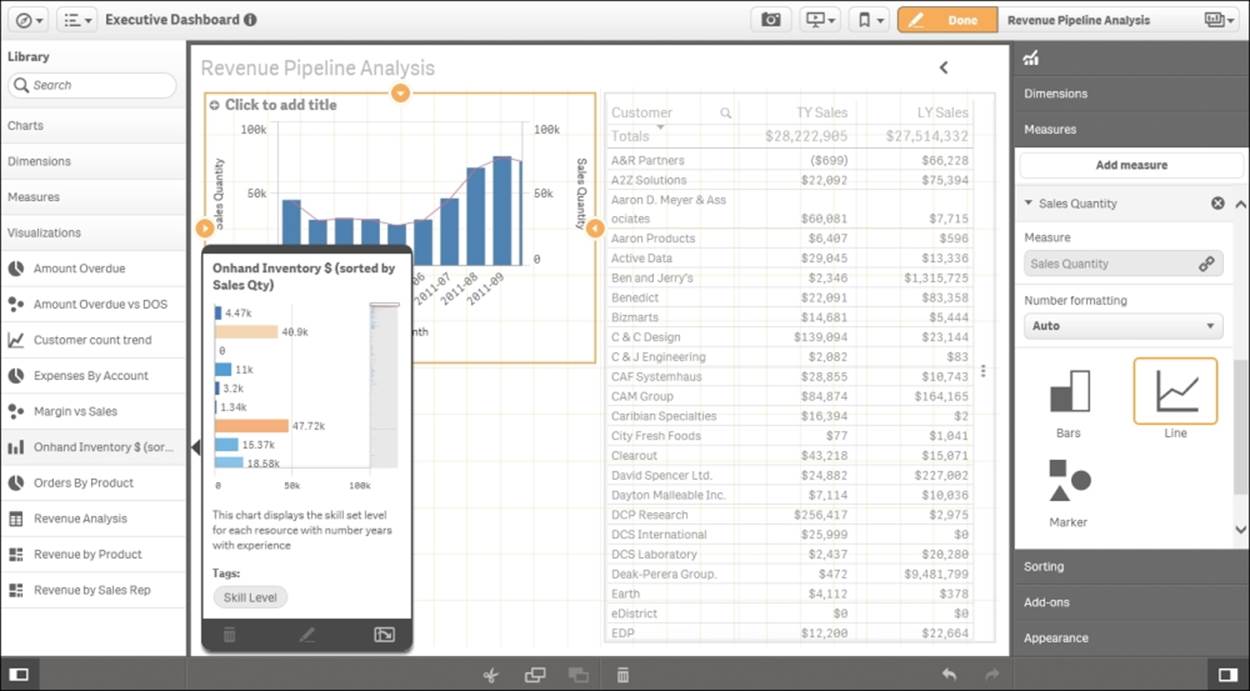
Adding the Onhand Inventory $ (sorted by Sales Qty) chart
Publishing a private sheet
With the new Revenue Pipeline Analysis sheet completed, Pat is ready to publish with a right-click as described earlier. Also, it is worth mentioning that this assembled sheet is fully selectable during the process of assembly, and no wiring (connecting) of these objects is needed to allow them to communicate with each other across all sheets.
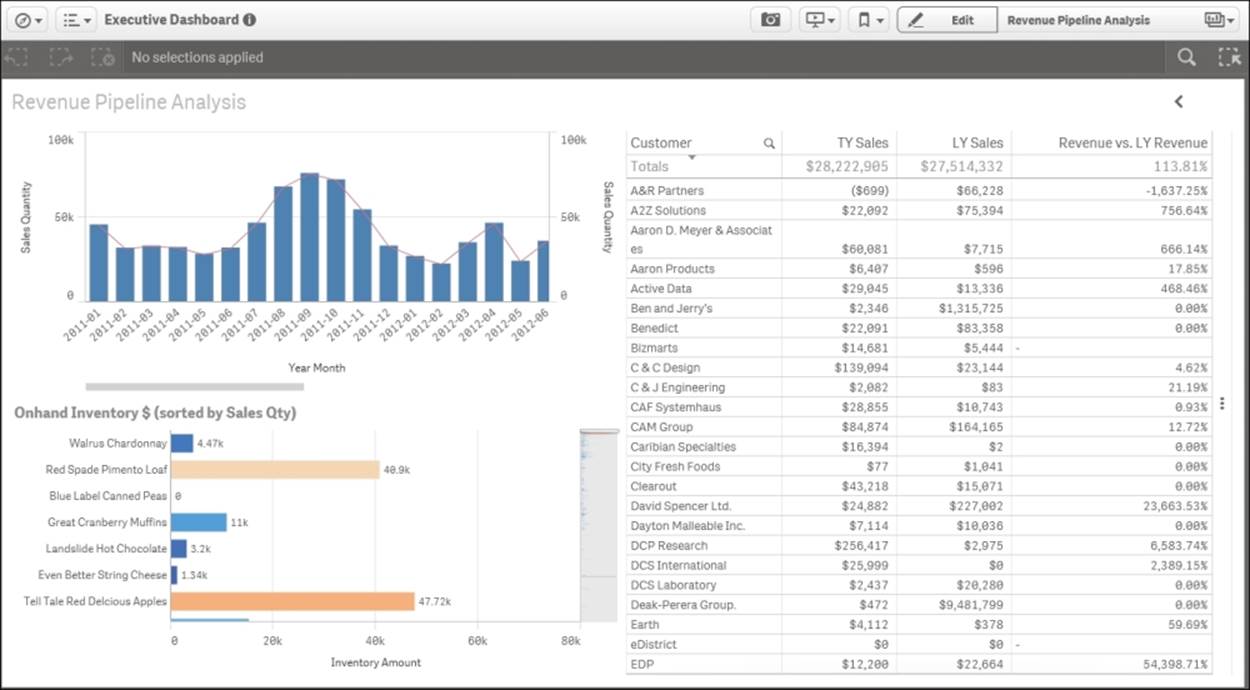
Completed Revenue Pipeline Analysis sheet
Once the sheet is published, it is available to the Executive Dashboard application, where it can be consumed, duplicated, and expanded by other members of the community.
Published Revenue Pipeline Analysis sheet
In summary, creating new sheets provides an alternative way to collaborate with members of the application's community. It allows contributors in a governed environment to start with a blank sheet to organize and share their thoughts and insights, and is managed centrally in the Qlik Management Console. Now let's turn our attention to creating a Qlik Sense story, which adds additional capabilities for collaboration.
Creating and sharing stories
Qlik Sense Stories provide an additional capability to collaborate and share business discoveries within the Executive Dashboard community. In the story overview, we can see that similar to Bookmarks and Sheets, Stories have Approved stories (defined by the author of the application), My stories (private and only viewable by the author), and Community (published) sections. We covered the role of approved stories as a way for application authors to provide an overview about the application and intended use.
In this section, we will focus on the creation of a story by a contributor (Pat) who will use this capability to present a sales analysis to the community.
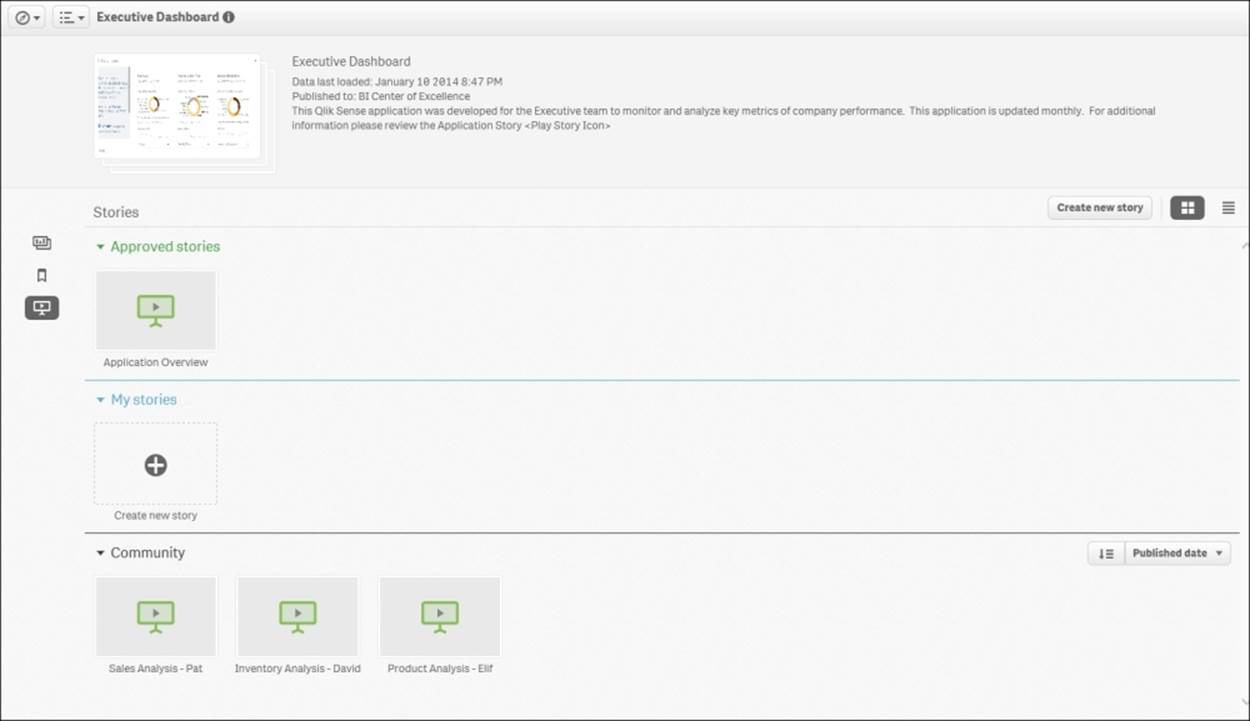
Story overview
Defining a story
To begin with, Pat creates a new story by selecting the Create new story option under My stories. The default name is My new story, which Pat changes to Sales Analysis – Pat to reflect the goal of the story. Additionally, a description can be added to provide information on the goals of the story.
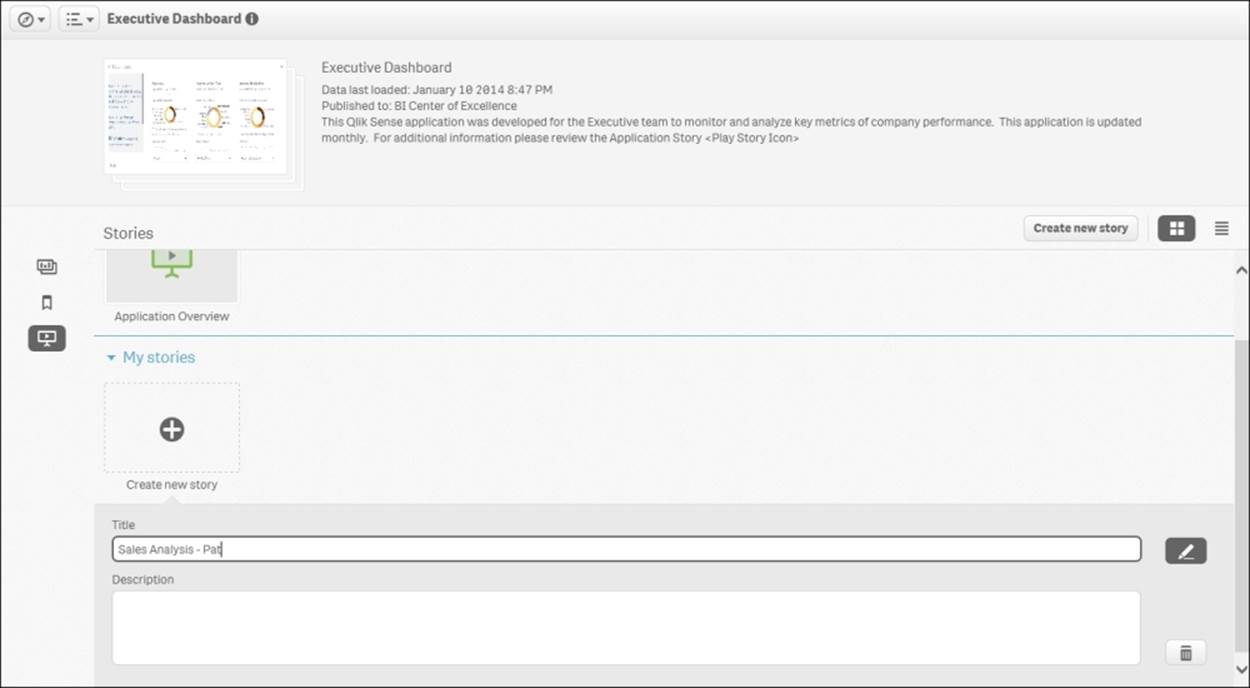
Defining a story
Once the story is defined, Pat enters the story workspace, which provides a broad set of tools to create rich presentations that are dynamically linked to the Qlik Sense application. The story workspace contains the ability to create sheets as well as access the following libraries:
· Snapshot
· Text
· Shape
· Effect
· Media
We will explore each of these areas as Pat defines her presentation.
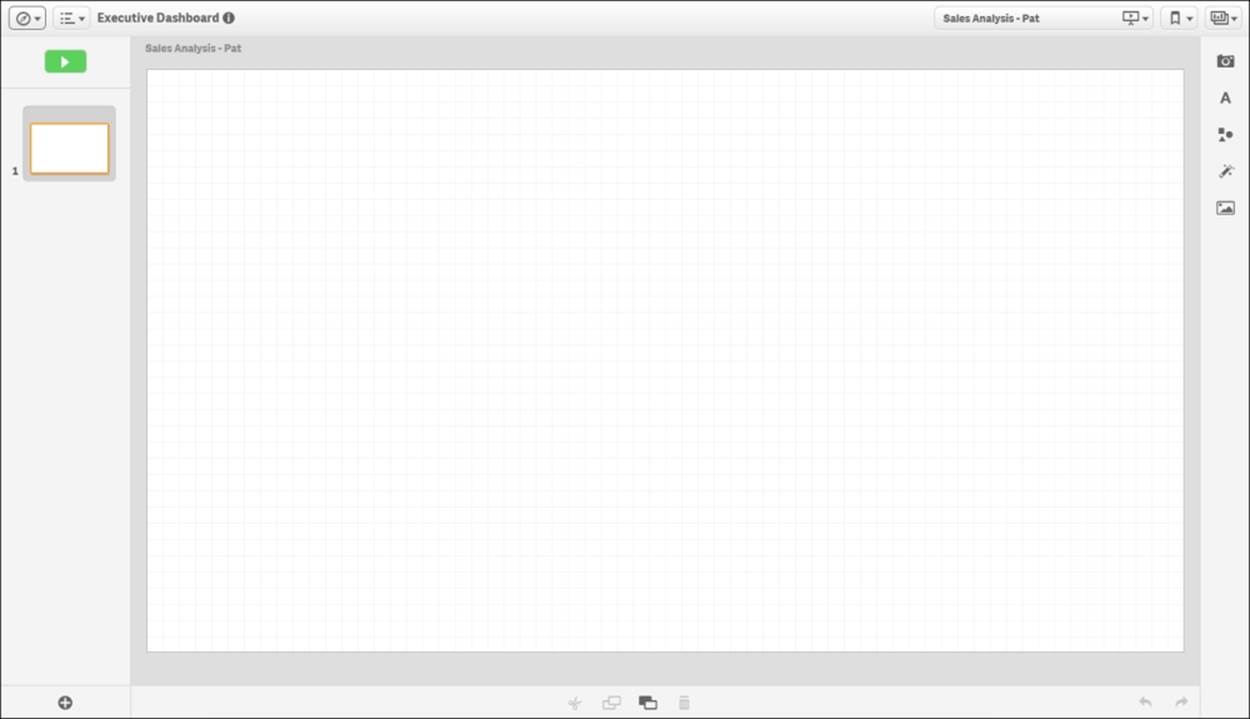
Story workspace
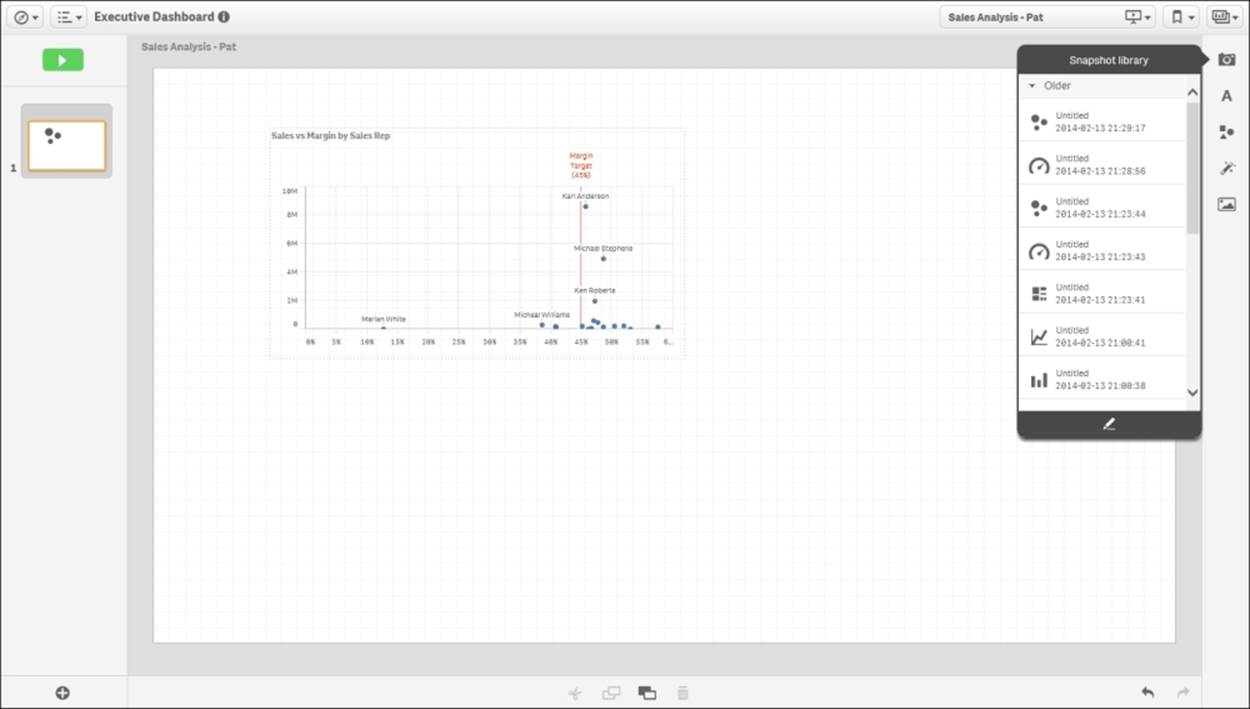
Creating snapshots
Let's start with creating snapshots. The ability to create a snapshot is a general capability found on all sheets within an application. By selecting the camera, all objects for which snapshots can be created are highlighted with an orange outline. Additionally, each object also contains an indicator that highlights the number of times snapshots have been created for the object. As you can see, Pat has been quite busy in selecting key objects for her story.
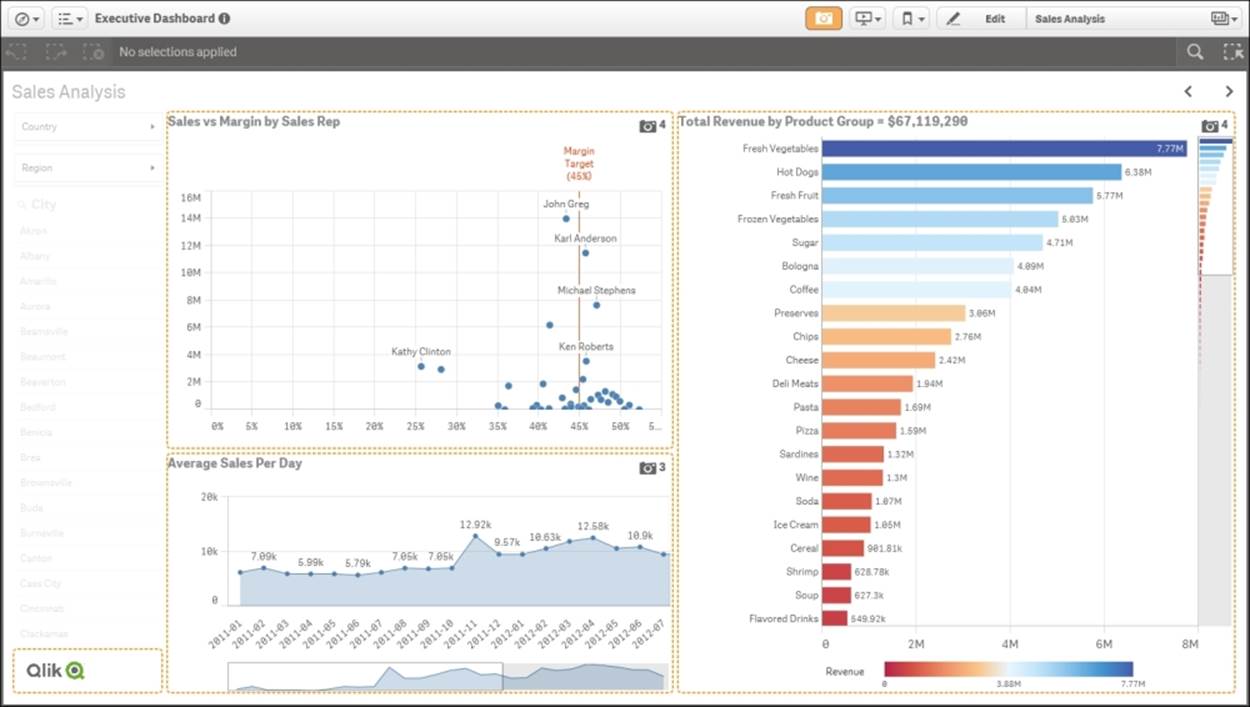
Creating snapshots
Now that Pat has selected her snapshots, she prepares to organize them in a story. Note that all snapshots are stored in Snapshot Library.
Story snapshots
Note
These snapshots are organized by the date and time when they were taken. This is an important consideration because it means that snapshots are like photos, storing the visualization and data of the time the snapshot was taken. By design, snapshots are not updated when the application data is changed.
Once the snapshots are taken, Pat locates the shot and then drags and drops it onto the grid. Also, note that each snapshot can be edited with the ability to modify some of the properties that can include turning on/off titles and labels.
Adding a snapshot
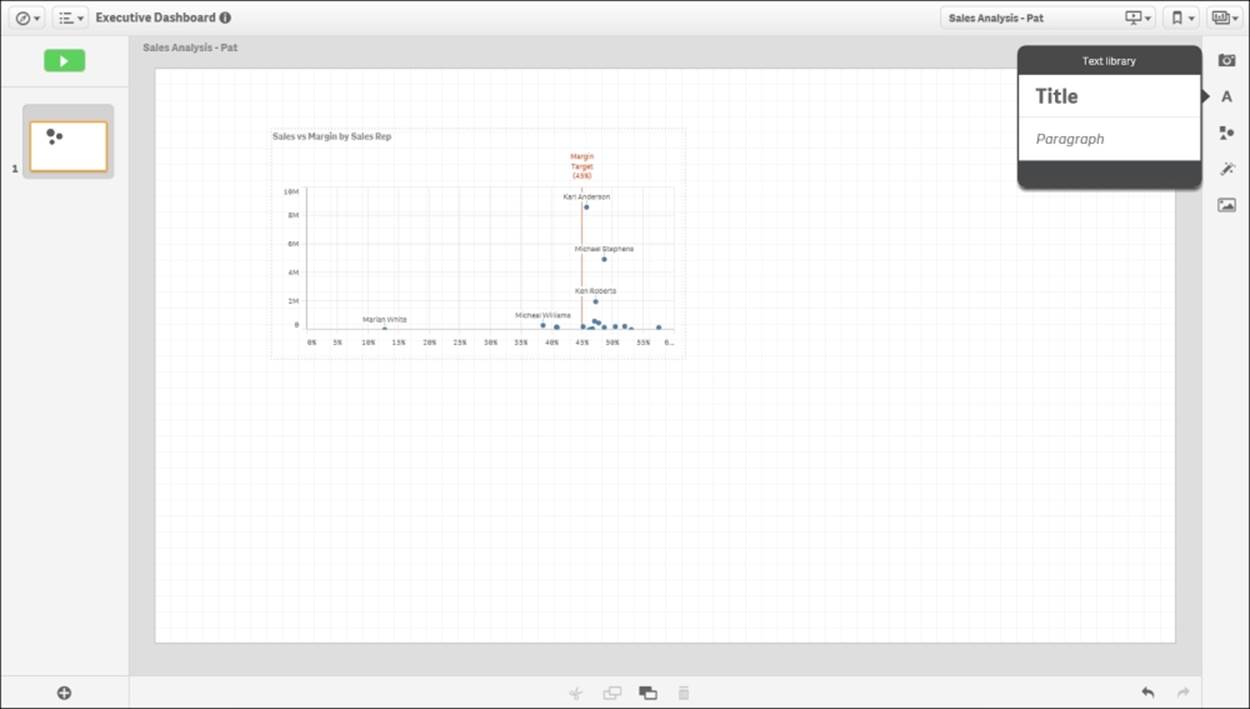
Adding text
Now let's add text to this sheet, which is accomplished through Text library. Text library facilitates both the creation of titles as well as paragraphs that can be used to add comments to highlight key business discoveries.
Adding text
Adding shapes
Pat has added the title High Margin Sales and emphasized it with bold and underline styles. Additionally, there is Shape library, which allows the integration of various shapes to highlight and emphasize the story.
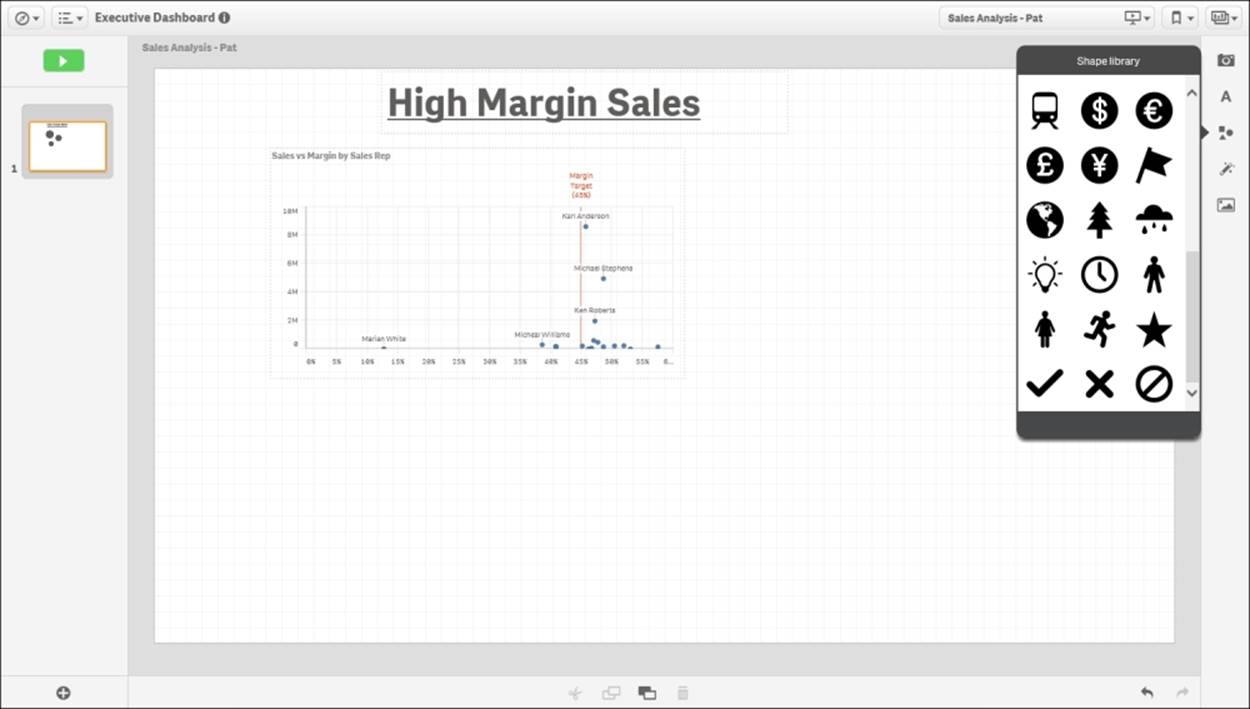
Adding a shape
Pat chose the light bulb symbol to identify key ideas in this story. The symbol's default color is black, but can be changed. Additionally, there is Effect library, which can be used to highlight the lowest, highest, or a particular value within a chart.
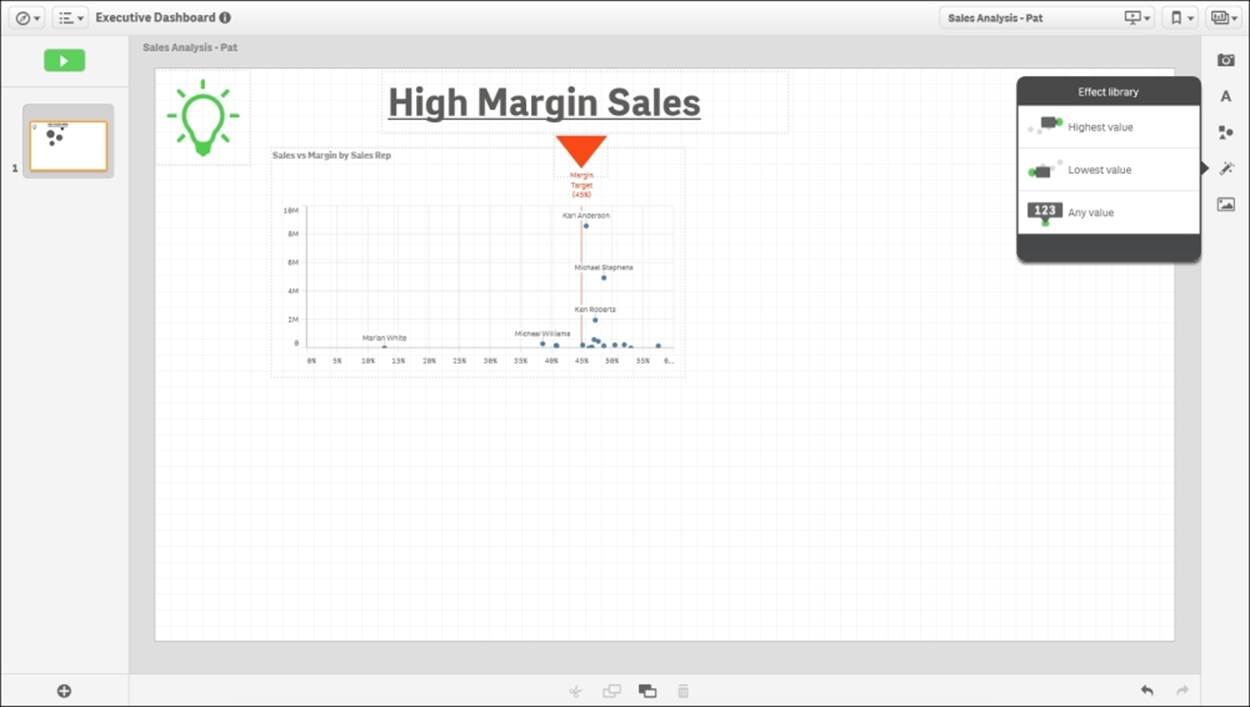
Adding effects
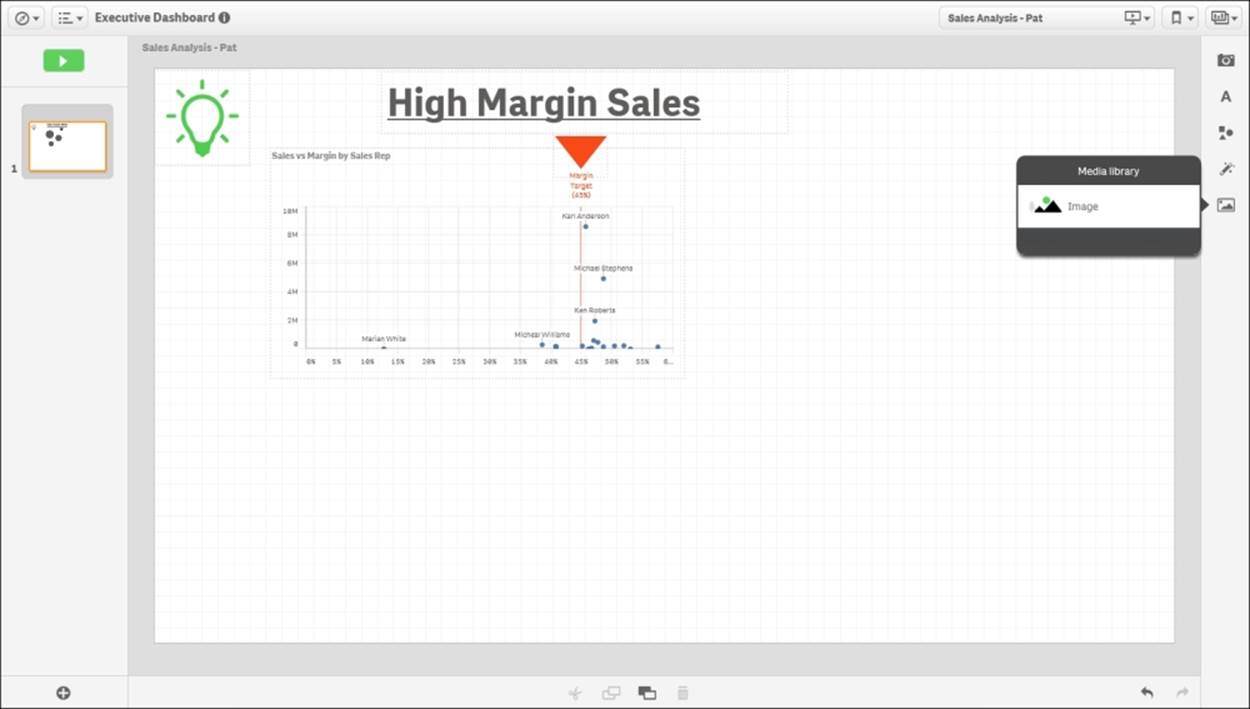
Media library
The final major area is Media library, which allows contributors the ability to add images from outside Qlik Sense. Images are made available and managed by the Qlik Management Console through Content library. Additional information on this process is available in Chapter 8, Administering Qlik Sense.
Adding media
Additionally, Pat would like to add a portion of the Sales Analysis application directly in her story. Qlik Sense Stories also allow an approved sheet to be embedded within the Sales Analysis story. This enables Pat to share her analysis through a number of slides and also allows the viewer the ability to continue their exploration through an active sheet.
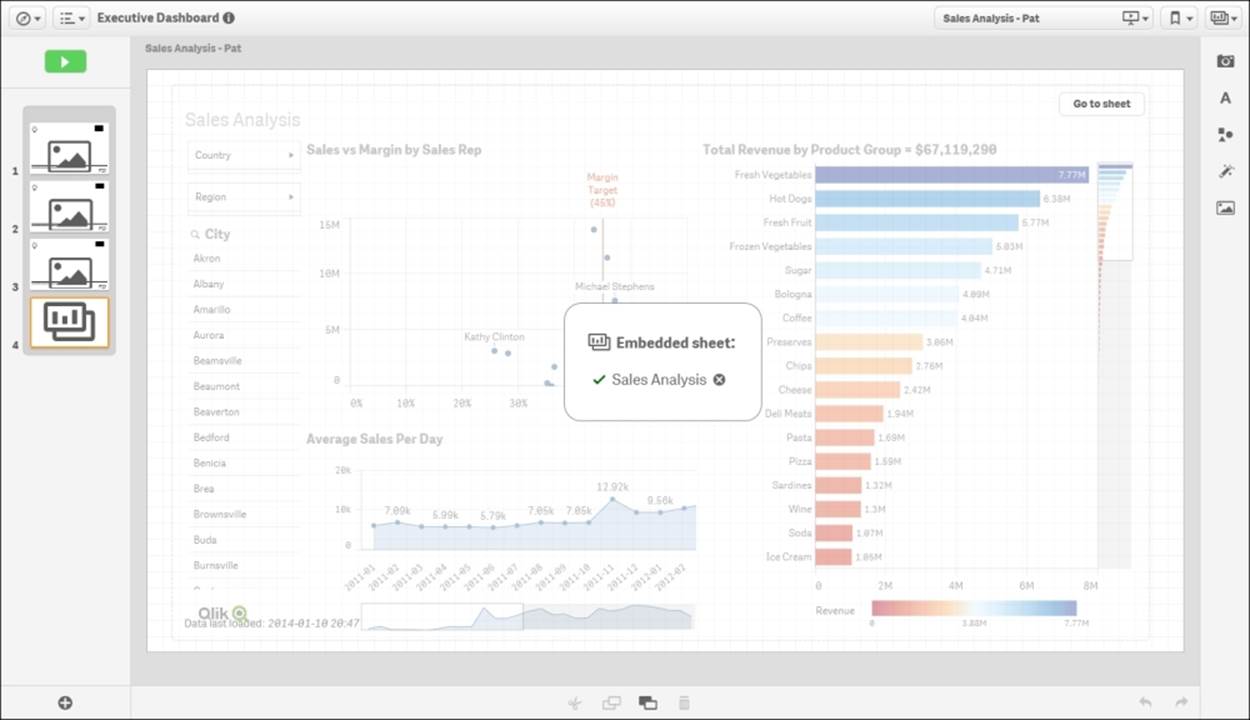
Adding a dynamic slide
Once the slides are completed, Pat can review how the slides will be viewed by selecting the Play the story button. Also, note that each of the snapshots has an embedded bookmark that can be selected by right-clicking on View source, and the viewer will be directed back to the application sheet to continue their exploration.
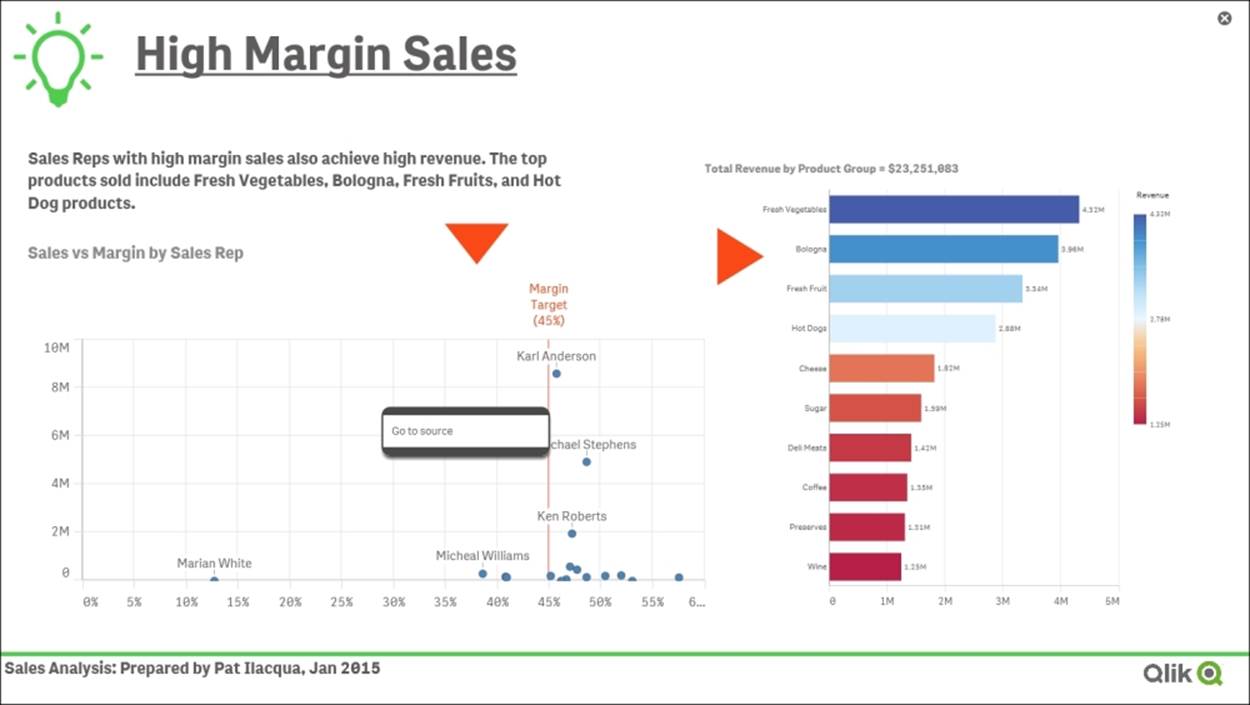
Final review
Publishing your story
Now that Pat is comfortable with the Sales Analysis story, the publishing process is similar to the publishing process of private sheets. To accomplish this, as illustrated, Pat right-clicks and selects Publish to move the story to the community and make it read only.
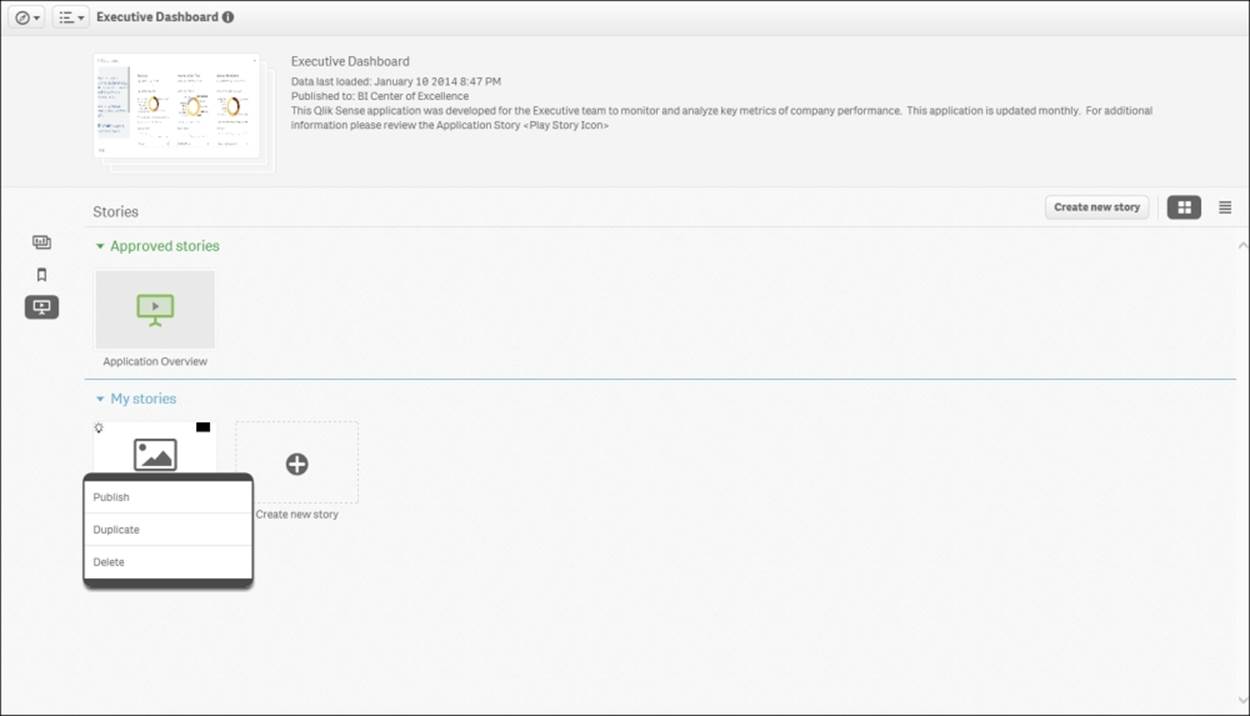
Publishing the story
Summary
In summary, one of the strengths of Qlik Sense applications is the ability it offers to contributors to actively share, collaborate, and extend the value of the application with members of the stream. Qlik Sense has a number of exciting ways to share key business discoveries. These include bookmarks, published sheets, and stories. Each of these approaches is highly governed and provides a wide range of capabilities to meet the needs of a contributor.
In the next chapter of this book, we will explore using the skills we learned alongside some ideas of best practices in how to create author-engaging applications for Qlik Sense.
All materials on the site are licensed Creative Commons Attribution-Sharealike 3.0 Unported CC BY-SA 3.0 & GNU Free Documentation License (GFDL)
If you are the copyright holder of any material contained on our site and intend to remove it, please contact our site administrator for approval.
© 2016-2026 All site design rights belong to S.Y.A.