Eliminating Waste in Business: Run Lean, Boost Profitability (2014)
Chapter 3. Marketing
The Enormous Black Hole
I know half the money I spend on advertising is wasted; the problem is, I don’t know what half.
—John Wanamaker
We’ll cut right to the chase in this chapter, and you are not going to like the news. As a college marketing professor, I have dealt with the marketing waste category my entire career. How do you get the best ROI from your sales and marketing efforts? How do you figure out who your customer is? How do you target/reach your customer? The list continues. Companies often pick the product they want to sell (not necessarily what the customer wants) and think that if they market/advertise the heck out of it, their organization will magically grow. So many companies, from small to large, think that the more they pour into advertising, the higher their sales will be. Or perhaps, the prettier they make the package, the better it will sell. Or if they chase the latest fads, sales will magically appear.
The unfortunate news is this: there are no magic formulas, no one-size-fits-all approaches, and no quick fixes. And unfortunately, marketing efforts provide very little positive impact most of the time. Advertising tends to be quite ineffective. The moral of this chapter is that it always comes down to slow and patient maneuvers, great customer service, and word-of-mouth. If you have a great product or a service that fulfills unmet needs, and you don’t get greedy or impatient and take care of every customer, word-of-mouth will travel and you will grow. The unfortunate reality is that nobody seems to want to wait for that or believe that. The good news is that in today’s interconnected world, word-of-mouth travels more quickly.
![]() Note No matter what, all marketers should be primarily focused on customer service and satisfaction, brand loyalty, and subsequent word-of-mouth. These should come before any other marketing decision.
Note No matter what, all marketers should be primarily focused on customer service and satisfaction, brand loyalty, and subsequent word-of-mouth. These should come before any other marketing decision.
There is other good news as well. There are some ways to use traditional media and newer media outlets synergistically to create sales. In addition to word-of-mouth, these newer Internet outlets—such as blogs, podcasts, and online videos—as well as social networking applications like LinkedIn, Facebook, and Twitter—allow companies to create their own content. (We discuss these in Chapter 6.) They are no longer controlled by advertising departments, media buying restrictions, and certain space or time limitations. These options are cheaper and in many ways more effective. However, these actions must all be done with strategy and analytics in mind, and with an approach that’s integrated with the more traditional channels. Additionally, as we discuss later, you must consider your customers. What channels do they listen to? Where are they?
The biggest challenge in marketing and advertising isn’t understanding how to use these new forms of advertising; it involves two things. First, the measurement and accountability of marketing programs via analytics and business intelligence (BI) is a necessity. The company absolutely has to give the customers what they want and know exactly how to communicate with customers. “The balance of power has moved, inexorably and forever, from the company to the customer”.1
The second important marketing priority of the day is knowing when to stop using outdated forms of advertising (please, oh please stop using billboards and television advertising). That’s what this chapter is about. On the one hand, it’s learning how to stop the hemorrhaging of money that leaves companies all in the name of marketing, advertising, or sales, yet never amounts to any benefit. On the other hand, it’s learning how to rearrange and set the marketing department, its functions, and its duties so that everything is tracked and everyone is accountable. This ensures that the marketing department doesn’t operate just because people think they need marketing, but instead, forces the marketing department to be a profit-making center in its own right.
Prime Areas of Waste
AMC’s Mad Men, a show about advertising executives in the 1960s, makes great TV, but bad marketing strategy. If you’ve seen the award-winning show, you likely know what we mean. The show illuminates excess in the areas of entertaining and advertising waste. In the series, companies that hired the advertising firm allowed them great leeway to make creative advertising campaigns. In order to bring these accounts in to the advertising firm, the firm spends massive amounts of time and money on everything from dinners, to liquor, to prostitutes. Aside from the unethical nature of these behaviors, they are horribly inefficient. When they are as exaggerated as they are in Mad Men, most of us can see how wasteful these actions are. However, in the real world, it is harder to see the waste.
We have laid out some of these common areas of marketing waste in Figure 3-1. These are organized based on the commonly used schema of the “4 Ps” (Product, Place, Price, and Promotion). These 4 Ps become marketer’s tools to satisfy customers. When the marketer picks a product that meets the customer’s needs, promotes it in a way that the customer will see or hear, prices the product correctly for the customer, and gets it to the customer, better sales should theoretically result.
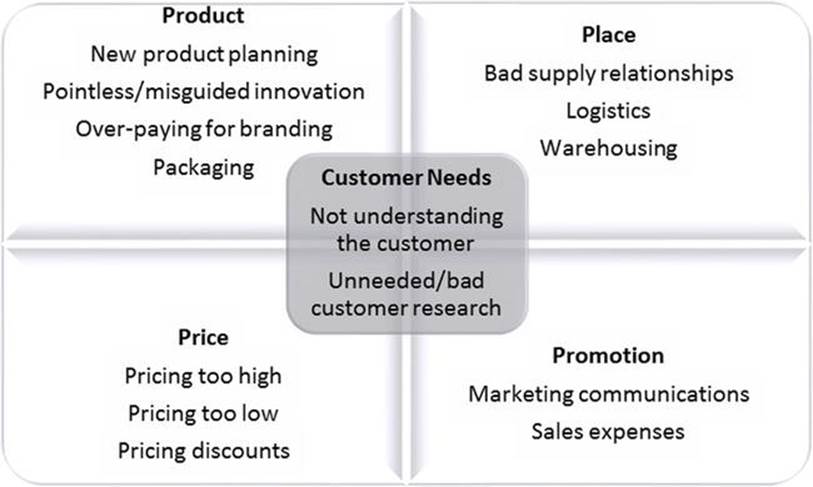
Figure 3-1. Areas of Waste in Marketing
We cannot really say where companies waste the most marketing money in comparison with the other areas. First, companies are so different. Some companies rightly spend lots of money on warehousing (such as Amazon.com), whereas other companies don’t have or need warehouses (such as a barber shop, or most any service company). The chart in Figure 3-2 shows the average percentage of the overall firm budget that companies allot to marketing.
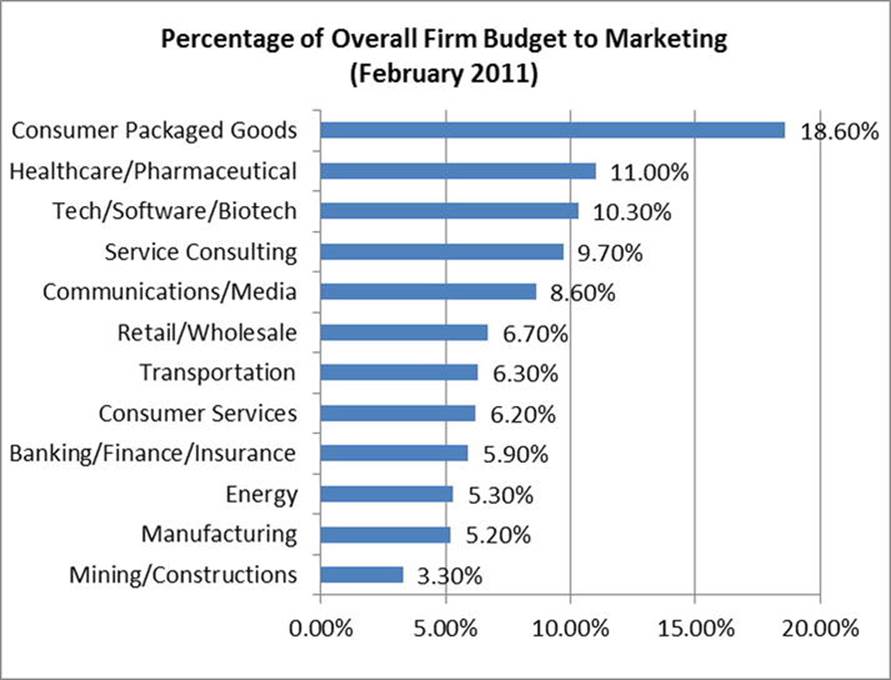
Figure 3-2. Percentage of Overall Firm Budget to Marketing. Source: Christine Moorman, “Predicting the Future of Markets, Tracking Marketing Excellence, Improving the Value of Marketing Trends,” 2011, http://www.cmosurvey.org
Whereas our example makes sense (Amazon.com has more warehousing expenditures), it does not make sense that consumer packaged goods require more than three times the marketing budget of an industry like banking. True, consumer packaged goods require more R&D, but that certainly doesn’t explain why they spend nearly twice as much as pharmaceutical companies. By looking at the chart, and turning on any TV or opening any magazine, you can quickly see that the 18.6 percent figure is evidence of a ridiculous level of overspending. This is even more disturbing when you consider the pharmaceutical example. For every dollar pharmaceutical companies spend on “basic research,” $19 goes toward promotion and marketing.2
Another reason why it is so hard to pinpoint waste is that the expenses don’t necessarily end up in the same budget line item. New product planning could be expensed in the engineering department in one company and in R&D or marketing in another. Or logistics could be included with marketing or supply chain management. Referring back to Figure 3-2, companies spend an average of 8.09 percent of their firm’s overall budget on marketing. When adjusting for items that frequently rest in other categories (R&D and supply chain), it is likely that over 20 percent of firm’s budgets goes to “marketing.”
BIG BUSINESS OVERSPENDING
Note that the total marketing spending of 8–20 percent is a significantly higher figure than the one presented in Chapter 1 in Figure 1-1. Chapter 1 discussed small business expenses. Large companies typically inflate their averages because they spend much more on marketing. This information brings up two very important thought-provoking issues. First, 20 percent of any company’s budget is way too much. Imagine how much of this money a company could use to treat its employees right, lower prices, or simply make more money. Second, if the small businesses can make due with less money, why do big businesses need to spend so much more? Are sales truly a function of the amount spent on marketing? We address these issues later in the chapter.
Because of budget discrepancies, we simply present the areas of likely waste in this section. Then, we spend most of the space in this chapter dealing with how to measure and improve upon each category.
Customer Needs and Market Research
There are two interconnected, broad categories of waste surrounding the customer. One deals with not understanding the customer’s needs, wants, desires, and value systems, and the other deals with bad market research aimed at attempting to understand these customer needs. It all goes back to research, and many times, it is extremely inefficient. U.S. companies, in fact, spend an estimated $6.7 billion annually in marketing research out of the estimated $18.9 billion spent globally.3
The American Marketing Association (AMA) defines marketing research as:
“Marketing research is the function that links the consumer, customer, and public to the marketer through information--information used to identify and define marketing opportunities and problems; generate, refine, and evaluate marketing actions; monitor marketing performance; and improve understanding of marketing as a process. Marketing research specifies the information required to address these issues, designs the method for collecting information, manages and implements the data collection process, analyzes the results, and communicates the findings and their implications.”4
According to that definition, the key premise of marketing research is collecting accurate information about the customer to allow decision makers to satisfy the customers. This research (as with everything in a company) must translate into real dollars. These dollars come from real, valid, and reliable information and business intelligence that helps a firm make important business decisions, such as introducing a new product that will increase profits.
As much as it pains me—a marketing professor who has spent almost two decades conducting marketing research—to say this, the problem with this assumption lies in the very word “accurate.” We believe market research is a massive area for waste because it seems for most companies that it is simply impossible to collect this information with any kind of accuracy. Later in this chapter, we are going to tell you that you cannot proceed with your other marketing expenditures until you understand your customer, but the research must be done correctly. Let’s now focus on just a few reasons why research tends to be so wasteful.
Wrong Market Research Techniques
There are numerous ways executives can gain information about their customers. We have listed a few of these in Figure 3-3. Most executives are familiar with or have at least heard of these. The question of market research methods rarely comes down to a marketing manager not knowing what research is or what the methods are, but instead, not knowing how and when to use them.
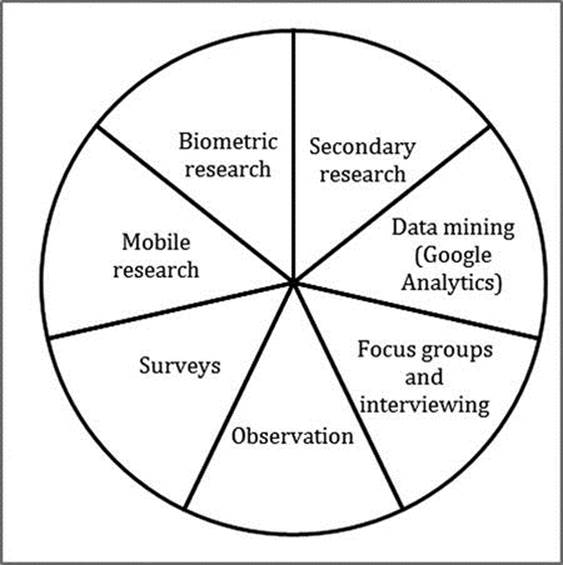
Figure 3-3. Various Types of Market Research
For example, in our careers we have witnessed the repeated and repeated and repeated use of focus groups (the redundancy is purposeful here). It seems to be very common in the world of business to bring in a group of consumers before a new product launch, sit them around a table, and ask them questions about the new product. Then, the word of the focus group is typically used as gospel when determining how and when to launch the product.
Focus groups are probably one of the worst forms of research, yet nearly all businesses use them. Focus groups, made up of about 8-12 people, can never be representative of a larger population. They generally tend to be bored housewives and older Americans—anyone who can afford to take 2–4 hours out of a day to answer questions. Then, participants almost always talk about the product in ways in which they would never behave in the marketplace. Focus groups are also subject to groupthink. The data is basically worthless.
Surveys have similar issues, and yet are also used by just about every company. You can ask and ask all the questions you want, but you have to think about who is taking the time to respond to your surveys and how well your survey questions are written. If you send the survey to customers, you will likely get very dissatisfied people or very satisfied people, or people who have nothing better to do with their time.
Even worse is data garnered from customer panels. We have seen data from customer panels where it is very obvious that more than half the responses are scammers. People are happy to get $10 a survey to take 100 surveys falsely. Additionally, surveys frequently have one or two questions and rarely get to any detailed level. For example, a question might be, “Were you satisfied with your service?” Maybe yes, maybe no, but what does that mean? It’s often useless data. So, any research gathered in this manner is a waste. Don’t take this wrong. Surveys can beneficial, but only when they are done properly, with good questions and a representative sample.
Today, so much data is available. You should make use of that data before taking the time and resources to collect your own. One example of this is Google Analytics. According to their website, Google Analytics can help you learn which marketing efforts are most effective, understand accurate website traffic patterns/trends, and determine which customer and customer segments are most valuable. It can also help you understand where visitors come from and what do they do on the site, how you can convert more visitors into customers, which keywords resonate with prospects and lead to conversions, and which online ad or creative is the most effective.5 There is a multitude of this type of data available to marketers today, including Amazon Redshift. It should be about how to mine and analyze the available data first; don’t waste money collecting new data until you’re sure it doesn’t already exist.
![]() Note Combine newer techniques such as “big data” and biometric data with more traditional methods to create a reliable and valid picture of your customer’s needs.
Note Combine newer techniques such as “big data” and biometric data with more traditional methods to create a reliable and valid picture of your customer’s needs.
When data is gathered firsthand, we strongly recommend using experienced market researchers with a PhD. We also strongly encourage you to consider new techniques such as biometric data. Such data allows researchers to track eye movements over a web page or test brain waves as an ad is viewed. However, one note of caution (and probably the most important note here): no one technique should ever be used in isolation. Multiple techniques should always be employed and data should be amalgamated. Every technique has its disadvantages. By employing multiple techniques and looking at the data together, you get a better, more accurate picture. This sounds like we are arguing for more money to be spent in marketing research, which could create more waste. We are calling for more initial research, but this doesn’t mean you should have some massive market research gathering project underway every day. You should consistently keep a pulse on the market and competitors, and create a schedule for other, more major research projects. Additionally, getting an accurate picture to begin with is a lot cheaper than launching a campaign with inaccurate data.
Weak Statistical and Analytical Capabilities
Once you have data from research, you need to know how to analyze it. According to a recent survey of more than 250 executives, 40 percent said they base their major decisions on judgment instead of on business analytics, many times because good data isn’t available.6 (We suspect that at least some of these executives don’t want to take the time to understand the data.) This same survey found that 36 percent of managers felt that they simply did not have enough analytical talent.7 A Harvard Business Review (HBR) study found that managers said they depend on data for just 11 percent of customer-related decisions.8 Furthermore, the HBR study tested marketers’ statistical aptitude and found that almost half (44 percent) got four or more questions wrong out of five intermediate-to-basic statistics questions, and a mere six percent got all five right.9 Only five percent of the marketers admitted to owning a statistics textbook.10 Another survey by CMO Insights found that only 3.4 percent of executives strongly agree that they have the right talent to analyze market research data. Refer to Figure 3-4 for the study data.
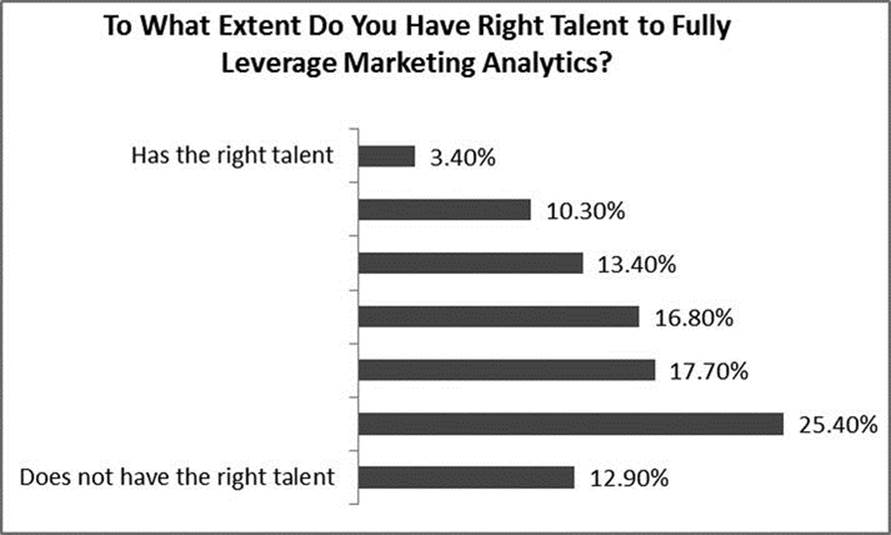
Figure 3-4. Analytical Resources Available to Companies. Source: Christine Moorman, “Big Data’s Puzzle,” 2013, http://cmosurvey.org/blog/big-datas-big-puzzle/
These statistics might be why, in spite of more data being available, fewer companies are choosing to use it. Figure 3-5 shows that a dismal 29 percent of projects in a 2013 CMO study actually used available data, down from 37 percent in 2012. Certainly, one of the first activities in any project should be assessing any available data.
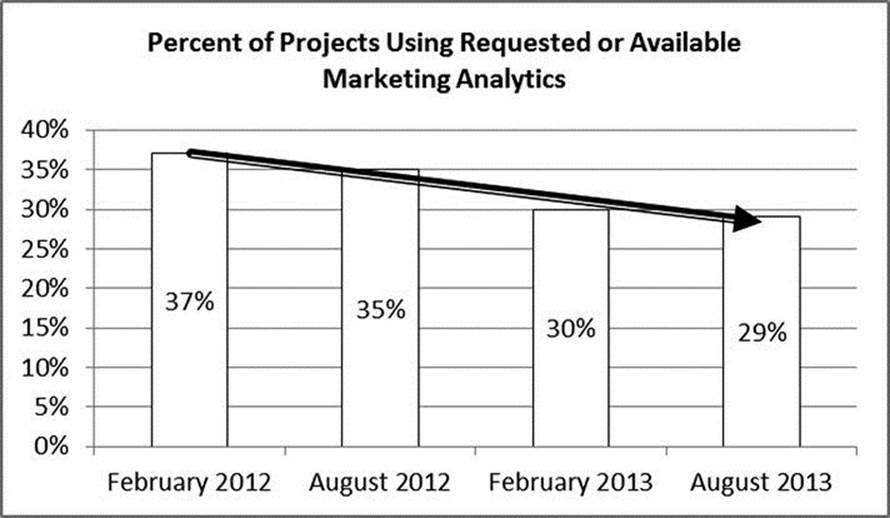
Figure 3-5. Projects Using Available Data. Source: Christine Moorman, “Big Data’s Puzzle,” 2013, http://cmosurvey.org/blog/big-datas-big-puzzle/
We do not have a lot to say on this topic. Not because it is not important. In fact, this is probably the single most important topic in this chapter. We don’t spend much time on the subject for this reason: it’s pretty black and white. If you do not possess the analytical and statistical tools to conduct appropriate, valid, and reliable marketing and sales analytics, find someone who can. If your company is too small, use an outside market research company (but heed our warnings later in this chapter about external research firms).
By appropriate analytics, we mean appropriate given the tools and technologies available to the market researcher in 2014. The Williams (2011) study, cited previously, lists some the terminology a business intelligence (BI) person should know (see Figure 3-6). If you or your staff finds these terms challenging, this is a sign to find someone more capable. It is simply not acceptable to “wing it” in this day and age. Any efforts designed toward collecting data are a complete waste if you do not know how to analyze the data and make sense out of it.
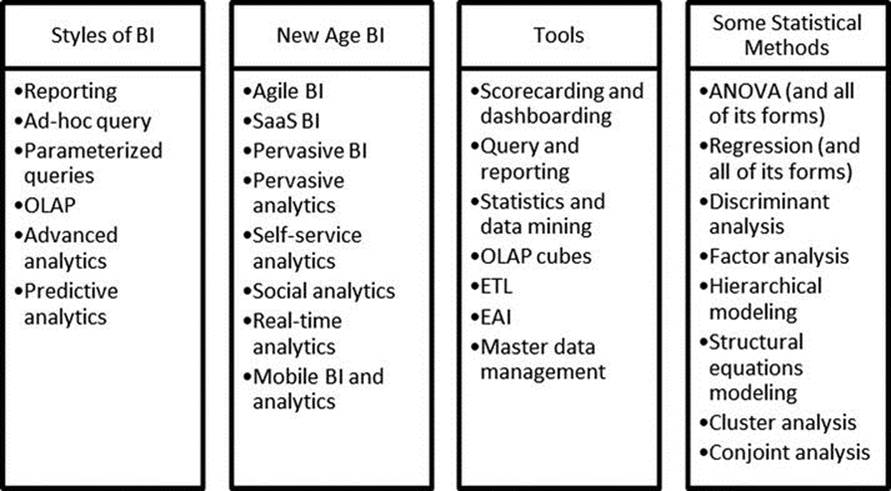
Figure 3-6. Trends and Terminology in Buisness Intelligence. Source: Steve Williams, “5 Barriers to BI Success and How to Overcome Them,” Strategic Finance, July 2011, 27–33
Figure 3-6 shows just a few of the many terms and tools used in business intelligence. Someone looking at supply chain analytics may care less about social analytics. For the marketing executive, BI success means having complete information about:
“Individual customers to enable such things as better customer segmentation, more precise campaign targeting, improved customer service and customer retention, more timely campaign return on investment (ROI), improved ability to determine customer lifetime value, a better understanding of the price elasticity of demand, and improved tools for category and performance management.”11
We cover these areas in the final section of this chapter.
![]() Note You won’t survive in the marketplace today without advanced statistical and analytical market intelligence skills. Any attempt to do research without these capabilities is a waste.
Note You won’t survive in the marketplace today without advanced statistical and analytical market intelligence skills. Any attempt to do research without these capabilities is a waste.
Cognitive Biases and Other Irrational Consumer Behaviors
Even with the best research, you need to consider that consumers seldom know what they want. There is virtually no data to support the notion that customers understand their own decision-making processes. In fact, in the words of Robert Cialdini, customers “buy emotionally and defend rationally.”12 This logic has been shown to be true time and time again. If you ask customers after the fact why they bought something, they will very logically and rationally tell you why. If you bring someone into a focus group or ask someone on a survey about buying decisions, they will think about their decisions very rationally and give very logical answers. These answers will never explain why someone buys a worthless throw pillow, knick-knacks, overpriced coffee, pet rocks, or jelly bracelets.
There is, however, an exorbitant amount of data to show that customers are very irrational. There are literally hundreds upon hundreds of cognitive biases (tendencies to think or do things in certain ways, which are a departure from rationality). For example, the framing effect comes into play when Williams-Sonoma cannot sell a stand mixer for $289. However, when it’s placed beside another stand mixer priced at $469, sales explode. The $289 stand mixer seems like a good deal when it’s next to the more expensive item. Another famous cognitive bias is called the gambler’s fallacy. In this fallacy, people think that if a coin flips to heads five times, the chances of getting tails next time is much higher. In actuality, every flip has a 51–49 percent chance (refer to a physics text on why it’s not 50/50), regardless of the number of times it is flipped.
Marketing research, or the general study of how consumers behave in the marketplace, helps us know these little odd facts about human behavior. It provides insight into all the psychological principles and aspects of consumer behavior, from the effects of lighting and music to proper store placement. This type of research is normally conducted by psychology and marketing professors. Although not all of this research is accurate and even relevant, it is available to marketers.
The greatest challenge with this type of research is that the typical marketer does not read the sources of this information (Personality and Social Psychology Review, Psychology and Marketing, and Journal of Consumer Research are just a few examples). It would be quite a monumental task to sift through all of the academic journals across many disciplines to find a few relevant facts. There is the even greater challenge of determining which of these irrational behaviors are coming into play and when.
On the other hand, market research, which is performed by a company in regard to a specific product or consumer, will likely never consider all of these cognitive biases and other issues that will destroy any well built market study. More importantly, the irrational sides of consumer behavior cannot be predicted, so it would be nearly impossible to incorporate these successfully into a marketing strategy. You cannot rationalize the irrational. Additionally, market research studies are typically focused on one particular problem, which makes it impossible to consider all the other intervening variables that affect study findings.
![]() Note The most well designed market research cannot account for all the cognitive biases and other irrational behaviors that exist in consumers’ minds. If you use enough data from enough sources, analyzed in enough ways, you will eventually filter out the noise.
Note The most well designed market research cannot account for all the cognitive biases and other irrational behaviors that exist in consumers’ minds. If you use enough data from enough sources, analyzed in enough ways, you will eventually filter out the noise.
We’re not going to tell you how to deal with these biases, because you can’t. Many astute marketers will use these biases to their advantage, almost as a form of manipulation. The Williams-Sonoma example does this. Using an advertising slogan such as “the fastest selling product” does the same thing by hitting on a social proof nerve—everyone wants to do what everyone else is doing. We like these as long as they are not manipulating the consumers, but there is a very fine line. We suggest you use the data you have to make good decisions. If you use enough data analyzed enough ways, you will eventually filter out the noise. We don’t think the problem is necessarily filtering out the bad data, but instead, collecting so little data that the irrational becomes the only picture you have. We cannot say this enough times. Any business decision you make without accurate data is a waste of time and money.
![]() Note Any business decision made without accurate data is a waste of time and money.
Note Any business decision made without accurate data is a waste of time and money.
Marketing Silos
Another very real problem with business intelligence that comes from market research is that it does not utilize information garnered from other departments and disciplines. As discussed in Chapter 2, a large problem in many companies is the use of functional silos. A recent study showed that most marketers believe silos—both internal and external to marketing—prevent them from effectively executing campaigns.13 Some of the most important information about customers is housed outside of marketing.
For example, imagine the company that has all of its shipping and return data housed in the warehouse. The only person who ever looks at it is the shipping manager. All she cares about is ensuring that her employees are shipping the correct product in an efficient manner. She doesn’t especially notice that one product, the F-400, is being returned at a rate of 15 percent. Meanwhile, the marketing manager begins to wonder why sales are down. So, he takes the time and money to send a survey to his customers to find out what their level of customer satisfaction is. He gets a two percent response rate and it shows that his customers are happy and satisfied. Nobody seems to communicate with one another to figure it out. When looking at this very small amount of data, it is pretty easy to make an educated guess about what is occurring. There is a quality issue with the F-400. Customers are so frustrated that they had to take their time and energy to return the product; they are not going to take more time and energy to fill out a customer satisfaction survey.
![]() Note Market research in isolation is wasteful. You must consider data from all relevant departments.
Note Market research in isolation is wasteful. You must consider data from all relevant departments.
This example is, of course, overly simplistic. In the real world, businesses have data from just about every outlet available. Everyone takes their data and stores it in their own way. John puts his information in an Excel spreadsheet, Sally has SPSS files, Jim stores print-outs in hard copy on his desk. Very few companies are forward-thinking enough to integrate data from every department and from all external sites, such as industry reports, panel data, data provided from a company’s CRM software, and many other sources. Very few companies integrate this information so that it can help the business make better decisions. If this is how things work at your company, market research is probably a waste. If you are running your own independent department, stop collecting data and work to integrate it before you do anything else.
Outsourcing Market Research
When market research is outsourced, this is commonly referred to as Knowledge Process Outsourcing (KPO). For the purposes of this chapter, we would like to say this. While outsourcing your market research can provide advantages, it can also be a huge hole for market department waste. The largest problem with outsourced research tends to be plugging the problem into a one-size-fits-all approach.
We use an example from our personal lives to illustrate the point. Many doctors have started automatically sending out surveys after every visit. Our children’s pediatrician does this with a wonderful third-party provider. The survey is very long and detailed, and it covers 90 percent of what I would consider are necessary characteristics for a good medical provider. This survey is very different from what I have seen from some other doctors. Some doctors send very short, standardized surveys that mean nothing. These are very common because outsourced providers don’t know the unique needs of your business. Figure 3-7 shows a brief example of a typical customer-service evaluation.
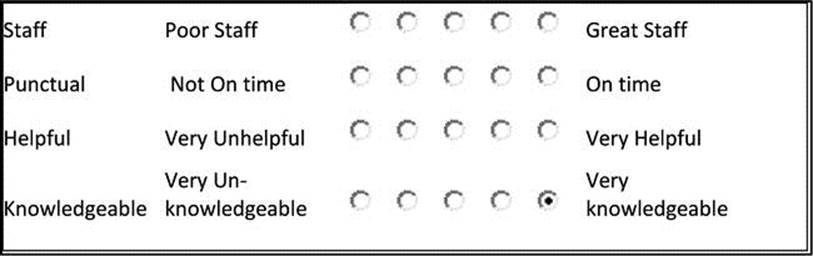
Figure 3-7. Typical Doctor Satisfaction Survey
The biggest complaints about doctors tend to be that they are arrogant, they don’t communicate well, they do not use a holistic approach, they don’t seem to care, and they don’t take the proper amount of time with each patient. These factors sometimes lead to customers changing doctors. Sometimes patients can’t change doctors due to insurance reasons and high switching costs. But none of the information gathered from the survey in Figure 3-7 even begins to the address these issues. Typically, when you outsource your market research, you get this type of data. They just don’t understand your unique product or market.
Market Research Done Right
In summary, in the words of Philip Graves:
“Investment in market research goes beyond a simple waste of money: it corrupts an organization’s ability to learn and, if that wasn’t damaging enough, can lead to untold waste in the pursuit of strategies and initiatives that would never have been developed with an alternative—and psychologically informed—approach to understanding consumer behavior.”14
If you don’t conduct your market research properly, you’ll not only waste money now, but you’ll also waste hoards of money in the future because you enter into a series of subsequent bad decisions, each building on the last, each wasting more and more money.
Before you begin any research project, follow these simple rules:
· Define and establish the goals for your information needs.
· Conduct an information audit so you know what you have and don’t have. Make sure this audit is conducted across every department.
· Thoroughly know and understand what data sources are available by big data providers.
· Gauge which methods, tools, and analytical procedures are most applicable.
Once these questions are answered, you can move to developing the structure of your market research project.
IBM conducted a study about how companies conduct market research (Figure 3-8). They found some striking differences between the top-performing companies and all others. There were drastic differences in how data was used and integrated. The line in Figure 3-8 shows how the difference between the top-performing companies and all others impacts the bottom line. Consider that companies that utilize up-to-the-minute information technology across all channels perform 5.6 times better than those that don’t. Companies that adjust product and promotional offerings based on market research findings perform 5.6 times better than companies that don’t. Also, companies that apply advanced analytics to determine how much to spend on media and those that detect transactions, struggle in real time, and take rapid action perform 2.2 times better than those that don’t. What does this mean? Market research is a quintessential part of any company’s strategies and actions. But it has to be done right. You must understand market research; don’t try to wing it or rely on outdated techniques. Doing so is a catastrophic waste.
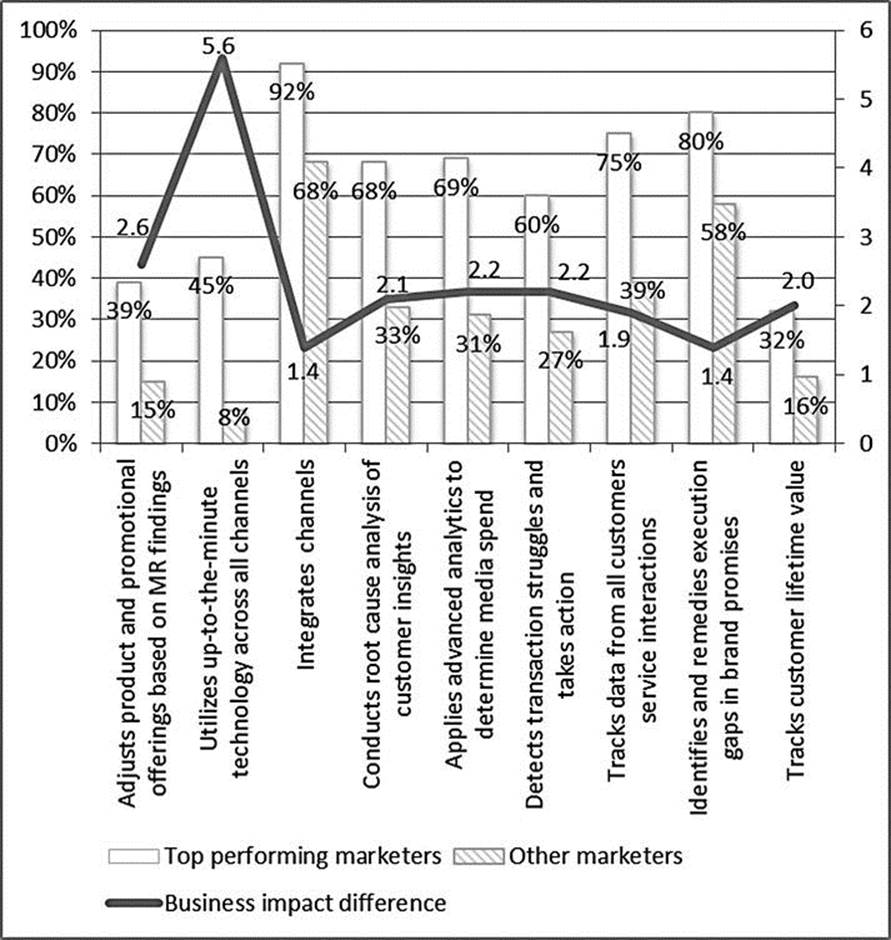
Figure 3-8. Market Research Techniques Used in Top-Performning Companies. Source: Kimberly Whitler, “What Are The Biggest Challenges Facing Marketers According to New IBM Study?” Forbes, May 21, 2013, http://www.forbes.com/sites/kimberlywhitler/2013/05/21/what-are-the-biggest-challenges-facing-marketers-according-to-new-ibm-study/
Waste from Product Decisions
As we have and will say throughout this chapter and book, perhaps the best way to avoid waste in marketing activities is to understand that branding, customer service, and word-of-mouth are the most influential concepts! In this section, we discuss these important concepts, along with new product development.
We talked about the common misconception that a company must grow at all costs in Chapter 2. But there are areas where growth actually makes sense, such as when you’re growing a current product or creating a new one. Sometimes, for the sake of growth only, leaders develop products that nobody wants or needs. The development, marketing, and sales of those products all lead to waste, because there wasn’t a need in the first place. Companies do this frequently with “new” models. The old model is selling very well, but in an effort to grow sales, the company launches the new-and-improved model.
Companies spend a large part of their budgets on new product development, but may have low success rates, leading to mediocre returns on investment or worse. If sustainable growth and good profit margins are a function of innovative products and processes, then new product development is a critical part of the business. Of course, like all areas of business, there are egregious wastes in the product development cycle.
Brand Loyalty, Customer Service, and Word-of-Mouth
It doesn’t matter how cool your product is, how much money you dump into advertising, or how many discounts and sales you have. If customers don’t love your product, they won’t buy it repeatedly. They won’t tell their friends, and they will often leave in search of a product they do love. Let’s look at some statistics:
· Most Fortune 500 companies lose 50 percent of their customers in five years.
· The average company communicates only four times per year with customers and six times per year with prospective customers.
· It costs 7 to 10 times more to acquire a new customer than it does to retain an existing one.
· A 5 percent increase in customer retention can increase profits 25–125 percent!
· Seventy percent of the time, customers leave companies because of bad service, 15 percent of the time due to product dissatisfaction, and 15 percent of the time due to price.
· The average company has a 60–70 percent probability of a sale to active customers; a 20–40 percent probability of a sale to lost customers; and a 5–20 percent probability of a sale to prospective customers.
Notice the cost of losing customers, as well as the cost of replacing them with new customers. If you do nothing else, keep your employees and your customers happy. Happy employees definitely make for happy customers. Happy customers make for more happy customers. More customers reduce costs. This all means higher profits. This is how to grow a business. The incremental profits you earn by keeping customers happy are presented in Figure 3-9. The incremental losses you incur by not serving customers well are presented in Figure 3-10.
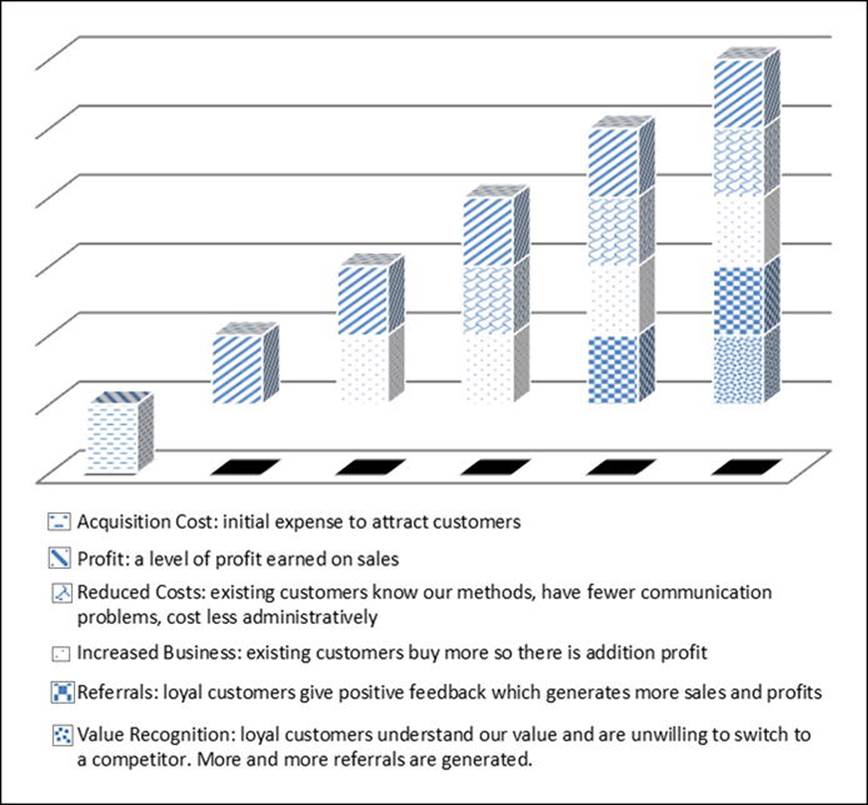
Figure 3-9. Customer Loyalty Leads to Incremental Profit Increases
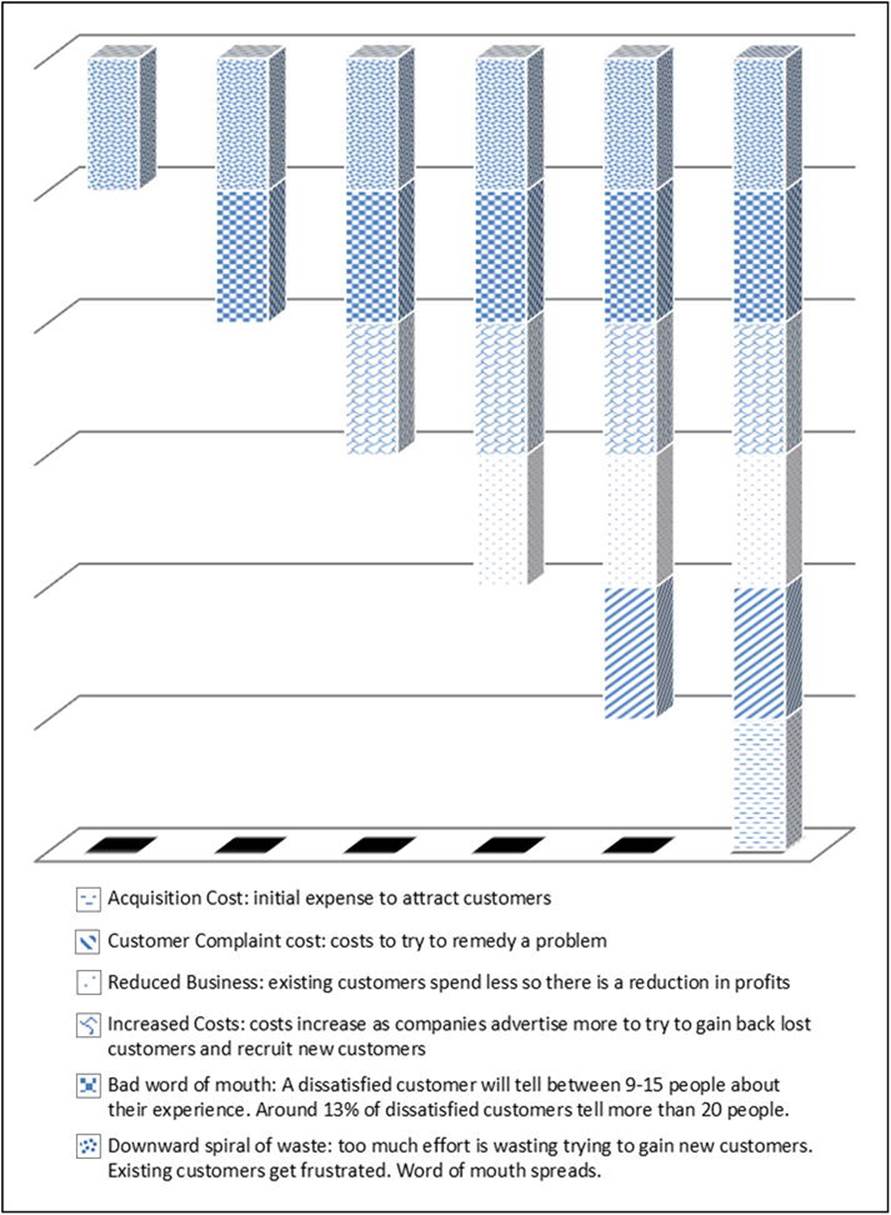
Figure 3-10. Customer Dissatisfaction Leads to Incremental Profit Loses
![]() Note If you do nothing else in terms of marketing efforts, keep your employees and customers satisfied.
Note If you do nothing else in terms of marketing efforts, keep your employees and customers satisfied.
Every company must know what their customers are worth and do everything they can to make them happy and to keep them coming back. (We go through the specifics of calculating customer lifetime value in Chapter 4.) Companies must communicate with customers often, but not in an annoying way. They must give the customers what they want and need to know. Companies must always provide exceptional services and product quality.
These lessons sound so painfully simple, but are many times forgotten. We once knew of a company that sold premium executive furniture. After buying a $50,000 granite board room table, one customer requested a free set of protective placemats to protect their investment, which were priced at $800. The company said no to this request, thinking that they didn’t want to lose $800. That $800 easily cost them over a half a million dollars in future sales. Think not only about the future purchases that did not happen, but also all the bad word-of-mouth that was likely spread. Not investing in customer service and brand loyalty creates countless waste. You need to consider the following steps to build loyalty among customers.
Create and Maintain a Brand Personality
First, make sure you understand why your customers chose you. There is a whole line of really fluffy, cheesy consumer behavior research on “brand personalities.” But, as cheesy as it sounds, it is helpful. Customers think of brands, products, and services the same way they think about personalities. Further, customers choose brands the same way they choose friends. These attributes must be in sync with how the customer views himself and his aspirations.
For example, we feel a stronger loyalty and connection with our small, locally owned, organic grocery store. You get the feeling from the store when you enter. You smell the organic-store smells (coffee, herbals, and international spices). There are almost always free samples. They give kids free bananas and apples. The same clerks work the registers. The entire place just feels healthy and hippie-ish. As you read through this, you can probably picture the traits of this store: healthy, wholesome, family friendly, customer oriented, and environmentally friendly. These characteristics suit us, and make us want to come back. Some reading this might think this sounds like a terrible place. That’s okay. No product is going to suit everyone.
You have to give the customer an overall experience, or they won’t have a connection to your product. This connection has to be very powerful. It makes no logical sense, but when I shop at a different grocery store I actually feel guilty, almost as if I were cheating. This feeling comes from the overall experience they’ve created. This store has never advertised and has only a minimal website. That’s not where the connection is created. It comes from how customers are treated during every transaction. This is one of the biggest places where countless marketing dollars are wasted. The single most important thing any marketer should do is create a brand personality and overall brand experience and connect it deeply to the target market.
Meet and Exceed Expectations
Part of market research entails knowing what your customer wants in terms of an experience and expectations. This goes beyond not only understanding what they want in a product, but also includes what will make them happy. This is all based upon expectations. Some people are quite loyal to McDonald’s and go back time and time again. If you ask these people why they go, we seriously doubt it is for the highest quality beef. People go to McDonald’s for consistency, low price, and quick service. When someone goes there and gets that, they are satisfied. But, obviously, if you went to a five-star restaurant and got McDonald’s-quality beef, you would be disappointed.
People expect different things from different providers and it is the marketer’s job to understand those expectations. As long as the expectations are met or exceeded, the customer will be satisfied and quite possibly become loyal (and then begin to tell others about their positive experiences).
Here’s another example. As parents of four children, we have dealt with many daycare providers. We are constantly amazed by how many daycare providers know very little about what parents want from a daycare. Just from our personal experiences, we have found enormous differences in what we value as parents and what providers try to provide (see Figure 3-11).
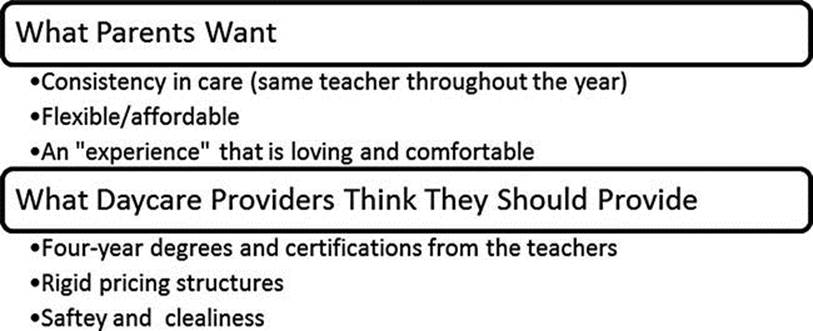
Figure 3-11. Sample Perception Gap Between Customer and Provider
Now you might look at this simple diagram and think, of course, every parent wants all of the things in Figure 3-11. First, we have made this example very simplistic, so we are sure there are many things we are missing. But second, you must understand the subtle differences between the various levels that customers consider when they perceive products and services. Refer to Figure 3-12. At the most basic level, there is the generic product. In a daycare, obviously, everyone expects that their children will we taken care of, fed, cleaned, and so on. Parents expect that children will be safe and happy. If these items are not provided, parents will be upset, but these things alone will not “satisfy” a customer. These are basic expectations that have to be met.
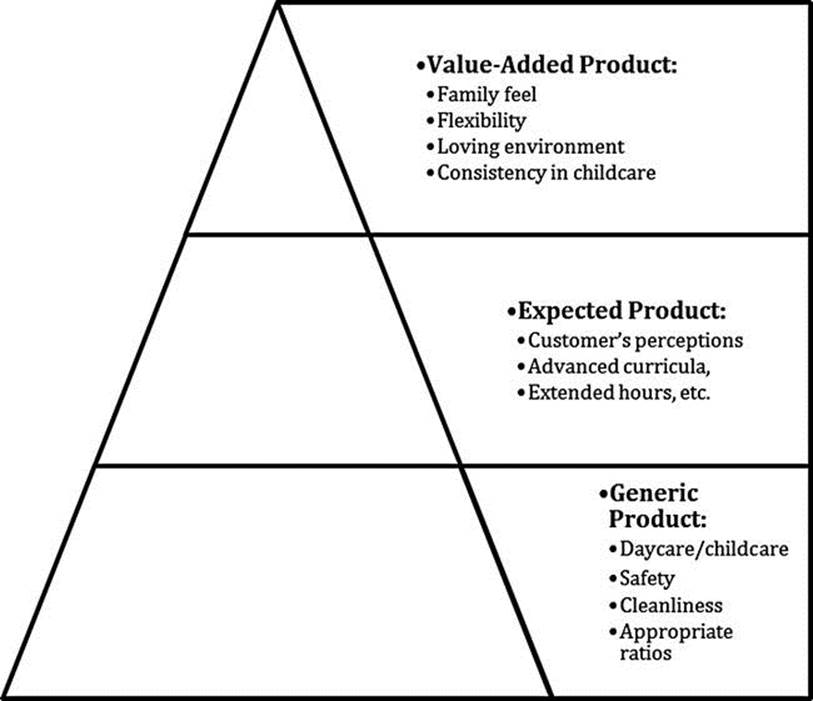
Figure 3-12. Levels of Expectations in Products and Services
Beyond that, there are expected products. In a hotel, a customer expects economy at a Motel 6 and luxury at the Ritz Carlton. In the daycare situation, based on the individual customer’s desires, items like advanced curricula, extended hours, and other factors that differentiate between providers might come into play. These attributes still don’t provide “satisfaction.” They merely differentiate between providers. One parent is going to need a 24-hour daycare; the next parent will want a certain teaching style or curricula.
Finally, customers want the value-added components of a product or service. These are the items that provide the satisfaction, the brand loyalty, and the eventual word-of-mouth. When looking at the value-added components of a daycare (family feel, flexibility, loving environment), how often do you see daycare care providers concerning themselves with these goals? They typically get hung up on the generic and expected product. These do not create an overall brand experience and they don’t really satisfy a customer to the point of being brand loyal.
As you read this book, think to yourself, do you know which value-added product/service attributes your customers care about? If not, any marketing efforts are wasteful because they are likely targeted in the wrong direction. This is the message that has to be communicated through your marketing expenditures. The only way to understand the customer’s desires is through good market research. Most research does not get to the deep level of understanding that we refer to here.
Be Consistent
The final component to building brand loyalty is consistency. If you create a brand experience, understand your customer’s value-added needs, but provide the brand experience haphazardly, you will not see improvements. Brand experiences must be consistent. As previously described, McDonald’s is a great example of consistency. Customers aren’t in search of high-quality beef; they are in search of consistency and affordability at McDonald’s. Most customers are fairly forgiving and will accept a mistake or two. But over the life of the relationship, you have to provide consistency.
Encourage Word-of-Mouth Referrals
So, now that you understand better what it takes to create loyal customers, how do you get customers to spread the word? You don’t. Referral programs and Facebook likes are frequently seen as desperate attempts to get customers when you haven’t figured out what you should be doing right. Our current daycare does an excellent job at providing the generic product and the expected product, but has virtually no value-added products. They are very clean and safe and do everything by the book. The teachers all have four-year degrees and they have a very advanced curriculum. However, we feel like we are going into a “business” there. There’s no homey feel. Our children have rotated through multiple teachers so the extra connection with each teacher is missing. And they are not flexible with special needs.
We get weekly e-mails about their referral program. If we refer someone to their program, we will get $100 off the next month’s tuition. There are also random opportunities for $5 Starbucks gift cards if you “like” them on Facebook or leave a positive comment about them on an external site. I have in the past referred people to daycares. I have taken the time to leave both bad and good comments about daycares, doctors, and establishments on websites. I never did any of these things for money. There is only one way to build word-of-mouth. You must build value and satisfy your customers!
![]() Note Identify customer’s brand personality desires and value-added product desires through good market research. Then provide these. Doing so builds value, customer satisfaction, and brand loyalty. Brand loyalty encourages word-of-mouth referrals. No referral program can override the natural chain of events.
Note Identify customer’s brand personality desires and value-added product desires through good market research. Then provide these. Doing so builds value, customer satisfaction, and brand loyalty. Brand loyalty encourages word-of-mouth referrals. No referral program can override the natural chain of events.
Overpaying for Branding
Branding is key to getting return customers and word-of-mouth business. While a nice memorable brand or logo won’t create loyalty, it helps give the customers something tangible to identify with. In fact, companies have been known to acquire other companies just to take over the brand and use it to increase business. However, there is no reason to spend time and money on “branding.” We feel that is a waste. There is no correlation between how much you spend on your brand and your overall brand identity. Figure 3-13 shows the disparity between some very well-known brands where there was zero investment and others where the investment is extreme. The average company spends between $2,500 and $10,000 to develop a logo, whereas some of the most famous brands, like Coca-Cola, Google, and Twitter, spent very little or nothing to develop their logos.
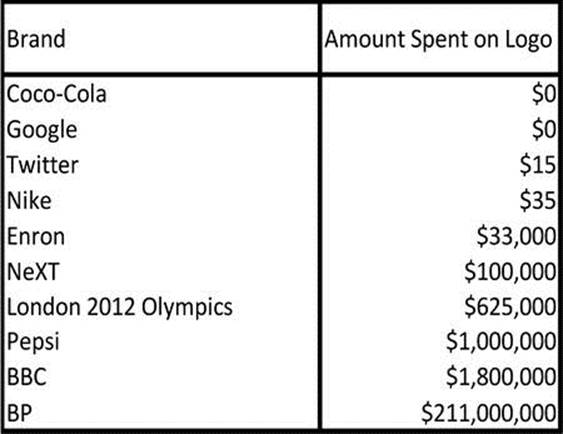
Figure 3-13. Logo Expenditures. Source: Stampler, Laura, “Here's How Much Money the World’s Biggest Brands Spent Designing Their Logos,” Business Insider, August 14, 2012, http://www.businessinsider.com/heres-how-much-money-the-worlds-biggest-brands-spent-designing-their-logos-2012-8?op=1#ixzz2tdDDvK5Z
Does a fancy logo build your brand? How about advertising? We explore the advertising wastes in the promotion part of this chapter, but it deserves mention here.
Automotive makers are big on using commercials to build brand awareness and brand loyalty, but in reality it is a combination of a few factors that influence buyers. These factors include the look of the car, performance specifications, buyer history, budget, features, and the items we just talked about in the brand loyalty section. Certain vehicles like the Ford Mustang and the Dodge Charger have a strong base of loyalty due to their history as classic cars and their design, but even the popularity of these cars does not make one loyal to an entire company.
As we just discussed, companies need to deliver consistent quality at a fair price to make others talk about the products or services. Take Sears, for example. Sears built its reputation for standing behind its products through the Craftsman tool line. Many people in the 1980s and 1990s would pay extra and go to Sears to buy all of their tools, including power tools, because of the quality that they would get for the money spent. Sears also had a great reputation for its appliance sales and service. It built the Kenmore brand to stand for a reliable appliance with features only offered at Sears. While working in the appliance industry, I learned that all of the major appliance manufacturers build Kenmore products. Kenmore still was a high-quality brand because of the changes that even the low-quality and low-price suppliers had to make to meet the Sears standards.
![]() Note A creative logo will not build brand loyalty. Don’t waste the money.
Note A creative logo will not build brand loyalty. Don’t waste the money.
That’s the thing about brand loyalty. It takes years, if not decades, to build solid brand loyalty, and you do it by having good, consistent performance. No beautiful logo can create loyalty. The loyalty can disappear with a few simple mistakes. Remember the formula introduced in Chapter 2: Y=f(X). Brand loyalty is the Y in this formula and there are many Xs that drive that Y. Buying a logo and spending money on advertising are wasteful activities when your goal is to build a brand. In order to avoid this waste, instead build a good product or service at a fair price, learn what your customers desire, and be consistent. Let your customers build your brand awareness for you and be brand loyal. Look at Google. Their logo changes daily.
New Product Planning
Waste from a new product development process usually comes from not knowing when to kill projects that are obviously doomed to failure, as well as having an inefficient process. Both can cost the business money, potential market share, and customers who will never be replaced.
Killing Bad Products/Projects
Robert Cooper and Scott Edgett invented the stage-gate product innovation process to help companies identify bad products or bad projects prior to completion so they can kill them. This process was designed to fix the first major source of waste, which is not killing projects or products that should be killed until it is too late. The process is similar to milestones in a project-management method, with the exception that at each milestone there is a decision to keep or kill. There is also a group of cross-functional leadership who makes the decisions. Leaders often introduce new waste to eliminate other waste. The stage-gate process is another example of this. There is preparation for each gate, which requires resources. Also, there are resources used to work on the projects between stages that may not proceed past the stage-gate. Both of these wastes are acceptable because they are better than the waste associated with fully developing a failing product.
In contrast to the stage-gate process, Figure 3-14 shows the reality of most product development processes, whereby the company develops its own products or processes rather than being a contract manufacturer or developer for someone else’s ideas. The company starts with many ideas. Some of these ideas are immediately killed during the first review. A cross-functional team of leaders might decide for some reason that the concept will not be successful. This is the first project tollgate and the first time projects are killed. The remaining list of projects is then vetted against the market, investment costs, and projected margin. This leads to the second tollgate. At this stage, ideas are killed because they don’t meet minimum requirements, are cleared for progress to the next stage, are postponed for a future product development cycle, or are flagged for some changes to be cleared for progress to the next stage.
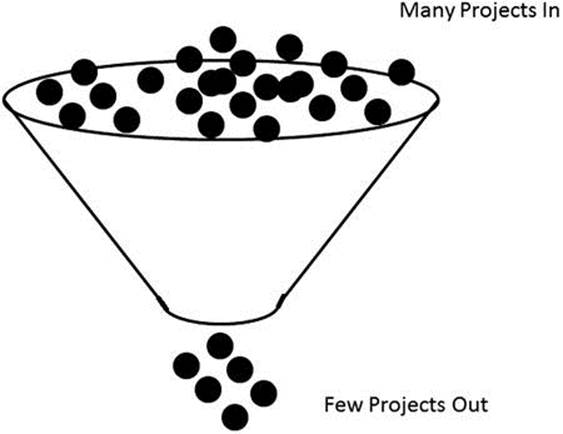
Figure 3-14. Project Funnel
At this point some creative people, who probably make between $60,000 and $120,000 per year, have come up with ideas. The majority of these ideas will go nowhere, but that is actually the least wasteful part of the process. Instead of finding out what the customers want, this is the “spaghetti-on-the-wall” strategy. These ideas are vetted using gut instinct. Gut instinct is analogous to wasting hundreds of thousands of dollars.
The other stages beyond these initial stages will vary depending upon the product or service being developed, but the idea is that the project teams will work on the deliverables for each tollgate in order to have their project progress to the next stage and eventually to market. Along with the waste from work directed toward meeting the deliverables, there is also potential “wishful thinking,” which involves presenting invalid data at these tollgates. The teams are motivated to make their projects look attractive regardless of reality, so there is additional waste that must be introduced to validate the numbers. In order to avoid these wastes, the project teams shouldn’t perform their own analysis. Independent parties should test any assumptions, validate the data, and prepare those portions of the tollgate that need objective opinions. This helps not only by ensuring honest information, but also by allowing the creative and motivated team members the freedom to develop the best product.
![]() Note While setting up new product development processes creates waste, it is much less wasteful than pushing bad products through the cycle. Have cross-functional teams analytically evaluate products at each tollgate.
Note While setting up new product development processes creates waste, it is much less wasteful than pushing bad products through the cycle. Have cross-functional teams analytically evaluate products at each tollgate.
Inefficient Product/Project Development
By ensuring that each deliverable from each stage is in place to help with the go-forward decision is also part of making a good product or service, you can minimize wasteful activities. For instance, ensuring that the product or service is priced correctly can help lead to success, so controlling costs and reporting on them frequently are not wasteful activities. It is important that any tollgate process ensure that project deliverables or minimum performance thresholds are met to have a purpose beyond an approval process.
As with any process, no product development process is perfect. Figure 3-15 shows some data on a study conducted with 1,000 companies. The study shows that just having a development process in place with certain characteristics can be correlated to the outcomes of the project. So we can conclude that not having a process in place is a mistake and waste. Additionally, you must have a well-documented and well-utilized process. If not, they are just wastes that keep the company from realizing its full potential.
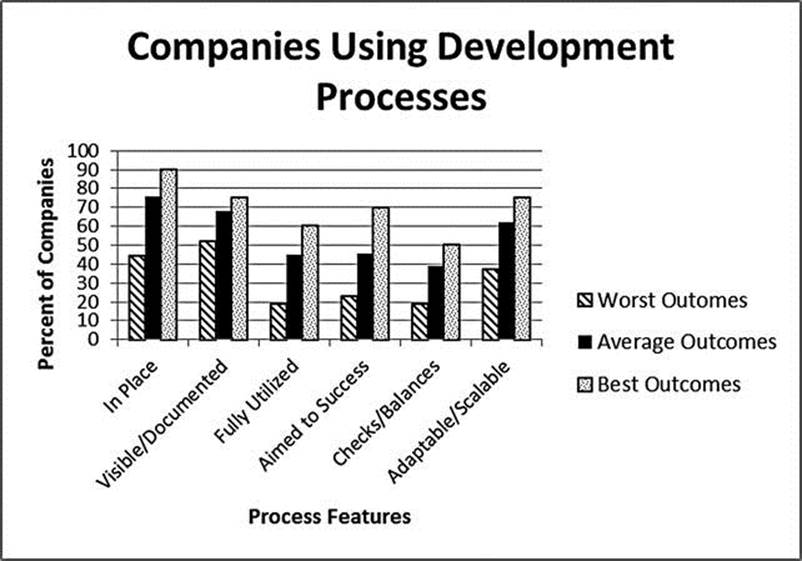
Figure 3-15. Outcomes from Using Development Processes. Source: Cooper, Robert and Scott Edgett, “Best Practices in the Idea-to-Launch,” Reference Paper #45, Stage-Gate International, 2010
![]() Note New product development processes must be visible and well documented, fully utilized, and flexible. There must be multiple checks and balances along the way.
Note New product development processes must be visible and well documented, fully utilized, and flexible. There must be multiple checks and balances along the way.
In order to develop a good process, you start by mapping out the next few development projects. The reason that you don’t go back to recent projects is because you will have to try to remember the details of the previous projects. By mapping out the projects as they happen, you will have a more accurate process map. Along with mapping out the process, you will want to note how much time each step takes, including any wait time between steps. Assuming that there are sufficient differences between the next few projects, this will give you a good basis to develop a standardized development process that you can build upon with continuous improvement.
You can now start developing the standard process. Identify the common elements from each project. This is the skeleton of your standard process. A development process usually kicks off with some kind of information gathering, whether it is gathering customer requirements or market data. This is an opportunity to create a standard form, which you can then use on all projects.
Once you have a starting point for the information gathering, along with a process skeleton, you can start looking at all of the process steps that were not common on the projects that you mapped. You may want to ask some questions like:
· Why did we do this step?
· Did the customer require this step?
· Was this step a regulatory requirement?
· What was unique about this process that made this step necessary?
· Did we get what we expected from this step?
· Why would we use this step in the future?
The process of answering these questions will lead you to a decision point in your standard process. This will identify under what circumstances you will deviate from your process skeleton to perform this special step. Repeat this analysis on all of your process steps. Figure 3-16 shows a simple version of a process. The normal process is only three steps, but if you have a special requirement, it turns into a five-step process. Obviously, your product development process will have many more steps.

Figure 3-16. Initial Process
Once you have the process mapped with all of the potential decision points to understand how complex your process is, you can label the times for each step on the process map. With this information, you can see how quickly you can complete a simple project versus the time it would take to complete a more complex project. Figure 3-17 shows how long it takes for each step. In this example, the gray areas are the simplest processes. This simple process is eight weeks long, according to the process map. But, if our decisions take us to a more complex process, the process could take between 12 and 17 weeks. Once all of the paths are identified, it is time to ask some questions about whether our standard process is the right one.
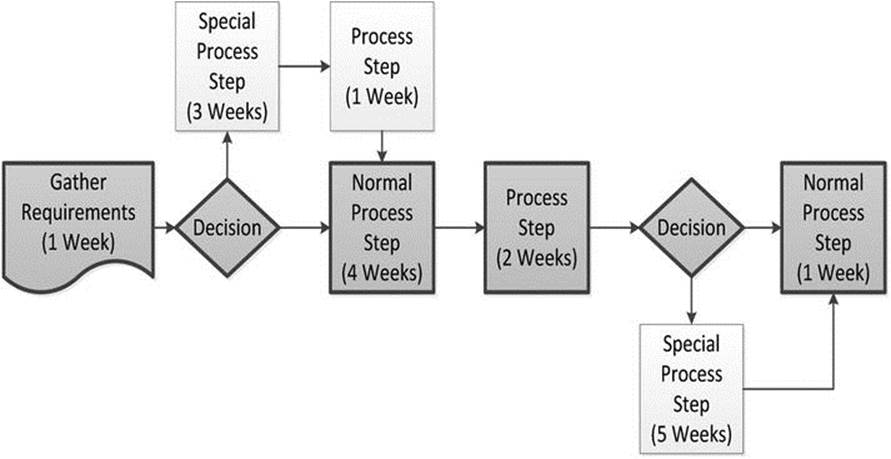
Figure 3-17. Process with Data
First, you validate that the process meets your requirements or the requirements of all of your customers. If it does, you move on to looking for waste in your process to make it more efficient. If the process does not meet your needs, then you find out what you must add to meet those requirements and add it. When you have your process with all requirements met in place, it is time to make it more efficient. So, you may ask, ‘Why we would improve efficiency of our processes when we meet our customer expectations on timeliness?” You do this to improve your competitive advantage. If your customer needs you to develop your products or services within 17 weeks, as shown in the previous example, then you are able to meet those needs. If you can offer your customer 12 weeks or less and still meet all of the requirements, then you will likely get more sales due to happy customers and a differentiating skill.
You can make the process more efficient by eliminating steps through automation, by eliminating activities that don’t add value, or making the steps take less time. You can also automate approval processes. You may want to consider removing some of the stage-gate criteria to reduce analysis time. Even if you choose not to offer the time savings to your customer, you can use the time as a buffer to help with critical chain project management. This is where you take the just-in-case time built into each project step and remove it. You save the time in a buffer, added to the end of the project. You may also put smaller buffers prior to major milestones. By removing the extra time in each process step, you are more likely to finish on time and not need the buffer.
Once you have your process map and have eliminated the wastes discussed in Chapter 2, you need to put together your structure for your project to help ensure success. The first step to getting any project off the ground, whether it is a product development project or a process improvement project, is to have a good sponsor. The sponsor should have the authority to help push the project forward through the stage-gate process. The project documentation should identify the sponsor as well as the cross-functional team that will work on the development project.
The overall development cycle should be documented as well. Typically, this cycle is determined by the customer’s needs or the seasonality of the business. This timeline brings up another source of waste in organizations. This is the waste caused by starting the development process too late to follow the process that you have designed. This late start may be the result of multiple delays including customer commitment delays or senior management review delays. This waste causes you to spend extra resources trying to hit deadlines with less time. This delay may also cause you to miss your deadlines, leading to unhappy customers. In order to avoid this waste, the process needs to have drop-dead dates where a project does not move forward unless it is kicked off prior to the deadline.
Although you should have an idea of what the customer needs are at the project kickoff, once the team is put together, you should conduct a needs analysis. The tool that you use will depend upon the experience of the team and what type of project you are working on. Data from customer complaints, customer requests, or warranty issues can be used to help support this analysis.
Cost Management
Changes during product development cause a great deal of waste. In order to avoid this waste, you can identify the process for handling changes prior to project kickoff. This process includes how time will be negotiated or how you can get additional resources to execute the changes. This is especially important because in a matrix-style organization, it is likely you will not be working on only one project. Your time constraints mean that changes affect not only the current project but also those concurrent projects that share human resources with the changing project. Designing the process using the project buffers mentioned earlier will help you manage change. (We discuss more about how to manage your projects and avoid wastes in Chapter 8.)
![]() Note Product development follows a process. Take the time to develop efficient and effective processes in order to make product development your strategic advantage.
Note Product development follows a process. Take the time to develop efficient and effective processes in order to make product development your strategic advantage.
Waste from Packaging
Consumer product companies often spend a lot of time and money designing and building attractive packages to catch the consumer’s attention. This is not wasteful activity. Studies have shown that up to 75 percent of purchasing decisions in Europe are made in the store. In Brazil, the percentage is 88. In the United States, it is 70 percent.15
There are four types of waste that can be created from packaging: waste in packaging because the package is poorly designed to utilize the point-of-purchase (POP) decision processes; waste from the use of expensive or unneeded materials; waste from damage to the product; and waste because the packaging creates excess logistics expenses. Businesses must balance these wastes to ensure that sales are achieved with a solid profit margin and without product damage. In order to avoid the first two wastes, you need to have a good product development process with POP needs-identification and package durability studies.
The packaging design has a definite ROI when properly done. Sales volume can increase when a package is attention grabbing. There are a few rules when designing packaging:
· Grab attention with colors and create curiosity.
· Know your competitors’ packaging. You will be sitting right beside them.
· Use eye-catching market research, not just on your product, but with your product mixed in with your competition’s.
· The unique selling points of the product should appear very clearly on the front on the package. Think billboard mentality. Do not include a lot of small detail on the front.
· If your product will be sold online (and on Amazon.com), make sure the product description includes the unique selling points. Customers are more willing to read online than in the store. Give more detail about the product’s ingredients, instructions, and so on.
· Be kind to the consumers. Don’t make it difficult for the consumer to store or use the product.
On the other hand, some companies have realized some benefit to designing packaging at a minimum cost. Those who ship via UPS and FedEx have designed packaging to meet the requirements of the sorting equipment used by these logistics giants. Others like Walmart use packaging design and reusable packaging materials to minimize costs while maintaining the POP display benefits. IKEA designed its packaging for shipping and warehousing and used the space savings to build elaborate showrooms to drive the purchase decisions.
Promotional Expenses and Advertising Effectiveness
As explained earlier, brand loyalty is more important than just about everything else. Getting a good product or service out there, one that fulfills market needs and that subsequently creates brand loyalty and word-of-mouth, is the best path to marketing success. Because this theory is seldom followed, an enormous source of waste in business is from promotional expenditures, which typically includes everything from sales to advertising. As mentioned, there tends to be the notion of increasing advertising expenditures in hopes that it will increase sales.
It’s not that promotion necessarily is the largest source of waste; it’s that people think it tends to be the largest enigma in companies. You might think you need to advertise because it’s what you’re supposed to do. Many companies have no idea whether their advertising dollars are generating sales. In reality most types of advertising is ineffective and executives often fail to understand how to incorporate the newer forms of advertising and promotions.
Many companies are starting to understand the idea that traditional media (such as TV, magazines, and newspapers) is no longer the best outlet to reach customers. In fact, Procter & Gamble (P&G) recently laid off 1,600 staffers, mostly marketers, “because Facebook and Google can be more efficient than the traditional media that usually eats the lion’s share of P&G’s ad budget.”16 But a question remains; what is efficiency? How do you measure it? How do you determine your best strategy? How do you determine where you should spend your money?
Even though some firms like P&G have mass advertising departments to determine their promotional strategies, they still seem to struggle and get the messages wrong. When those types of companies can’t figure it out, how can the small business owner prevent do it?
We see two large areas of waste in promotion. The first is not knowing which media to use and the second is spending way too much money in the promotional budget. We conducted our own completely unscientific survey. In our study (and yes we are using the word study loosely), we asked over 100 people to think about products they had purchased in the past year and tell us why they brought those products (we ended up recording a total of 129 shopping experiences). We know that customers will work to be very logical in defending their purchases. So, we are not capturing all of the emotions that go into purchasing. We know our sample is not representative of much. We also know that we are not capturing some of the underlying effects that might be happening, such as the “sleeper effect.” In this, a person sees an ad, but doesn’t even remember seeing it. They are drawn toward the product at a later time.
In our survey, we got a fairly broad range of business-to-consumer products. Clothes were by far the largest category (see Figure 3-18).
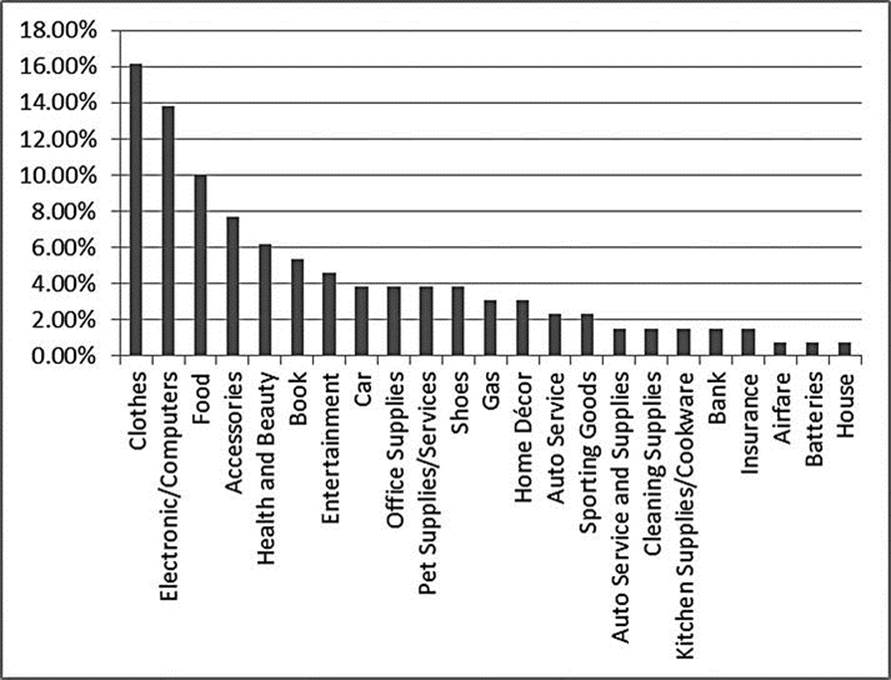
Figure 3-18. Percentage of Purchases by Category in Our “Study”
Figure 3-19 shows the main reasons why people chose the product they did. An overwhelming 28 percent of the purchases were made because of brand loyalty. Word-of-mouth encompassed seven percent. Taken together, these two factors accounted for over a third of the purchase decisions. These reasons stretched across all categories of products. We suspect that this number would be much higher if the products required more investment, such as houses and cars, instead of clothing and iPods. Although there are a couple high-investment products in Figure 3-19, the majority are not.
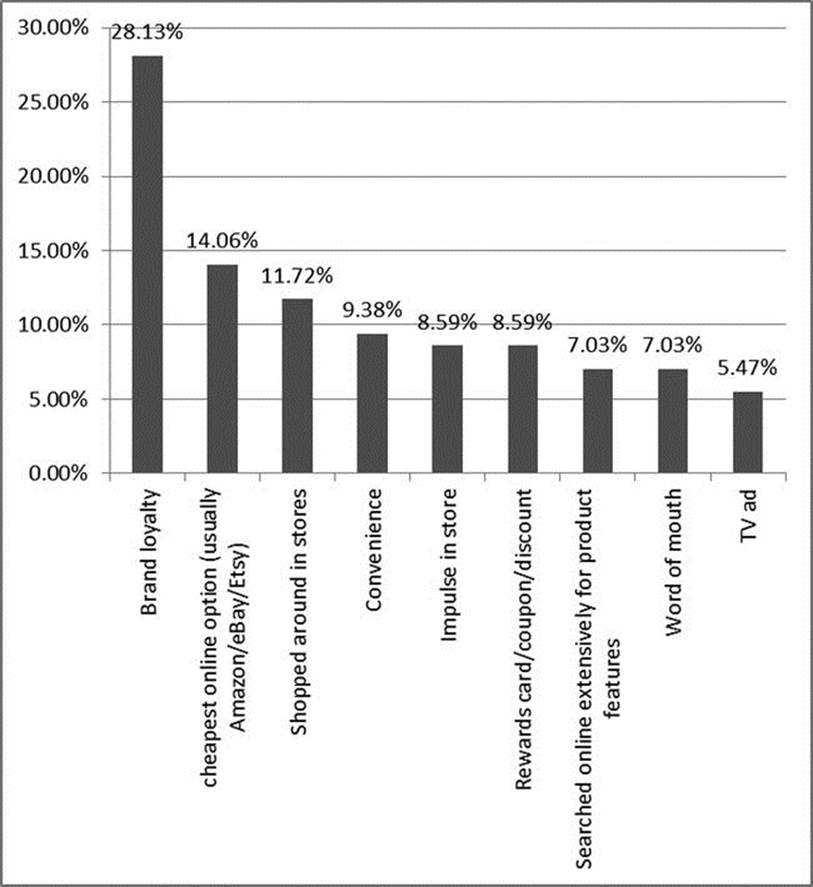
Figure 3-19. Reasons for Purchases in Our “Study”
Establishing brand loyalty and spreading it via word-of-mouth is the single most important thing any marketer should and can do. Measuring the impact and success of brand loyalty and word-of-mouth efforts should always come first.
The second biggest way that buying decisions were made in our survey was online searching for the cheapest price (14 percent). This typically was not truly “searching for the cheapest price,” but instead, “I went to Amazon and searched for the cheapest price,” or “I went to Etsy and searched for the cheapest price.” Therefore, in almost every case, this wasn’t really a function of price, but instead a function of being “brand loyal” to an online retailer. Once again, loyalty matters. Or in the product world, getting your product displayed in the right place on the most user-loyal sites matters. Then, make sure you are cost effective among your competitors. Between this and the “convenience” factor, which accounts for more than 9 percent of purchase decisions, you could almost go back to the old, location, location, location, mentality. We might not be talking about the right street corner anymore, but location clearly still matters.
Shopping around in stores and purchasing impulsively account for almost 12 percent and almost 9 percent, respectively. In order to capture these spending dollars, you need to have effective packaging. More than seven percent of the purchases were made after significant online research. We believe this to be the determining factor for the large majority of any high-involvement, high-dollar purchase, whether it is B2C or B2B. In order to win these buyers, you need updated product information on your website that is easy to find and also have those product features match buyer’s needs (refer back to product design). We also feel that content marketing is very important here, which we discuss in Chapter 6.
The only two categories left are coupon or reward card usage at 8.59 percent and purchase made from a TV ad at 5.47 percent. That means, out of all the purchases in our survey, a small number of purchases (five percent) were made because of some form of advertising. Rewards cards or coupons are doubtfully bringing new customers into a retail outlet or to a new product. Many times these are sent to already loyal customers. These are either not necessary and wasteful, because the customer was going to buy again anyway, or they are effective. These can create more loyalty because the customer feels the provider is taking care of them or the coupon gets the customer to act quicker or at a certain time. It is up to you to do the research and determine the motivation and outcome of coupon usage.
This brings us to the puny five percent of purchases that were made because of advertising. Keep in mind that these purchases were all made with fairly inexpensive products in the B2C realm. If this “survey” were taken on a more extensive scale, such as with larger purchases in the B2B realm, this figure would disappear to almost nothing. It is uncommon for promotional effort to generate sales on large items.
In terms of thorough analyses of real advertising dollars, probably the best study of advertising efficiency ever conducted was done by Cheong and Colleagues (2013). It studied the top 100 advertisers (which make up 49 percent of advertising) over a 22-year period (1987–2007).17 In a very fancy regression equation, the authors found that advertising inefficiency has increased over time. You would think that with more tools, bigger databases, and better analytical techniques, advertising efficiency would get better. However, this study found that approximately 59 percent of top advertisers are inefficiently using their ad dollars.
Six forms of advertising were examined: magazines, newspapers, TV, radio, outdoor, and the Internet. The total spending in each category is shown in Figure 3-20.
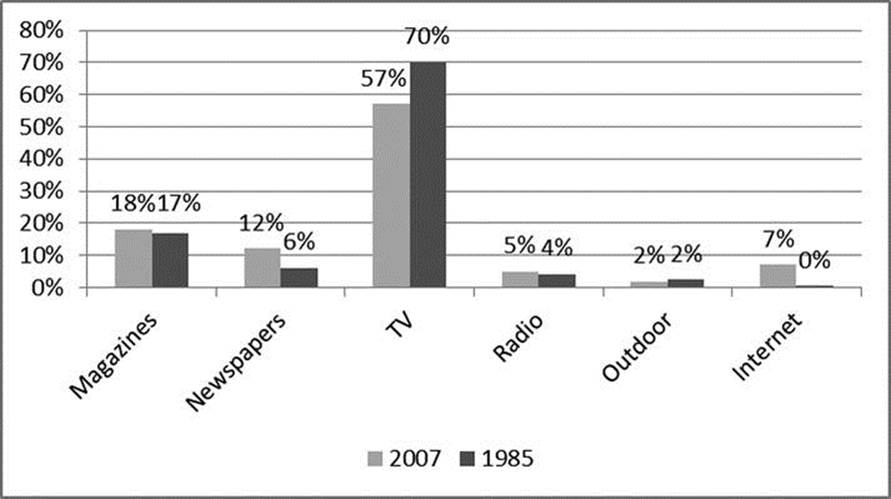
Figure 3-20. Total Advertising Spending by Media Category. Source: Cheong, Yunjae, Federico de Gregorio, and Kihan Kim, “Advertising Spending Efficiency Among Top US Advertisers from 1985 to 2007: Overspending or Smart Managing?” working paper
The most inefficient forms of advertising are magazine and outdoor spending. Although no forms of advertising were actually found to be efficient, the “best” form of advertising was the Internet. It was found to be neither efficient nor inefficient. This inefficiency is basically over-advertising. When companies over-advertise, the additional money spent on advertising creates no additional sales. Many times, the added money actually decreases sales, because consumers become turned off by the barrage of advertising.
![]() Note Magazine and outdoor advertising are the most inefficient.
Note Magazine and outdoor advertising are the most inefficient.
As far as individual advertisers, 59 percent should actually reduce their spending on advertising in order to produce the same amount of sales, all because of their high degree of inefficiency. In fact, 30 percent of the top advertisers demonstrated low advertising efficiency (below 20 percent). The proportion of inefficient firms overall has increased from 1985 (52.46 percent) to 2007 (64.84 percent). Likewise, the level of efficiency has declined since 1985.
In fact, the mean efficiency score of all leading advertisers for the 23 years was .69. In order to become efficient, advertisers need to produce sales using approximately 31 percent fewer inputs than they did over the 23 years. In fact, the inefficient advertisers among the top 100 must cut $4.28 million per year in magazine ads, $4.21 million per year in newspaper ads, $12.24 million per year in TV spots, $1.35 million per year in radio ads, and $.88 million per year in outdoor ads, and obtain the same sales to be considered efficient during the period 1985–2007. The percentages of advertising that are inefficient and efficient are shown in Figure 3-21.
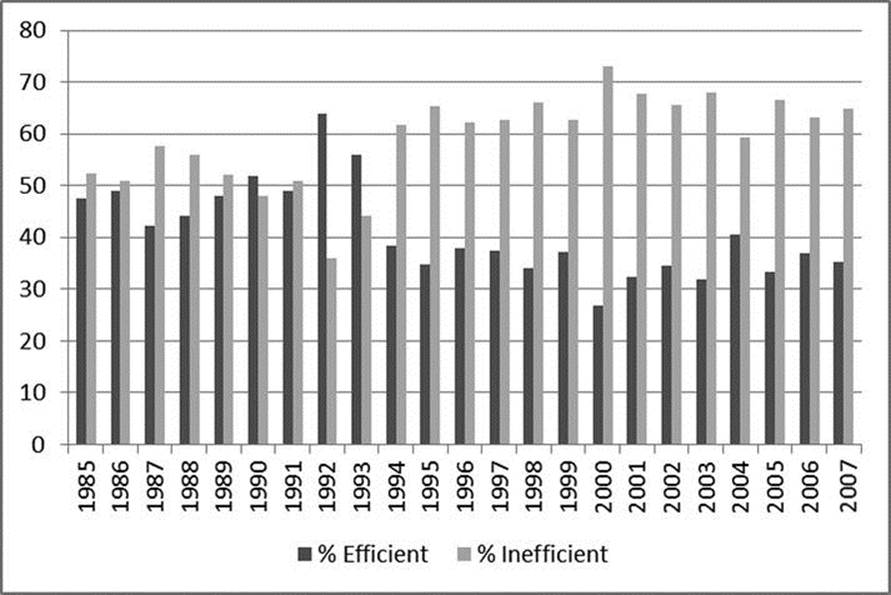
Figure 3-21. Total Percentage of Inefficient and Efficient Advertising. Source: Cheong, Yunjae, Federico de Gregorio, and Kihan Kim, “Advertising Spending Efficiency Among Top US Advertisers from 1985 to 2007: Overspending or Smart Managing?” working paper.
When looking at slack analysis, you can also see that much of the advertising across all six media classes could have been reduced while maintaining the same sales levels for the last 23 years. Slack is another measure of advertising inefficiency. The higher the slack, the more inefficient the medium is. Outdoor advertising has the lowest overall slack and TV has the highest overall slack across 1985–2007.
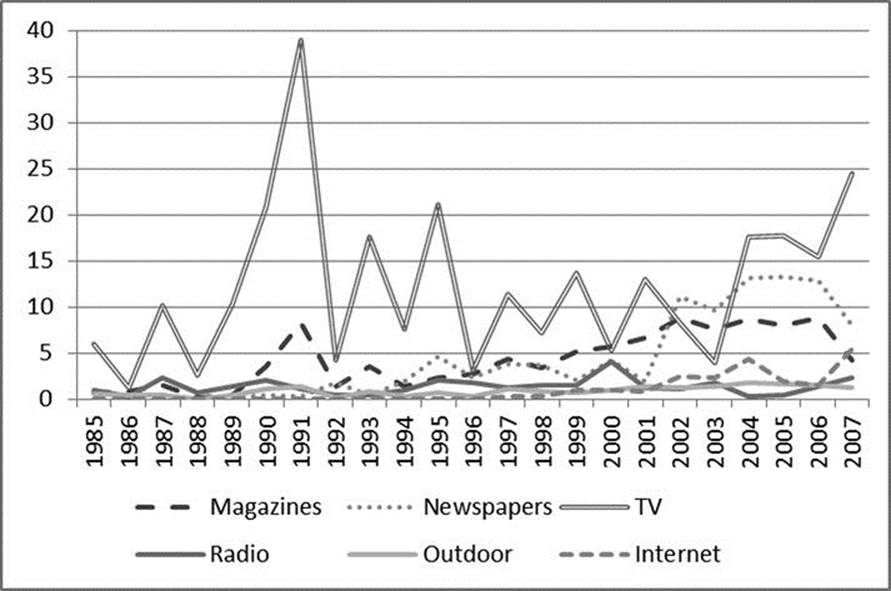
Figure 3-22. Ad Slack: Where Advertisers Need to Cut from Their Budget. Source: Cheong, Yunjae, Federico de Gregorio, and Kihan Kim, “Advertising Spending Efficiency among Top US Advertisers from 1985 to 2007: Overspending or Smart Managing?” working paper
![]() Note Get out of the “we advertise because it’s what we’ve always done,” mindset! Companies are significantly over-advertising! Use small, targeted, personal promotions.
Note Get out of the “we advertise because it’s what we’ve always done,” mindset! Companies are significantly over-advertising! Use small, targeted, personal promotions.
Much of the overspending in advertising is due to the reward structure set up between advertising agencies and businesses. Until relatively recently, compensation has largely used a mark-up or commission system in which agencies charge clients approximately 15 percent of all media billings.18 This system encourages advertisers to buy the most expensive media, not the most efficient one. Likewise, the account managers who buy the time get internal promotions and recognition based on their media buys.
There’s also the whole notion that advertising brings in sales. It is seen as a sort of insurance policy against potential declining sales. Also, advertising is easily understood and somewhat comfortable. In the complicated, fragmented media market, it just may be the easiest thing to run to.
We discuss how to measure advertising effectiveness in the metrics section at the end of this chapter, but we have an important moral here: You have to look societal changes each year. How has your customer changed? Are their searching and buying habits different? What is happening with the economy, the world, in politics, socially? You do not want to be chasing fads and trends. You want to adjust promotional expenditures yearly, but only with a proper data and analysis. Also, do not fragment yourself just to reach one or two tiny niches. Find your best few niches and understand their buying behavior. Have the best product you can, that is key. Always have a great quality product or service and do what you can to help the word-of-mouth spread. It won’t happen quickly, but it’s a waste of money to try any other way. Do not feel you have to advertise because that’s what everyone else does. It is clearly not working for anyone, even the Fortune 500 companies.
Waste from Price
The act of pricing incorrectly is a huge source of waste. Pricing too low results in lost profits, whereas pricing too high results in lost sales (and therefore profits). Price wars lead to company failure, not growth. When a company attempts to grow by offering lower-priced products than its competitor, everyone loses. The company loses its reputation for quality, service, and brand. One of the single most studied concepts in marketing is the price-quality relationship. We know, hands down, that when consumers see a low price, they equate it with low quality. This is why Toyota can sell a car at a certain cost under the Toyota brand and sell the same car with minor changes under the Lexus brand for much more money. Higher cost gives the customer a feeling of greater value.
Additionally, as we have explained, the most important thing to consider is brand loyalty. You are never going to capture brand loyalty by selling at a discount. Best case scenario, with a sale or discount, you might bring in a new customer. But it does nothing to create long-term loyalty. It sounds very cliché, but it’s true; you need a differentiating competitive advantage, and price is not it.
Low Cost
Because low-cost strategies typically drive down profit margins, the company needs to lower the actual product quality through the use of fewer materials, cheaper materials, or reduced service levels. This can be seen in every product-driven industry. As the product matures, the quality goes down due to pricing pressures and the need to maintain a certain margin. In service industries, companies try to outsource call centers and service repair functions to save money.
The best companies, however, continue to innovate and build brand loyalty so that they can charge a premium for new features. When companies focus only on low-cost strategies, they might have to lower the research and development budget in order to afford a lower profit margin. This starts a downward spiral where the lack of innovation within the organization makes the technology of that organization obsolete. Ultimately, this forces the company into extinction or into a situation where they have to reinvest in innovation to escape the low price strategy spiral.
Figure 3-23 shows how consumer decision drivers changed between 2010 and 2011. This shows an increase in trust, innovation, and branding. The biggest change was a decrease in the effect of price on the purchase decision. This information is in the wake of the recent recession, when you would think more people would be concerned about price. Even in this economic situation in the United States, not only did price reduce as an influencer by over 15 percent, but it is the fourth out of the six factors measured in regards to driving purchase decisions. Consumers value quality, trust, and service more than price. Branding is inclusive of service, quality, trust, innovation, and brand (logo/name). If you consider this fact, it further diminishes the minimal effect that price has on decision making.
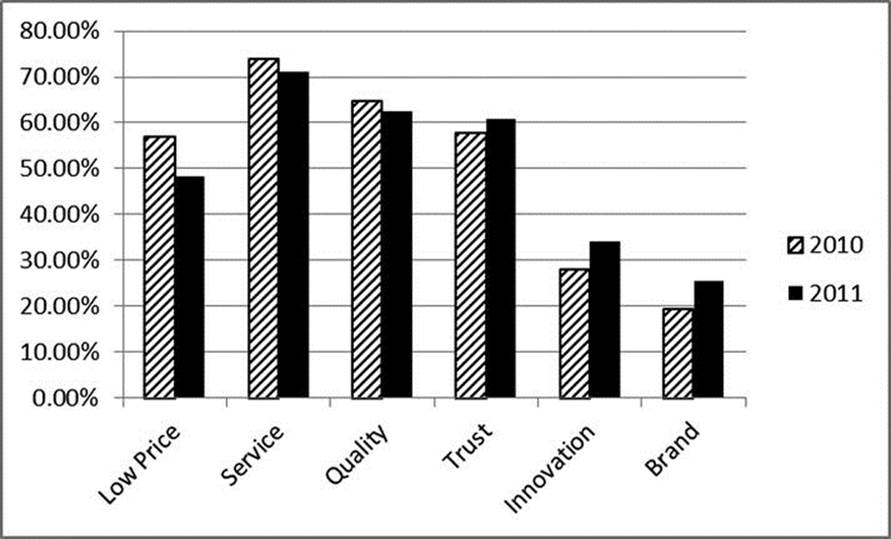
Figure 3-23. Change in Consumer Decision Drivers. Source: Moorman, Christine, CMO Survey, Highlights and Insights, February 2011, TheCMOSurvey.Org
Further, when customers leave one company and go to another, it is rarely due to price. In reality, customers leave a company only 15 percent of the time due to price. The biggest reason customers go to other companies is due to poor service (70 percent of the time), followed by product dissatisfaction (15 percent), which is likely a quality or feature issue.19
So why do business leaders think that price drives sales? Because of one of the biggest business wastes: “That is the way we have always done it.” Furniture stores, for example, think they need to have a sale every week to draw customers into the store.
Businesses often realize when their prices are high due to lack of sales, but more often than not, businesses price their items too low or offer unnecessary discounts. Parker Hannifin realized this mistake when a new CEO took control and challenged the cost-plus margin pricing strategy that Parker Hannifin had been using for nearly 90 years.20 As engineers and production personnel found less expensive ways to make their products, the prices were cut as well. This rationale was not based upon any insight into what the customers were willing and able to pay. His team of pricing experts and consultants found that prices could be raised up to 25 percent in some cases. After an across-the-board price increase, some customers chose to go to another supplier, but most were retained at Parker Hannifin due to the value that their components brought at even at higher prices. After the success that this new strategy brought to Parker Hannifin, they employ pricing experts for each business line to maximize profitability.
![]() Note Pricing should always be based on what the customers are willing to pay (provided there is a profit). Don’t ever use a cost-plus system and never engage in price wars!
Note Pricing should always be based on what the customers are willing to pay (provided there is a profit). Don’t ever use a cost-plus system and never engage in price wars!
Discounts
Pricing discounts are like low-price strategies. The discounts aren’t the primary driver of the purchase decision. Discounts should be given only when there is a good financial reason for them. Such discounts may be given to incentivize the customer to pay invoices quicker. This may be a good strategy for a business that does not have profitability issues, but is challenged with limited cash flow. Payment terms are a type of discount. Automotive and aerospace customers push 45- or 60-day payment terms. These terms turn the supply chain into a bank for the final manufacturer. This strategy makes sense only when there is no other choice or there is a large pool of cash that allows you to give these terms without having to borrow money. If your company is leveraged and offers payment terms that delay payment of invoices, you are paying the interest for your customers and further eroding your margins. You might as well offer them a pricing discount. Avoid this waste by thoroughly understanding the normal discounts and terms offered in your industry. This knowledge, along with the knowledge of pricing strategies, gives you the weapons you need to negotiate the best deal possible with your customers while maintaining your margins.
In the B2C world, there are certain times when it may make sense to offer a one-time price reduction to bring customers to your product. This might work if you have a new product and are encouraging customers to try it. Just remember, customers are always happy to take future price reductions, but not as happy to take future price increases. For example, when new electronics hit the market, they are always priced high. There is a whole separate stream of research based on which customers will buy the new TV at $2,000 and those who will wait three years until it is $700. However, how often do you hear about the company who brings a product to the market at $700, and three years from now customers are waiting to pay $2,000? This pricing strategy exists only in cases like collectibles and rare items.
![]() Note Discounting, sales, and coupons make sense only in unusual circumstances. They should not be used regularly.
Note Discounting, sales, and coupons make sense only in unusual circumstances. They should not be used regularly.
General Motors had a policy where every year the suppliers were required to reduce pricing due to “operational efficiency improvements.” This was really just margin erosion, which eventually made them unprofitable. One year, when a three percent reduction was requested, my company gave an over 20 percent price increase. We had a unique product and capabilities so it was a calculated risk. General Motors paid the increased price, which in the long run, made the relationship less combative. This is just one example of how smarter pricing and discount strategies can increase your bottom line and improve customer relationships. Nobody will ever say no to a discount. Make sure you offer them only when they are truly needed.
Waste from Bad Place Decisions
The last area that contains marketing waste is when the transaction occurs. This is especially true with smaller companies, where you may consider your personal relationship with suppliers. The entire supply chain, from the raw materials to consumer purchases, is a potential source of waste. This waste starts with the supplier relationships. When a company is new, it overpays for materials and services due to its lack of negotiating power. It also experiences lower levels of service from those suppliers. At this phase, the waste from poor supplier relationships is obvious. As the company grows, it will gain purchasing power and also will likely change what it needs from the suppliers. These changing needs may include delivery schedules, quality levels, and services. Some of these new needs provide value to the customers, while others are the result of the leaders of a growing company applying a formula used at other companies because they feel that is what must be done.
One example of an increasing requirement may be asking your suppliers to become ISO 9001 certified. We have always been big fans of a properly designed and implemented management system because of its capability to eliminate waste. Unfortunately, we too often see and hear business leaders implement management systems so that they can hang the flag and court customers who want to work with ISO-certified companies. This is where the supplier-customer relationship actually can drive waste. In a company where ISO 9001, TS16949, AS9100, Joint Commission Standards, ISO 14000 or other standards are implemented for a customer, without the leadership actually utilizing the benefits, certification is wasteful. This same certification can provide substantial value when it is used to develop effective business processes that focus on quality and service. This is just one example where supply chain relationships can drive waste. (We talk more about the specifics of supply chain relationships in Chapter 8.)
The distribution of goods is another source of waste. Companies go through great efforts to hide these wastes. In distribution between businesses, the suppliers of large companies will often create warehouse or manufacturing locations close to the customers to provide just-in-time inventory or to reduce shipping costs. This reduces the shipping costs to the customers while potentially increasing the supplier costs, thus driving waste through additional staff. When the analysis makes sense to locate warehouses closer to your customers, this decision is not a waste. Unfortunately, as stated earlier, many business leaders believe that they should do this because other companies do it.
In distributions between businesses and retail or consumers, there are other wastes. Retail locations not often maintain a large amount of inventory on hand for most items, which results in the wasteful activities associated with small and frequent shipments to those retail locations. Retailers also have problems estimating future sales and have too much inventory on hand. In order to feed this process, there are inventory-counting and shelf-stocking wastes. Likewise, there is waste in discounting products that haven’t sold.
To reduce these wastes, you can ship directly to the customer or to the store for the customer through the use of online shopping. Figure 3-24 shows a projection in the growth of ecommerce sales through 2017. Twenty-six percent of all holiday sales in 2012 were from the Internet. In 2013, that number rose to almost 39 percent. 21 Beyond the convenience to the customer, one reason why ecommerce is so popular is that it is often less expensive than traditional retail. Even though free shipping is a myth because the shipping cost is just put into the price, the reduction in distribution costs makes the online shopping a viable option for producers and consumers. The only part of the supply chain that loses is the retailer, who then has to compete with online sales.
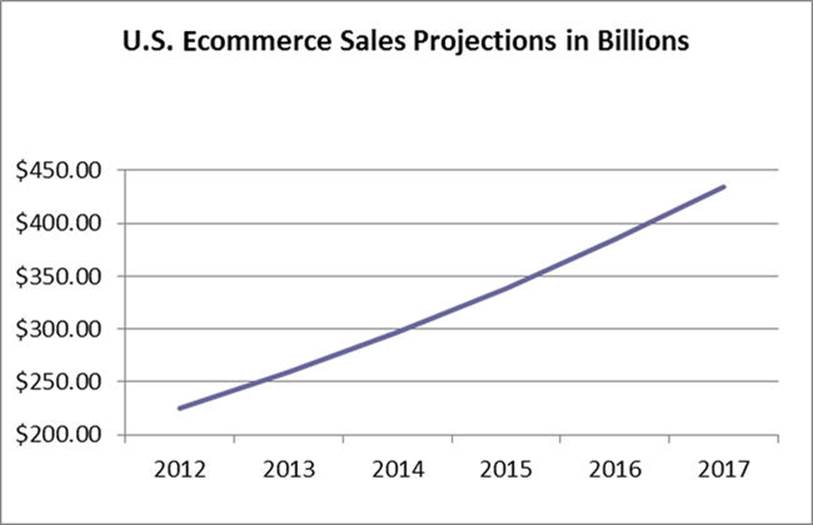
Figure 3-24. U.S. Ecommerce Sales Projections. Source: eMarketer, “Retail Ecommerce Set to Keep a Strong Pace Through 2017,” April 24, 2013, http://www.emarketer.com/Article/Retail-Ecommerce-Set-Keep-Strong-Pace-Through-2017/1009836
Walmart has found a way to benefit from both retail and online sales by reducing shipping and warehousing costs through the site-to-store program. With this program, Walmart can offer more variety than it can afford to offer in its stores. It doesn’t assume the risk or cost of carrying any inventory, because it is shipped from the producer to the store. Walmart also uses its vast distribution network to minimize the shipping costs rather than giving the shipping funds to FedEx or UPS. (In Chapter 8, we discuss how to identify operational wastes and eliminate them as Walmart has done with its site-to-store program. We also look more at other logistics issues.)
Marketing Metrics
This quote by Roger Best is frequently mentioned, but often forgot:
“The cockpit of the 757 Boeing jet is a maze of instruments (analytic tools) that produce flight performance data (metrics) that are critical to the safe and efficient flight of a 757. It would be impossible to fly a 757 without theses analytic instruments and performance metrics. Yet, companies invest millions or billions in marketing and sales strategies with no clear measure of their performance impact or efficiency.”22
Top executives have voiced concerns over the lack of metrics available to support marketing activities. The quote “In God we Trust, All others bring data”23 holds true in all areas of business. With CEOs feeling that there are no actionable metrics in the marketing field, it is no wonder that the marketing department is often easily downsized and undervalued. It is also no wonder that there is enormous waste from marketing dollars.
All of your marketing activities need to be validated by data. Too often, we have seen marketing materials inferring that certain activities have driven a return on investment. In other words, the advertising department runs an advertising campaign, sales go up, and the marketing department claims a positive ROI. Unfortunately, these claims are not often easily substantiated. Most marketing activities can be considered waste unless you can rigorously measure their effectiveness.
This rigor includes setting a baseline performance through a reliable measurement method. Then, you must maintain the measurement method after marketing activities have occurred to show the effect of those activities. It is also crucial to evaluate other potential factors that are driving sales. For instance, a consumer product company cannot claim that a marketing campaign drove Christmas sales necessarily because the holiday season itself may be the driving force.
The leading scholars will tell you that net marketing contribution is the very first metric you should calculate. To get it, you should take net overall company profit (after expenses) and then subtract marketing and sales expenses, and this overall total is your marketing contribution. For example, if Apple made $13.5 billion net profit (from $36.54 gross profit) and had $3.12 billion in marketing and sales expenses, the net marketing contribution is $10 billion, which represents a 34 percent marketing ROS (Return on Sales). This example is actually in the field’s leading text on marketing metrics. However, nothing could be more wrong. This assumes that every sale Apple ever made on every iPhone, iPad, and all of its products and services came from marketing. This is extremely short-sited and even egotistical.
With marketing being a key function in all companies, the marketing section of this book is the largest. Even small companies without named marketing departments spend a lot of their resources on marketing activities. We have divided the various areas of marketing into categories in this part of the chapter to discuss the metrics in each of those areas. These metrics are by no means exhaustive, as marketing metrics themselves could fill a book. We have tried to highlight some of the most important ones.
Customer Metrics
As we have said and as research has shown, it is much cheaper to retain customers than to get new ones. That means that measuring your customer satisfaction is critical to the long-term success of your business. Likewise, the goal of any marketing campaign should be to create brand loyalty.
Customer Satisfaction
Everyone needs an overall level of satisfaction. This can be found quite simply by asking customers on a regular basis how satisfied and/or dissatisfied they are. Most organizations measure customer complaints in some way. The motivation for this measurement is often tied to minimizing legal issues or avoiding bad public relations issues. The need to monitor and control consumer satisfaction has been heightened by the growth of social media because consumers now have a bigger voice. Unfortunately, by the time you get customer complaint data, it is too late to avoid a bad customer experience. The reaction to the complaint is the opportunity to create a stronger customer relationship or destroy one altogether. Customer compliant data can be measured in both qualitative and quantitative methods. The quantitative data helps you understand and predict future issues by monitoring trends and the scale of warranty issues. The qualitative data helps you understand how you can improve customer service and what the overall view of your company is.
Customer compliments are similar to customer complaints, but they also allow you to make process changes that turn individual positive customer experiences into the way that all customers experience your products or services. Customer compliments are normally qualitative in nature, so the customer’s reactions must be understood in order to be able to improve through the feedback.
Effective management of customer complaints and compliments leads to customer retention. Most importantly, you do not want to be reactive and wait for comments to come your way. Instead, you should focus on being proactive by regularly sending out surveys. As already described, make the surveys long enough to capture the right data, but not so long that customers do not want to fill them out. For example, our pediatrician sends a survey via e-mail every time we visit the office. Sometimes I delete the e-mails (when I’m too busy). When I have five minutes, I fill them out. With four kids, I am there enough and filling out enough surveys that they likely have a good idea of what I want. In the “open comments” section (which every survey should have), I said that I love the doctors and nurses, but the office looks a little dumpy. About 3–4 months later, the office had new carpet, paint, and chairs. I imagine that I was not the only one who said that. This brings us to the most important point—don’t just collect data, act on it!
![]() Note Satisfaction surveys are critical. Regularly collect data relevant to customer needs and make the necessary changes to keep customers satisfied.
Note Satisfaction surveys are critical. Regularly collect data relevant to customer needs and make the necessary changes to keep customers satisfied.
A customer impression of quality, value, and service is the ultimate goal. Unfortunately, business leaders make mistakes, leading to customers leaving the organization. In a consumer market, the percentage of customers who purchase only one time should be measured and understood. For some reason, these customers have only purchased one product or service. You need to understand why that happened so you can make any changes necessary to avoid this in the future. You may want to survey those customers to try to figure this out. These metrics are typically calculated in a CLV (Customer Lifetime Value) equation, covered in Chapter 4.
In B2B relationships as opposed to B2C relationships, it is often easier to identify unsatisfied customers and determine the reason they are unsatisfied. Business customers tend to give you multiple opportunities to succeed and will cease to do business with you if you fail.
Customer Expectations
We have said now many times that satisfaction should be measured on relevant attributes. But what does that mean? We will not go into full detail here, but marketers must know exactly what it is that makes customers happy. Refer back to our daycare example. Everyone knows parents expect daycare centers to be clean and safe, but how many people realize that customers want more? Survey data can also be used to measure these gaps. In the early 1990s a group of researchers developed the SERVQUAL model (see Figure 3-25) to help marketers analyze the gaps between expectations and what the marketing provided. Data from customer satisfaction surveys and “gap” survey is perceptual, and thus, not “hard” data. However, it is still important information to have. Each gap should be measured and processes should be put in place to minimize each gap.
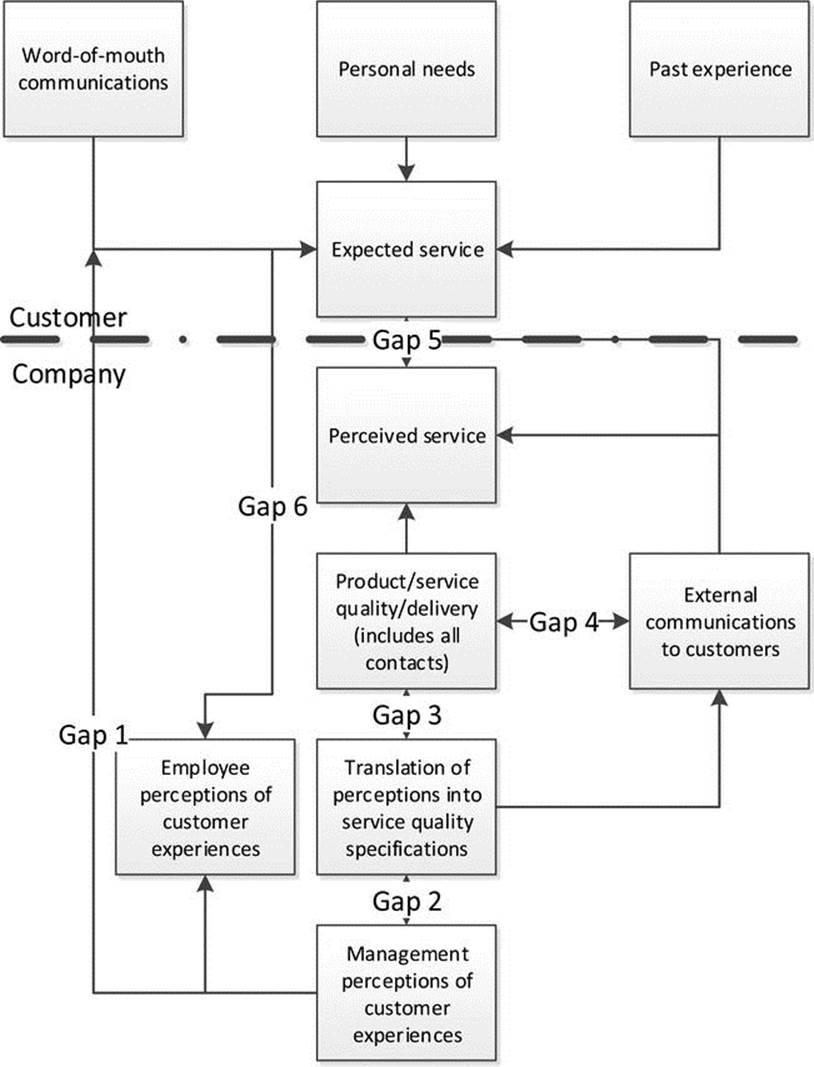
Figure 3-25. SERVQUAL Model. Source: Parasuramann, A., Valerie A. Zeithaml and Leaonard L. Berry, “SERVQUAL: A Multiple-Item Scale for Measuring Cosumer Perceptions of Service Quality,” Journal of Retailing, 1999, vol. 64, No. 1, pp. 12–40
Customer Value
As mentioned, we cover customer lifetime value fully in Chapter 4. You should always know the full “worth” of every one of your customers. This data is more quantitative and therefore, many times, more helpful is predicting future customer behavior. This helps you better plan future marketing activities, leading to less waste.
Brand Preference
You must not only know exactly how much your customers like your products, but also exactly how much they “prefer” them over other products. There are several stages of brand preference development. Surveys can be used to collect this data. Figure 3-26 shows some of the items that should be measured to collect this data. Part of being a preferred brand includes a “share-of-wallet” measure. In this, you need to assess how much of your customers’ wallets, as a percentage goes to your brand. If out of your annual gas spending, you spent ninety percent of your money at Circle K, seven percent at Speedway, two percent at BP, and one percent at other random gas stations, Circle K marketers could assume that they are the preferred brand and have a much greater share-of-wallet. You can also start to assess why the missing ten percent was spent at other gas stations. Was it because of a random event like a vacation, or due to location? When analyzing this type of data across many consumers, marketers can better plan future needs and actions.
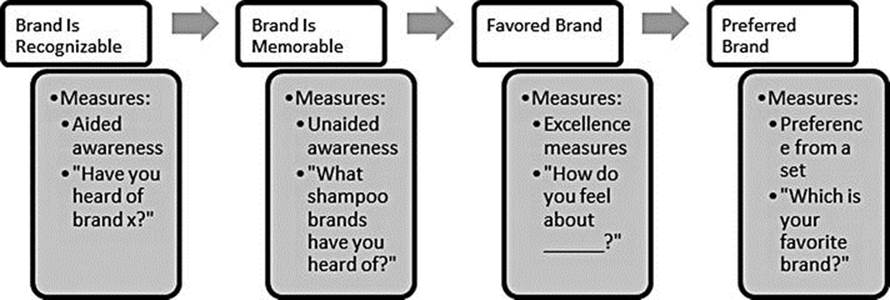
Figure 3-26. Brand Preference Development
Repurchase and Recommend Intentions
Many researchers feel that repurchase and recommend intentions are the most important metrics to use. Obviously, repurchase intent is a measure of whether the customer plans to purchase the brand again. Recommendation intent is a measure of whether they would tell their friends about a brand. Most studies do show that these two metrics are the most powerful. Therefore, surveys should include these two measures. As part of this metric, you should also capture word-of-mouth data, as described earlier in the reputation-management section. Sometimes, you don’t see these measures on a survey, but when customers talk positively (or negatively) about you online, they go beyond merely recommending you to becoming a consumer advocate.
![]() Note Repurchase and recommend intentions are quite possibly the most important metric in terms of customer satisfaction and brand loyalty.
Note Repurchase and recommend intentions are quite possibly the most important metric in terms of customer satisfaction and brand loyalty.
Product/Service Development
When developing new products, it is often a mistake to consider all sales from the new products as incremental improvements, when in reality there is a normal cannibalization of profits from current products. Therefore, when you consider the value of a new product, you must reduce the sales or contribution margin of the new product sales by the amount of reduced sales you have in similar legacy products. We call the product of this calculation the net new product sales because it is the gross new product sales minus the change in legacy product sales. The following formula shows how to calculate this metric.
GNPS = Gross New Product Sales
PYLPS = Prior Year Legacy Product Sales
CYLPS = Current Year Legacy Product Sales
NNPS = Net New Product Sales
You must also look at research and development spending as a percentage of the company’s margin. You need to monitor the expense of research and development as a percent of margin to be able to know if you are increasing the proportion of your research and development expense. The appropriate value of research and development spending will depend upon your business model.
![]()
RDE = Research and Development Expense
M = Company Margin
%RDE = Research and Development Expense as a Percent of Margin
To start measuring individual project success, you need to take a page from the activity-based costing model (ABC), which we talk about more in Chapter 7. The basic concept of ABC in regards to product development is to look at the incremental cost of the individual product or service that you are evaluating. All research and development expenses can be split into two categories:
· Research and development overhead expense. The costs accumulated for development projects that are never completed.
· Research and development activity expense. The costs accumulated for each successful development project.
When evaluating the success of a specific project, you should not include the sunk costs associated with the projects that were failures but rather the costs associated with the specific project that you are evaluating. The other costs of R&D should be minimized through better processes for selecting projects early in the development cycle. The rejected projects should not negatively reflect upon the successful ones. Now you can measure the ROI of R&D. This is measured to see how long it takes to recuperate the expenses incurred from new product or service development.
![]()
NNPS = Net New Product Sales
NPE = New Product Expenses
RDE = Research and Development Expense
RD_ROI = Research and Development Return on Investment
Tracking the ROI for research and development helps keep you from wasting money during new product development processes.
Price Metrics
We have found many times that the most underutilized metrics are pricing metrics. Companies look at their costs, sometimes look at what the competitor is doing, and then randomly pick a price. When sales drop, they either have a discount or run an advertising campaign without considering pricing. I once had a small class project in which the students performed marketing research for a small beauty salon. The students all found that sales were dropping at the salon because the pricing was too low. The owner continually dropped prices over the last couple of years, thinking that she was losing business because prices were too high. Instead, she had priced herself so low that customers saw her as a competitor for places like Supercuts and Great Clips, only more expensive. You must have metrics in place to examine what customers want to pay. As we already said, you need to make a profit, but you cannot use cost-plus pricing or continual discounting. Be sure to follow the steps outlined in Figure 3-27 when determining pricing.
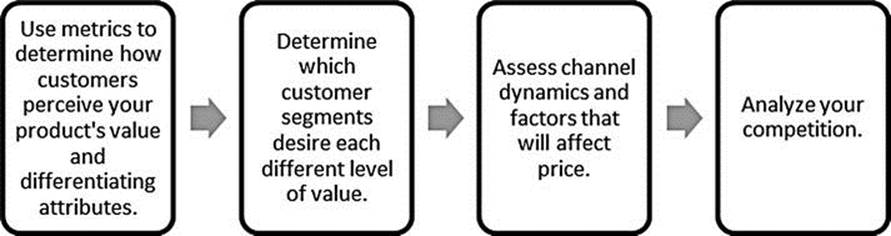
Figure 3-27. Price Metrics
Promotions Metrics
There are numerous categories of promotional expenditures and metrics. We have tried to highlight a few of the more important ones so that you can eliminate some waste in your marketing department.
Direct Marketing
There are many metrics that you can use to assess the effectiveness (and therefore the waste level) of marketing campaigns, such as response rate, conversion rate, and churn rate. We cover these in Chapter 4. However, we have a cautionary note here.
Consider the practice of sending out e-mail campaigns to a list of consumers based upon a past sale or a purchased list. Say you send out 20,000 e-mails. Only 8,000 people open the e-mail, which leads to about 1,000 people going to the company website. Of those 1,000 visitors, 250 end up purchasing your product. Now consider that each customer is worth $5,000. Is this campaign worth it? Many marketers would say that it absolutely is worth it because this generates over one million dollars in sales. But, how do the 19,750 people who were sent an e-mail and didn’t buy the product feel? This is a common waste we see in multiple marketing methods. We seem to think that the time wasted by the receivers of our communications is worth the sale gained. Of course, the goal is to sell products or services, but what is the collateral damage caused by this selling technique? What if we need to get in touch with those customers for an important reason? Would those customers open our e-mails if we repeatedly send them solicitations?
It is also difficult to truly understand the value of a direct mail or e-mail campaign. Marketers tend to ignore the downstream value of a new customer when evaluating these campaigns. We know it is a lot less expensive to keep a current customer than it is to get a new one. Therefore, it’s important that we understand customer lifetime value when evaluating new campaigns. You have to look at the holistic effects of campaigns on all customers, not just at the raw sales data.
Advertising
Much of the waste in advertising comes by using the wrong metrics. Advertising metrics are typically as follows: reach, frequency, cost per point, cost per thousand, gross rating points, impressions, media impressions, number of clips, target rating points, accuracy of coverage, and advertising value equivalency.
Unfortunately, these metrics do not tell you how many people paid any attention to your ad or whether the customer decides to purchase your products because of the ad. Therefore, the more important metrics are like the ones we described in the customer satisfaction and brand preference sections. Once an ad is run, it doesn’t matter how many people sat mindlessly on their couch while the ad was on TV. What matters is how many people’s behaviors changed. The first of these metrics is brand awareness. Technically, brand awareness is a combination of brand recall and brand recognition. This is now measured through a combination of three online metrics. The first is the impressions or how many times your content is viewed. This helps tell you how many people are interested in your advertisements. The second is customer engagement or how many brand-specific searches are made. This helps you know if consumers are looking or talking about your brand. The final metric is reach, or how many customers you are reaching with your content. If your campaign is online, all of these metrics can be measured using a tool like Google Analytics. If brand awareness is a critical element to your business, then you should be using these metrics to measure the effectiveness of your efforts. If you do not use online campaigns, you still need to capture data for awareness, engagement, understanding, and belief. It is just harder to come up with this data. Some tools that you can use are eye-tracking studies, newer biometrics studies, and the old fashioned starch tests.
Finally, you must assess which behaviors changed because of the promotion. Here, you are looking for metrics such as the following:
· Asked for more information
· Increased the amount of purchase
· Increased the frequency of purchase
· Purchased
· Recommended
· Subscribed
In essence, we suggest three layers of promotional metrics. First, you need to assess the typical measures such as reach and frequency. Do not stop here. It is easy to say to yourself, “Cable is so cheap, what do I have to lose?” A lot. If you come across with the wrong message to the wrong people, you can turn people away. You must make sure you understand the customer’s needs and expectations. Based upon those, you can institute metrics for customer awareness and engagement. Finally, and most importantly, you have to tie promotional campaigns to actual behaviors. This can be done many ways; some are tools like surveys or split runs.
Conclusion
Perhaps the largest waste in marketing happens because marketers do not invest the proper time, money, and resources into the research. As mentioned, we are not talking about research for the sake of research. Typical approaches do not assess real consumer needs. Bringing in a random group of people for focus groups will never get to real needs. Instead, triangulate data from multiple processes to get a clear picture. Make sure some data is gathered from newer methods and media, such as big data and biometrics. Do not farm out your market research to a third party unless you are sure that they understand your unique products and customers.
Additionally, through your research, assess customer satisfaction and brand loyalty. These are the most important variables when considering a company’s long-term sales. No funny advertising campaign can generate sales and make customers come back in the long run. Advertising is hugely ineffective, so stop overusing it. When considering social media, make sure that you are creating true value for your customers and not just doing what you think you need to do. Customers need to be satisfied before they will create positive word-of-mouth. You need to create satisfied customers, not a million dollar logo, to keep customers coming back.
Finally, measure, measure, and measure some more. Make sure you have metrics for all of your marketing activities. If you don’t measure, you don’t know what is effective and what is bringing more customers to you.
Waste Checklist
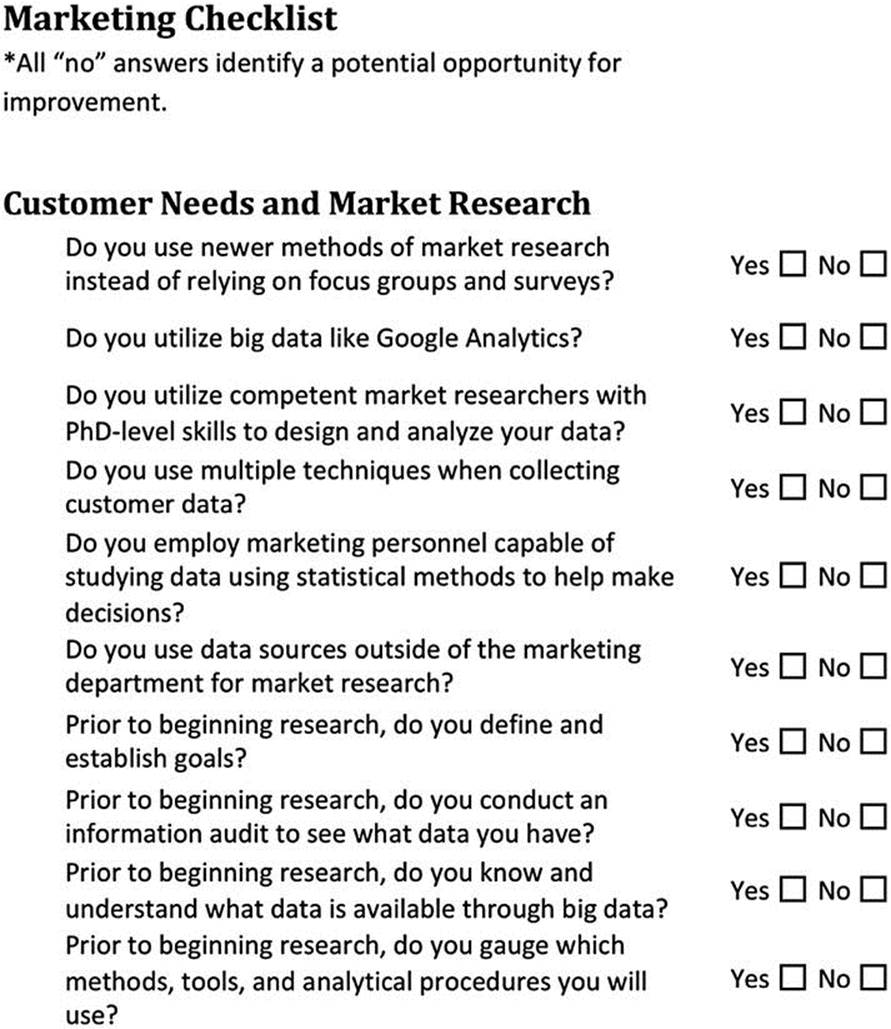
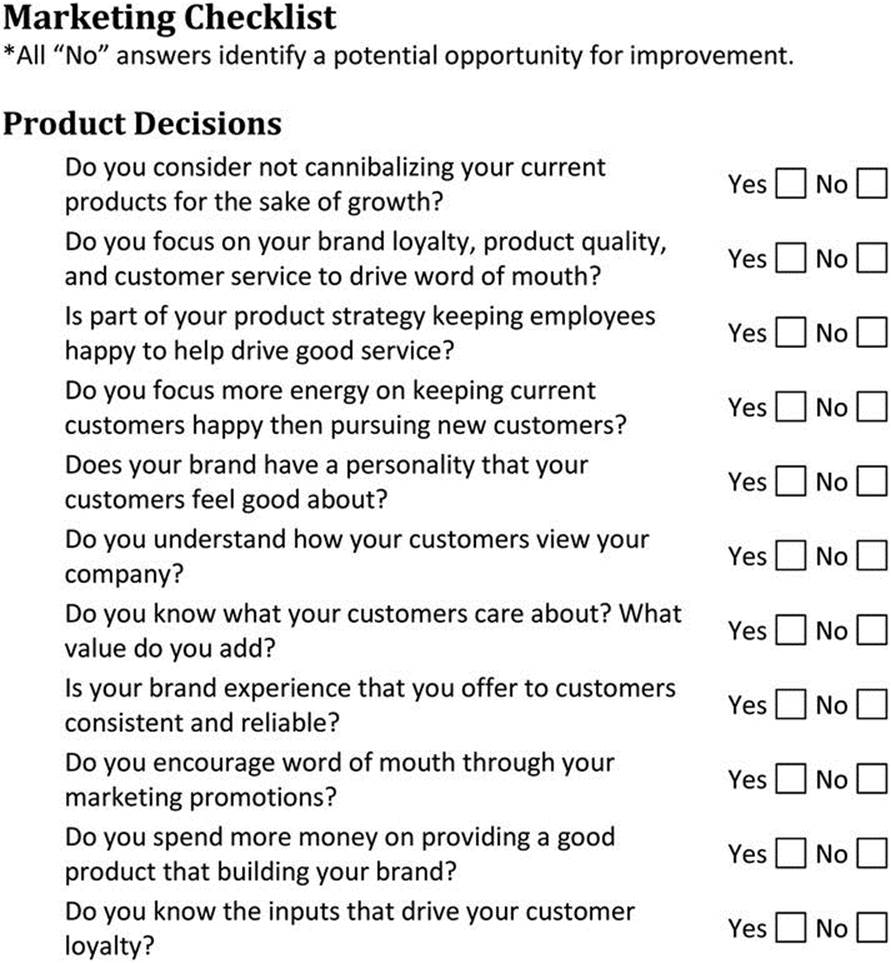
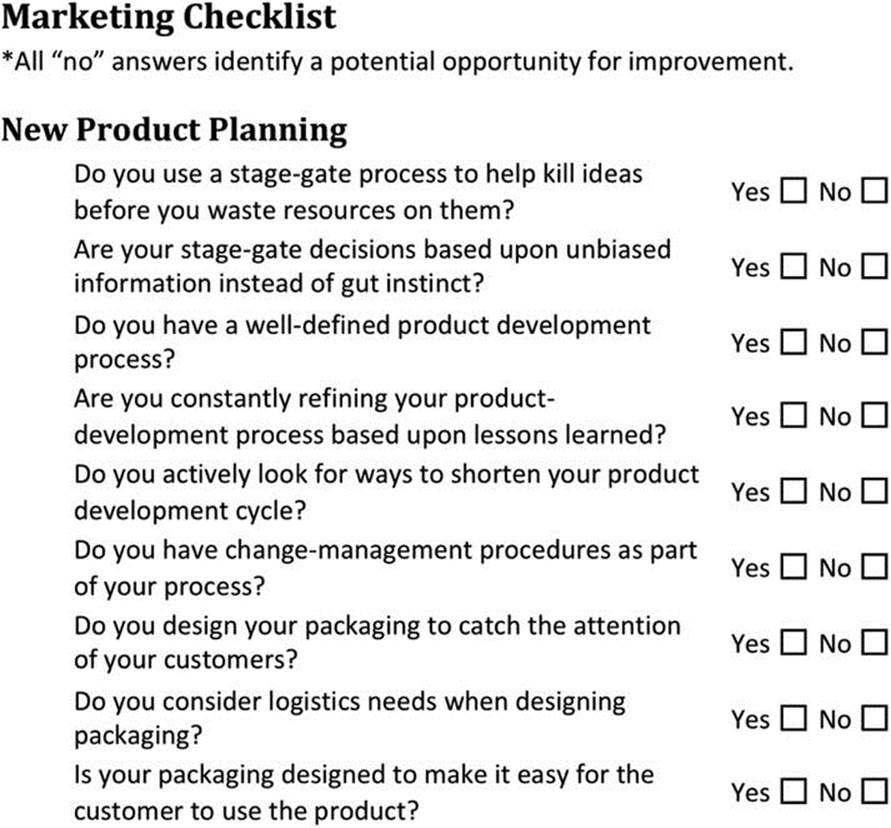
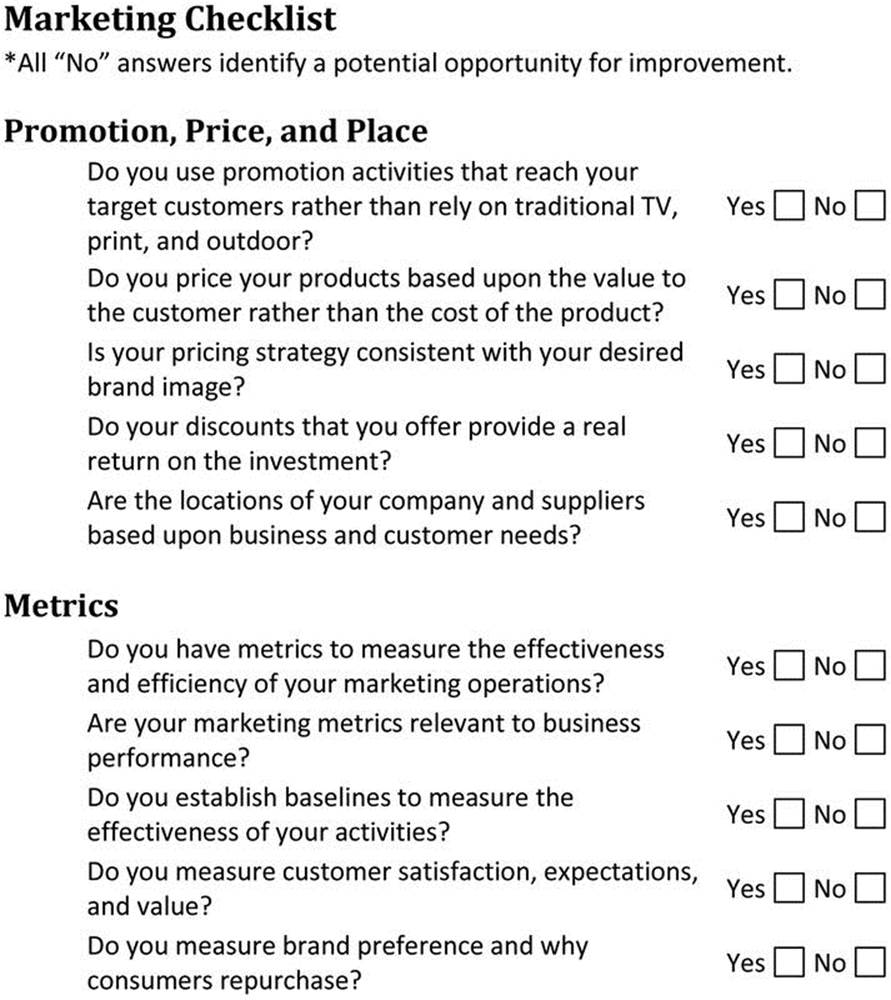
1 Baer, Jason, “Operationalizing in 2010,” in Marketing in 2010: Social Media Becomes Operational,http://conversationagent.typepad.com/Marketingin2010.pdf, 2010.
2 Eichler, Alexander, “Pharmaceutical Companies Spent 19 Times More On Self-Promotion than Basic Research,” Huffington Post, May 8, 2013, http://www.huffingtonpost.com/2012/08/09/pharmaceutical-companies-marketing_n_1760380.html.
3 CASRO, U.S. and Global Survey Research Industry, 2013, http://www.casro.org/media/Media%20Facts--US%20(and%20Global)%20Survey%20Research%20Industry.pdf.
4 American Marketing Association, Definition of Marketing, http://www.marketingpower.com/AboutAMA/Pages/DefinitionofMarketing.aspx (definition approved 2004, last accessed August 2013).
5 Google, “Introduction to Google Analytics,” https://support.google.com/analytics/answer/1008065?hl=en (Last accessed September 2013).
6 Williams, Steve, “5 Barriers to BI Success and How to Overcome Them,” Strategic Finance, July 2011, 27–33.
7 Ibid.
8 Spenner, Patrick and Anna Bird, “Marketers Flunk the Big Data Test,” Harvard Business Review, HBR Blog Network, August 16, 2012, http://blogs.hbr.org/2012/08/marketers-flunk-the-big-data-test/.
9 Ibid.
10 Ibid.
11 Ibid.
12 Cialdini, Robert, Influence: The Psychology of Persuasion Revised Edition (New York: NY, Harper Business, 2006).
13 Teradata, “Data-Driven Marketing Delivers Enterprise-Wide Value,” Global Teradata, August 5, 2013, http://www.teradata.com/News-Releases/2013/Data-Driven-Marketing-Delivers-Enterprise-Wide-Value-Global-Teradata-Survey-Says/.
14 Graves, Philip, “Debate: Is Market Research a Waste of Money?” Director, September 2010, http://www.director.co.uk/magazine/2010/8_September/debate-market-research-waste-of-money_64_01.html.
15 Liljenwall, Robert, “The Power of Point-of-Purchase Advertising: Marketing at Retail,” Point-of-Purchase Advertising International, Washington, DC, 2004.
16 Andzulis, James “Mick,” Nikolaos Pangopoulos, and Adam Rapp, “A Review of Social Media Implications for the Sales Process,” Journal of Personal Selling and Sales Management, Volume 32, Number 3, Summer 2012, pp. 305–316.
17 Cheong, Yunjae, Federico de Gregorio, and Kihan Kim, “Advertising Spending Efficiency among Top US Advertisers from 1985 to 2007: Overspending or Smart Managing?” working paper.
18 Belch, George, and Michael Belch, Advertising and Promotion, 9th Edition (Columbus, OH: McGraw-Hill, Irwin, 2009).
19 Manning, Gerald, L. Michael L. Ahearne and Barry L. Reece, Selling Today: Partnering to Create Value 12th Edition (Upper Saddle River, NJ: Prentice Hall, 2012). p. 1–544.
20 Aeppel, Timothy, “Seeking Perfect Prices, CEO Tears Up the Rules,” March 27, 2007, http://online.wsj.com/article/SB117496231213149938.html.
21 Marvin, Ginny, “Holiday Mobile Orders Shot Up 50 Percent In 2013; Social Commerce Remains Negligible, Organic Still Dominates,” Marketing Land, January 9, 2014, http://marketingland.com/holiday-mobile-orders-shot-up-50-percent-in-2013-organic-dominates-email-grows-social-remains-inconsequential-69958
22 Best, Roger D. “Getting Started Using Marketing Metrics,” http://www.marketingmetricssolutions.com/pdf/MMH%20-%20WP%20Final%20RB.pdf, (last accessed August 2013).
23 Hastie, Trevor, Robert Tibshirani and Jerome Friedman. The Elements of Statistical Learning(2nd ed.). New York, NY: Springer, 2011).