Facebook All-in-One For Dummies, 2nd Edition (2014)
Book V. Marketing Your Business
Chapter 3. Using Insights to Track Your Success
In This Chapter
![]() Using Facebook Insights to track your success
Using Facebook Insights to track your success
![]() Discovering
Discovering
![]() Improving your News Feed algorithm
Improving your News Feed algorithm
If you have a business page, you’re probably interested in how the page is performing with your audience. You want to know if you’re reaching as many people as possible and how you can encourage them to interact with your content more.
Facebook offers an analytics program called Insights that’s available for business pages (but not personal timelines). Insights offers information about who your users are, when they visit your business page most often, which of your posts have had the most response, and much more. This chapter explains how Insights works and how you can use the metrics you find on Insights to improve the effectiveness of your business page.
This chapter also explains the News Feed algorithm (formally EdgeRank), which is Facebook’s algorithm that determines what content is most relevant to each Facebook user. The News Feed algorithm is important because it decides whether or not content appears on a user’s top stories. (Most Facebook users have top stories as their default news feed.) The News Feed algorithm considers how an individual interacts (or doesn’t) with different kinds of content and weighs those interactions. The result is Facebook’s best guess at what interests someone. In the latter part of this chapter, we explain the elements that the News Feed algorithm considers and how you can try to use those elements to your advantage on your business page.
Tracking Your Facebook Stats with Insights
Insights is Facebook’s analytics software and is available for business pages. Insights allows you to see how people interact with the content on your business page. You can track the demographics of your audience, which posts receive the most engagement, and even how people are finding and Liking your page. Insights helps you monitor important stats, understand your audience, and make better marketing decisions. Throughout the following sections, we explain the details of what you can expect to find in Insights.
First, though, you need to open Insights. To do that, go to your business page and, at the top in your Admin panel, click the See Insights link.
Reviewing the main Insights page
Your main Insights page looks similar to the one shown in Figure 3-1 and provides an overview of your business page’s activity. You can also see how your posts have been performing, export your data, and take a tour to get more information about how Insights works.
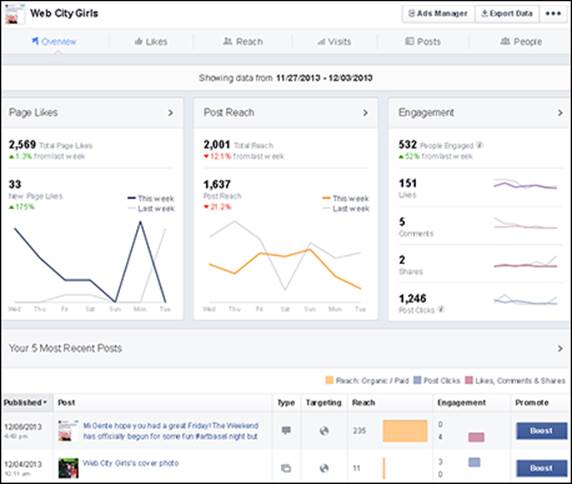
Figure 3-1: Insights provides an overview of the main data points for your business page.
The top of the page has six tabs: Overview (the current page), Likes, Reach, Visits, Posts, and People. We explore each of these tabs later in the chapter.
The three graphs on the Insights Overview page show the following data for one month at a time:
· Page Likes: The number of Likes your page has and how that number compares to the previous week. To dive deeper, click the Page Likes link or the Likes tab at the top of the page.
· Post Reach: The number of people who have seen your posts and how that number compares to last week.
· Engagement: The number of unique people who Liked, commented, shared, or clicked your posts and how that number compares to the previous week. You also see the number of people in each category.
At the bottom of the page is Your 5 Most Recent Posts section. You see the post's date, description, type, target (privacy setting), reach, and engagement. You can also boost, or promote, your post to get more exposure. To see additional posts, click the See All Posts link at the bottom.
Exporting your data
If you want to back up your data or just keep a copy on hand, you can export your Insights data and download it to your computer. To do that, navigate to your Insights page, and then follow these steps:
1. Click the Export Data button, in the top right.
The Export Insights Data dialog box appears, as shown in Figure 3-2.
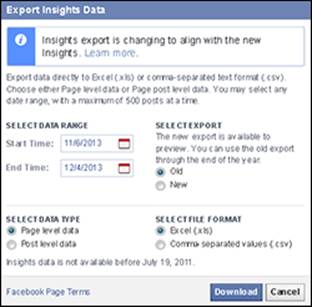
Figure 3-2: The Export Insights Data dialog box allows you to choose which data to export.
2. Select the start and end dates to export.
3. Select the type of data.
Choose page-level data or post-level data. Page-level data just gives you numbers based on your business page's overall interactions (for example, overall Likes, Unlikes, and friends of followers). Post-level data includes numbers directly related to individual posts (for example, name of post, date posted, and total number of followers that the post reached).
4. Select the file format.
Save your export file as an Excel spreadsheet (.xls) or a comma-separated values (.csv) file.
5. Click the Download button.
 Export Insights data periodically as a backup. In 2010, Facebook changed the way it displayed Insights. When it made the change, you couldn’t access any data from the previous version. If you hadn’t exported it, you couldn’t access it. Because Facebook periodically changes things, and it owns everything on the platform, we recommend keeping your own backups to reference, just in case.
Checking out your settings
The Settings button sports three dots and appears to the right of the Export Data button. When you click this button, a menu appears with the following options:
· Send Feedback: Send feedback about something that isn’t working, questions you have, or suggestions to improve the data.
· Take the Tour Again: Discover the features in each part of your Insights page. This is a great option for visual learners.
· Visit Help Center: Go directly to the Facebook Help Center files related to Insights.
 When you switch from tab to tab at the top of your Insights page, be sure to check your dates and reset them as necessary. For example, if you’re looking at Likes for June 18–24, and then switch to looking at Reach, the dates may reset themselves.
Touring the Likes Page
After clicking the Likes link in the Insights navigation, the page shows you how many Likes your business page has and gives you details regarding each one. You can adjust the timeframe by clicking the calendar to the right in the first section. This change affects the other three sections as well.
The second section displays your total page Likes to date. You can also see the average number of Likes you're receiving over certain time periods by clicking the Total Page Likes link, as shown in Figure 3-3.
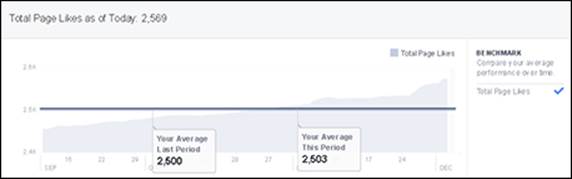
Figure 3-3: Find the average number of Likes during a particular timeframe.
The third section shows you your net Likes, meaning how many Likes you’ve received minus how many people have Unliked you. You can also filter by Unlikes, Organic Likes, Paid Likes (through promoting and advertising), and Net Likes.
If one of your goals it to increase Likes through Facebook ads, this section is a helpful way to see whether your ad dollars are working.
If you're receiving a large number of Unlikes over a short period of time, you should take notice and see what is driving people away. Perhaps you aren't responding to comments, or you've posted too much content in a short period of time. Also, if you have multiple people managing your business page, one may be practicing bad Facebook etiquette. Be sure to view this stat often!
The fourth and last section on the page shows the origin of your page Likes, as shown in Figure 3-4. Your graph may contain more or fewer options, depending on where you have your Facebook Like button and how you are promoting your business page.
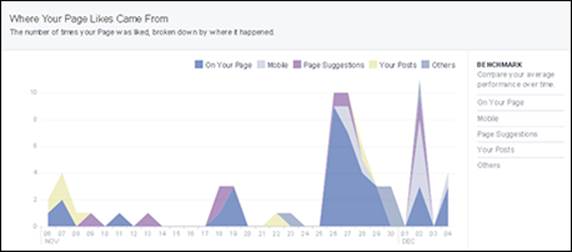
Figure 3-4: Discovering the origin of your business page Likes.
Understanding Reach Page Data
Facebook defines reach as the number of Facebook users who saw your content. Some users may have seen your content in their news feed because they’re followers of your business page; because one of their friends Liked, commented, or shared your content; or due to a promotion, offer, or another form of Facebook advertising.
A Facebook user has an average of 229 friends. Any time a user interacts with content, the interaction is shared with their friends via the news feed, and those friends can also interact with the content if they want to. When you share compelling content, it has the potential to be seen by many, many more people than just your followers, thus increasing your reach.
The Reach page is where you find some of the most valuable data about how your business page is performing and whether you’re meeting the goals you set. You can track the following information:
· The number of people who saw your post
· Your business page Likes, comments, and shares
· The number of people that hid your page, reported it as spam, and Unliked your page
· Your total reach, or the total number of people who saw any activity from your page
The next few sections explain these metrics further.
You can click the calendar and select the dates for which you want to view the information.
The first section deals with your post reach, which is the total number of people who saw your posts, organic (non-paid) or paid (promoted). You can sort by either option by clicking the appropriate link to the right of the graph. If you're using paid Facebook advertising, you can use this information to determine whether you are getting the expected results.
The second section shows the number of Likes, comments, and shares you received, as shown in Figure 3-5. You can sort by each of these categories, to determine whether you are meeting your goals and attracting a healthy level of engagement.
The Hide, Report as Spam, and Unlikes section helps you spot anything negative happening on your Facebook page. Monitor this section frequently. If the numbers continue to grow, you may have a problem that you need to address quickly. Just like the other sections, you can sort by clicking any of the links in the area to the right of the graph.
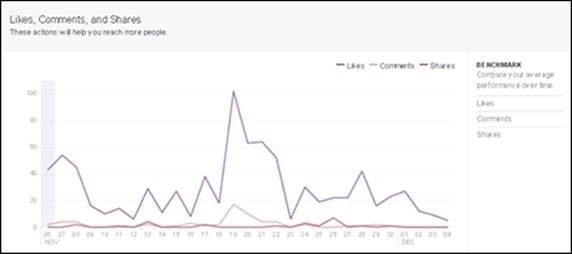
Figure 3-5: A graph of your Likes, comments, and shares.
Don’t worry if you have a few Unlikes. If you see a large number of Unlikes, pay attention and try to determine the reason. Did the Unlikes occur after a specific post? Does your page contain offensive spam? Facebook gives you the date of the Unlike, which allows you to go back to your posts for that day and see whether you shared something controversial. Or maybe you posted too many times that day. You won’t be able to know for certain what made a follower Unlike your business page, but you can use the data to help draw a conclusion. Similarly, if you have an influx of Likes on a specific day, you’ll want to see what you posted that was so popular.
The last section on the Reach page is your total reach. The first section deals only with posts; this section contains the number of people who saw any of your activity, including posts, posts by other people, page Like ads, mentions, and check-ins. You can sort by organic or paid, to see whether one is a better option for you.
Finding Friends by Using the Visits Page
For the most part, after Facebook users Like your business page, they don't have to come back to your Page. Instead, followers rely on your content to show up in their news feeds. However, if you want to see just how many people are visiting your business page, look at the Page and Tab Visits graph on the Visits page. This graph includes every single time your business page was viewed for a given time period — even if the same person viewed the page multiple times. For example, if one person visits your business page five times, and three other people visit one time each, the total page views would be eight.
Along the right side of the graph, you will see the page tabs you've set up on your business page. Click one to isolate it and show only that metric in the graph.
Scroll a little further down the page to see the Other Page Activity section, which tracks the number of actions that each person took on your business page. These actions include mentions, posts by other people, check-ins, and claimed offers. Again, you can sort through each category by clicking the link to the right of the graph.
If you’ve ever wondered where your traffic is coming from, check your External Referrers section, which is shown in Figure 3-6. Not everyone is finding you from stories in their news feeds. Your blog, search engines, and other websites may be important lead generators for your business page. You may not see the section or see anything in it until an outside source sends a user to your page.
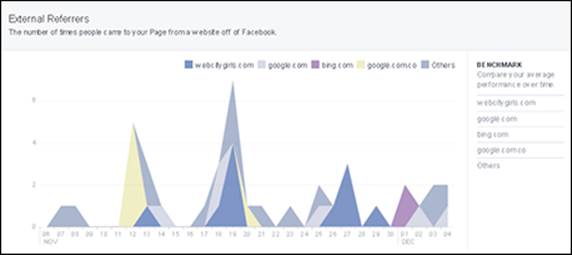
Figure 3-6: The External Referrers section on the Visits page.
We encourage you to include a link to your business page on your blog or website, and even promote your business page on your business cards and in-store marketing.
The All-Important Posts Page
We think that the Posts page is one of the most important pages because it can help you learn what is attracting or repelling your followers and visitors. For example, if you share a video and it has a small reach and few comments, chances are the content didn’t resound with very many people. On the other hand, a video that achieves a much higher reach and higher engagement is a sign that your audience likes that content and you should put out more of it.
If you have good content with little engagement, you might want to use the Boost feature to promote your post to a wider audience than just your followers. We will talk more about this Facebook advertising feature in Chapter 4 of this minibook.
At the top of the Posts page are two links: When Your Fans Are Online and Post Types. When Your Fans Are Online helps you identify the days and times when your followers are online, which can help you decide when to put out content. You should also consider being online at those times to engage right away with those who are interacting with your business page and content.
The Post Types link shows the average reach and engagement of each type of content on your page. As shown in Figure 3-7, video is by far the most popular medium on this business page. With the popularity of YouTube, Vine, and other video sites, video is probably the best delivery vehicle for communicating your message. Consider using video the next time you have something to say.
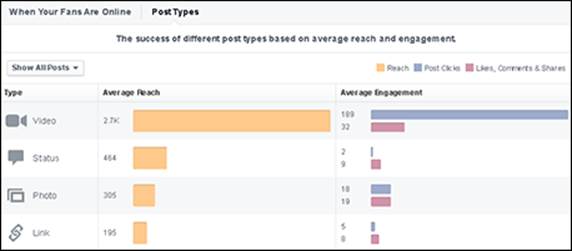
Figure 3-7: Post types.
The rest of the Posts page displays your posts. You see the post's date, description, type, targeting (privacy setting), reach (organic or paid), and engagement (Likes, comments, and shares). You can also promote, or boost, your post.
Find which posts had the highest and lowest reach and engagement. Then create more of the former type of content and less of the latter.
Try changing your message and type of post if your posts aren’t making a huge splash. For example, if you share a link to your blog post but it doesn’t get a lot of click-throughs, consider making a short video summarizing your post content and share that instead.
Understanding the People Page
An important part of your marketing strategy is simply knowing your audience. The more you can find out about your readers and followers, the more you can customize your interactions with them. Facebook Insights doesn’t give you specific data for individuals, but it does give you a helpful overview of who your audience is, where they’re coming from, and what content they’re interacting with the most.
The People page has three main areas: Your Fans, People Reached, and People Engaged, as shown in Figure 3-8.
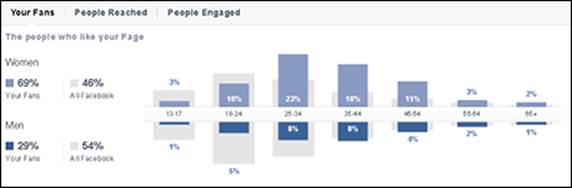
Figure 3-8: Gender and age demographics on the People page.
You can access each area through links at the top of the page. Each area contains the following:
· Gender and Age: Facebook shows you how your audience breaks down by gender and age, based on the information each business page shares. If a business page doesn’t specify gender, it isn't included in this metric (which is why your percentages may not quite add up to 100 percent). Facebook also shows you how your audience compares to Facebook on average.
· Countries, Cities, and Languages: You can see which countries and cities your followers reside in and which language they are using to view Facebook. You may be surprised at what you see here. The data shared for countries and cities is based on a follower’s IP address, not what is listed in the person's timeline.
The demographic data for people talking about your business page requires that 30 people interact with your data within seven days of the dates you’re viewing. If you can’t see your demographic data, fewer than 30 people were interacting with your content. Try changing your date range to see if that helps. If it doesn’t, it’s time to integrate some new content-sharing tactics to promote more interaction. See Book IV, Chapter 4 for tips on building your Facebook community.
Getting to Know the News Feed Algorithm
You may have noticed that your news feed doesn’t display items chronologically. This is because the News Feed algorithm ranks that content. Facebook uses that algorithm to determine whether specific content will be of interest to you. Facebook looks at how you interact with others and with content on Facebook and makes assumptions based on those actions. Those assumptions determine what content is filtered to your news feed in the highlighted stories.
Facebook is pretty closed-lipped about its News Feed algorithm, but as we researched, we found that Facebook appears to rank actions based on the level of effort it takes to interact, but it appears to rank content based on the number of interactions. For instance, Likes are easy to give and require little effort on the reader’s part. Comments, however, take more effort and are rewarded accordingly.
Likewise, Facebook tends to reward certain content more than others. Facebook users are more likely to engage with photos or video than text updates. Facebook’s goal is to have people share interesting content that elicits a response, so Facebook gives a higher ranking to video or photos. Facebook tends to rank content in this order:
· Photos
· Video
· Links
· Text
Understanding how the News Feed Algorithm works
Facebook users have their own algorithm for each bit of content they consume. As you can imagine, that can make it hard for your content to show up in everyone’s news feed (especially if you’re trying to have your business page updates appear). Each person interacts with content, pages, and people differently, and therefore, has his or her own version of ranking based on those actions.
The News Feed algorithm uses many variables. Following are three of the more important ones:
· Affinity: The relationship between a content creator and a content consumer. The affinity factor changes over time, depending on how a user interacts (or doesn’t) with content. Affinity is determined by many things, such as how often a user
· Logs in to Facebook
· Interacts with content from another user or business page
· Clicks Like on content
· Types comments on content
· Clicks the Share option for content
Facebook keeps track of how a user interacts with content. When a user is consistently engaged with content from another Facebook user or business page, the affinity is high. If the user ignores content, the affinity begins to wane and can become low. When affinity is low, it’s less likely that content from the ignored user or page shows up in the user’s news feed as a highlighted story.
· Weight: Facebook determines the weight of an update and its engagement depending on how much effort it takes to complete. For example, it takes the most effort for a user to share a post created by someone else with his own audience, so shares weigh more than a Like. It takes a little more effort to post a video than a text update (and video is more likely to garner interaction), so video weighs more than a straight status update.
Facebook considers photos and videos as having the most weight, followed by links and then text updates. For engagement, shares have the most weight, followed by comments and then Likes.
Even though Facebook no longer calls its algorithm EdgeRank, you can still visit EdgeRank Checker (http://EdgeRankchecker.com), a website devoted to researching Facebook’s News Feed algorithm. EdgeRank Checker found that comments appear to have four times the weight of Likes. What that means is that when a user took the time to leave a comment, the content had four times as many clicks than when the user just Liked the content. Of course, that helps a business page’s ranking, but it also helps you see why it’s important to try to engage your audience beyond a simple Like. If your audience is commenting, it’s social proof to their friends that your article was worthwhile and they’re more likely to click your content (and maybe also respond, thus widening your audience even further).
· Time — decay: How long an object has been out there. The older your post, the more decayed it is. Facebook moves fast. Each time you check your news feed, you see something new. Posts that are old lose their edge and weight and count less. You need to post more than once a day; otherwise, your posts (that is, objects) won’t be seen by everyone, and they can't interact with your content. However, don’t re-post the same information multiple times a day. Instead, post varied, relevant content throughout the day, especially at the peak times that the majority of your audience is online.
Check your Insights (discussed earlier in this chapter) to determine how time of day is affecting interaction on your posts. If you’re posting at 6:00 am and not seeing a lot of interaction, try posting later in the morning. Or if you’re posting at 4:00 p.m. and seeing many comments or Likes, try to post more around that time. You will likely need to experiment with several times of day to find the sweet spot for your audience.
Using rank to improve your news feed position
Facebook uses each of the three variables discussed in the previous section to ascribe a rank for each user. To make the most of your ranking, you need to do three things:
· Determine who your audience is. When you know to whom you’re talking, you can customize your updates to meet their needs. By sharing content your audience wants, you increase your affinity with them.
· Create and post content that encourages feedback and engagement. The kind of content you post is directly related to knowing your audience. When you know who your audience is and what they want from you, find new ways to give that content to them. If you usually post text status updates, try sharing video or photos. Regardless of the type of content you share, provide a specific call to action. If you tell your readers what you’d like from them, they’re more likely to follow through for you.
· Post when your audience is looking. As mentioned, it doesn’t do you much good if you’re posting great content at times when people don’t see it. You may have a great idea at 2:00 a.m., but if you post it then, few followers will see it. Instead, write it down and post it later in the day when more of your audience is on Facebook. Use your Insights to see whether you can find a pattern of when your audience is most active on your business page. What you find may surprise you! Keep in mind that not everyone has access to Facebook during the day because of firewalls or other restrictions at work.
To improve your audience engagement, you need to post content that people want to interact with. In Book IV, Chapter 3, we explain how to build your Facebook community. The keys to a loyal and interactive community are solving a problem, educating your audience, and entertaining your audience.
You need to have clear goals in mind and know how you’re going to achieve those goals. Use calls to action, post links that promote sales, and tag other business pages in your status updates if it makes sense. When you tell your audience what you want them to do and provide a way for them to do it, they’re more likely to follow through.
And if you’re sharing a link to a post by another brand, tag its business page in your status update. Your update will be seen by that business pages’ followers as well — which enhances your overall reach.
The bottom line is that you must know your audience and what they expect from you. If you give your audience what they want, you establish yourself as an authority and your audience comes back to you for answers and comes to appreciate the community you’re building.