Implementing NetScaler VPX (2014)
Chapter 5. High Availability and Traffic Analysis
The purpose of many NetScaler instances is to provide load balancing and high availability for services. This should be the case for NetScaler itself as well, so configuring it as a high-availability pair should always be considered. NetScaler often sits in front of large web services processing large amount of data; thus troubleshooting might be cumbersome. So the ability to gather trace data is crucial; the same goes for the ability to protect the numerous services that are available. The following are some of the subjects that we will go through in this chapter:
· Different scenarios for high availability
· Setting up high availability
· AppFlow and integration with NetScaler Insight
· Traffic analysis and Wireshark
· Protecting services using AppFirewall
Setting up high availability
Consider the scenario where we have NetScaler sitting in front of our numerous services, and thousands of different websites that are load balanced and monitored by NetScaler.
So what will happen when NetScaler goes down, and the services stop and are no longer available for the end users? That's why we should always consider setting up a high availability NetScaler solution for our services.
By having a high availability NetScaler solution, we can ensure that if one of the appliances go down we still have another one or more that are available to serve the requests and load balance the different services.
NetScaler has many solutions that we can use to ensure high availability. The most commonly used deployment is an active/passive pair. This means that we have two appliances that cooperate so that one of the nodes is active (primary) and responds to requests and maintains the connectivity to the servers in the backend and the other node sits passively (secondary) waiting for the active node to go down.
By default, this feature uses GARP to broadcast its MAC address via layer two since both of the nodes use their own MAC address. When a device failover occurs, the secondary node sends out GARP packets to update the MAC table of nearby nodes (switches, routers, and firewalls) so that the new requests will be sent to the new node.
It is important to note that some firewalls do not support GARP or where GARP is blocked and therefore we need to configure VMAC for the deployment. When using VMAC, the MAC address is shared between the two nodes and therefore it is not required to use GARP to update the MAC table on nearby nodes. I'll come back to this later in the chapter and see how we can configure VMAC.
So if the primary node should go down or if it stops responding to requests, the secondary node is going to take over. The nodes monitor each other using heartbeats that are sent between the NSIP address of each of the nodes.
By default, there are some ports that need to be open in the firewall to allow for communication between the nodes in the high availability setup, as follows:
· The UDP port 3003 is used to exchange heartbeats for communicating UP or DOWN status
· The TCP port 3008 is used for secure high availability configuration synchronization
· The TCP port 3009 is used for secure command propagation and for the Metric Exchange Protocol (MEP)
· The TCP port 3010 is used for high availability configuration synchronization
· The TCP port 3011 is used for command propagation and for the MEP
Note
High availability is included in every edition of NetScaler and supports a maximum of two nodes. It is important to note that this feature requires us to have two of the same models and the same main release build version. Running an HA pair with, for example, a MPX 5550 and a VPX 1000 is not supported by Citrix.
In order to set up a high availability pair from one of the nodes, we need to know the following information about the other node: its IP address and the default system username and password. It is also required that they have the same RPC passwords; by default, this is the same across NetScaler. To set up a high availability pair, go to System | High Availability | Nodes and click on Add from one of the nodes. Here we are presented with the following options:
· Remote IP address (The NSIP of the other node)
· Configure remote system to participate in high availability setup
· Turn off HA monitor on interfaces that are down
· Turn on INC (Independent Network Configuration) on self node
· Remote System credentials
All we need to do is enter the IP address, configure the remote system to participate, turn off HA monitors on interfaces that are down, and enter a different username and password if it differs from the node we are configuring it on.
Turning off HA monitors on interfaces that are down means that NetScaler will not try to send HA probes from one node to another on interfaces that are not in use.
The last option is that INC is needed if the appliances are on different subnets and therefore require independent network configurations, since the regular HA option sets them up using the same network configuration.
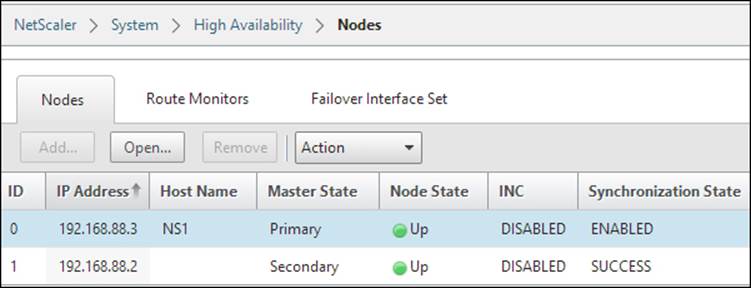
After we have entered the information and clicked on OK, the primary node will start to propagate its information and configuration with the secondary node and set up a high availability pair, as shown in the following screenshot:
It will also start to synchronize files such as SSL certificates and application firewall XML files; you can view the different files that are part of the synchronization process at http://support.citrix.com/article/CTX138748.
It is important to note that there are a few items that will not be synchronized, and those are licenses and rc.conf files. There might be issues with syncing SSL certificates; you can verify that they have been synced by using the CLI command:
sync ha files ssl
Since it is set up in an HA pair, changes that are made to the primary node will be propagated to the secondary node. We cannot make changes from the secondary node; this is shown in the CLI and GUI.
We can view the configuration from the GUI or using the following command:
Show ha node
In CLI, this shows us which is the primary (active) node and which interfaces are active.
We can also use failover interface sets; if we have multiple network interfaces on NetScaler attached on different switches, we can use them to failover to another interface.
For instance, if we have NetScaler with two interfaces, where interface 1 is attached to switch 1 and interface 2 is attached to switch 2, we can use failover interface sets to failover from NIC 1 to NIC 2 if, for example, switch 1 goes down. In a large environment, there are often large trunk tunnels that span multiple switches that handle this automatically.
In the GUI, we can right-click on each of the nodes and configure actions such as force sync and force failover. Force failover allows us to manually failover if, for example, we need to upgrade.
If we double-click on a node (the one we are logged in to), we get a configuration screen where we can set how the HA pair should function.
By default, when the primary node goes down, the secondary node would take over and promote itself to primary; when the main primary node comes back online, it promotes itself again to the primary node. If we, for example, have a small upgrade process and the primary node goes down, the secondary would take over. If we do not want the secondary to promote itself during the upgrade process, we need to set the secondary node as STAYSECONDARY. This stops the process and the primary mode will remain as primary after the reboot.
In this menu, we can also define how often the nodes should send probes to monitor if the nodes are responding.
If you are having some issues with the HA feature, we can use the nsconmsg feature by using the CLI. By running the command nsconmsg –d event, we can get a live view of events that are happening directly in the console.
Note
By default, NetScaler uses Gratuitous ARP (GARP) to advertise its MAC address after a failover has occurred. Some older firewalls from vendors such as Cisco and Juniper do not accept the type of GARP request packets that NetScaler sends out. So if failover is not working in your environment, there is a slight change that needs to be made in order for GARP to function, by logging in to the CLI of NetScaler and running the set network L2param –garpReply enabled command.
This command needs to be set on both of the nodes in a high availability setup.
If our firewalls or routers do not support GARP, we can configure NetScaler to use VMAC. VMAC allows NetScaler to have a floating MAC address between them, therefore bypassing the ARP problems with GARP. This can be configured by navigating to System |Network | VMAC.
Here we have to define a virtual router ID, for example, 100 and bind it to an interface where the VIP requests come from. The virtual router ID is just used as an identifier within the VMAC. After this is done, the HA nodes will replicate addresses and if we now go toNetwork | Interfaces we can see a VMAC pane that shows the virtual MAC address, which both of the appliances use.
Differences between clustering, HA, and GSLB
Now, besides the regular high availability feature that requires the use of two nodes, NetScaler also has some other high availability features such as clustering.
We are not going to do a deep dive into clustering but we will be going through a basic overview. If you wish to read more about clustering, you should read the clustering guide from Citrix, which can be found at http://bit.ly/1gLBlWO.
Regular high availability operates with a two-node instance where one is active and the other is passive. With clustering, we can scale from 2 up to 32 nodes, which are operating in an Active/Active state. This allows for a large amount of traffic throughput. In order to use this, we require an additional license. Also, there are some other requirements, as follows:
· To be on the same subnet
· To be of the same hardware type (for example, physical appliances)
· To be of the same platform type
· To have the same licenses (Standard, Enterprise, and Platinum)
· To be of the same software version and build
· To have their own feature license to be able to use clustering
Here, we can configure all NetScaler nodes from a single IP called the cluster IP, which in essence replaces the NSIP for management, so they act as one logical entity. The cluster IP is owned by the configuration coordinator, which is in essence the cluster coordinator role, which floats between the different nodes within a cluster.
Every VIP address that we create will automatically be available on all the nodes (called striped IP address) in a cluster; every Subnet IP (SNIP) address can also be distributed to all the nodes (striped IP address) or be available from just one node (spotted IP address). Citrix recommends using striped IP addresses for SNIPs.
Clustering can be set up either using Equal Cost Multiple Path (ECMP) or using cluster link aggregation.
ECMP is a routing protocol; it defines that a route has multiple paths to the destination with the same cost. This means that if I have multiple roads that I can travel to get to a destination and the distance is equally far, I just choose one of the paths; this way we can distribute traffic between the paths.
Different network vendors have different mechanisms to handle ECMP traffic; for example, Juniper uses a hash algorithm to determine if a packet should travel one path or another. Citrix has written an article on how to configure this using a Cisco Nexus 7000, which is available at http://support.citrix.com/proddocs/topic/ns-system-10-map/ns-cluster-traf-dist-ecmp-tsk.html.
Cluster link aggregation is an extension of link aggregation, meaning that we have one interface connected from all the nodes to a switch to create a virtual interface. So instead of a regular link aggregation where we have multiple interfaces from the same appliance, we have one interface from many appliances.
Note
It is important to note that not all features running on a clustered environment are supported, for example, NetScaler Gateway. A list of supported services running on a clustered deployment can be viewed at http://support.citrix.com/proddocs/topic/ns-system-10-map/ns-cluster-feat-supp-ref.html.
Now we also have Global Server Load Balancing (GSLB).This is not a high availability feature per say; however, as the name describes, it is a load balancing feature. We are not going to configure GSLB but just see how we can use it and how it works.
GSLB works with the help of DNS. It allows us to deliver a service from different data centers spread across different geographical locations; this helps us in case of data center failures and disaster recovery.
It can also help to spread the load across different locations with its proximity feature and allows users to be sent to the closest data center. This type of feature is often used with, for example, Facebook and Google.
So let us take a closer look at how GSLB works. First off, it is important to know how DNS functions, as this is the fundamental component in GSLB.
When a user connects to a service, for example, www.myservice.company.com, the client will send a DNS request to its DNS server. The DNS server of the client will send a recursive request to the authoritative DNS server of that record. The authoritative DNS server will respond with an A-record to the recursive DNS server, which will in turn respond to the client.
Now the client and the recursive DNS server will store the A-record in their cache based upon the time-to-live (TTL) entry of the record. When the TTL expires, the client has to once again query the DNS server. This is the component that allows GSLB to work, as GSLB in essence is load balancing and DNS. For example, with GSLB configured and the client again querying for the service www.myservice.company.com, the DNS server has a list of different A-records for that particular service that might represent a list of vServers on an HA pair NetScaler on a site. This can also depend on the setup that might return with an A-record for the closest vServer that is able to handle the request.
Now, there are different ways to configure DNS with GSLB here, which are as follows:
· Authoritative DNS configuration: This allows NetScaler to act as an authoritative DNS server for a domain, in this case company.com. This means that NetScaler will respond to all DNS queries from a recursive DNS server, and based upon where the client is located, respond with an A-record that is closest to the client.
· Authoritative sub-domain DNS: This allows NetScaler to act as an authoritative DNS server for a subdomain, for example, myservice.company.com.
· Proxy DNS vServer: This allows NetScaler to proxy DNS requests to an authoritative DNS server running inside the corporate network. NetScaler has a vServer DNS service running, which load balances DNS queries externally to an internal or another external DNS server.
After we have decided how we want the DNS setup to be, we need to configure GSLB. You can read more about how to configure GSLB at http://support.citrix.com/servlet/KbServlet/download/22506-102-671576/gslb-primer_FINAL_1019.pdf.
It is important to note that GSLB can be configured in different ways as follows:
· Active/Standby
· Active/Active
· Proximity
· Weighted round robin
· Data center persistence
How to configure GSLB for these different scenarios is explained at http://support.citrix.com/proddocs/topic/netscaler-traffic-management-10-map/ns-gslb-config-comn-dplmnt-scenro-con.html.
Now that we have explored some of the different high availability features that NetScaler offers, it is also important to keep in mind that running NetScaler in a virtual environment requires planning where to place it. It is important to have some sort of availability feature in place for the virtualization hosts as well, as having a high availability feature on NetScaler is not enough if something happens to the virtualization hosts. We can consider having features such as the following:
· Failover cluster: This allows live migration in case of hardware failure.
· NIC teaming: This ensures continuous availability in case of NIC failure.
· Raid on local disks: This ensures that the system continues to run in case of hard drive failures.
· SAN redundancy: This ensures that the storage on which NetScaler resides is redundant.
And, of course, these features should always be used in combination with redundancy in NetScaler as well, as in regular high availability.
Using AppFlow® to monitor traffic with NetScaler Insight Center™
Now, in most cases, NetScaler is used as a central component to deliver high availability services to users, both internally and externally. This means that NetScaler, in most cases, handles a large amount of traffic.
What happens if a user complains about slow performance of an application, or that something is running sluggishly? Or if we want to get an overview of the number of users accessing our services? This is where AppFlow comes in.
AppFlow is a feature in NetScaler, which is used to collect web performance data and also database information. It can also be used to gather performance from ICA sessions. It is built upon the IPFIX format, which is an open standard defined in RFC 5101.
As an example, in the following screenshot, when a client opens a connection to the VIP of NetScaler, it will perform a new connection to the backend server and then the traffic is returned from the backend server back to NetScaler and then to the client. The AppFlow feature will send data to a collector with information about the client that connected, which is shown in the following screenshot; the information includes which port and service it accessed and what backend server it got connected to. So we have the complete overview of all the conversations that a client has with a service.
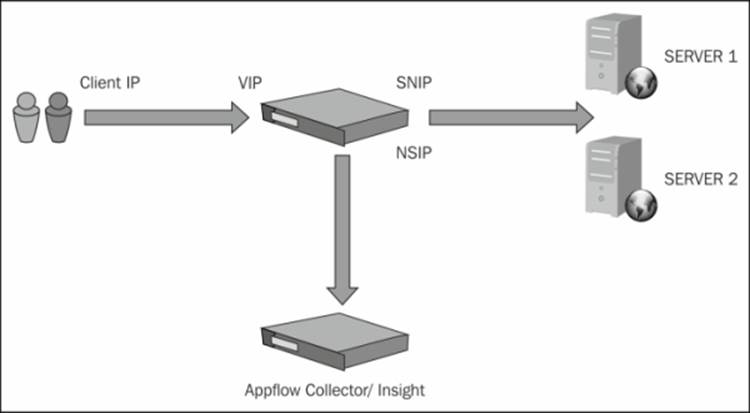
By default, NetScaler uses its NSIP to deliver data to an AppFlow collector; it is important to note that we can use net profiles to define AppFlow to use another IP address, for instance, a SNIP.
Viewing the AppFlow data requires that we have a collector that is capable of analyzing the data.
We can, for example, use other third-party AppFlow connectors such as SolarWinds or Splunk that have the capabilities to analyze AppFlow data. Citrix also has a solution that is called NetScaler Insight, which acts as an AppFlow collector. NetScaler Insight is a virtual appliance that runs either on XenServer or VMware. This appliance can be used as a collector for AppFlow, which allows us to get an overview of the Web and ICA traffic.
Note
NetScaler Insight is not yet supported on Hyper-V and there is no current ETA for when Citrix is coming with a release for Hyper-V. NetScaler Insight is available for download on mycitrix.com at http://www.citrix.com/downloads/netscaler-adc/components/netscaler-insight-center-101.html. This requires a valid mycitrix.com account.
When setting up NetScaler Insight either on XenServer or VMware, just import the OVF file and it will automatically create a VM with the required configuration. The Insight appliance runs also on FreeBSD. FreeBSD is an open source operating system that is built upon UNIX.
Remember to put the Insight appliance on a network where it can reach the NSIP of NetScaler.
The start configuration of Insight is required to be done from CLI. We need to enter an IP address and a subnet mask to allow us to communicate with it using the GUI.
After we have entered the required IP configuration, we can access it by opening a web browser against the IP address. The username and password is the same as the NetScaler appliance, that is, nsroot and nsroot.
The first time we log in, we are presented with a dashboard with two main panes: Dashboard and Configuration. In order to get AppFlow traffic, we need to add a NetScaler instance.
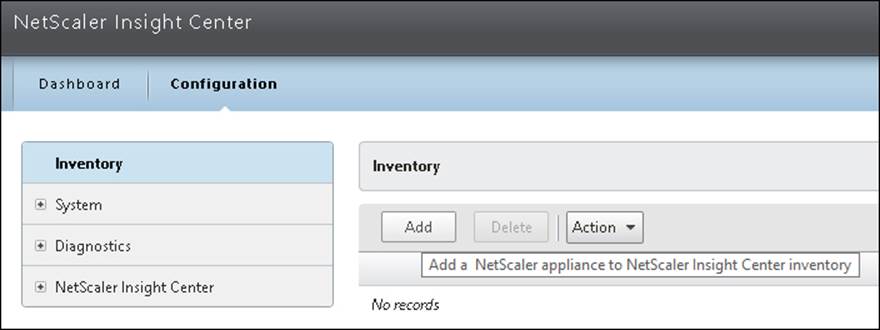
Go to Configuration | Inventory | Add. Here, we need to enter a NSIP address and the nsroot username and password of our NetScaler appliance.
After we have added an appliance, it will show us a list of vServers that we can configure AppFlow for.
For example, if we have a load balanced vServer we wish to be able to see AppFlow data for, we can right-click on an LB server and choose Enable AppFlow.
Now, we are presented with a policy window, where we need to enter an expression. If we wish to get AppFlow data for all traffic that goes to the vServer, we can use the following expression:
HTTP.REQ.LB_VSERVER.NAME.EQ("nameofvserver")
This will create an AppFlow policy and bind it to the vServer on the NetScaler appliance. We can also enable this for a Content Switching vServer and a NetScaler Gateway vServer.
In order to enable AppFlow for a NetScaler Gateway vServer, right-click on vServer, choose Enable AppFlow, and insert true under expression. This will allow NetScaler to generate AppFlow data for Gateway vServers as well.
We have now configured NetScaler Insight against NetScaler. When new clients now connect to a vServer that has an AppFlow policy bound to it, data will appear in NetScaler Insight.
When we go into the dashboard, we are presented with two options, Web Insight and HDX Insight.
Note
It is important to note that the amount of data that the Insight appliance stores depends on what kind of license the NetScaler appliances are running. If we have the NetScaler Standard license and we wish to use it with Insight, we can only use the Web Insight functionality. If we have NetScaler Enterprise, we can use Web Insight but the HDX insight data will only show traffic for the last month. If we have NetScaler Platinum, we can use Web Insight and HDX Insight and will be able to show traffic for the last year.
Web Insight shows us AppFlow data that is generated from load balanced vServers and Content Switching vServers, and shows us information regarding the Web traffic. HDX Insight shows us the data generated from the NetScaler Gateway vServer.
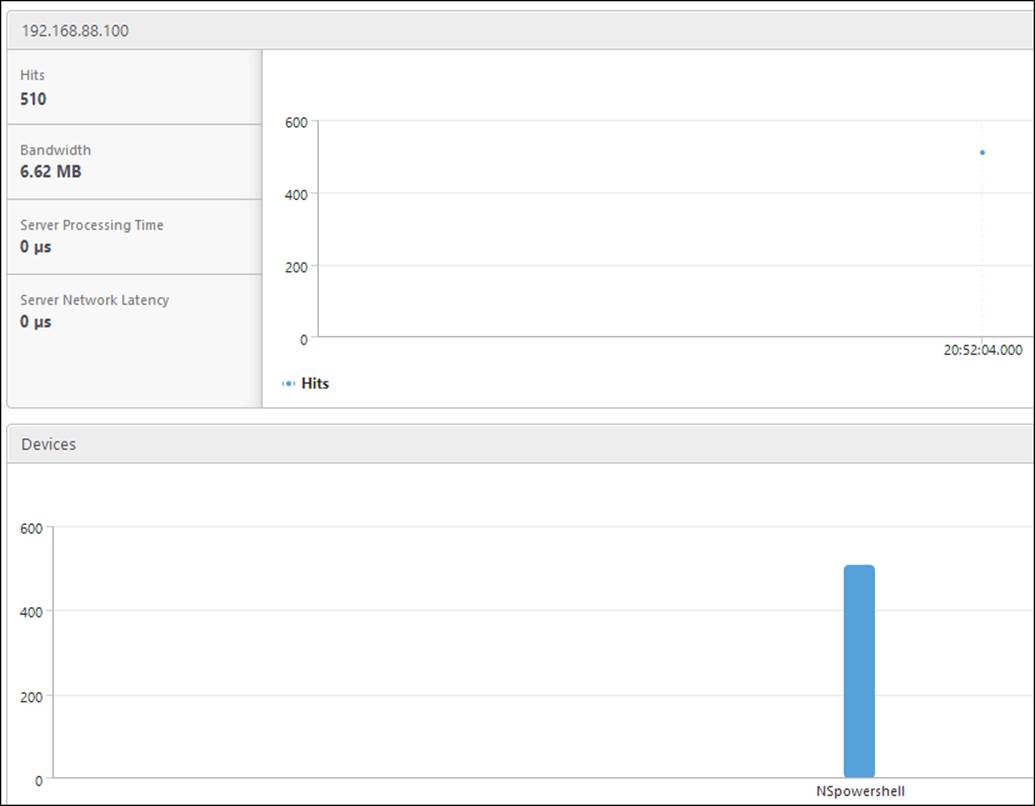
For example, if we go into Web Insight, we can browse to different categories that show us which clients have access to a server. This is shown in the following screenshot:
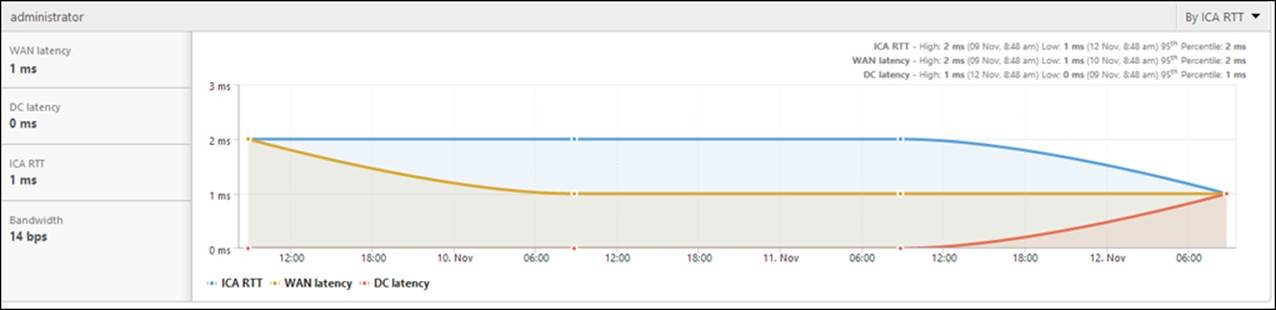
And if we go into HDX Insight, we can get an overview of how many users are accessing our gateway and what applications they are accessing.
We will also get other key information, such as:
· WAN latency: This is the average latency caused by the client-side network.
· DC latency: This is the average latency caused by the server network.
· ICA RTT: This is the average screen lag that the user experiences while interacting with an application or desktop hosted on XenApp or XenDesktop.
· Bandwidth: This is the rate at which data is transferred over the ICA session.
This can be seen in the following screenshot:
We have now successfully set up and configured AppFlow integration with NetScaler Insight; if we have a XenDesktop environment, it is also possible to integrate Insight with Director to get a live view from the traffic usage here.
Now, this gives us a look at the network flow of services. Using AppFlow with Insight is a good feature to use to get an overview of how many users are actually using the services and what content they are accessing. But AppFlow does not give us the information we need in case we want to troubleshoot something, for example, if a user has issues connecting, the network is getting sluggish, or a service is marked as down and we need to dig a bit deeper to find the issue.
Traffic analysis with NetScaler® tools and Wireshark
There are times when you need to get your hands dirty to troubleshoot something in a bit more detailed sense to find out what is actually wrong, for example, why we are having trouble with our NetScaler, why a client is having trouble connecting, or why the network is not working as it should.
NetScaler has a number of built-in tools that we can use to gather information and for basic troubleshooting. For example, we have the regular tools such as ping and traceroute to verify network connectivity, but we also have other tools such as:
· nstrace
· nstcpdump
Both of these tools are accessible from the GUI by navigating to System | Diagnostics | Start new trace, and using the CLI.
The difference between these tools is that nstrace dumps packets in the native NetScaler format; this has an advantage since it has information regarding clients connecting to a VIP and connections from SNIP to a backend server.
Note
It is important to note that a trace file generated with nstrace can also be analyzed with Wireshark, but this requires a modified version of Wireshark that has NetScaler filters installed. The current development build 1.11.2 supports this.
Nstcpdump does not give the native NetScaler trace format; it is more resource intensive but gives an ordinary tcpdump trace file that we can analyze in, for example, Wireshark.
So by using nstrace we can, for example, get trace files for one of our vServers; this requires the use of specific filters. If we do not use filters here, we will get all of the network traffic in the trace file, which, again, can be analyzed using Wireshark filters.
For instance, to get a trace file for our vServer called vpx using nstrace from CLI, we could use the following filter:
nstrace.sh –filter "vsvrname == vpx"
Or if we wanted a trace file for our backend service called IIS, we could use the following filter:
nstrace.sh –filter "svcname == IIS"
We could also filter based upon IP addresses or port numbers, as follows:
nstrace.sh –filter "sourceport >= 80 && destip != 88.88.88.88"
You can press Ctrl + C to terminate the trace using the CLI.
These are just to give some examples. To get a list of all the different filter abilities, you can use the help nstrace command. We can also use nstcpdump for more low-level troubleshooting; in order to use it, we need to enter the shell mode under CLI. This can be done by typing shell when in the CLI. With nstcpdump, we can also use filters, but not specific to any NetScaler resources.
For example, we can use nstcpdump to create a trace file for all traffic going via port 80 as follows:
nstcpdump.sh port 80
Or we can use it to filter, for example, all traffic from a specific host using TCP as follows:
nstcpdump.sh dst host 10.0.0.20 and tcp
We also need to specify a location for the trace files, else they would all appear in the console. This can be done by appending the –w option and defining a path as follows:
Nstcpdump.sh dst host 10.0..0.2 –w /var/nstrace/filename.cap
When using GUI, we can also append filters directly to add a trace without knowing the parameters that we need to use. Using the Start new trace option, we have the option to start and stop a trace and then download the trace files directly to our computer. By default, all trace files are stored under /var/nstrace/date. It is important to note that debugging a trace requires some sort of protocol analyzer to sort the data; this is where Wireshark comes in.
Wireshark is an open source network protocol analyzer. We can use it to monitor live time on a network interface or use it to analyze trace files. It is very powerful and the most commonly used one for troubleshooting network issues where we have a trace file.
So let us go through a basic troubleshooting scenario just to show how you would have troubleshot network issues in real life. This scenario will cover how we can start a trace file using nstcpdump, download it, and then import it to Wireshark.
We can also use a bunch of different filters to sort the data, which I will cover a bit. By default, Wireshark just lists all the packets sorted by package ID.
Wireshark can be downloaded from http://www.wireshark.org/ and runs on the most common operating systems. Another tool that is also useful in this type of scenario is Microsoft Message Analyzer. The advantage of using Microsoft Message Analyzer will be evident when you need to troubleshoot Microsoft specific services, such as SMB traffic. You can download Message Analyzer from http://www.microsoft.com/en-us/download/details.aspx?id=40308.
Let us go ahead with an example scenario, just to show how we can use Wireshark to analyze and debug traffic. In this scenario, a user has recently tried to access a vServer called IIS, which is a basic load-balanced web server running Windows Server 2012 R2 with the IP address of 192.168.88.100. The user tries to connect with a web browser but the connection times out. The client is located on 192.168.88.1. Let us see if we can find out why.
We can start the trace using nstcpdump in the GUI. Remember to put the packet size to 1514 if we want the entire packet, which in some cases makes it easier to see the entire conversation, although it puts more strain on NetScaler and creates a larger trace file. Also, remember that if we are using HTTP compression on that particular vServer, create a policy for that particular IP and exclude it from compression. Since compression encrypts the information using compression algorithms, it makes it a bit harder to troubleshoot.
After this is done, we ask the user to try connecting again. We gather some packets and then we can stop the trace and then download it from the GUI.
After we have downloaded the trace file to our computer, we can open Wireshark and from there go to File | Open and then choose the trace file.
Immediately, this will list all the packets from the trace file, sorted by packet ID, as shown in the following screenshot:
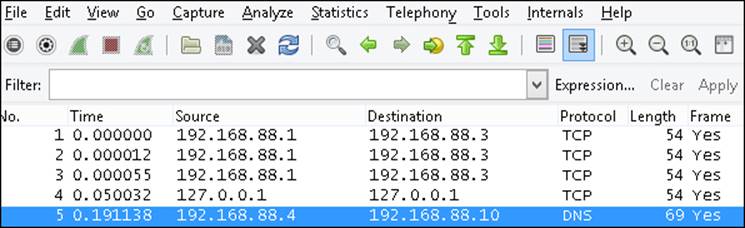
So all packets are listed with a source, destination, protocol, length of the frame, and more information on what is inside the packet. If it is a regular HTTP protocol packet, we can see the information that has gone back and forth in clear text.
We also have a filter box where we can enter different filters to the trace file. A good overview of the use of different filters in Wireshark can be found at http://wiki.wireshark.org/DisplayFilters.
In our example, we can use the following line in the filter box and then choose Apply, since we know that the client is connecting from that IP address:
Ip.src == 192.168.88.1
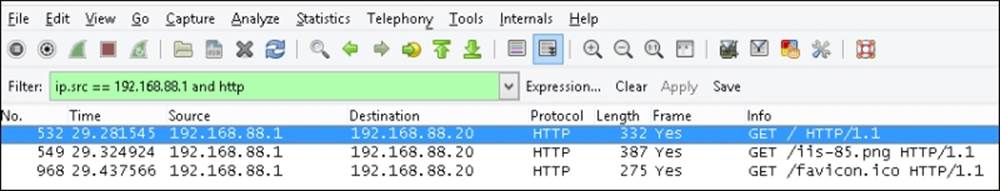
This will now update the window with all packets coming from that IP address, and it still contains all of the different protocols. To narrow it down to HTTP, we can add the following line of code:
Ip.src == 192.168.88.1 and http
This leaves us with three packets left to analyze. From here, we can see that the client did an HTTP GET method against the main URL with a PNG and an ICO file on the website. GET is the HTTP method that is used to request content from a server, as shown in the following screenshot:
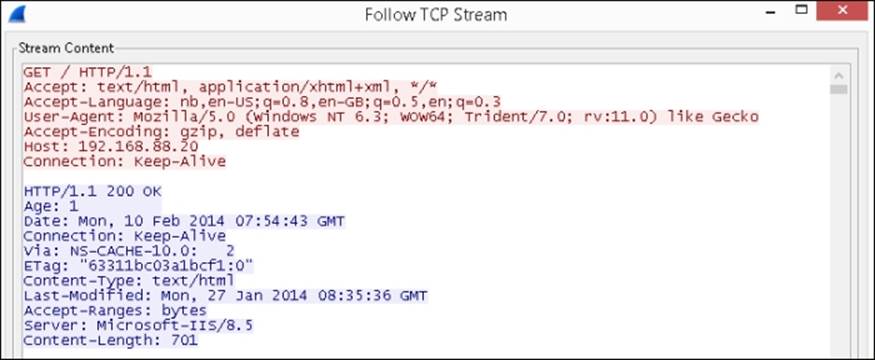
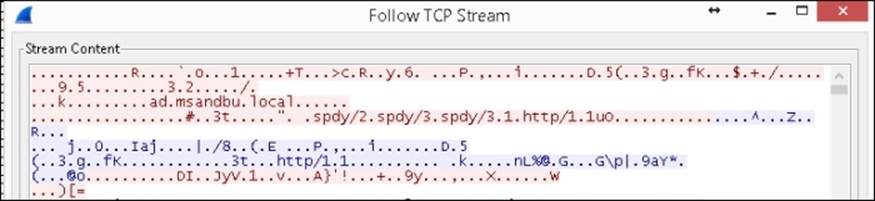
So we can see that the client did request the content; what we can do next is look at the TCP packets that are linked to this request. By right-clicking on one of the packets, we have an option called Follow TCP stream. This is useful since it shows us the entire conversation that the client and our web server had and we are presented with a stream content. This shows what was requested and what was returned from the Web server in clear text.
This is useful because it allows us to see what HTTP data is being sent and what is being returned to the client. It is also useful when we are working with configuring caching and compression.
Note
So from the TCP stream, we can see all the information that was presented to the client. Not just HTTP data, but all the other data that is attached to the resource. For example, from the trace file we can get Wireshark to export objects inside it.
By going to File | Export Objects | HTML, we will get a list of objects that are referenced in the HTML traffic. For example, we can export the image files that are part of the trace file.
Analyzing encrypted content with Wireshark
When we look at the TCP stream, we see the conversation the client had with the vServer and that the vServer responded correctly with the content, as shown in the preceding screenshot. So it is only safe to assume that the client had received the content and there most likely is something wrong with the client setup.
Since the trace file is in pure HTTP traffic, it means that it is in clear text, which makes it easy for us to make the trace file and see the entire conversation between the client and the server.
But in most cases, when we have a load-balanced web server it is running HTTPS so the entire conversation is encrypted.
So if we generate a trace file for the HTTPS service, we are unable to read what is specifically happening at the HTTP layer. All we can see is below the HTTP layer, for example, that an IP address has connected to another IP address using HTTPS and port nr.
The following is a screenshot of the TCP stream from a conversation between a client and a server using HTTPS.
With Wireshark, we can actually decrypt HTTPS packets in the trace files as long as we have the private key from the digital certificate that was used on the vServer.
You would only need to download the private key from NetScaler if you have created a certificate from scratch; it can be easily downloaded from NetScaler by navigating to Traffic Management | SSL | Manage Certificates | Keys | CSRs. If you have a PFX file, you need to use OpenSSL to export the private key from it. OpenSSL can also be found under the SSL pane. From there, run the following command:
openssl.exe pkcs12 -in publicAndprivate.pfx -nocerts -out privateKey.pem
This can also be started from the CLI. So after we get a hold of the private key, we need to add it to Wireshark. In Wireshark, go to Edit | Preferences | Protocols | SSL. There under the RSA keys list, choose Edit. Then from there choose New and now we have to enter the IP address of the vServer, which appears in the trace files we want to decrypt. Also, we need to enter the port nr, which is 443, and the protocol, which is http. Then point it to the private key that has been downloaded from NetScaler.
Then choose Apply; Wireshark will then update the trace logs with the decrypted data. And we can now once again use filters to locate the particular conversation between the client and the vServer.
As we can see, Wireshark is really useful at doing debugging of network traffic from a trace file. We have only touched the surface on what we can do with Wireshark; it is also beneficial that we have a firm understanding of networking if we are to do troubleshooting with Wireshark.
Citrix has some posts regarding how to best use Wireshark to debug Citrix connection issues, which can be found at http://support.citrix.com/article/ctx121696 and http://support.citrix.com/article/CTX138202.
Maintaining security using NetScaler AppFirewall™
With the rapid change and development going on with Web 2 applications, security has always been a big concern. The same goes with network infrastructure, which is becoming more and more complex; and with the focus on software defined networking, more of the control plane is moving towards the software.
With this, there is also more that needs to be secured. For example, since websites are not just plain HTML anymore, they contain a large mix of dynamic content working with an active database in the back and adapting based upon who the users are and what kind of device the site is being accessed from.
So where does NetScaler fit in? Since it is usually between the users and the services, it might be, in many cases, the first line of defense against malicious hackers.
NetScaler is equipped with many security features that can fend off attacks, such as the following:
· SYN DoS Protection
· Sure Connect
· Surge Protection
· Rate Limiting
· ACL (Access Control Lists)
· HTTP DoS
These are just some of the features that can be used; last but not least, we have the application firewall feature.
The application firewall is used to secure services running behind NetScaler. It consists of policies and profiles. Here we use the policy to identify patterns in the traffic, and profiles are used to specify what we are going to do with the traffic, like most features in NetScaler.
There are two ways that the application firewall delivers protection; the first is signature based. This means that NetScaler recognizes a pattern based upon a signature and, depending on the action, might drop the connection. So this is useful if it is a known vulnerability that a hacker is trying to exploit.
The second way it can protect is with the deep protection features, which are used for unknown attacks. Here, we can configure it with a learning feature. This learning feature can be a useful way to see, for example, which websites the users are allowed to access internally and which they are not. This allows NetScaler to adapt a standard behavior.
Here we can also define filters. For example, users are allowed to access my website but not a URL starting with /mysite or /sales and we can define an action when someone tries to access a URL with /mysite.
So deep protections are useful for URL masking, SQL injections, buffer overflows, managing forms, and so on.
Note
It is important to note that Application Firewall is only part of NetScaler Platinum and can be purchased as an add-on Enterprise. It is also recommended that you update the signature file when a new version is released. If your NetScaler is allowed to communicate externally using NSIP, it is also possible to configure autoupdate. This is done by navigating to Signatures | Action | Auto Update Settings and enabling Signatures Auto Update; after this is enabled, we can go to Action and trigger the update version.
Now that we have talked a little bit about how Application Firewall works, let us go in and show how it operates.
We cannot go through every feature within the application firewall, since it contains so much advanced functionality. We are only going to go through the basic features and some of the deep protection features. If you are interested in knowing more about the features not covered in this book, I suggest you head on over to the article in eDocs available at http://support.citrix.com/proddocs/topic/ns-security-10-1-map/appfw-checks-con.html; it contains information about all the different deep protection features.
Before we start using the application firewall feature, we have to enable it. This can be done by using the GUI under System | Settings | basic features | application firewall or by using the following CLI command:
Enable ns feature appfw
After that we can go to Security | Application Firewall and start configuring the features. To show how we can enable the different protection features, we can go through Application Firewall Wizard.
This will start a wizard where we first need to define the name of a web application. This is not linked to vServers but is used just for descriptive purposes. We also need to define a web application type that defines what choices we get in protection features. So as an example, let us say that we want to secure a regular IIS site running on Windows Server 2012, which is basic HTML. Then we can enter the name IIS and choose regular web application HTML under type.
Next, under Rule, we need to define a rule that allows NetScaler to identify which traffic it should look at. Here we can use many of the same expressions we use on the other features; we can also type in true. Then, this rule will apply for every connection made to NetScaler.
Next, we need to choose what signatures we want to enable; since this is an IIS server, we can enable Microsoft IIS signatures. When we click on Next here, we get some options as to what we would like NetScaler to do with the traffic that is picked up by the signatures. The default is Log and Stat.
If we click on More…, we can see all of the different signatures that are going to be used as part of the IIS signature set.
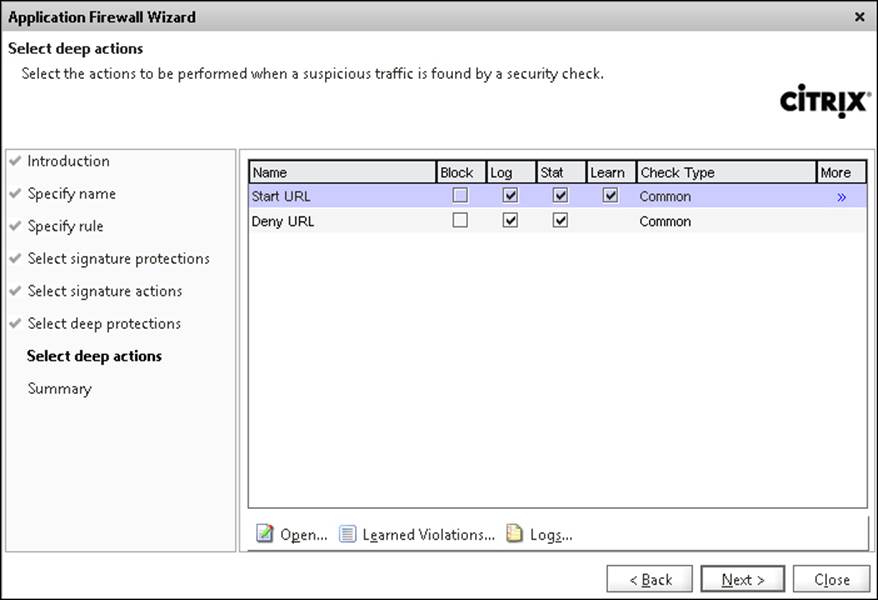
We can leave it at default for now just to see what happens, so click on Next. Now we need to configure the deep protection features.
Remember that these features are for an unknown attack, so we can use the learning feature to define a baseline or go in and change the default behavior. This feature applies for XSS, SQL injections, and more, but for now let us just enable Start URL and Deny URL under the URL Protection features.
When we click on Next, we are presented with the two features we enabled. This can be seen in the following screenshot:
The Start URL action defines which URL a client is allowed to use to start a connection against a service. This means that the first connection from our client can go directly to http://mycompany.com/index.html but not directly to http://mycompany.com/employee/me.
This function is used to prevent forceful browsing, which means preventing repeated attempts at random URLs. So URLs entered here cannot be used with, for example, bookmarks since they are direct URLs.
By default, the feature is set with the following values:
· Log: The NetScaler will log the violations made.
· Stat: This will maintain the statistics for the rule.
· Learn: This will learn what the default start URLs made to a website are, which makes it easier to deploy rules based upon what is the most accessed start URL.
We can also enable Block; then, the feature will start blocking requests made if a rule is violated.
If we click on Open, we are presented with Checks; these define which start URLs are allowed. We also have a Learning button down below; if we have enabled the learning function for this feature, it will show all the entry URLs that have been accessed.
We can also enter our own custom entry start URLs; if we want all our users to start on index.html, we can add this by choosing Add and entering the URL.
Note
These features use regex to search through the URLs to see if they violate a rule. regex uses a sequence of characters to form a search pattern. Using these features within NetScaler requires a bit of knowledge about them. Fortunately, NetScaler includes a regex tester that allows us to test our expressions. This can be accessed within a feature, for example, by going to Profile | Open Start URL | Add | Regex Editor. If you are unsure how an expression should look, you can find a good list of examples athttp://support.citrix.com/proddocs/topic/ns-security-10-map/appfw-checks-url-starturl-con.html.
But we can enable the blocking action and leave the rest at its default and make sure that the learn action is enabled.
If we go back to the deep actions, we also have the deny URL action. This is basically an allow/deny action. If we click open, we get a list of URLs where we can define the users that are not allowed to browse, as shown in the following screenshot:
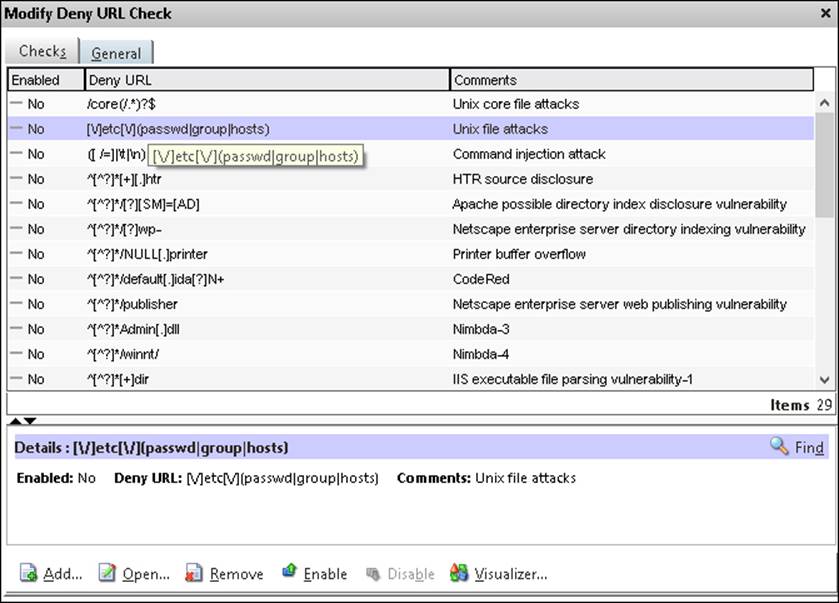
Now, by default, none of these rules will do anything. We have to enable them and then define a general action for the rules. For example, if we want to block connections that are tied to HTR source disclosure, we would need to perform the following actions:
· Enable the rule
· Enable an action under the general pane
We can also add our own URLs by choosing the Add button and then choosing enabled. So, after we have reviewed the settings, click on Next and then on Finish.
Now, by default, this policy will be bound at a global level, meaning that it will apply to every service on NetScaler. If we want to bind it to a specific service, we should unbind it at a global level and bind it to a specific service.
Note
It is important to note that using application firewall on a global level will put a lot of strain on NetScaler, since it has to analyze every HTTP packet.
Now, if we wish to change the bindings, go to Application Firewall | Policy manager | Default Global; we can see that the application we created is now bound there. Choose Unbind and then find the web service we wish to bind it to and choose Bind.
If we now start to do some random requests against the Web service, we can see that the log starts to fill up, and if we try to open some URLs that we have defined as not allowed, we can also see the violation rules.
These can be viewed by navigating to Application Firewall | Policies and then selecting the name of the policy we just created.
Open it, go to Security Checks, and choose Logs. We can see from the following screenshot that, after accessing some random URLs on our web service, the Start URL rule kicks in and starts blocking connections.
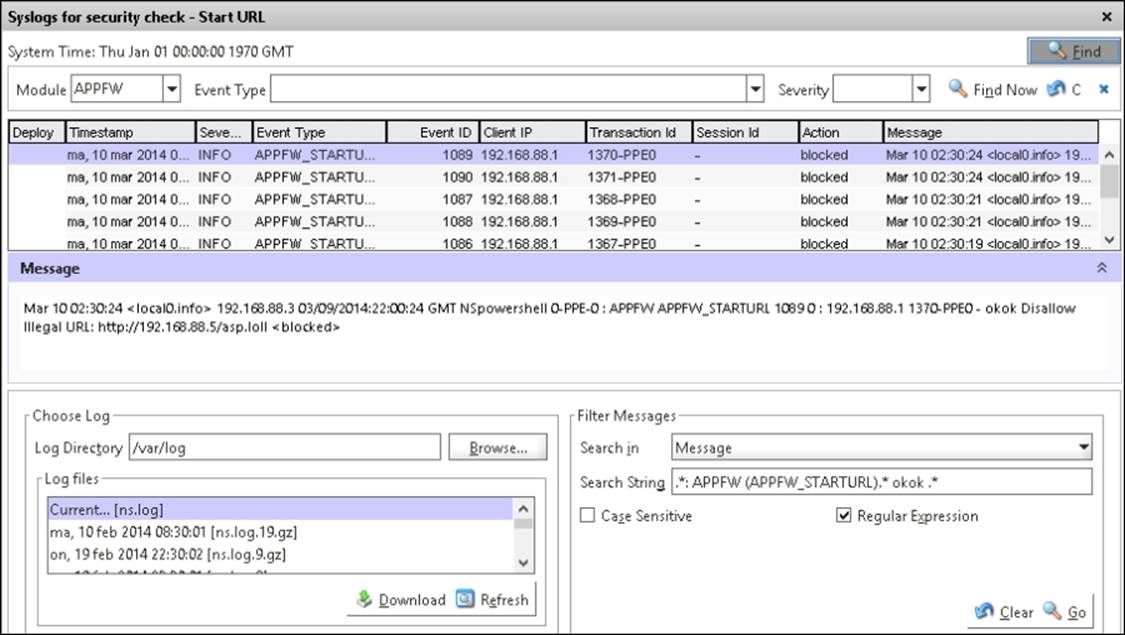
Every user who tries to access a random URL on the service that triggers a violation rule will automatically get redirected to the main page. We can define a redirect URL for those who try to access random URLs.
This can be done by navigating to Profile | Settings | Redirect URL.
We have now seen a small portion of what Application Firewall has to offer; it offers a wide range of different features that can be used to prevent Cross Side Scripting, SQL injections, and such. As mentioned earlier, if you wish to learn more about the different features within Application Firewall, head over to the following eDocs article: http://support.citrix.com/proddocs/topic/ns-security-10-map/appfw-config-con.html.
Summary
We have now gone through some of the different ways that we can configure high availability on NetScaler, and how we can analyze traffic using Wireshark and nstrace.
Also, we went through AppFlow with NetScaler Insight to get a glimpse of how much traffic is entering our network and lastly how we can protect our service using application firewall. It has been a long chapter with lots of different subjects and is unfortunately the end of this book.
Throughout this book, we have just scratched the surface of what features NetScaler has to offer. If you are interested in learning more about the different features NetScaler has to offer and news about them, I would encourage you to visit the following websites and links:
· NetScaler Knowledgebase: http://www.NetScalerkb.com/
· Citrix Blogs: http://blogs.citrix.com/
· My blog: http://msandbu.wordpress.com
· Kees Baggerman's blog: http://blog.myvirtualvision.com/
· Neil Spellings's blog: http://neil.spellings.net/
All materials on the site are licensed Creative Commons Attribution-Sharealike 3.0 Unported CC BY-SA 3.0 & GNU Free Documentation License (GFDL)
If you are the copyright holder of any material contained on our site and intend to remove it, please contact our site administrator for approval.
© 2016-2026 All site design rights belong to S.Y.A.