iOS Programming: The Big Nerd Ranch Guide (2014)
14. Debugging Tools
In Chapter 7, you learned about using the debugger to find and fix problems in your code. Now we are going to look at other tools available to iOS programmers and how you can integrate them into your application development.
Gauges
Xcode 5 introduced debug gauges that provide at-a-glance information about your application’s CPU and memory usage.
Open your TouchTracker project and run it, preferably on a provisioned iOS device rather than the iOS Simulator. In the navigator, select the ![]() tab to open the debug navigator.
tab to open the debug navigator.
Figure 14.1 Gauges
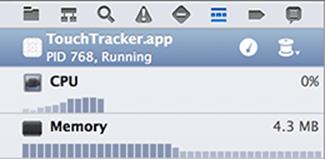
While the application is running (not paused or crashed), the debug navigator shows CPU and memory gauges (Figure 14.1). Each of these shows a live-updating graph of resource usage over time, as well as a numerical figure describing that resource’s current usage.
Important note: these gauges scale based on the hardware that is actually running your application. Your Mac has much more available RAM and likely more CPU cores than iOS devices do, so if you run your application in the iOS Simulator, your CPU and memory usage will appear to be very low.
Click on the CPU Debug Gauge. This will present the CPU Report in the Editor pane (Figure 14.2).
Figure 14.2 CPU report
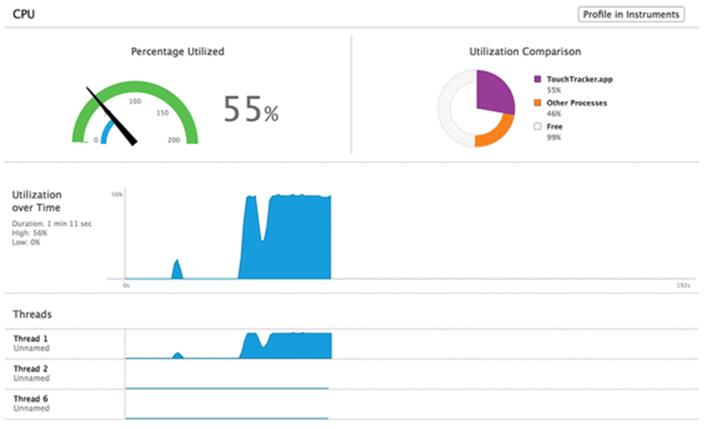
The report contains four basic sections:
|
Percentage Utilized |
shows your CPU utilization relative to the number of CPU cores your device has. For example, dual-core devices will show CPU usage out of 200%. While your application is idle, this should read 0%. |
|
Utilization Comparison |
allows you to see your application’s CPU usage as it impacts the rest of the system. At any given time, your application is not the only cause of activity on the device. Some applications may be running in the background, putting their own pressure on the system. If your app feels slow but is not using much CPU on its own, this may be why. |
|
Utilization over Time |
graphs your application’s CPU usage and shows how long the application has been running, as well as peak and trough usage values over the course of the current run. |
|
Threads |
shows a the breakdown of the Utilization over Time graph on a per-thread basis. Multithreading is outside the scope of this book, but this information will become useful to you as you continue your iOS development education and career. |
To make the graph a bit less boring, begin drawing a line but continue moving your finger without ever letting the line lock into place. This will cause a sustained spike in CPU usage.
Why? Each point on the screen that your finger moves on causes a turn of the application’s run loop beginning with a touchesMoved:withEvent: message, which in turn causes drawRect: to be sent to your BNRDrawView instance. The more work that you do in these methods, the more CPU utilization your application will require while lines are being drawn.
Next, in the debug navigator, click on the Memory Debug Gauge to present the Memory Report (Figure 14.3).
Figure 14.3 Memory report
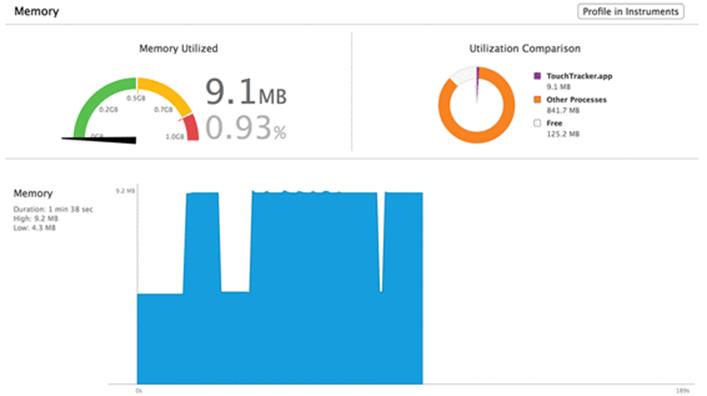
Like the CPU Report, the Memory Report is broken down into easy-to-read sections. Do not be alarmed if your Memory graph (the bottom section) appears to be at 100%; this graph scales so that your peak memory usage represents 100% visually.
It is a general goal of software development for any platform to keep both CPU and memory utilization as low as possible, to maximize application performance for the user. It is a good idea to get in the habit of checking these gauges and reports early and often in your projects so that you will be more likely to notice when a change that you have made to your code has resulted in an unexpected change in your application’s resource usage.
Instruments
The gauges and reports provide easy and quick access to a high-level understanding of your application’s resource usage. If your CPU or memory usage seems higher than it should be, or if your application feels sluggish, you need more information than the gauges and reports provide.
Instruments is an application bundled with Xcode that you can use to monitor your application while it is running and gather fine-grained statistics about your application’s performance. Instruments is made up of several plug-ins that enable you to inspect object allocations, CPU utilization per function or method, file I/O, network I/O, and much more. Each plug-in is known as an Instrument. Together, they help you track down performance deficits in your application.
Allocations instrument
The Allocations instrument tells you about every object that has been created and how much memory it takes up. When you use an instrument to monitor your application, you are profiling the application. As with the debug gauges, you can profile the application running on the simulator, but you will get more accurate data on a device.
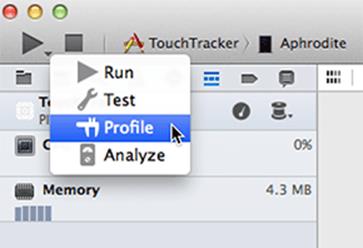
To profile an application, click and hold the Run button in the top left corner of the workspace. In the pop-up menu that appears, select Profile (Figure 14.4).
Figure 14.4 Profiling an application
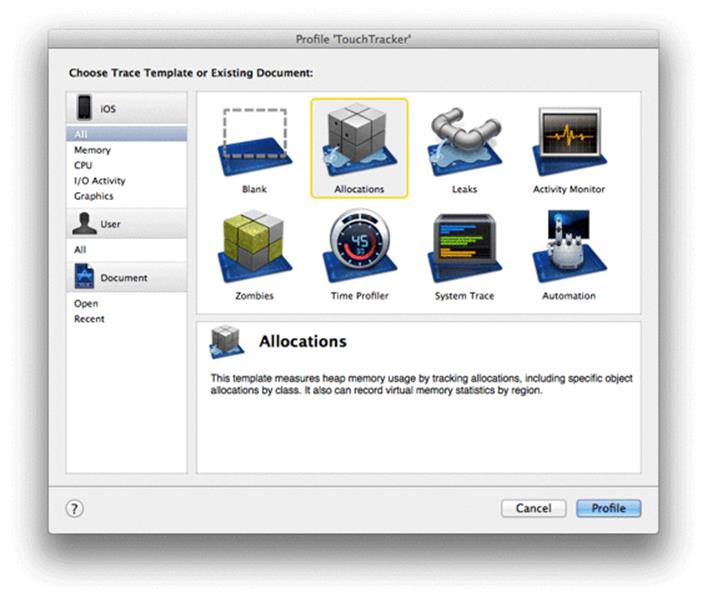
Instruments will launch and ask which instrument template to use. Note that there are more than eight choices; you will see more if you scroll down. Choose Allocations and click Profile (Figure 14.5).
Figure 14.5 Choosing an instrument
TouchTracker will launch, and a window will open in Instruments (Figure 14.6). The interface may be overwhelming at first, but, like Xcode’s workspace window, it will become familiar with time and use. First, make sure you can see everything by turning on all of the areas in the window. In theView control at the top of the window, click all three buttons to reveal the three main areas. The window should look like Figure 14.6.
Figure 14.6 Allocations instrument
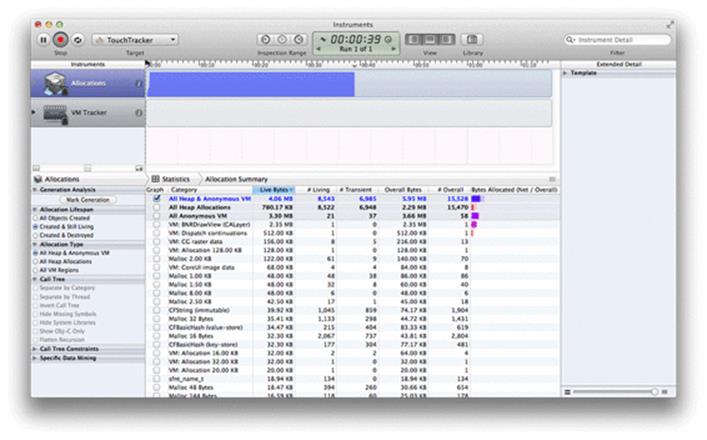
This table shows every memory allocation in the application. There are a lot of objects here, but let’s look at the objects that your code is responsible for creating. First, draw some lines in TouchTracker. Then, type BNRLine in the Instrument Detail search box in the top right corner of the window.
This will filter the list of objects in the Object Summary table so that it only shows instances of BNRLine (Figure 14.7).
Figure 14.7 Allocated lines
![]()
The # Living column shows you how many line objects are currently allocated. Live Bytes shows how much memory these living instances take up. The # Overall column shows you how many lines have been created during the course of the application – even if they have since been deallocated.
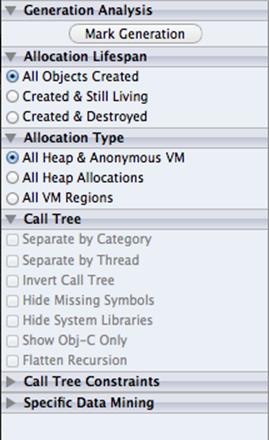
As you would expect, the number of lines living and the number of lines overall are equal at the moment. Now double-tap the screen in TouchTracker and erase your lines. In Instruments, notice that the BNRLine instances disappear from the table. The Allocations instrument is currently set to show only objects that are created and still living. To change this, select All Objects Created from the Allocation Lifespan section of the lefthand panel (Figure 14.8).
Figure 14.8 Allocations options
Let’s see what else the Allocations instrument can tell you about your lines. First, draw a few more lines in TouchTracker. Then, in the table, select the row that says BNRLine. An arrow will appear in the Category column; click that arrow to see more details about these allocations (Figure 14.9).
Figure 14.9 BNRLine summary
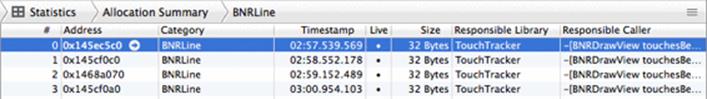
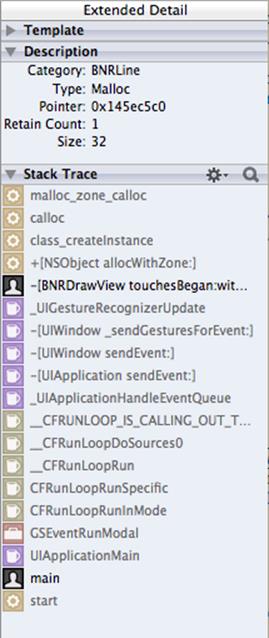
Each row in this table shows a single instance of BNRLine that has been created. Select one of the rows and check out the stack trace that appears in the Extended Detail area on the right side of the Instruments window (Figure 14.10). This stack trace shows you where that instance of BNRLine was created. Grayed-out items in the trace are system library calls. Items in black text are your code. Find the top-most item that is your code (-[BNRDrawView touchesBegan:withEvent:]) and double-click it.
Figure 14.10 Stack trace
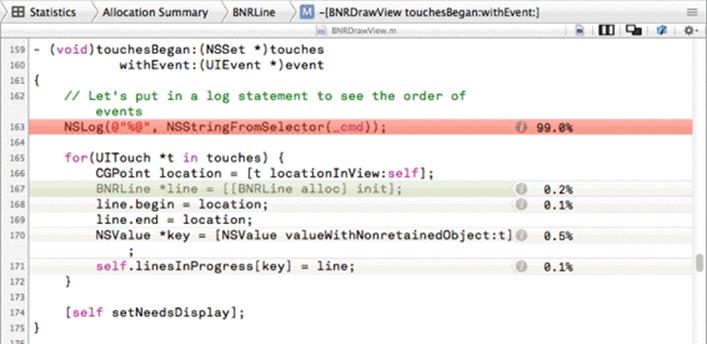
The source code for this implementation will replace the table of BNRLine instances (Figure 14.11). The percentages you see are the amount of memory these method calls allocate compared to the other calls in touchesBegan:withEvent:. For example, the BNRLine instance makes up 0.2 percent of the memory allocated by touchesBegan:withEvent:, whereas the NSLog allocates a considerable amount of memory relative to the creation of the line and the two NSValue objects (the one you create and the copy made by using it as the key in self.linesInProgress).
Figure 14.11 Source code in Instruments
Notice that above the summary area is a breadcrumb navigation bar (Figure 14.12). You can click on an item in this bar to return to a previous set of information.
Figure 14.12 Navigation for summary area
![]()
Click on the BNRLine item in the breadcrumb bar to get back to the list of all BNRLine instances. Click on a single instance and then click the arrow icon on that row. This will show you the history of this object. There are two events: when the BNRLine was created and when it was destroyed. You can select an event row to see the stack trace that resulted in the event in the extended detail area.
Generation analysis
The last item we will examine in the Allocations instrument is Generation Analysis (a.k.a. Heapshot Analysis). First, clear the search box so that you are not filtering results anymore. Then, find the Generation Analysis category on the left side of the Instruments window and click Mark Generation. A category named Generation A will appear in the table. You can click the disclosure button next to this category to see all of the allocations that took place before you marked the generation. Now draw a line in TouchTracker and click Mark Generation again. Another category will appear named Generation B. Click the disclosure button next to Generation B (Figure 14.13).
Figure 14.13 Generation analysis
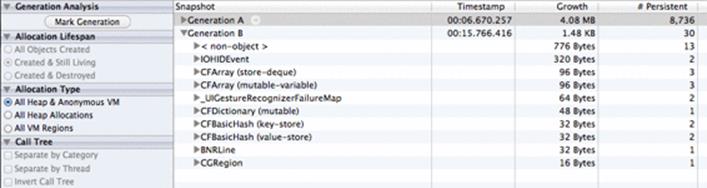
Every allocation that took place after the first generation is in this category. You can see the BNRLine instances that you just created as well as a few objects that were used to handle other code during this time. You can mark as many generations as you like; they are very useful for seeing what objects get allocated for a specific event. Double-tap the screen in TouchTracker to clear the lines and notice that the objects in this generation disappear.
Generation analysis is most useful for identifying trends in memory usage by creating a closed circuit test and repeating it while marking the generation after each iteration. For example, you might draw four lines and then double-tap to dismiss them, and then mark a generation. Draw four more lines, dismiss them, and mark another generation.
In a perfect world, you would see net zero still-alive allocations between the two generations. In reality, there will be lots of small allocations from Apple’s frameworks present. You only need to worry about your own objects. If, for example, you notice that your lines are not deallocating between generations, that represents a problem (memory leak) that you need to fix.
To return to the full object list where you started, select the pop-up button in the breadcrumb bar that currently says Generations and change it to Statistics.
Time Profiler instrument
The Time Profiler instrument provides exhaustive statistics about the CPU utilization of your application. Right now, TouchTracker does not abuse the CPU enough to provide meaningful results.
In BNRDrawView.m, make things more interesting by adding the following CPU cycle-wasting code to the end of your drawRect: method:
float f = 0.0;
for (int i = 0; i < 1000000; i++) {
f = f + sin(sin(sin(time(NULL) + i)));
}
NSLog(@"f = %f", f);
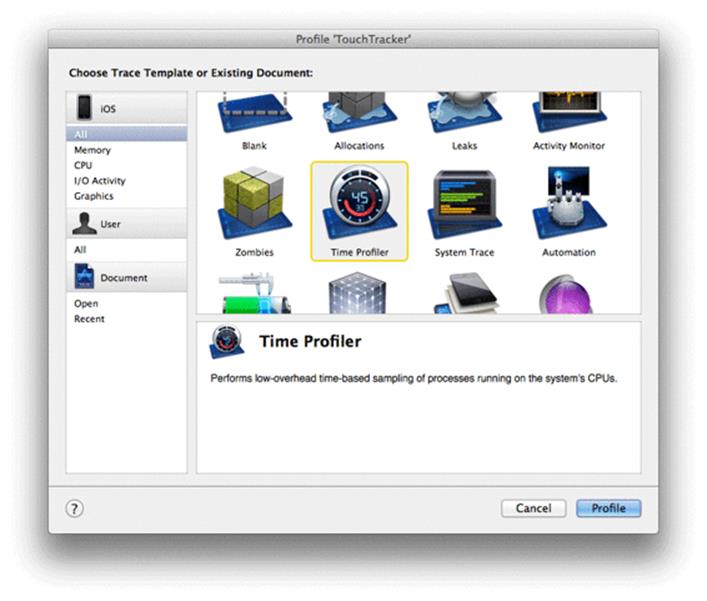
Build and profile the application. When Instruments asks which instrument to use, choose Time Profiler (Figure 14.14). When Instruments launches the application and its window appears, make sure that all three areas are visible by clicking the buttons in the View control to blue.
Figure 14.14 Time Profiler instrument
Touch and hold your finger on the TouchTracker screen. Move your finger around but keep it on the screen. This sends touchesMoved:withEvent: over and over to the BNRDrawView. Each touchesMoved:withEvent: message causes drawRect: to be sent, which in turn causes the silly sin code to run repeatedly.
It looks like not much is happening in this instrument, but that is because you are looking at it from the wrong angle: you only see how much time is spent in each of the threads this application is employing. Click the pause button in the top lefthand corner of Instruments and then, in the lefthand panel, check the box titled Invert Call Tree. Each row in the table is now one function or method call. In the left column, the amount of time spent in that function (expressed in milliseconds and as a percentage of the total run time) is displayed (Figure 14.15). This gives you an idea of where your application is spending its execution time.
Figure 14.15 Time Profiler results
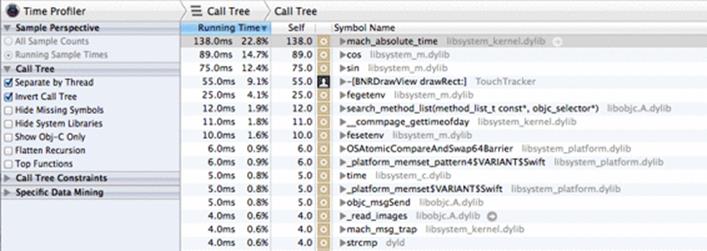
There is no rule that says, “If X percentage of time is spent in this function, your application has a problem.” Instead, use Time Profiler if you notice your application acting sluggish while testing it as a user. For example, you should notice that drawing in TouchTracker is less responsive since you added the wasteful sin code.
You know that when drawing a line, two things are happening: touchesMoved:withEvent: and drawRect: are being sent to the BNRDrawView view. In Time Profiler, you can check to see how much time is spent in these two methods relative to the rest of the application. If an inordinate amount of time is being spent in one of these methods, you know that is where the problem is.
(Keep in mind that some things just take time. Redrawing the entire screen every time the user’s finger moves, as is done in TouchTracker, is an expensive operation. If it was hindering the user experience, you could find a way to reduce the number of times the screen is redrawn. For example, you could redraw only every tenth of a second regardless of how many touch events were sent.)
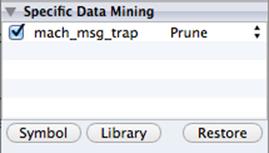
Time Profiler shows you nearly every function and method call in the application. If you want to focus on certain parts of the application’s code, you can prune down its results. For example, sometimes the mach_msg_trap function will be very high on the sample list. This function is where the main thread sits when it is waiting for input. It is not a bad thing to spend time in this function, so you might want to ignore this time when looking at your Time Profiler results.
Use the search box in the top right corner of the Instruments window to find mach_msg_trap(). Then, select it from the table. On the left side of the screen, click the Symbol button under Specific Data Mining. The mach_msg_trap function appears in the table under Specific Data Mining, and the pop-up button next to it displays Charge. Click on Charge and change it to Prune. Then, clear the text from the search box. Now the list is adjusted so that any time spent in mach_msg_trap() is ignored. You can click on Restore while mach_msg_trap() is selected in the Specific Data Mining table to add it back to the total time.
Figure 14.16 Pruning a symbol
Other options for reducing the list of symbols in Time Profiler include showing only Objective-C calls, hiding system libraries, and charging calls to callers. The first two are obvious, but let’s look at charging calls to callers. Select the row that holds mach_absolute_time() (or some method that begins with that name). Then, click the Symbol button. This function disappears from the main table and reappears in the Specific Data Mining table. Notice that it is listed as a Charge. This means that the time spent in this function will be attributed to the function or method that called it.
Back in the main table, notice that mach_absolute_time() has been replaced with the function that calls it, gettimeofday(). If you take the same steps to charge gettimeofday(), it will be replaced with its caller, time(). If you charge time(), it will be replaced with its caller, drawRect:. The drawRect:method will move to near the top of the list; it now is now charged with time(), gettimeofday(), and mach_absolute_time().
Some common function calls always use a lot of CPU time. Most of the time, these are harmless and unavoidable. For example, the objc_msgSend() function is the central dispatch function for any Objective-C message. It occasionally creeps to the top of the list when you are sending lots of messages to objects. Usually, it is nothing to worry about. However, if you are spending more time dispatching messages than actually doing work in the triggered methods and your application is not performing well, you have a problem that needs solving.
As an example, an overzealous Objective-C developer might be tempted to create classes for things like vectors, points, and rectangles. These classes would likely have methods to add, subtract, or multiply instances as well as accessor methods to get and set instance variables. When these classes are used for drawing, the code has to send a lot of messages to do something simple, like creating two vectors and adding them together. The messages add excessive overhead considering the simplicity of the operation. Therefore, the better alternative is to create data types like these as structures and access their memory directly. (This is why CGRect and CGPoint are structures and not Objective-C classes.)
Do not forget to remove the CPU cycle-wasting code in drawRect:!
Leaks instrument
Another useful instrument is Leaks. Although this instrument is less useful now that ARC handles memory management, there is still a possibility of leaking memory with a strong reference cycle. Leaks can help you find strong reference cycles.
First, you need to introduce a strong reference cycle into your application. Pretend that every BNRLine needs to know what array of lines it belongs to. Add a new property to BNRLine.h:
@property (nonatomic, strong) NSMutableArray *containingArray;
In BNRDrawView.m, set every completed line’s containingArray property in touchesEnded:withEvent:.
- (void)touchesEnded:(NSSet *)touches
withEvent:(UIEvent *)event
{
// Remove ending touches from dictionary
for (UITouch *t in touches) {
NSValue *key = [NSValue valueWithNonretainedObject:t];
BNRLine *line = self.linesInProgress[key];
[self.finishedLines addObject:line];
[self.linesInProgress removeObjectForKey:key];
line.containingArray = self.finishedLines;
}
// Redraw
[self setNeedsDisplay];
}
Finally, in doubleTap: of BNRDrawView.m, comment out the code that removes all of the objects from self.finishedLines and create a new instance of NSMutableArray instead.
- (void)doubleTap:(UIGestureRecognizer *)gr
{
NSLog(@"Recognized Double Tap");
[self.linesInProgress removeAllObjects];
// [self.finishedLines removeAllObjects];
self.finishedLines = [[NSMutableArray alloc] init];
[self setNeedsDisplay];
}
Build and profile the application. Choose Leaks as the instrument to use.
Draw a few lines and then double-tap the screen to clear it. Select the Leaks instrument from the top left table and wait a few seconds. Three items will appear in the summary table: an NSMutableArray, a few BNRLine instances, and a Malloc 16 Bytes block. This memory has been leaked.
Select the Leaks pop-up button in the breadcrumb bar and change it to Cycles & Roots (Figure 14.17). This view gives you a lovely graphical representation of the strong reference cycle: an NSMutableArray (your self.finishedLines array) has a reference to a list of BNRLine objects, and each BNRLinehas a reference back to its containingArray.
Figure 14.17 Cycles and roots
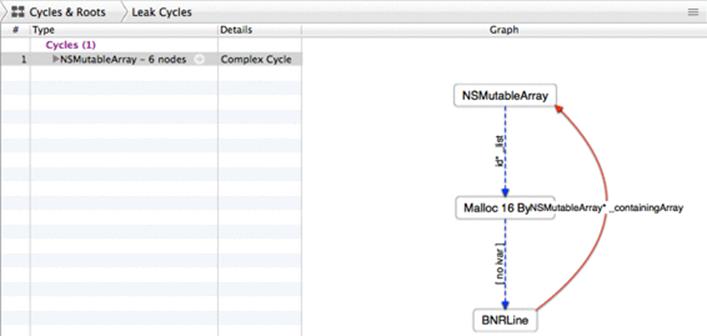
You can of course fix this problem by making the containingArray property a weak reference. Or just remove the property and undo your changes to touchesEnded:withEvent and doubleTap:.
This should give you a good start with the Instruments application. The more you play with it, the more adept at using it you will become. One final word of warning before you invest a significant amount of your development time using Instruments: If there is no performance problem, do not fret over every little row in Instruments. It is a tool for diagnosing existing problems, not for finding new ones. Write clean code that works first; then, if there is a problem, you can find and fix it with the help of Instruments.
Static Analyzer
Instruments can be helpful when tracking down a problem in a running application. You can also ask Xcode to analyze your code without running it. The static analyzer is a tool that can make educated guesses about what would happen if your code were to be executed and inform you of potential problems.
When the static analyzer checks the code, it examines each function and method individually by iterating over every possible code path. A method can have a number of control statements (if, for, switch, etc.). The conditions of these statements will dictate which code is actually executed. A code path is one of the possible paths the code will take given these control statements. For example, a method that has a single if statement has two code paths: one if the condition fails and one if the condition succeeds.
Right now, TouchTracker does not have any code that offends the static analyzer. Add some: In BNRDrawView.m, implement the following method:
- (int)numberOfLines
{
int count;
// Check that they are non-nil before we add their counts...
if (self.linesInProgress && self.finishedLines)
count = [self.linesInProgress count] + [self.finishedLines count];
return count;
}
To run the static analyzer, click and hold the Run button (like you did when you profiled your application). This time, choose Analyze. Alternatively, you can use the keyboard shortcut Command-Shift-B.
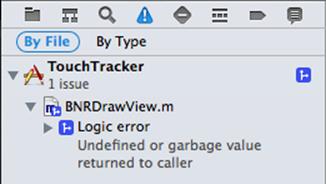
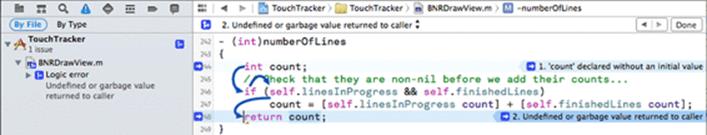
Analysis results appear in the issue navigator (Figure 14.18). You will see one Logic error in your code at the return point of numberOfLines. The analyzer believes there is a code path that will result in an undefined or garbage value being returned to the caller. In English, that means it is possible that the variable count will not be given a value before it is returned from numberOfLines.
Figure 14.18 Analyzer results
The analyzer can show you how it came to this conclusion. Click the disclosure button next to the analyzer result to reveal the detailed information underneath it. Click the item underneath the disclosure button. In the editor area, curvy blue lines will appear inside the numberOfLines method (Figure 14.19). (If you do not see line numbers in the gutter, you can turn them on by selecting Preferences from the Xcode menu. Choose the Text Editing tab and click the checkbox Show Line Numbers.)
Figure 14.19 Expanded analysis
The code path shown by the analyzer lines is as follows:
1. The variable count is created and not initialized.
2. The if statement fails, so count does not get a value.
3. The variable count is returned without being assigned a value.
You can fix this issue by initializing count to zero.
{
int count;
int count = 0;
// Check that they are non-nil before we add their counts...
if (self.linesInProgress && self.finishedLines)
count = [self.linesInProgress count] + [self.finishedLines count];
return count;
}
Analyze this code again, and no issues will be reported now that count is always initialized with a value.
When you analyze your code (which smart programmers do on a regular basis), you will see issues other than the one described here. Many times, we see novice programmers shy away from analyzer issues because of the technical language. Do not do this. Take the time to expand the analysis and understand what the analyzer is trying to tell you. It will be worth it for the development of your application and for your development as a programmer.
Projects, Targets, and Build Settings
A Xcode project is a file that contains a list of references to other files (source code, resources, frameworks, and libraries) as well as a number of settings that lay out the rules for items within the project. Projects end in .xcodeproj, as in TouchTracker.xcodeproj.
A project always has at least one target. When you build and run, you build and run the target, not the project. A target uses the files in the project to build a particular product. The product that the target builds is typically an application, although it can be a compiled library or a unit test bundle.
When you create a new project and choose a template, Xcode automatically creates a target for you. When you created the TouchTracker project, you selected an iOS application template, so Xcode created an iOS application target and named it TouchTracker.
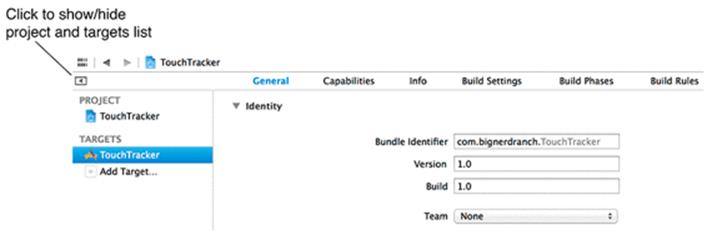
To see this target, select the TouchTracker item at the very top of the project navigator’s list. In the editor area just to the right of this item, find a toggle button (Figure 14.20). Click this button to show the project and targets list for TouchTracker.
Figure 14.20 TouchTracker project and targets list
Every target includes build settings that describe how the compiler and linker should build your application. Every project also has build settings that serve as defaults for the targets within the project.
Let’s look at the project build settings for TouchTracker first. In the project and targets list, select the TouchTracker project. Then click the Build Settings tab at the top of the editor area (Figure 14.21).
Figure 14.21 TouchTracker project build settings
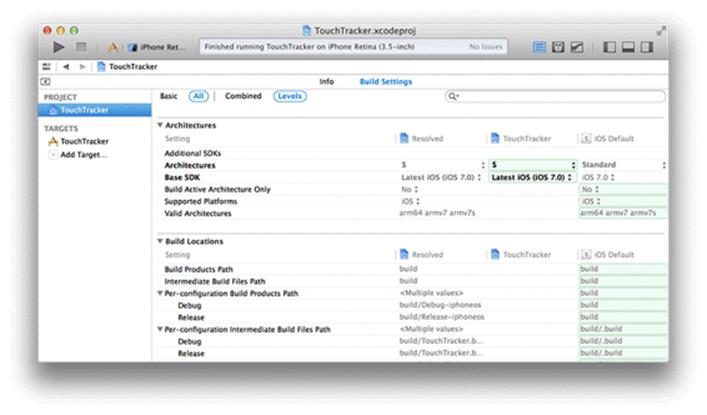
These are the project-level build settings – the default values that targets inherit. In the top-right corner is a search box that you can use to search for a specific setting. Start typing “Base SDK” in the box, and the list will adjust to show this setting. (The Base SDK setting specifies the version of the iOS SDK that should be used to build your application. It should always be set to the latest version.)
Now let’s look at the target’s build settings. In project and targets list, select the TouchTracker target and then the Build Settings tab. These are the build settings for this specific target. Above the list of settings, find and click the Levels option (Figure 14.22).
Figure 14.22 TouchTracker target build settings
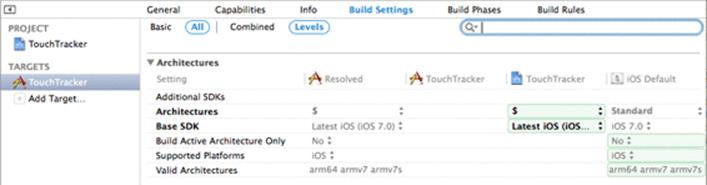
When viewing the build settings with this option, you can see each setting’s value at the three different levels: OS, project, and target. The far right column shows the iOS Default settings; these serve as the project’s defaults, which it can override. The previous column shows the project’s settings, and the one before that shows the currently selected target’s settings. The Resolved column shows which setting will actually be used; it is always equal to the left-most specified value. You can click in each column to set the value for that level.
While you are here, search for “static analyzer” in the build settings list. You can set the Analyze During 'Build' setting to Yes for Xcode to automatically run the static analyzer every time you build your application. This will slightly increase the amount of time that it takes to build, but is generally a good idea.
Build configurations
Each target and project has multiple build configurations. A build configuration is a set of build settings. When you create a project, there are two build configurations: debug and release. The build settings for the debug configuration make it easier to debug your application, while the release settings turn on optimizations to speed up execution.
To see the build settings and configurations for TouchTracker, select the project from the project navigator and the TouchTracker project. Then, select the Info tab (Figure 14.23).
Figure 14.23 Build configurations list
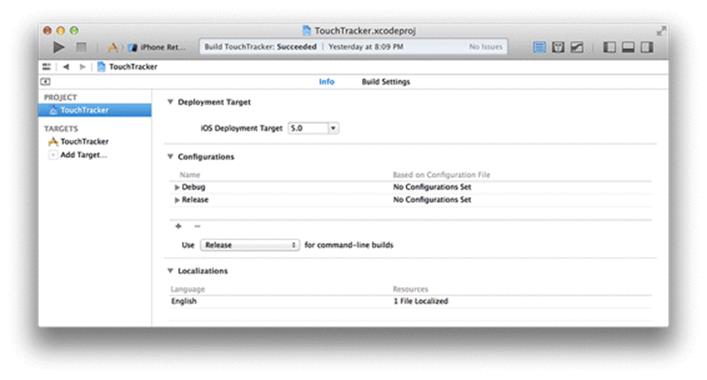
The Configurations section shows you the available build configurations in the project and targets. You can add and remove build configurations with the buttons at the bottom of this section.
When performing a scheme action, the scheme will use one of these configurations when building its targets. You can specify the build configuration that the scheme uses in the scheme editor in the option for Build Configuration in the Info tab.
Changing a build setting
Enough talk – time to do something useful. You are going to change the value of the target build setting Preprocessor Macros. Preprocessor macros allow you to compile code conditionally. They are either defined or not defined at the start of a build. If you wrap a block of code in a preprocessor directive, it will only be compiled if that macro has been defined. The Preprocessor Macros setting lists preprocessor macros that are defined when a certain build configuration is used by a scheme to build a target.
In the project and targets list, select the TouchTracker target and the Build Settings tab. Then search for the Preprocessor Macros build setting. Double-click on the value column for the Debug configuration under Preprocessor Macros. In the table that appears, add a new item: VIEW_DEBUG, as shown inFigure 14.24.
Figure 14.24 Changing a build setting
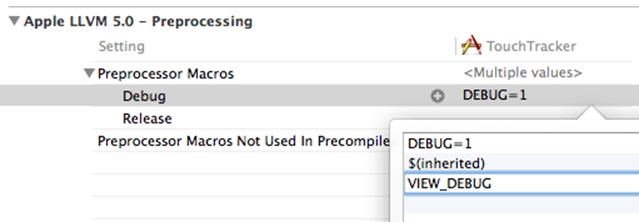
Adding this value to this setting says, “When you are building the TouchTracker target with the debug configuration, a preprocessor macro VIEW_DEBUG is defined.”
Let’s add some debugging code to TouchTracker that will only be compiled when the target is built with the debug configuration. UIView has a private method recursiveDescription that prints out the entire view hierarchy of an application. However, you cannot call this method in an application that you deploy to the App Store, so you will only allow it to be called if VIEW_DEBUG is defined.
In BNRAppDelegate.m, add the following code to application:didFinishLaunchingWithOptions:.
[self.window makeKeyAndVisible];
#ifdef VIEW_DEBUG
NSLog(@"%@", [self.window performSelector:@selector(recursiveDescription)]);
#endif
return YES;
}
This code will send the message recursiveDescription to the window. (Notice the use of performSelector:. recursiveDescription is a private method, so you have to dispatch it in this way.) recursiveDescription will print a view’s description, then all of its subviews, and its subviews’ subviews and so on. You can leave this code in for all builds. Because the preprocessor macro will not be defined for a release build, the code will not be compiled when you build for the App Store.
Now build and run the application. Check out the console and you will see the view hierarchy of your application, starting at the window.