iOS 7 Programming Fundamentals: Objective-C, Xcode, and Cocoa Basics (2014)
Part II. IDE
Chapter 9. Life Cycle of a Project
This chapter surveys some of the main stages in the life cycle of an Xcode project, from inception to submission at the App Store. This survey will provide an opportunity to discuss some additional features of the Xcode development environment. You already know how to create a project, define a class, and link to a framework (Chapter 6), as well as how to create and edit a nib (Chapter 7) and how to use the documentation (Chapter 8).
Device Architecture and Conditional Code
As you create a project (File → New → Project), after you pick a project template, in the screen where you name your project, the Devices pop-up menu offers a choice of iPad, iPhone, or Universal. You can change this setting later (using the Devices pop-up menu in the General tab when you edit the app target), but your life will be simpler if you decide correctly here, at the outset, because it affects the details of the template on which your new project will be based.
The iPhone and iPad differ in their physical characteristics as well as their programming interfaces. The iPad has a larger screen size, along with some built-in interface features that don’t exist on the iPhone, such as split views and popovers. A universal app runs on both iPhone and iPad natively, typically with a different interface on each type of device.
Your choice in the Devices pop-up menu also affects your project’s Targeted Device Family build setting:
iPad
The app will run only on an iPad.
iPhone
The app will run on an iPhone or iPod touch; it can also run on an iPad, but not as a native iPad app (it runs in a reduced enlargeable window, which I call the iPhone Emulator; Apple sometimes refers to this as “compatibility mode”).
iPhone/iPad
The app will run natively on both kinds of device, and should be structured as a universal app.
NOTE
If you’re updating an older app for iOS 7, and if you want it to run natively on a 64-bit device, change the Architectures build setting for your app target to “Standard architectures (including 64-bit).”
Two additional project-level build settings determine what systems your device will run on:
Base SDK
The latest system your app can run on. As of this writing, in Xcode 5.0, you have just two choices, iOS 7.0 and Latest iOS (iOS 7.0). They sound the same, but the latter is better (and is the default for a new project). If you update Xcode to develop for a subsequent system, any existing projects that are already set to Latest iOS will use that newer system’s most recent SDK as their Base SDK automatically, without your also having to update their Base SDK setting.
iOS Deployment Target
The earliest system your app can run on: in Xcode 5.0, this can be any major iOS system all the way back to 4.3. To change the project’s iOS Deployment Target setting easily, edit the project and switch to the Info tab, and choose from the iOS Deployment Target pop-up menu. (To change the target’s iOS Deployment Target setting easily, edit the target and switch to the General tab, and choose from the Deployment Target pop-up menu; usually, however, you’ll change this setting at project level and let the target adopt the project’s setting automatically.)
Writing an app whose Deployment Target differs from its Base SDK is something of a challenge. There are two chief problems:
Unsupported features
With each new system, Apple adds new features. Xcode will happily allow you to compile using any features of the Base SDK, even if they don’t exist on the Deployment Target system; but your app will crash if execution encounters features not supported by the system on which it is actually running. Thus, if you were to set the project’s Deployment Target to iOS 6, your project would compile and your app would run on iOS 6 even if it contained iOS 7–only features, but your app would crash on iOS 6 if any of those features were actually encountered.
Changed behavior
With each new system, Apple permits itself to change the way some features work. The result is that such features work differently on different systems. In some cases, the very same method may do two quite different things, depending on what system the app runs on. In other cases, an area of functionality may be handled differently on different systems, requiring you to implement or call a different set of methods.
Thus, backwards compatibility will probably require that you write conditional code — that is, code such that one set of code executes when running on one system, another when running on another. But it isn’t merely a matter of code. A project can contain other resources, such as a nib file, that might not be compatible with earlier systems. (For example, a nib file that uses autolayout will crash when it is loaded on iOS 5.1 or earlier, because autolayout uses the NSLayoutConstraint class, which didn’t exist back then.)
Even if you’re not attempting backwards compatibility, you still might need to grapple with the problem of conditional code — if you want to write a universal app. Although you’ll probably want to reduce duplication by sharing code between the iPhone and the iPad version of the app, nevertheless some code will likely have to be kept separate, because your app will need to behave differently on the different types of device. As I already mentioned, you can’t summon a popover on an iPhone; and the complexities can run considerably deeper, because the overall interfaces might be quite different, and might behave very differently — tapping a table cell on the iPhone might summon an entire new screenful of stuff, whereas on the larger iPad, it might only alter what appears in one region of the screen.
Various programming devices help govern dynamically what code is encountered, based on what system or device type the app is running on; thus you can steer your code away from a crash or from undesirable behavior based on the runtime environment:
Explicit environment test
The UIDevice class lets you query the current device (currentDevice) to learn its system version (systemVersion) and type (userInterfaceIdiom).
For an actual example, make a Universal project from the Master–Detail Application template and look in AppDelegate.m. You’ll see code in application:didFinishLaunchingWithOptions: that configures the initial interface differently depending on the device type we’re running on.
Info.plist key name suffix
Info.plist settings can be made to apply only to one device type or the other, by adding ~iphone or ~ipad to the name of the key. If the suffix is present, this setting overrides the general setting (without any suffix) on the appropriate device.
A Universal project based on the Master–Detail Application template is a case in point. You’ll see that the Info.plist contains two sets of “Supported interface orientations” settings, a general set (UISupportedInterfaceOrientations) and an iPad-only set that overrides the general case when the app launches on an iPad (UISupportedInterfaceOrientations~ipad).
Similarly, a Universal project based on the Master-Detail Application template contains two storyboards, one supplying the interface for running on an iPhone, the other for an iPad. The choice between them is made through the Info.plist setting “Main storyboard file base name”, which appears twice, once for the general case (UIMainStoryboardFile) and once for iPad only (UIMainStoryboardFile~ipad), the latter overriding the former when the app launches on an iPad.
Resource name suffix
Many calls that load resources by name from your app’s bundle will use the same name-and-suffix rules as for Info.plist keys, automatically selecting an alternative resource whose name (before the extension) ends with ~iphone or ~ipad as appropriate to the device type, if there is such an alternative resource. For example, UIImage’s imageNamed: method, if you specify the image name as @"linen.png", will load an image called linen~ipad.png if it finds one and if we’re running on an iPad.
(New in Xcode 5, however, if the image lives in an asset catalog, you won’t have to worry about this naming convention: the image’s use is determined by its place in the catalog. Select an image set in the catalog and choose Device Specific from the Devices pop-up menu in the Attributes inspector to create distinct slots for iPhone and iPad versions of an image. This is one reason among many for using asset catalogs!)
Weak-linked frameworks
If your app is linked to a framework and tries to run on a system that lacks that framework, it will crash at launch time. The solution is to link to that framework optionally, by changing the Required pop-up menu item in its listing in the target’s Linked Frameworks and Libraries build phase to Optional; this is technically referred to as weak-linking the framework.
(This technique works even if you’re using the new Xcode 5 modules feature — see Chapter 6 — but you’ll have to link explicitly to any frameworks you want to weak-link, to make them appear in the Linked Frameworks and Libraries list; there’s no way to specify weak autolinking.)
Method testing
You can test for the existence of a method using respondsToSelector: and related NSObject calls:
if ([UIButton respondsToSelector: @selector(appearance)]) {
// ok to call appearance class method
} else {
// don't call appearance class method
}
Class testing
You can test for the existence of a class using the NSClassFromString function, which yields nil if the class doesn’t exist. Also, if the Base SDK is 5.0 or later, and if the class’s framework is present or weak-linked, you can send the class any message (such as class) and test the result for nil; this works because classes are themselves weak-linked starting in iOS 5:
// assume Core Image framework is weak-linked
if ([CIFilter class]) { // ok to do things with CIFilter
Constant and function testing
You can test for the existence of a constant name, including the name of a C function, by taking the name’s address and testing against zero. For example:
if (&UIApplicationWillEnterForegroundNotification) {
// OK to refer to UIApplicationWillEnterForegroundNotification
ADDITIONAL SIMULATOR SDKS
When the Deployment Target is set to a system earlier than 7.0, earlier Simulator SDK versions may become available as destinations in the Scheme pop-up menu, depending on the contents of Xcode.app/Contents/Developer/Platforms/iPhoneSimulator.platform/Developer/SDKs/. Xcode 5 includes only the iOS 7.0 Simulator SDK, but you can download and install the iOS 6.1/6.0 and iOS 5.1/5.0 Simulator SDKs using the Downloads preference pane (under Components).
Version Control
Sooner rather than later in the life of any real app, you should consider putting your project under version control. Version control is a way of taking periodic snapshots (technically called commits) of your project. Its purpose might be:
Security
Version control can help you store your commits in a repository offsite, so that your code isn’t lost in case of a local computer glitch or some equivalent “hit by a bus” scenario.
Collaboration
Version control allows multiple developers ready and rational access to the same code.
Freedom from fear
A project is a complicated thing; often, changes must be made experimentally, sometimes in many files, possibly over a period of many days, before a new feature can be tested. Version control means that I can easily retrace my steps (to some previous commit) if things go badly; this gives me confidence to start down some tentative programmatic road whose outcome may not be apparent until much later. Also, if I’m confused about what programmatic road I seem to be taking, I can ask a version control system to list the changes I’ve made recently. If an ancillary bug is introduced, I can use version control to pinpoint when it happened and help discover the cause.
Xcode provides various version control facilities, which are geared chiefly to git (http://git-scm.com) and Subversion (http://subversion.apache.org, also called svn). This doesn’t mean you can’t use any other version control system with your projects! It means only that you can’t use any other version control system in an integrated fashion from inside Xcode. That’s no disaster; there are many other ways to use version control, and even with git and Subversion, it is perfectly possible to ignore Xcode’s integrated version control and rely on the command line in Terminal, or use a specialized third-party GUI front end such as svnX for Subversion (http://www.lachoseinteractive.net/en/products) or SourceTree for git (http://www.sourcetreeapp.com).
If you don’t want to use Xcode’s integrated version control, you can turn it off more or less completely. If you uncheck Enable Source Control in the Source Control preference pane, the only thing you’ll be able to do is choose Check Out from the Source Control menu, to fetch code from a remote server. If you check Enable Source Control, three additional checkboxes let you select which automatic behaviors you want. Personally, I like to check Enable Source Control along with “Refresh local status automatically”, so that Xcode displays a file’s status in the Project navigator; I leave the two additional checkboxes unchecked, because I’m a manual control kind of person. (The ability to uncheck “Add and remove files automatically” in Xcode 5 is particularly welcome; Xcode 4’s habit of adding files to the git index the moment I added them to the project was an annoyance.)
When you create a new project, the Save dialog includes a checkbox that offers to place a git repository into your project folder from the outset. This can be purely local to your computer, or you can choose a remote server. If you have no reason to decide otherwise, I suggest that you check that checkbox!
When you open an existing project, if that project is already managed with Subversion or git, Xcode detects this and is ready instantly to display version control information in its interface. If a remote repository is involved, Xcode automatically enters information for it in the Accounts preference pane, which in Xcode 5 is the unified interface for repository management. To use a remote server without having a working copy checked out from it, enter its information manually in the Accounts preference pane.
If you’ve checked “Refresh local status automatically”, files in the Project navigator are marked with their status. For example, if you’re using git, you can distinguish modified files (M), new untracked files (?), and new files added to the index (A).
Actual source control actions are available in two places: the Source Control menu (newly promoted to top level in Xcode 5), and the contextual menu in the Project navigator. To check out and open a project stored on a remote server, choose Source Control → Check Out. Other items in the Source Control menu are obvious, such as Commit, Push, Pull (or Update), Refresh Status, and Discard Changes. Note particularly the first item in the Source Control menu (new in Xcode 5), which lists all open working copies by name and branch; its hierarchical menu items let you perform branch management.
When you choose Source Control → Commit, you’re shown a comparison view of all changes in all changed files. Each change can be excluded from this commit (or reverted entirely), so it’s possible to group related file hunks into meaningful commits. A similar comparison view is available for any commit by choosing Source Control → History. (But Xcode still has nothing like the visual branch representation of git’s own gitk tool.) Merge conflicts are also presented in a useful graphical comparison interface.
You can also see a comparison view for the file being currently edited, at any time, through the Version editor; choose View → Version Editor → Show Version Editor, or click the third Editor button in the project window toolbar. The Version editor actually has three modes: Comparison view, Blame view, and Log view (choose from View → Version Editor, or use the pop-up menu from the third Editor button in the toolbar when the Version editor is showing).
For example, in Figure 9-1, I can see that in the more recent version of this file (on the left) I’ve stopped using an explicit NSStringDrawingContext as the context: argument and have used nil instead. If I choose Editor → Copy Source Changes, the corresponding diff text is placed on the clipboard. If I switch to Blame view I can see my own commit message: “eliminated NSStringDrawingContext”. The jump bar at the bottom of the Version editor permits me to view any commit’s version of the current file in the editor.
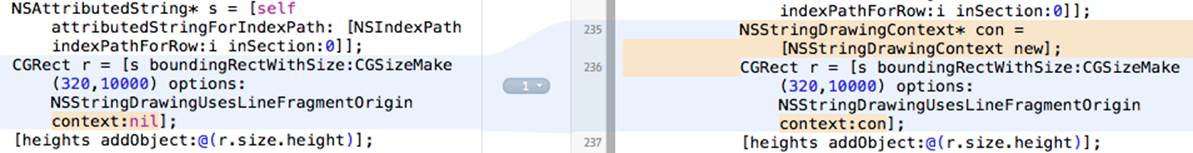
Figure 9-1. Version comparison
Another way to learn how a line was changed, new in Xcode 5, is to select within that line (in the normal editor) and choose Editor → Show Blame For Line. A popover appears, describing the commit where this line changed to its current form; using buttons in that popover, you can see a version comparison for that commit, or switch to Blame view or Comparison view.
Xcode also contains its own way of taking and storing a snapshot of your project as a whole; this is done using File → Create Snapshot (and, according to your settings, some mass operations such as find-and-replace or refactoring may offer to take a snapshot first). Although these snapshots are not to be treated as full-fledged version control, they are in fact maintained as git repositories, and can certainly serve the purpose of giving confidence in advance of performing some change that might subsequently engender regret. Snapshots themselves are managed in the Projects tab of the Organizer window; here you can export a snapshot, thus resurrecting an earlier state of your project folder.
Editing Your Code
Many aspects of Xcode’s editing environment can be modified to suit your tastes. Your first step should be to pick a Source Editor font face and size you like in Xcode’s Fonts & Colors preference pane. Nothing is so important as being able to read and write code comfortably! I like a largish size (13, 14 or even 16) and a pleasant monospaced font such as Monaco, Menlo, or Consolas (or the freeware Inconsolata).
Xcode has some formatting, autotyping, and text selection features adapted for Objective-C. Exactly how these behave depends upon your settings in the Editing and Indentation tabs of Xcode’s Text Editing preference pane. I’m not going to describe these settings in detail, but I urge you to take advantage of them. Under Editing, I like to check just about everything, including Line Numbers; visible line numbers are useful when debugging. Under Indentation, I like to have just about everything checked too; I find the way Xcode lays out Objective-C code to be excellent with these settings.
If you like Xcode’s smart syntax-aware indenting, but you find that once in a while a line of code isn’t indenting itself correctly, try choosing Editor → Structure → Re-Indent (Control-I), which autoindents the current line. (Autoindent problems can also be caused by incorrect syntax earlier in the file, so hunt for that too.)
Under Editing, notice “Automatically balance brackets in Objective-C method calls.” If this option is checked, then when you type a closing square bracket after some text, Xcode intelligently inserts the opening square bracket before the text. I like this feature, as it allows me to type nested square brackets without planning ahead. For example, I type this:
UIAlertView* av = [UIAlertView alloc
I now type the right square bracket twice. The first right square bracket closes the open left square bracket (which highlights to indicate this). The second right square bracket also inserts a space before itself, plus the missing left square bracket, and the insertion point is positioned before the second right square bracket, ready for me to type init:
UIAlertView* av = [[UIAlertView alloc] ]
// insertion point is here: ^
With “Enable type-over completions” checked, Xcode goes even further. As I start to type that same line of code:
UIAlertView* av = [U
Xcode automatically appends the closing right square bracket, with the insertion point still positioned before it:
UIAlertView* av = [U]
That closing right square bracket, however, is tentative; it’s in gray. Now I finish typing the first nested method call; the right square bracket is still gray:
UIAlertView* av = [UIAlertView alloc]
// I have typed up to this c: ^
I can now confirm the closing right square bracket in any of several ways. I can actually type a right square bracket; or I can type Tab or Right arrow. The tentative right square bracket is replaced by a real right square bracket, and the insertion point is now positioned after it, ready for me to continue typing.
Autocompletion
As you write code, you’ll take advantage of Xcode’s autocompletion feature. Objective-C is a verbose language, and whatever reduces your time and effort typing will be a relief. However, I personally do not check “Suggest completions while typing” under Editing; instead, I check “Use Escape key to show completion suggestions”, and when I want autocompletion to happen, I ask for it manually, by pressing Esc.
For example, suppose my code is as displayed in the previous example, with the insertion point before the second right square bracket. I now type init and then press Esc, and a little menu pops up, listing the four init methods appropriate to a UIAlertView (Figure 9-2). You can navigate this menu, dismiss it, or accept the selection, using only the keyboard. So, if it were not already selected by default, I would navigate to initWithTitle:... with the Down arrow key, and press Return to accept the selected choice.
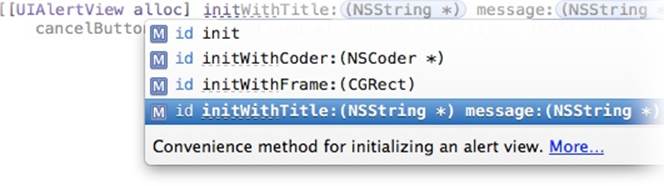
Figure 9-2. The autocompletion menu
Alternatively, I might press Control-Period instead of Esc. Pressing Control-Period repeatedly cycles through the alternatives. Again, press Return to accept the selected choice. Another possibility is to press Tab, which performs a partial completion without dismissing the autocompletion menu; in Figure 9-2, if I were to press Tab at this moment, initWith would be completed in my code — that’s what the dashed underlines are telling me — and bare init, no longer an eligible completion, would be eliminated from the menu.
Observe also that there is a reduced form of Quick Help at the bottom of the autocompletion menu; click the More link to view (in the documentation window) the full documentation for the currently selected method (Chapter 8). If the selected method is defined in your code, and you’ve used doxygen to document that method in a comment as I described in Chapter 8, what appears here is the \brief description if there is one, and the full description otherwise; for this reason, it’s good to define a \brief description, to keep the code completion window compact.
When I choose an alternative from the autocompletion menu, the template for the method call is entered in my code (I’ve broken it into multiple lines here):
[[UIAlertView alloc] initWithTitle:<#(NSString *)#>
message:<#(NSString *)#>
delegate:<#(id)#>
cancelButtonTitle:<#(NSString *)#>
otherButtonTitles:<#(NSString *), ...#>, nil]
The expressions in <#...#> are placeholders, showing the type of each parameter; you can select the next placeholder with Tab (if the insertion point precedes a placeholder) or by choosing Navigate → Jump to Next Placeholder (Control-/). Thus I can select a placeholder and type in its place the actual argument I wish to pass, select the next placeholder and type that argument, and so forth.
NOTE
Placeholders are delimited by <#...#> behind the scenes, but they appear in Xcode as “text tokens” to prevent them from being edited accidentally. To convert a placeholder to a normal string without the delimiters, select it and press Return, or double-click it.
Autocompletion also works for method declarations. You don’t have to know or enter a method’s return type beforehand. Just type the initial - or + (to indicate an instance method or a class method) followed by the first few letters of the method’s name. For example, in my app delegate I might type:
- appli
If I then press Esc, I see a list of methods such as application:didChangeStatusBarFrame:; these are methods that might be sent to my app delegate (by virtue of its being the app delegate, as discussed in Chapter 11). When I choose one, the declaration is filled in for me, including the return type and the parameter names:
- (void)application:(UIApplication *)application
didChangeStatusBarFrame:(CGRect)oldStatusBarFrame
At this point I’m ready to type the left curly brace, followed by a Return character; this causes the matching right curly brace to appear, with the insertion point positioned between them, ready for me to start typing the body of this method.
Snippets
Code autocompletion is supplemented by code snippets. A code snippet is a bit of text with an abbreviation. Code snippets are kept in the Code Snippet library (Command-Option-Control-2), but a code snippet’s abbreviation is globally available, so you can use it without showing the library. You type the abbreviation and the snippet’s name is included among the possible completions.
For example, to enter an if block, I would type if and press Esc, to get autocompletion, and select “If Statement”. When I press Return, the if block appears in my code, and the condition area (between the parentheses) and statements area (between the curly braces) are placeholders.
To learn a snippet’s abbreviation, you must open its editing window — double-click the snippet in the Code Snippet library — and click Edit. If learning a snippet’s abbreviation is too much trouble, simply drag it from the Code Snippet library into your text.
You can add your own snippets, which will be categorized as User snippets; the easiest way is to drag text into the Code Snippet library. Edit to suit your taste, providing a name, a description, and an abbreviation; use the <#...#> construct to form any desired placeholders.
Fix-it and Live Syntax Checking
Xcode’s extremely cool Fix-it feature can actually make and implement positive suggestions on how to avert a problem. To summon it, click on an issue badge in the gutter. Such an issue badge will appear after compilation if there’s a problem.
For instance, in Figure 9-3 I’ve omitted the @ before an Objective-C NSString literal, and the compiler is complaining (because what I’ve typed is a C string literal, a very different thing). By clicking on the warning badge in the gutter, I’ve summoned a little dialog that not only describes the mistake but tells me how to fix it. Not only that: it has tentatively (in grey) implemented that solution; it has inserted the missing @ into my code. Not only that: if I press Return, or double-click the “Fix-it” button in the dialog, Xcode really inserts the missing @ into my code — and the warning vanishes, because the problem is solved. If I’m confident that Xcode will do the right thing, I can choose Editor → Fix All in Scope (Command-Option-Control-F), and Xcode will implement all nearby Fix-it suggestions without my even having to show the dialog.
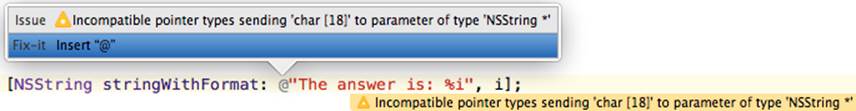
Figure 9-3. A warning with a Fix-it suggestion
Live syntax checking is like a form of constant compilation. Even if you don’t compile or even save, live syntax checking can detect the presence of a problem, and can suggest the solution with Fix-it. This feature can be toggled on or off using the “Show live issues” checkbox in the General preference pane. Personally, I keep it turned off, as I find it intrusive. My code is almost never valid while I’m typing, because the terms and parentheses are always half-finished; that’s what it means to be typing. For example, merely typing a left parenthesis will instantly cause the syntax checker to complain of a parse error (until I type the corresponding right parenthesis).
Navigating Your Code
Developing an Xcode project involves editing code in many files at once. Fortunately, Xcode provides numerous ways to navigate your code, many of which have been mentioned in previous chapters.
Here are some of Xcode’s chief forms of navigation:
The Project navigator
If you know something about the name of a file, you can find it quickly in the Project navigator (Command-1) by typing into the search field in the filter bar at the bottom of the navigator (Edit → Filter → Filter in Navigator, Command-Option-J). For example, type story to see just your.storyboard files. Moreover, after using the filter bar, you can press Tab and then the Up or Down arrow key to navigate the Project navigator; thus you can reach the desired file with the keyboard alone.
The Symbol navigator
If you highlight the first two icons in the filter bar (the first two are blue, the third is dark), the Symbol navigator lists your project’s classes and their methods. Now you can navigate to a desired method. As with the Project navigator, the filter bar’s search field can help get you where you want to go.
The jump bar
Every path component of the code editor’s jump bar is a menu:
The bottom level
At the bottom level (farthest right) in the jump bar is a list of your file’s method and function declarations and definitions, in the order in which they appear (hold Command while choosing the menu to see them in alphabetical order); choose one to navigate to it.
You can inject bold section titles into this bottom-level menu using the #pragma mark directive. For example, try modifying ViewController.m in our Empty Window project:
#pragma mark - View lifecycle
- (void)viewDidLoad
{
[super viewDidLoad];
// Do any additional setup after loading the view...
}
The result is that the “viewDidLoad” item in the bottom-level menu falls within a “View lifecycle” section.
To make a section divider line in the menu, type a #pragma mark directive whose value is a hyphen; in the preceding example, both a hyphen (to make a section divider line) and a title (to make a bold section title) are used. Similarly, comments outside of any method and starting with TODO:, FIXME:, ???:, or !!!: will appear in the bottom-level menu.
Higher levels
Higher-level path components are hierarchical menus; thus you can use any of them to work your way down the file hierarchy.
History
Each editor pane remembers the names of files you’ve edited in it. The Back and Forward triangles are both buttons and pop-up menus (or choose Navigate → Go Back and Navigate → Go Forward, Command-Control-Left and Command-Control-Right).
Related items
The leftmost button in the jump bar summons the Related Items menu, a hierarchical menu of files related to the current file, such as counterparts, superclasses, and included files. This list even includes methods that call or are called by the currently selected method.
NOTE
A path component menu in the jump bar can be filtered! Start typing while a jump bar menu is open, to filter what the menu displays. This filtering uses an “intelligent” search, not a strict text containment search; for example, typing “adf” will find application:didFinishLaunchingWithOptions: (if it’s present in the menu).
The Assistant pane
The Assistant lets you be in two places at once. Hold Option while navigating to open something in an Assistant pane instead of the primary editor pane. The Tracking menu in an Assistant pane’s jump bar sets its automatic relationship to the main pane; see the discussion of tracking inChapter 6.
Tabs and windows
You can also be in two places at once by opening a tab or a separate window (again, see Chapter 6).
Jump to definition
Navigate → Jump to Definition (Command-Control-J) lets you jump to the declaration or definition of the symbol already selected in your code.
Open quickly
File → Open Quickly (Command-Shift-O) searches in a dialog for a symbol in your code and the Cocoa headers.
Breakpoints
The Breakpoint navigator lists all breakpoints in your code. Xcode lacks code bookmarks, but you can misuse a disabled breakpoint as a bookmark. Breakpoints are discussed later in this chapter.
Finding
Finding is a form of navigation. In Xcode 5, the Find menu has been promoted from being an Edit submenu to a top-level menu. Xcode has both a global find (Find → Find in Project/Workspace, Command-Shift-F), which is the same as using the Search navigator, and an editor-level find (Find → Find, Command-F); don’t confuse them.
Find options are all-important. Additional options and capabilities appear in a pop-up menu when you click the magnifying glass icon in the search field. The global find options include a scope (“In project” in Figure 6-3), allowing you to specify in sophisticated ways which files will be searched: click the current scope to see a dialog where you can select a different scope or even create a custom scope. You can also find using regular expressions. There’s a lot of power lurking here.
To replace text, click on the word Find at the left end of the search bar to summon the pop-up menu, and choose Replace. You can replace all occurrences (Replace All), or select particular find results in the Search navigator and replace only those (Replace); new in Xcode 5, you can alsodelete find results from the Search navigator, to protect them from being affected by Replace All. The Search navigator’s Preview button summons a dialog that shows you the effect of each possible replacement, and lets you check or uncheck particular replacements in advance of performing the replacement. For editor-level find, hold Option before clicking Replace All, to find-and-replace within only the current selection.
A sophisticated form of editor-level find is Editor → Edit All In Scope, which finds simultaneously all occurrences of the currently selected term (usually a variable name) within the current set of curly braces; you can use this to change a variable’s name throughout its scope, or just to survey how the name is used.
NOTE
To change a symbol’s name throughout your code, as well as for automated, intelligent assistance in performing various code rearrangements that commonly arise in Objective-C programming, use Xcode’s Refactoring feature (see “Make Projectwide Changes” in Apple’s Xcode User Guide).
Running in the Simulator
When you build and run with the Simulator as the destination, you run in the iOS Simulator application. The Simulator window represents a device. Depending on your app target’s Base SDK, Deployment Target, and Targeted Device Family build settings, you may have choices about the device and system to be represented by the Simulator as you choose your destination before running (see Chapter 6).
You can also switch device types from within the Simulator, by choosing Hardware → Device. This quits your app running in the Simulator; you can relaunch it by building and running in Xcode again, or by clicking your app’s icon in the Simulator. In the latter case there is no longer any connection to Xcode (you aren’t using the debugger, so you won’t stop at breakpoints, and log messages won’t be relayed to the Xcode console); still, you might do this just to check quickly on how your app looks or behaves on a different device.
The Simulator window can be displayed at half, three-quarter, or full size (choose from Window → Scale). This is a matter of display merely, comparable to zooming the window, so your app running in the Simulator does not quit when you change this setting. For example, you might run a Retina device in the Simulator at full size to see every double-resolution pixel, or at half size to save space.
You can interact with the Simulator in some of the same basic ways as you would a device. Using the mouse, you can tap on the device’s screen; hold Option to make the mouse represent two fingers moving symmetrically around their common center, and Option-Shift to represent two fingers moving in parallel. Some Simulator representations display a Home button, which you can click with the mouse, but the most reliable way to click the Home button is to choose Hardware → Home (Command-Shift-H). (Because of multitasking, clicking the Home button to switch from the app you’re running in Xcode to the home screen does not stop your app running, in Xcode or on the Simulator. To quit your app in the Simulator, quit the Simulator, or switch to Xcode and choose Product → Stop.) Items in the Hardware menu also let you perform hardware gestures such as rotating the device, shaking it, and locking its screen; you can also test your app by simulating certain rare events, such as a low-memory situation.
The Debug menu in the Simulator is useful for detecting problems with animations and drawing. You can choose from this menu while your app is running in the Simulator, without causing the app to quit. Toggle Slow Animations makes animations unfold in slow motion so that you can see just what’s happening. The next four menu items (their names begin with Color) are similar to features available when running on a device using Instruments, under the Core Animation instrument, revealing possible sources of inefficiency in screen drawing.
The Debug menu also lets you open the log in the Console application, and lets you set the simulated device’s location (useful when testing a Core Location app).
Debugging
Debugging is the art of figuring out what’s wrong with the behavior of your app as it runs. I divide this art into two main techniques: caveman debugging and pausing your running app.
Caveman Debugging
Caveman debugging consists of altering your code, usually temporarily, typically by adding code to dump informative messages into the console. You can view the console in the Debug pane; Chapter 6 describes a technique for displaying the console in a tab of its own.
The standard command for sending a message to the console is NSLog. It’s a C function, and it takes an NSString which operates as a format string, followed by the format arguments.
A format string is a string (here, an NSString) containing symbols called format specifiers, for which values (the format arguments) will be substituted at runtime. All format specifiers begin with a percent sign (%), so the only way to enter a literal percent sign in a format string is as a double percent sign (%%). The character(s) following the percent sign specify the type of value that will be supplied at runtime. The most common format specifiers are %@ (an object reference), %d (an integer) and %f (a double). For example:
NSLog(@"the window: %@", self.window);
In that example, self.window is the first (and only) format argument, so its value will be substituted for the first (and only) format specifier, %@, when the format string is printed in the console. Thus the console output looks something like this (I’ve formatted it for clarity here):
the window: <UIWindow: 0x8a68a60;
frame = (0 0; 320 480);
hidden = YES;
gestureRecognizers = <NSArray: 0x8a69fd0>;
layer = <UIWindowLayer: 0x8a697b0>>
We learn the object’s class, its address in memory (important for confirming whether two instances are in fact the same instance), and the values of some additional properties. That nice summary of information is due to UIWindow’s implementation of the description method: an object’sdescription method is called when that object is used with the %@ format specifier. For this reason, you will probably want to implement description in your own classes, so that you can summarize an instance with a simple NSLog call.
For the complete repertory of format specifiers available in a format string, read Apple’s document String Format Specifiers (in the String Programming Guide). The format specifiers are largely based on those of the C printf standard library function; see K&R B1.2, the sprintf man page, and the IEEE printf specification linked from the documentation.
The main ways to go wrong with NSLog (or any format string) are to supply a different number of format arguments from the number of format specifiers in the string, or to supply an argument value different from the type declared by the corresponding format specifier. I often see beginners claim that logging shows a certain value to be nonsense, when in fact it is their NSLog call that is nonsense; for example, a format specifier was %d but the value of the corresponding argument was a float. Another common mistake is treating an NSNumber as if it were the type of number it contains; an NSNumber isn’t any kind of number — it’s an object (%@). Problems with signed vs. unsigned integers can be tricky as well. Fortunately, the compiler will try to help you with warnings.
C structs are not objects, so to see a struct’s value with NSLog you must somehow deconstruct the struct. Common Cocoa structs usually supply convenience functions for this purpose. For example:
NSLog(@"%@", NSStringFromCGRect(self.window.frame)); // {{0, 0}, {320, 480}}
Purists may scoff at caveman debugging, but I use it heavily: it’s easy, informative, and lightweight. And sometimes it’s the only way. Unlike the debugger, NSLog works with any build configuration (Debug or Release) and wherever your app runs (in the Simulator or on a device). It works when pausing is impossible (because of threading issues, for example). It even works on someone else’s device, such as a tester to whom you’ve distributed your app. It’s a little tricky for a tester to get a look at the console so as to be able to report back to you, but it can be done: for example, the tester can connect the device to a computer and view its log in Xcode’s Organizer window or with Apple’s iPhone Configuration Utility.
Remember to remove or comment out NSLog calls before shipping your app, as you probably don’t want your finished app to dump lots of messages into the console. A useful trick (shamelessly stolen from Jens Alfke) is to call MyLog instead of NSLog, and define MyLog like this in your precompiled header (and when it’s time to stop logging, change the 0 to 1):
#define MyLog if(0); else NSLog
A useful fact when logging is that the variable name _cmd holds the selector for the current method. Thus a single form of statement can signal where you are:
NSLog(@"Logging %@ in %@", NSStringFromSelector(_cmd), self);
(Similarly, in a C function, NSLog(@"%s", __FUNCTION__) logs the name of the function.)
Another sort of logging call with which you can pepper your code is asserts. Asserts are conditions that you claim (assert) are true at that moment — and you feel so strongly about this that you want your app to crash if you’re wrong. Asserts are a very good way to confirm that the situation matches your expectations, not just now as you write your code, but in the future as the app develops.
The simplest form of assert is the C function (actually it’s a macro) assert, to which you pass one argument, a condition — something that can be evaluated as false (0) or true (some other value). If it’s false, your app will crash when this line is encountered, along with a nice explanation in the log. For example, suppose we assert NO, which is false and will certainly cause a crash. Then when this line is encountered we crash with this log message:
Assertion failed: (NO),
function -[AppDelegate application:didFinishLaunchingWithOptions:],
file /Users/mattleopard/Desktop/testing/testing/AppDelegate.m, line 20.
That’s plenty for us to track down the assertion failure: we know the assertion condition, the method in which the assertion occurred, the file containing that method, and the line number.
For higher-level asserts, look at NSAssert (used in Objective-C methods) and NSCAssert (used in C functions). They allow you to form your own log message, which is to appear in the console in addition to the native assert logging; the log message can be a format string followed by values corresponding to the format specifiers, as with NSLog.
Some developers think that asserts should be allowed to remain in your code even when your app is finished. By default, however, higher-level NSAssert and NSCAssert are disabled in a Release build, thanks to the Enable Foundation Assertions build setting, which is set to No for the Release configuration in Apple’s project templates. To keep asserts working in a Release build, change that value to Yes for your app target.
The Xcode Debugger
When you’re building and running in Xcode, you can pause in the debugger and use Xcode’s debugging facilities.
NOTE
The debugger in Xcode 5 is LLDB. For full technical details, see http://lldb.llvm.org.
There isn’t a strong difference between running and debugging in Xcode; the main distinction is whether breakpoints are effective or ignored. The effectiveness of breakpoints can be toggled at two levels:
Globally
Breakpoints as a whole are either active or inactive. If breakpoints are inactive, we won’t pause at any breakpoints.
Individually
A given breakpoint is either enabled or disabled. Even if breakpoints are active, we won’t pause at this one if it is disabled. Disabling a breakpoint allows you to leave in place a breakpoint that you might need later without pausing at it every time it’s encountered.
A breakpoint, then, is ignored if it is disabled or if breakpoints as a whole are inactive.
The important thing, if you want to use the debugger, is that the app should be built with the Debug build configuration (the default for a scheme’s Run action). The debugger is not very helpful against an app built with the Release build configuration, not least because compiler optimizations can destroy the correspondence between steps in the compiled code and lines in your code.
To create a breakpoint (Figure 9-4), select in the editor the line where you want to pause, and choose Debug → Breakpoints → Add Breakpoint at Current Line (Command-\). This keyboard shortcut toggles between adding and removing a breakpoint for the current line. The breakpoint is symbolized by an arrow in the gutter. Alternatively, a simple click in the gutter adds a breakpoint; to remove a breakpoint gesturally, drag it out of the gutter.

Figure 9-4. A breakpoint
To disable a breakpoint at the current line, click on the breakpoint in the gutter to toggle its enabled status. Alternatively, Control-click on the breakpoint and choose Disable Breakpoint in the contextual menu. A dark breakpoint is enabled; a light breakpoint is disabled (Figure 9-5).

Figure 9-5. A disabled breakpoint
Once you have some breakpoints in your code, you’ll want to survey and manage them. That’s what the Breakpoint navigator is for. Here you can navigate to a breakpoint, enable or disable a breakpoint by clicking on its arrow in the navigator, and delete a breakpoint.
You can also edit a breakpoint’s behavior. Control-click on the breakpoint, in the gutter or in the Breakpoint navigator, and choose Edit Breakpoint; or Command-Option-click the breakpoint. This is a very powerful facility: you can have a breakpoint pause only under a certain condition or after it has been encountered a certain number of times, and you can have a breakpoint perform one or more actions when it is encountered, such as issuing a debugger command, logging, playing a sound, speaking text, or running a script.
A breakpoint can be configured to continue automatically after performing its action when it is encountered. This can be an excellent alternative to caveman debugging: instead of inserting an NSLog call, which must be compiled into your code and later removed when the app is released, you can set a breakpoint that logs and continues. By definition, such a breakpoint operates only when you’re actively debugging the project; it won’t dump any messages into the console when the app runs on a user’s device.
In the Breakpoint navigator, you can create certain kinds of breakpoint that you can’t create in the code editor. Click the Plus button at the bottom of the navigator and choose from its pop-up menu. The most important types are:
Exception breakpoint
An exception breakpoint causes your app to pause at the time an exception is thrown or caught, without regard to whether the exception would crash your app later. I recommend that you create an exception breakpoint to pause on all exceptions when they are thrown, because this gives the best view of the call stack and variable values at the moment of the exception (rather than later when the crash actually occurs); you can see where you are in your code, and you can examine variable values, which may help you understand the cause of the problem. If you do create such an exception breakpoint, I also suggest that you use the contextual menu to say Move Breakpoint To → User, which makes this breakpoint permanent and global to all your projects.
The only problem with an exception breakpoint is that sometimes Apple’s code will throw an exception and catch it, deliberately. This isn’t a crash, and nothing has gone wrong; but your app pauses in the debugger anyway, which can be confusing.
Symbolic breakpoint
A symbolic breakpoint causes your app to pause when a certain method or function is called, regardless of what object called it or to what object the message is sent. A method may be specified using the instance method or class method symbol (- or +) followed by square brackets containing the class name and the method name (see A Useful Shorthand). For example, to learn where in my app the beginReceivingRemoteControlEvents message was being sent to my shared application instance, I configured a symbolic breakpoint like this:
-[UIApplication beginReceivingRemoteControlEvents]
New in Xcode 5, you can specify a method name by typing its name alone, and it will be resolved into individual breakpoints for all the matching class-specific methods; you can then enable just the ones you want to pause at. This feature is useful also for confirming that you’ve entered the method name correctly. Thus, I can now create a symbolic breakpoint for beginReceivingRemoteControlEvents, and Xcode itself will resolve this to -[UIApplication beginReceivingRemoteControlEvents] for me.
To toggle the active status of breakpoints as a whole, click the Breakpoints button in the bar at the top of the Debug pane, or choose Debug → Activate/Deactivate Breakpoints (Command-Y). The active status of breakpoints as a whole doesn’t affect the enabled or disabled status of any breakpoints; if breakpoints are inactive, they are simply ignored en masse, and no pausing at breakpoints takes place. Breakpoint arrows are blue if breakpoints are active, gray if they are inactive.
When the app runs with breakpoints active and an enabled breakpoint is encountered (and assuming its conditions are met, and so on), the app pauses. In the active project window, the editor shows the file containing the point of execution, which will usually be the file containing the breakpoint. The point of execution is shown as a green arrow; this is the line that is about to be executed (Figure 9-6). Depending on the settings for Running → Pauses in the Behaviors preference pane, the Debug navigator and the Debug pane may also appear.

Figure 9-6. Paused at a breakpoint
Here are some things you might like to do while paused at a breakpoint:
See where you are
One common reason for setting a breakpoint is to make sure that the path of execution is passing through a certain line. You can see where you are in any of your methods by clicking on the method name in the call stack, shown in the Debug navigator.
Methods listed in the call stack with a User icon, with the text in black, are yours; click one to see where you are paused in that method. Other methods, with the text in gray, are methods for which you have no source code, so there would be little point clicking one unless you know something about assembly language. The slider in the filter bar hides chunks of the call chain, to save space, starting with the methods for which you have no source.
You can also view and navigate the call stack using the jump bar at the top of the Debug pane.
Study variable values
This is a very common reason for pausing. In the Debug pane, variable values for the current scope (corresponding to what’s selected in the call stack) are visible in the variables list. You can see additional object features, such as collection elements, instance variables, and even some private information, by opening triangles. Local variable values are shown even if, at the point where are paused, those variables have not yet been initialized; such values are meaningless, so ignore them.
Switch the pop-up menu below the variables list to Auto to see only those variables that Xcode thinks will interest you (because their value has been recently changed, for instance); if you’re after completeness, Local will probably be the best setting. You can use the search field to filter variables by name or value. If a formatted summary isn’t sufficiently helpful, you can send description (or, if you’ve implemented it, debugDescription) to an object variable and view the output in the console: choose Print Description of [Variable] from the contextual menu, or select the variable and click the Info button below the variables list.
Xcode 5 introduces a powerful new way of viewing a variable’s value graphically: select the variable and click the Quick Look button (an eye icon) below the variables list, or press Spacebar. For example, in the case of a CGRect, the graphical representation is a correctly proportioned rectangle.
Also, data tips have been revised in Xcode 5 to make them more useful. To see a data tip, hover the mouse over the name of a variable in your code. The data tip is much like the display of this value in the variables list: there’s a flippy triangle that you can open to see more information, plus an Info button that displays the value description here and in the console, and a Quick Look button for showing a value graphically (Figure 9-7).
NOTE
You can also change variable values while paused in the debugger. Select a line in the variables list and press Return to make it editable, or double-click a value in a data tip; simple scalar values (such as floats and ints, including pointers) can be changed in this way. You can also use the expr command in the console to set a value. Use this feature with care (if at all).
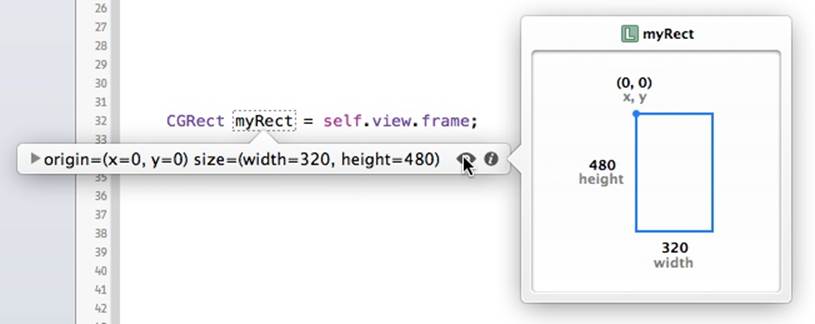
Figure 9-7. A data tip
Set a watchpoint
A watchpoint is like a breakpoint, but instead of depending on a certain line of code it depends on a variable’s value: the debugger pauses whenever the variable’s value changes. You can set a watchpoint only while paused in the debugger. Control-click on the variable in the variables list and choose Watch [Variable]. Watchpoints, once created, are listed and managed in the Breakpoint navigator. Because of the overhead required to maintain a watchpoint, you can only have a few of them at a time.
Manage expressions
An expression is code to be added to the variables list and evaluated every time we pause. Choose Add Expression from the contextual menu in the variables list. The expression is evaluated within the current context in your code, so be careful of side effects.
Talk to the debugger
You can communicate directly with the debugger through the console. Xcode’s debugger interface is a front end to LLDB; by talking directly to LLDB, you can do everything that you can do through the Xcode debugger interface, and much more.
A common command is po (for “print object”) followed by an object variable’s name or a method call that returns an object; it calls the object’s description method (or, if you’ve implemented it, debugDescription). Another valuable command is expr, which evaluates an Objective-C expression in the current context — meaning, among other things, that you can call a method, or change the value of a variable in scope! For a good list of other things you’re likely to say, see http://lldb.llvm.org/lldb-gdb.html. Any LLDB console command is also eligible to be used as a breakpoint’s Debugger Command action.
Fiddle with breakpoints
You are free to create, destroy, edit, enable and disable, and otherwise manage breakpoints dynamically even while your app is running, which is useful because where you’d like to pause next might depend on what you learn while you’re paused here.
Indeed, this is one of the main advantages of breakpoints over caveman debugging. To change your caveman debugging, you have to stop the app, edit it, rebuild it, and start running the app all over again. But to fiddle with breakpoints, you don’t have to be stopped; you don’t even have to be paused! An operation that went wrong, if it doesn’t crash your app, can probably be repeated in real time; so you can just add a breakpoint and try again. For example, if tapping a button produces the wrong results, you can add a breakpoint and tap the button again; this time through the same code, you can work out what the trouble is.
Step or continue
To proceed with your paused app, you can either resume running until the next breakpoint is encountered (Debug → Continue) or take one step and pause again. Also, you can select in a line and choose Debug → Continue to Current Line (or Continue to Here from the contextual menu), which effectively sets a breakpoint at the chosen line, continues, and removes the breakpoint.
The stepping commands (in the Debug menu) are:
Step Over
Pause at the next line.
Step Into
Pause in your method that the current line calls, if there is one; otherwise, pause at the next line.
Step Out
Pause when we return from the current method.
You can access these commands through convenient buttons in the bar at the top of the Debug pane. Even if the Debug pane is collapsed, the bar containing the buttons appears while running.
NOTE
If Step Over fails to reach the next line because it hits and pauses at a breakpoint inside a method called in the current line, Continue will then pause automatically at that next line — you don’t have to say Step Out just to pause where you would have paused if it weren’t for the unexpected breakpoint.
Start over, or abort
To kill the running app, click Stop in the toolbar (Product → Stop, Command-Period). Clicking the Home button in the Simulator (Hardware → Home) or on the device does not stop the running app in the multitasking world of iOS 4 and later. To kill the running app and relaunch it without rebuilding it, Control-click Run in the toolbar (Product → Perform Action → Run Without Building, Command-Control-R).
You can make changes to your code while the app is running or paused, but those changes are not magically communicated to the running app; there are languages and programming milieus where that sort of thing is possible, but Xcode and Objective-C are not among them. You must stop the app and run in the normal way (which includes building) to see your changes in action.
Unit Testing
A unit test is code that isn’t part of your app target, whose purpose is to exercise code that is part of your app target, making sure that it works as expected. For example, a unit test might call some method in your app target code, handing it various parameters and looking to see if the expected result is returned each time, not just under normal conditions but also when incorrect or extreme inputs are supplied. It can even be useful to write unit tests before writing the real code, as a way of developing a working algorithm. In addition, having initially ascertained that your code passes your tests, you continue to run those tests from time to time, to detect whether a bug has been introduced during the course of development.
NOTE
Unit tests are not a means of exercising your app as a whole, guiding it through various scenarios by effectively tapping buttons with a ghost finger to make sure that the interface behaves as expected. You can perform tests of that sort — for example, you might make your app accessible, so that its user interface elements are visible to code, and then use the Automation instrument of Instruments to run JavaScript scripts that act like a ghost user — but that would not be unit testing. Unit tests are for probing your code’s business logic, not for verifying its interface.
In the past, configuring your app for unit testing has been forbiddingly difficult, but in Xcode 5, unit tests are promoted to the level of first-class citizens: the application templates generate projects with a test target in addition to the app target, and tests can be managed and run easily from the Test navigator (Command-5) as well as from within a test class file.
A test class in Xcode 5 is a subclass of XCTestCase (which is itself a subclass of XCTest). A test method is an instance method of a test class, returning no value (void) and taking no parameters, whose name starts with test. The test target depends upon the app target, meaning that before a test class can be compiled and built, the app target must be compiled and built. Running a test also runs the app; the test target’s product is a bundle, which is loaded into the app as it launches. Each test method will call one or more asserts; in Xcode 5, their names begin with XCTAssert. (To find out more about them, see XCTestAssertions.h.)
WARNING
The asserts whose names begin with XCTAssert are actually macros. Keep your syntax simple to avoid problems. For example, an array literal starting with @ doesn’t work here.
In addition to test methods, a test class may contain utility methods that are called by the test methods. It may also contain any of four special methods inherited from XCTestCase:
setUp class method
Called once before all test methods in the class.
setUp instance method
Called before each test method.
tearDown instance method
Called after each test method.
tearDown class method
Called once after all test methods in the class.
NOTE
The test target is a target, and what it produces is a bundle, with build phases like an app target. This means that resources, such as test data, can be included in the bundle. You might use setUp to load such resources; you can refer in code to the test bundle like this:
[NSBundle bundleForClass:[MyTestClass class]]
As an example, let’s use our Empty Window project. Give the ViewController class a (nonsensical) instance method dogMyCats:, like this:
- (NSString*) dogMyCats: (NSString*) cats {
return nil;
}
The method dogMyCats: is supposed to receive any string and return the string @"dogs". At the moment, though, it doesn’t; it returns nil instead. That’s a bug. Now we’ll write a test method to ferret out this bug.
Empty Window comes with a single test class, Empty_WindowTests. Unlike a normal class, Empty_WindowTests is declared entirely in a single file, Empty_WindowTests.m — it has no corresponding header (.h) file, but contains both the @interface section and the @implementationsection in the .m file. (This, as I said in Chapter 4, is perfectly legal.)
In Empty_WindowTests.m, delete the existing test method testExample. We’re going to replace it with a test method that calls dogMyCats: and makes an assertion about the result. Since dogMyCats: is a ViewController instance method, we’re going to need a ViewController instance. In order to speak of a ViewController instance and call a ViewController method, we’ll need to import ViewController’s header file:
#import "ViewController.h"
We’re going to want to call dogMyCats:; to get that call past the compiler, we’re going to need a knowledge of dogMyCats:. This means that dogMyCats: must be declared in the header file we just imported, ViewController.h.
Let’s prepare an instance variable in the Empty_WindowTests class to store our ViewController instance. Declare the property in the @interface section:
@interface Empty_WindowTests : XCTestCase
@property ViewController* viewController;
@end
Let’s set the value of that property in our setUp method:
- (void)setUp {
[super setUp];
self.viewController = [ViewController new];
}
Now we can write our test method. Call it testDogMyCats. It has access to a ViewController instance as self.viewController, because setUp will run before this test method does:
- (void)testDogMyCats {
NSString* input = @"cats";
XCTAssertEqualObjects([self.viewController dogMyCats:input], @"dogs",
@"ViewController dogMyCats: fails to produce dogs from \"%@\"",
input);
}
We are now ready to run our test. There are many ways to do this. Observe that the Test navigator lists our test target, our test class, and our test method. Hover the mouse over any name, and a button appears to its right. By clicking the appropriate button, you can thus run all tests in every class, all tests in the Empty_WindowTests class, or just the testDogMyCats test. But wait, there’s more! Back in Empty_WindowTests.m, there’s also a diamond-shaped indicator in the gutter to the left of the @interface line and the test method name; you can also click one of those to run, respectively, all tests in this class or an individual test. Or, to run all tests, you can choose Product → Test.
Make sure the scheme pop-up menu shows the destination as the Simulator, and run testDogMyCats. The app target is compiled and built; the test target is compiled and built. (We can’t test if any of those steps fails, and you’ll be back on familiar ground with a compile error or a build error.) The app launches in the Simulator, and the test runs.
The test fails! (Well, we knew that was going to happen, didn’t we?) The app stops running in the Simulator. The error is described in a banner next to the assert that failed in our code, as well as in the Issue navigator; it is easiest to read, perhaps, in the Log navigator (there’s a More button that exposes the entire error description). Moreover, red X marks appear everywhere — in the Test navigator next to testDogMyCats, in the Issue navigator, in the Log navigator, and in Empty_WindowTests.m next to the @implementation line and the first line of testDogMyCats. Most of these red X marks are buttons! You can click one to run the test again. (After running an individual test, you can also choose Product → Perform Action → Test [TestMethod] Again from wherever you happen to be.)
There’s no point doing that, though, until we’ve fixed our code. In ViewController.m, modify dogMyCats to return @"dogs" instead of nil. Now run the test again. It passes!
When a test failure occurs, you might like to pause at the point where the assertion is about to fail. To do so, in the Breakpoint navigator, click the Plus button at the bottom and choose Add Test Failure Breakpoint. This is like an Exception breakpoint, pausing on the assert line in your test method just before it reports failure. You could then switch to the method being tested, for example, and examine its variables and so forth, to work out the reason for the impending failure.
There’s a helpful feature allowing you to navigate between a method and a test that calls it: when the selection is within a method, the Related Files menu in the jump bar includes Test Callers. The same is true of the Tracking menu in an assistant pane situation.
The test code runs inside a bundle that is effectively injected into your running app. This means that it can see app globals such as [UIApplication sharedApplication]. Thus, for example, instead of making a new ViewController instance in order to initialize Empty_WindowTests’sself.viewController, we could have accessed the application’s already existing ViewController instance:
self.viewController =
(ViewController*)[[[[UIApplication sharedApplication]
delegate] window] rootViewController];
Organization of your test methods into test targets (suites) and test classes is largely a matter of convenience: it makes a difference to the layout of the Test navigator and which tests will be run together, plus each test class has its own instance variables, its own setUp method, and so on. To make a new test target or a new test class, click the Plus button at the bottom of the Test navigator.
WARNING
When you rename a project that contains a test target (Renaming Parts of a Project), the test target will break: several of its build settings still specify the app by its old name, so the test target cannot be built, and tests cannot be run. If you’re uncomfortable editing the test target’s build settings by hand, the easiest solution is to copy the test code to somewhere safe, delete the test target, make a new test target (which will have the right settings), and restore the test code.
Static Analyzer
From time to time, you should use the static analyzer to look for possible sources of error in your code; choose Product → Analyze (Command-Shift-B). This command causes your code to be compiled, and the static analyzer studies it in depth, reporting its findings in the Issue navigator and in your code. As with compiling, Xcode 5 can also analyze an individual file (choose Product → Perform Action → Analyze [Filename]).
The static analyzer is static (it’s analyzing your code, not debugging in real time), but it is remarkably intelligent and thorough, and may well alert you to potential problems that could otherwise escape your notice. You might think that the compiler alone should be sufficient in this regard. It’s true that some of the static analyzer’s intelligence has indeed been migrated over into the compiler, which in Xcode 5 is providing more intelligent and helpful warnings than ever before. Moreover, one of the main reasons for using the static analyzer, namely, to assist with manual memory management of Objective-C instances, is largely gone if you’re using ARC. Still, not all of your memory management will be taken care of by ARC; ARC doesn’t handle CFTypeRef memory management, for example (Chapter 12), and the analyzer will alert you to your possible mistakes. And the static analyzer takes the time to study in depth the possible values and paths of execution in your code, and can detect potential sources of trouble in your program’s logic that no mere compiler would worry about.
For example, not long ago I found the analyzer complaining about this code:
-(void) newGameWithImage:(id)imageSource song:(NSString*)song {
CGImageSourceRef src;
if ([imageSource isKindOfClass:[NSURL class]])
src = CGImageSourceCreateWithURL(
(__bridge CFURLRef)imageSource, nil);
if ([imageSource isKindOfClass:[NSData class]])
src = CGImageSourceCreateWithData(
(__bridge CFDataRef)imageSource, nil);
// ...
if (nil != src)
CFRelease(src);
}
First, the analyzer warned that src was a garbage value. This seemed unlikely to me; after all, the variable src was going to be initialized by one of the two isKindOfClass: conditions. But then it occurred to me that the analyzer didn’t know that for a fact — and neither did I. Myintention was certainly that this method should be called with an imageSource value that was either an NSURL or an NSData; but what if some idiot (my future self) called it with some other type of value? Then, sure enough, src would never be initialized. So I initialized it to nil:
CGImageSourceRef src = nil;
I ran the analyzer again, but it still complained, saying that src was potentially leaking at the end of the method. But how could that be? The rules for CFTypeRef memory management require that if you make a CGImageSourceRef with a call to CGImageSourceCreateWithURL orCGImageSourceCreateWithData, you must later call CFRelease on that object — and I was doing that.
When the static analyzer warns, if you click on the icon at the start of the warning, the analyzer draws a diagram displaying its logic step by step, complete with arrows showing the path of execution. I did that, and saw that the analyzer was imagining that both isKindOfClass: conditions might succeed (Figure 9-8). Sure enough, if that were to happen, the first value of src would leak: it would be replaced, without memory management, by the second value!
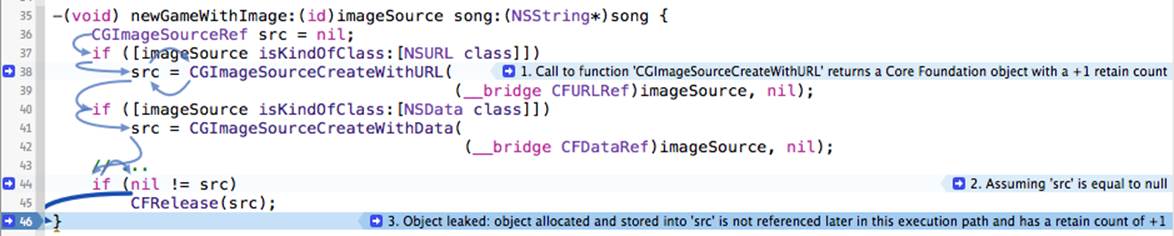
Figure 9-8. The static analyzer draws a diagram
Based on the facts of class inheritance, both isKindOfClass: conditions can’t succeed; imageSource must be an NSURL or an NSData (or neither). But the analyzer is concerned with logic and the flow of execution. If I believe that only one of these conditions will succeed, it’s up to me to express that fact logically and structurally. I did so, by changing the second if to else if:
if ([imageSource isKindOfClass:[NSURL class]])
src = CGImageSourceCreateWithURL(
(__bridge CFURLRef)imageSource, nil);
else if ([imageSource isKindOfClass:[NSData class]])
src = CGImageSourceCreateWithData(
(__bridge CFDataRef)imageSource, nil);
And that was that; running the analyzer once again, I found it was perfectly happy. The static analyzer had seen more deeply into the logical structure of my code than I did, and helped me to tighten that logical structure to make my code both clearer and safer.
If you’d like to run the static analyzer automatically as part of ordinary compilation when you do a build, you can: there’s a build setting, Analyze During ‘Build’. If you set that to Yes, you probably want Mode of Analysis for ‘Build’ to be Shallow; a full analysis (Deep) could be too time-consuming.
For more about the static analyzer, see http://clang-analyzer.llvm.org.
Clean
From time to time, during repeated testing and debugging, and before making a different sort of build (switching from Debug to Release, or running on a device instead of the Simulator), it is a good idea to clean your target. This means that existing builds will be removed and caches will be cleared, so that all code will be considered to be in need of compilation and the next build will build your app from scratch.
The first build of your app, after you clean, may take longer than usual. But it’s worth it, because cleaning removes the cruft, quite literally. For example, suppose you have been including a certain resource in your app, and you decide it is no longer needed. You can remove it from the Copy Bundle Resources build phase (or from your project as a whole), but that doesn’t remove it from your built app. This sort of leftover resource can cause all kinds of mysterious trouble. The wrong version of a nib may seem to appear in your interface; code that you’ve edited may seem to behave as it did before the edit. Cleaning removes the built app, and very often solves the problem.
I think of cleaning as having several levels or degrees:
Shallow clean
Choose Product → Clean, which removes the built app and some of the intermediate information in the build folder.
Deeper clean
Hold Option and choose Product → Clean Build Folder, which removes the entire build folder.
Complete clean
Close the project. Open the Organizer window (Window → Organizer) and find your project listed at the left side of the Projects window; click it. On the right, click Delete. This removes the project’s entire folder inside your user Library/Developer/Xcode/DerivedData folder. The project’s index will have to be rebuilt the next time the project is opened, which takes some time, but certain obscure issues can be solved only by forcing this to happen.
Total clean
Quit Xcode. Open your user Library/Developer/Xcode/DerivedData folder and move all its contents to the trash. This is a complete clean for every project you’ve opened recently (plus the module information if you’re using modules). The space savings can be significant.
In addition to cleaning your project, you should also remove your app from the Simulator. This is for the same reason as cleaning the project: when the app is built and copied to the Simulator, existing resources inside the built app may not be removed (in order to save time), and this may cause the app to behave oddly. To clean out the Simulator while running the Simulator, choose iOS Simulator → Reset Content and Settings. Alternatively, you can clean out apps from the Simulator by working in the Finder. Quit the Simulator if it’s running. Then open your userLibrary/Application Support/iPhone Simulator folder and look for a folder named after the system version of the SDK (for example, there might be a folder called 7.0); within this, find the Applications folder, and move the contents of that folder to the trash.
Running on a Device
Sooner or later, you’re going to want to advance from running and testing and debugging in the Simulator to running and testing and debugging on a real device. The Simulator is nice, but it’s only a simulation; there are many differences between the Simulator and a real device. The Simulator is really your computer, which is fast and has lots of memory, so problems with memory management and speed won’t be exposed until you run on a device. User interaction with the Simulator is limited to what can be done with a mouse: you can click, you can drag, you can hold Option to simulate use of two fingers, but more elaborate gestures can be performed only on an actual device. And many iOS facilities, such as the accelerometer and access to the music library, are not present on the Simulator at all, so that testing an app that uses them is possible only on a device.
WARNING
Don’t even think of developing an app without testing it on a device. You have no idea how your app really looks and behaves until you run it on a device. Submitting to the App Store an app that you have not run on a device is asking for trouble.
Before you can run your app on a device, even just to test, you must join the iOS Developer Program by paying the annual fee. (Yes, this is infuriating. Now get over it.) Only in this way can you obtain and provide to Xcode the credentials for running on a device. You’ll go to the iOS Developer Program web page (http://developer.apple.com/programs/ios). This requires filling out a form and paying the annual fee. When you’re starting out, the Individual program is sufficient. The Company program costs no more, but adds the ability to privilege additional developers in various roles. (You do not need the Company program in order to distribute your built app to other users for testing.)
Your iOS Developer Program membership involves two things:
An Apple ID
The user ID that identifies you at Apple’s site (along with the corresponding password).
You’ll use your Developer Program Apple ID for all kinds of things. In addition to letting you prepare an app to run on a device, this same Apple ID lets you enter Apple’s development forums, download Xcode beta versions, view WWDC videos, and so forth.
A team name
You, under the same Apple ID, can belong to more than one team. On each team, you will have a role dictating your privileges.
For example, on the Matt Neuburg team, of which I am the sole member, my role is Agent, meaning that I can do everything: I can develop apps, run them on my device, submit apps to the App Store, and receive the money for any paid apps that sell any copies there. But I’m also a member of the TidBITS team, for which I write the TidBITS News app; for this team, I’m just an Admin, meaning that I can’t submit to the App Store or see the app’s details at iTunes Connect — someone else is the Agent for that team, and does those things.
Having established your Developer Program Apple ID, you should enter it into the Accounts preference pane in Xcode. (This is new in Xcode 5.) Click the Plus button at the bottom left and choose Add Apple ID. Provide the Apple ID and password. From now on, Xcode will identify you through the team name(s) associated with this Apple ID; you shouldn’t need to tell Xcode this password again.
To run an app on a device, you will need to sign the app as you build it. An app that is not properly signed for a device will not run on that device (assuming you haven’t jailbroken the device). Signing an app requires two things:
An identity
An identity represents Apple’s permission for a given team to develop, on a particular computer, apps that can run on a device. It consists of two parts:
A private key
The private key is stored in the keychain on your computer. Thus, it identifies the computer as one where this team can potentially develop device-targeted apps.
A certificate
A certificate is a virtual permission slip from Apple. It contains the public key matching the private key (because you told Apple the public key when you asked for the certificate). With a copy of this certificate, any machine holding the private key can actually be used to develop device-targeted apps under the name of this team.
A provisioning profile
A provisioning profile is another virtual permission slip from Apple. It unites four things:
§ An identity.
§ An app, identified by its bundle id.
§ A list of eligible devices.
§ A list of entitlements. An entitlement is a special privilege that not every app needs, such as the ability to talk to iCloud. You won’t concern yourself with entitlements unless you write an app that needs one.
Thus, a provisioning profile is sufficient for signing an app as you build it. It says that on this Mac it is permitted to build this app such that it will run on these devices.
There are two types of identity, and hence two types of certificate, and hence two kinds of provisioning profile: development and distribution (a distribution certificate is also called a production certificate). We are concerned here with the development identity, certificate, and profile; I’ll talk about the distribution side later in this chapter.
Apple is the ultimate keeper of all information: your certificates, your provisioning profiles, what apps and what devices you’ve registered. Your communication with Apple, when you need to verify or obtain a copy of this information, will take place through one of two means:
The Member Center
A set of web pages. You need a Developer Program membership to log in. At the Member Center page (https://developer.apple.com/membercenter) or at the iOS Dev Center page (https://developer.apple.com/devcenter/ios/) click Certificates, Identifiers, & Profiles. You’ll have access to all features and information to which you are entitled by your membership type and role. This is the area of Apple’s site formerly known as the Portal; the interface was heavily revamped in April 2013.
Xcode
Except for obtaining a distribution provisioning profile, just about everything you would need to do at the Member Center can be done through Xcode instead. When all goes well, using Xcode is a lot simpler! If there’s a problem, you can head for the Member Center to iron it out.
Obtaining a Certificate
Setting up an identity and obtaining a certificate is something you only have to do once (or, perhaps, once a year at most; you might have to do it again when your Developer Program membership is renewed). The certificate, you remember, depends upon a private–public key pair. The private key will live in your keychain; the public key will be handed over to Apple, to be built into the certificate. The way you give Apple your public key is through a request for the certificate. Thus, the procedure for obtaining a certificate is as follows:
1. Through the Keychain Access program on your computer, you generate the private–public key pair. Your keychain keeps the private key.
2. You embed the public key in a certificate request, and submit the request to Apple at the Member Center, identifying yourself through your Apple ID and (if necessary) your team, and specifying a development or distribution certificate.
3. Apple provides the certificate itself, which also contains the public key.
4. The certificate is downloaded, and is imported by the keychain, which uses the public key to match it up with the correct private key. Your keychain keeps the certificate.
5. Henceforward, Xcode can see the certificate in the keychain, and thus grants you an identity for development or distribution under the appropriate team name.
If that sounds complicated, that’s because it is. However, in Xcode 5, all of those steps are performed for you automatically when you request a certificate! Here’s what to do:
1. Open Xcode’s Accounts preference pane.
2. If you haven’t entered your developer Apple ID and password, do so now.
3. On the left, select your Apple ID. On the right, select your team. Click View Details.
4. If you had a certificate and it was revoked from the portal but is still valid, you may see a dialog offering to request and download the certificate. Click Request.
Otherwise, click the Plus button and choose iOS Development (at the lower left under the Signing Identities column).
Everything then happens automatically: the private–public key pair is generated, and the certificate is requested, generated, downloaded, stored in your keychain, and listed under Signing Identities in the View Details dialog.
(Moreover, a wildcard team development provisioning profile may also be generated, as shown in Figure 9-10. Thus you may now have everything you need to run on a device!)
If that works, then skip the rest of this section. Just in case it doesn’t, I’ll now describe the more elaborate manual procedure for generating the private–public key pair and the certificate request. Instructions are also available at the Member Center as you initiate the process (go to the Certificates page and click the Plus button at the top right).
You launch Keychain Access and choose Keychain Access → Certificate Assistant → Request a Certificate from a Certificate Authority. Using your name and email address as identifiers, you generate and save to disk a 2048-bit RSA certificate request file. Your private key is stored in your keychain then and there; the certificate request containing your public key has been saved temporarily onto your computer. (For example, you might save it to the desktop.)
At the Member Center, you are presented with an interface allowing you to upload the saved certificate request file. You upload it, and the certificate is generated; click its listing at the Member Center to expose the Download button, and click Download. Locate and double-click the file you just downloaded; Keychain Access automatically imports the certificate and stores it in your keychain. You do not need to keep the certificate request file or the downloaded certificate file; your keychain now contains all the needed credentials. If this has worked, you can see the certificate in your keychain, read its details, and observe that it is valid and linked to your private key (Figure 9-9). Moreover, you should be able to confirm that Xcode now knows about this certificate: in the Accounts preference pane, click your Apple ID on the left and your team name on the right, and click View Details; a dialog opens where you should see an iOS Development signing identity listed at the top, with a Valid status.
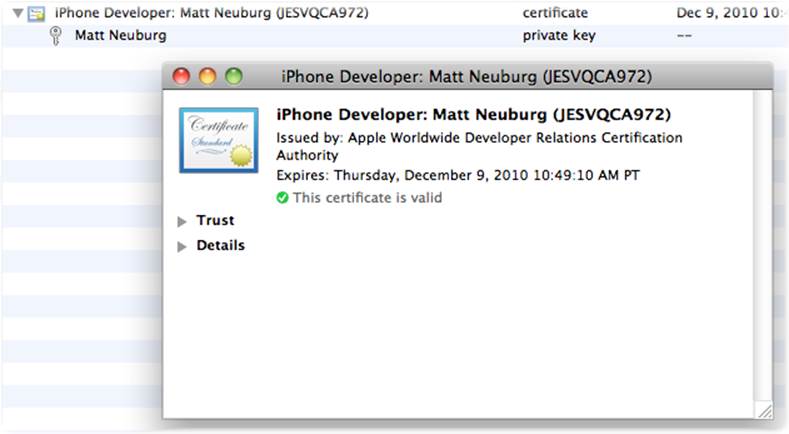
Figure 9-9. A valid development certificate, as shown in Keychain Access
NOTE
If this is your very, very first time obtaining any certificate from the Member Center, you will need another certificate: the WWDR Intermediate Certificate. This is the certificate that certifies that certificates issued by WWDR (the Apple Worldwide Developer Relations Certification Authority) are to be trusted. (You can’t make this stuff up.) Xcode should automatically install this in your keychain; if not, you can obtain a copy of it manually by clicking a link at the bottom of the page at the Member Center where you begin the process of adding a certificate.
Obtaining a Development Provisioning Profile
A provisioning profile, as I’ve already mentioned, unites an identity, a device, and an app bundle id. If things go well, in the simplest case, you’ll be able to obtain a development provisioning profile in a single step from within Xcode. If an app doesn’t require special entitlements or capabilities, a single development profile associated with your team is sufficient for all your apps, so you might only have to do this step once.
You already have a development identity, from the previous section. You may also have a universal development provisioning profile, from the previous section! If not, do this:
1. Connect a device to your computer.
2. Open the Organizer window in Xcode (Window → Organizer).
3. Switch to the Devices tab.
4. Select the connected device.
5. Click Add to Member Center or Use for Development at the bottom of the window.
The device is registered with Apple by its unique identifier number, and a universal development provisioning profile targeted for this device is created and downloaded.
To confirm that the device has been added to the Member Center, go there in your browser and click Devices.
To confirm that you have the universal development provisioning profile, click View Details in the Accounts preference pane (for the appropriate team). Certificates and profiles are listed here. The universal development profile, in addition to the title “iOS Team Provisioning Profile”, will have a nonspecific app bundle id associated with it, indicated by an asterisk (Figure 9-10).
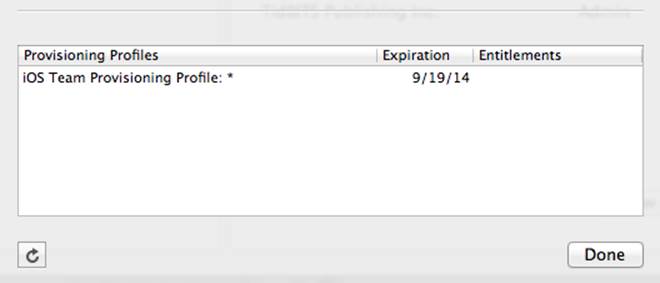
Figure 9-10. A universal development profile
The universal development profile allows you to run any app on the targeted device for testing purposes, provided that the app doesn’t require special entitlements (such as using iCloud).
Additional devices can be introduced through Xcode. Connect the device to your computer. When you click Add to Member Center or Use for Development, the device is automatically registered at the Member Center and added to any team development profiles, and those profiles are automatically regenerated and downloaded into Xcode.
Sometimes, Xcode will generate individual development provisioning profiles for every app ID listed at the Member Center for a team. These will then be listed in the Accounts preference pane in the View Details dialog for that team, with the title “iOS Team Provisioning Profile” and a specific app bundle id. For running on a device, these extra team provisioning profiles are probably superfluous.
It is also possible to obtain a development profile manually at the Member Center:
1. At the Member Center, make sure your target device is listed under Devices. If it isn’t, click the Plus button and enter a name for this device along with its UDID. You can copy the device’s UDID from its listing in the Devices tab of the Organizer window.
2. For a specific app, make sure your app is registered at the Member Center under Identifiers → App IDs. If it isn’t, add it. Click Plus. Enter a name for this app. Don’t worry about the nonsense letters and numbers that the Member Center adds as a prefix to your bundle identifier; use the Team ID. Enter the bundle identifier under Explicit App ID exactly as shown in Xcode, in the Bundle Identifier field under General when you edit the app target. (Unfortunately, if the bundle identifier is automatically generated, you can’t copy it from the Bundle Identifier field.)
3. Under Provisioning Profiles, click Plus. Ask for an iOS App Development profile. On the next screen, choose the App ID. On the next screen, check your development certificate. On the next screen, select the device(s) you want to run on. On the next screen, give this profile a name, and click Generate. Click the Download button. Find the downloaded profile, and double-click it to open it in Xcode. You can then throw the downloaded profile away; Xcode has made a copy.
Running the App
Once you have a development profile applicable to an app and a device (or, in the case of the universal team profile, all apps and all registered devices), connect the device, choose it as the destination in the Scheme pop-up menu, and build and run the app. You may be asked for permission to access your keychain; grant it. If necessary, Xcode will install the associated provisioning profile onto the device.
The app is built, loaded onto your device, and runs there. As long as you launch the app from Xcode, everything is just as when running in the Simulator: you can run, or you can debug, and the running app is in communication with Xcode, so that you can stop at breakpoints, read messages in the console, and so on. The outward difference is that to interact physically with the app, you use the device (tethered physically to your computer), not the Simulator.
Running the app from Xcode on the device can also be used simply as a way of copying the current version of the app to the device. You can then stop the app (in Xcode), disconnect the device from your computer, and launch the app on the device and play with it. This is a good way of testing. You are not debugging, so you can’t get any feedback in Xcode, but NSLog messages are written to the console internally and can be retrieved later.
Profile and Device Management
In Xcode 5, the central location for surveying identities and provisioning profiles is the Accounts preference pane. Select an Apple ID and a team and choose View Details.
An important feature of the Accounts preference pane is the ability to export account information. You’ll need this if you want to be able to develop on a different computer. Select an Apple ID and use the Gear menu at the bottom of the pane to choose Export Accounts. You’ll be asked for a file name and a place to save, along with a password; this password is associated solely with this file, and is needed only to open the file later on another computer. On the other computer, to which you have copied the exported file, run Xcode and double-click the exported file; Xcode asks for its password. When you provide it, like magic the entire suite of teams and identities and certificates and provisioning profiles springs to life in that other copy of Xcode, including the entries in your keychain.
Alternatively, you might need to export just an identity, without any provisioning profiles. You can do that with the gear menu in the Accounts preference pane’s View Details dialog.
If the provisioning profiles listed in the Accounts preference pane’s View Details dialog get out of sync with the Member Center, click the Refresh button at the bottom left. If that doesn’t help, quit Xcode and, in the Finder, open your user Library/MobileDevice/Provisioning Profiles folder, and delete everything that’s in there. Relaunch Xcode. In Accounts, your provisioning profiles are gone! Now click the refresh button. Xcode will download fresh copies of all your provisioning profiles, and you’ll be back in sync with the Member Center.
When a device is attached to the computer, it is listed with a green dot under Devices in the Organizer window. Click its name to access information on the device. You can see the device’s unique identifier. You can see provisioning profiles that have been installed on the device. You can view the device’s console log in real time, just as if you were running the Console application to view your computer’s logs. You can see log reports for crashes that took place on the device. And you can take screenshots that image your device’s screen; you’ll need to do this for your app when you submit it to the App Store.
Gauges and Instruments
Xcode provides tools for probing the internal behavior of your app graphically and numerically, and you should keep an eye on those tools. The gauges in the Debug navigator, new in Xcode 5, allow you to monitor CPU and memory usage any time you run your app. And Instruments, a sophisticated and powerful utility application, collects profiling data that can help track down memory management problems and provide the numeric information you need to improve your app’s performance and responsiveness. You’ll probably want to spend some time with Instruments as your app approaches completion (optimizing prematurely is a waste of time and effort).
The gauges in the Debug navigator are operating whenever you build and run your app. Keep an eye on them to track your app’s CPU and memory usage. Click on a gauge to see further detail displayed in the editor. The gauges do not provide highly detailed information, but they are extremely lightweight and always active, so they provide an easy way to get a general sense of your running app’s behavior at any time. In particular, if there’s a problem, such as a prolonged period of unexpectedly high CPU usage or a relentless unchecked increase in memory usage, you can spot it in the gauges and then use Instruments to help track it down.
In Figure 9-11, I’ve been exercising my app for a few moments, repeatedly performing the typical actions I expect the user to perform most often. The Memory gauge in the Debug navigator looks fairly flat, which is a good sign, but just to be on the safe side I’ve clicked on it to view the larger memory usage charts in the editor. Certain actions, when performed for the first time, have caused memory to spike or increase, but as these actions are repeated my app’s memory usage seems to have settled down and leveled off, so I don’t suspect any memory issues.
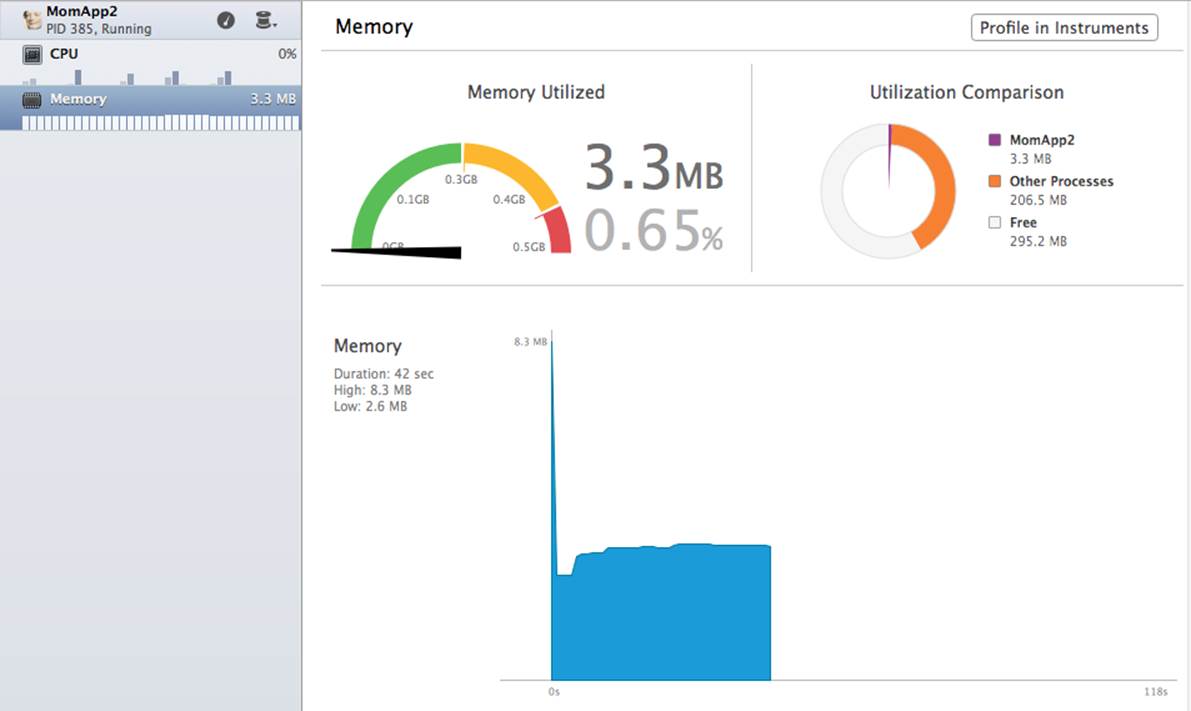
Figure 9-11. The Debug navigation gauges
You can use Instruments on the Simulator or the device. The device is where you’ll do your ultimate testing, for maximum verisimilitude, and certain instruments (such as Core Animation) are available only for the device.
To get started with Instruments, set the desired destination in the Scheme pop-up menu in the project window toolbar, and choose Product → Profile. Your app builds using the Profile action for your scheme; by default, this uses the Release build configuration, which is probably what you want. If you’re running on a device, you may see some validation warnings, but you can safely ignore them. Instruments launches; if your scheme’s Instrument pop-up menu for the Profile action is set to Ask on Launch (the default), Instruments presents a dialog where you choose a trace template.
Alternatively, click Profile In Instruments in a Debug navigator gauge editor; this launches Instruments, selecting the appropriate trace template for you. A dialog offers two options: Restart stops your app and relaunches it with Instruments, whereas Transfer keeps your app running and hooks Instruments into it. Typically, Restart is what you want: you’ve noticed a possible problem in the gauges, and you want to reproduce it under the more detailed monitoring of Instruments.
With Instruments running, you should interact with your app like a user; Instruments will record its statistics. Once Instruments is running, it can be further customized to profile the kind of data that particularly interests you, and you can save the structure of the Instruments window as a custom template.
Use of Instruments is an advanced topic, which is largely beyond the scope of this book. Indeed, an entire book could (and really should) be written about Instruments alone. For proper information, you should read Apple’s documents, especially the Instruments User Reference andInstruments User Guide. Also, many WWDC videos from current and prior years are about Instruments; look particularly for sessions with “Instruments” or “Performance” in their names. Here, I’ll just demonstrate, without much explanation, the sort of thing Instruments can do.
I’ll start by charting the memory usage of my TidBITS News app as it starts up and the user proceeds to work with it. Memory is a scarce resource on a mobile device, so it’s important to be certain that we’re not hogging too much of it. I’ll set the destination to the Simulator and choose Product → Profile; Instruments launches, and I’ll choose the Allocations trace template and click Profile. My app starts running in the Simulator, and I work with it for a while and then pause Instruments, which meanwhile has charted my memory usage (Figure 9-12). Examining the chart, I find there are a couple of spikes early on, first as the app launches and then as the app downloads and parses an RSS feed; but it’s only 5.40 MB at its maximum, and the app settles down to use slightly over 2 MB pretty steadily thereafter. These are very gentle memory usage figures, and memory returns to the same level when the app’s interface is returned to its base state, so I’m happy.
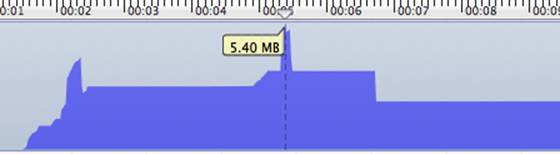
Figure 9-12. Instruments graphs memory usage over time
Another field of Instruments expertise is the ability to detect memory leaks. Memory leaks, discussed further in Chapter 12, remain possible even under ARC. In this trivial example, I have two classes, MyClass1 and MyClass2; MyClass1 has an ivar property which is a MyClass2 instance, and MyClass2 has an ivar property which is a MyClass1 instance. The app runs this code:
MyClass1* m1 = [MyClass1 new];
MyClass2* m2 = [MyClass2 new];
m1.ivar = m2;
m2.ivar = m1;
There are steps I could have taken to prevent this from being a memory leak, as I’ll explain in Chapter 12; but I haven’t taken those steps, so it is a memory leak. I’ll set the destination to the Simulator and choose Product → Profile; Instruments launches, and I’ll choose the Leaks trace template and click Profile. My app starts running in the Simulator, and after about 10 seconds (the default interval at which Instruments runs its leak analysis), a leak is detected. After some appropriate button-pushing, I’m actually shown a diagram of the mistake that’s causing this leak (Figure 9-13)!
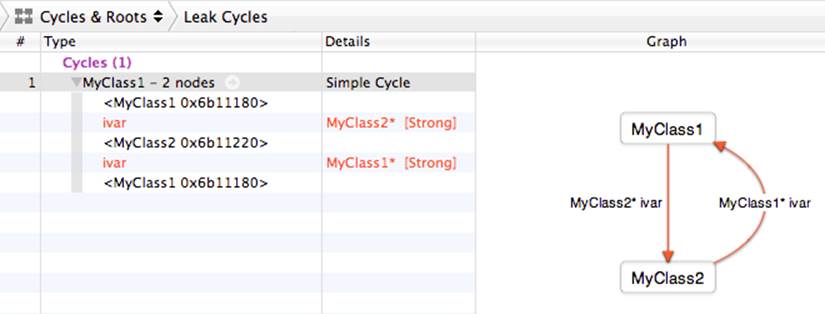
Figure 9-13. Instruments describes a leak
NOTE
When using Instruments to explore memory management, it may help to change the scheme so that the Profile action uses the Debug configuration; it defaults to using the Release configuration, which optimizes your code in ways that can obscure memory management details.
In this final example, I’m concerned with what’s taking my Albumen app so long to switch from master view to detail view. I’ll set the destination to a device, because that’s where speed matters and needs to be measured, and choose Product → Profile; Instruments launches, and I’ll choose the Time Profiler trace template and click Profile. The master view appears; I’ll tap a cell in the table view, and after a significant delay, the detail view appears. Now I’ll pause Instruments and look at what it’s telling me.
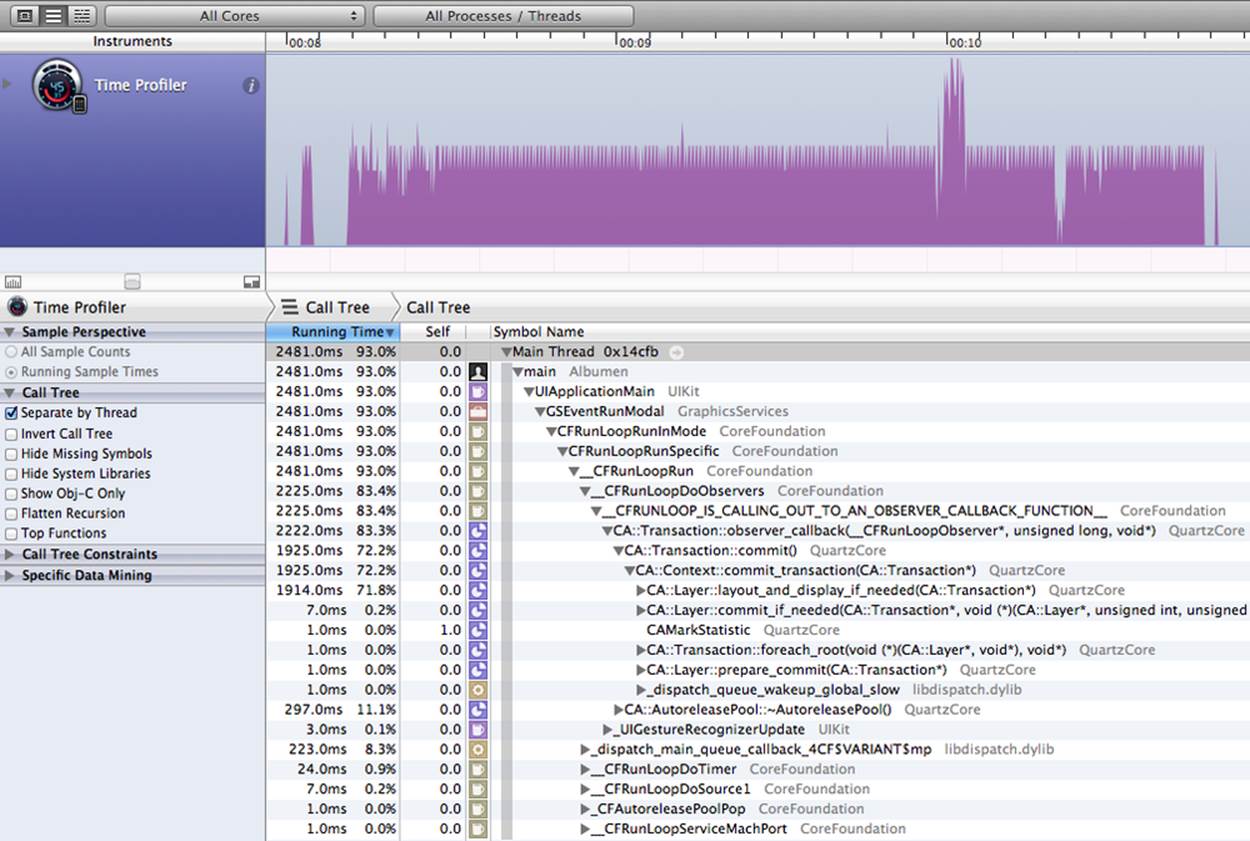
Figure 9-14. A time profile in Instruments
As we can see from Figure 9-14, this transition is taking nearly three seconds. Opening the triangles in the lower portion of the window, it turns out that much of this is spent in something described as CA::Layer::layout_and_display_if_needed. That’s not my code; it’s deep inside Cocoa. But by clicking the little arrow that appears to the right of that line when I hover the mouse over it, I can see the call stack and discover how my code is involved in this call (Figure 9-15).
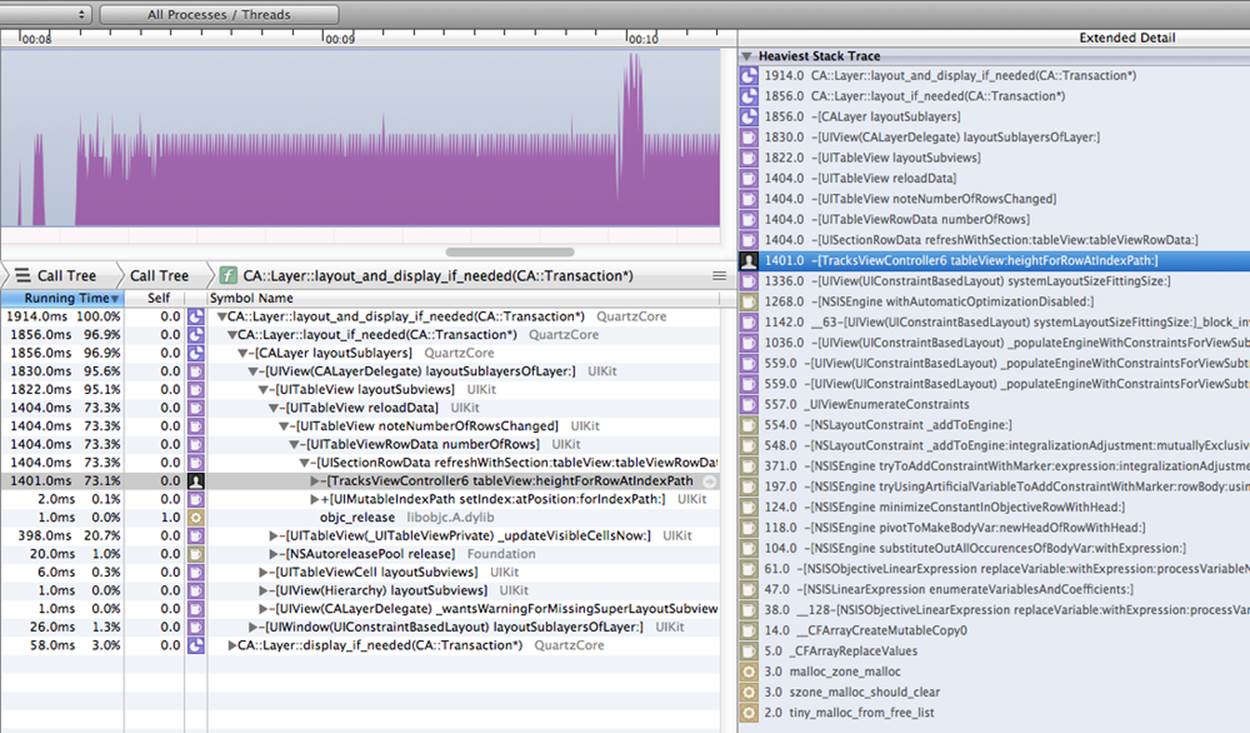
Figure 9-15. Drilling down into the time profile
One line of my code is involved in this call: tableView:heightForRowAtIndexPath:. This is where we work out the heights of the table view cells to be shown in the detail view. By double-clicking the listing of that line, I can see my own code, time-profiled (Figure 9-16).
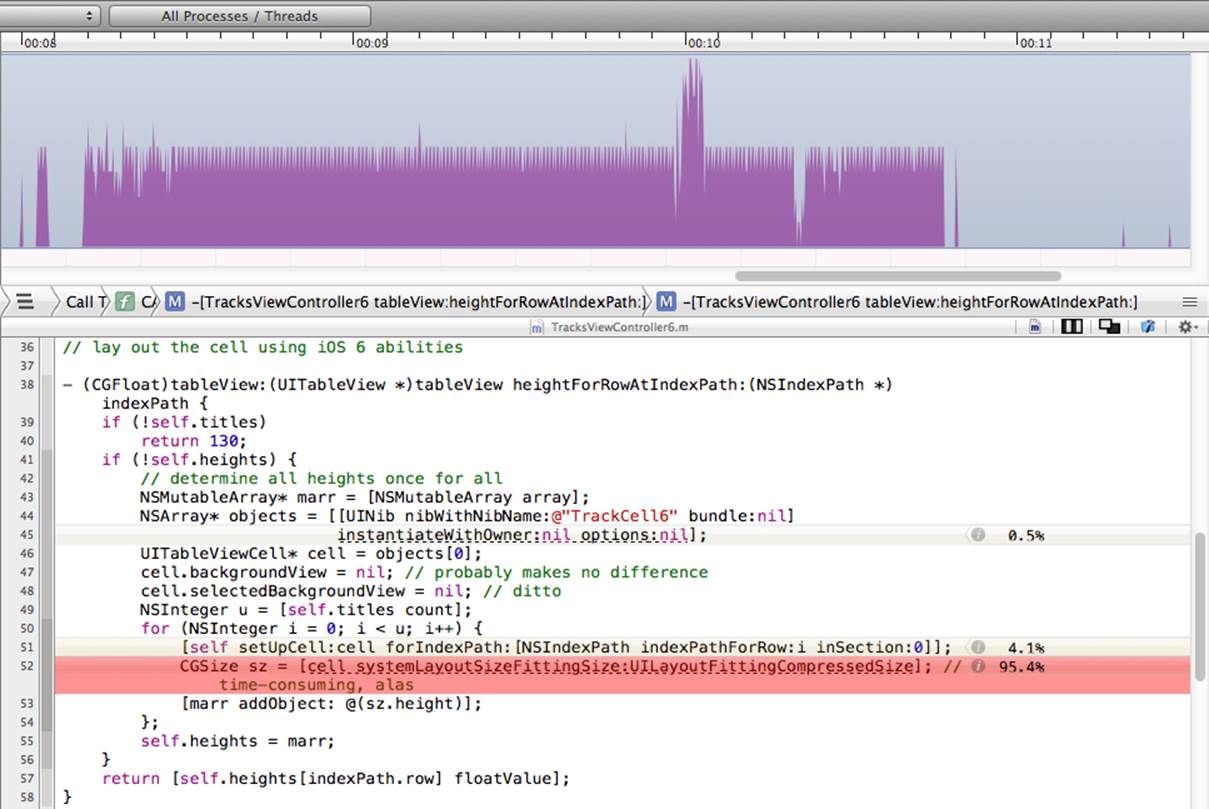
Figure 9-16. My code, time-profiled
This is really useful information. It’s also fairly depressing. The bulk of the time is being spent in Cocoa’s systemLayoutSizeFittingSize:. That call is how I calculate the height of the table view cell using autolayout. This approach is working perfectly, but clearly it is relatively expensive, and I need to decide whether to keep using it.
Localization
A device can be set by the user to prefer a certain language as its primary language. You might like the text in your app’s interface to respond to this situation by appearing in that language. This is achieved by localizing the app for that language. You will probably want to implement localization relatively late in the lifetime of the app, after the app has achieved its final form, in preparation for distribution.
Localization operates through localization folders in your project folder and in the built app bundle. Let’s say that a resource in one of these localization folders has a counterpart in the other localization folders. Then, when your app goes to load such a resource, it automatically loads the one appropriate to the user’s preferred language.
For example, if there’s a copy of InfoPlist.strings in the English localization folder and a copy of InfoPlist.strings in the French localization folder, the latter will be used when the app needs a copy of InfoPlist.strings on a device on which French is the preferred language. Not for nothing have I used InfoPlist.strings as my example. This is a file that’s present by default in your project — for example, it appears in our Empty Window example project — but its purpose wasn’t discussed in Chapter 6, so presumably you’ve been on tenterhooks since then, wondering what it was for. Well, it’s a .strings file; the purpose of a .strings file is to be localized.
The purpose of this particular .strings file, InfoPlist.strings, is to store localized versions of Info.plist key values. So, for example, the value of the CFBundleDisplayName key, as set in your project’s Info.plist file, appears as the name under your app’s icon on the user’s device. We might want to change this name depending on the user’s primary language setting. For example, on a French language device, we might like our Empty Window app to be called Fenêtre Vide.
As an example of localization, let’s arrange for that very thing to happen. First we must set up our app for localization to French; then we must localize InfoPlist.strings.
1. Edit the project. Under Info, the Localizations table lists our app’s localizations.
2. Click the Plus button under the Localizations table. From the pop-up menu that appears, choose French.
3. A dialog appears, listing files that are currently localized for English (because they came that way as part of the app template). We’re dealing here with just InfoPlist.strings, so leave it checked but uncheck any other files that appear here. Click Finish.
We have now set up InfoPlist.strings to be localized for both English and French. This fact is reflected in two ways:
§ In the Project navigator, the listing for InfoPlist.strings has acquired a flippy triangle. Open the triangle to reveal that our project now contains two copies of InfoPlist.strings, one for English and one for French (Figure 9-17). Thus we can now edit either one individually.
§ In the Empty Window project folder on disk, there is now both an en.lproj folder and a fr.lproj folder. The former contains the copy of InfoPlist.strings destined for English language users; the latter contains the copy of InfoPlist.strings destined for French language users. Moreover, when we build, this folder structure is copied into the built app.

Figure 9-17. How a localized strings file is represented in Xcode
Now let’s edit our InfoPlist.strings files. A .strings file is simply a collection of key–value pairs in the following format:
/* Optional comments are C-style comments */
"key" = "value";
In the case of InfoPlist.strings, the key is simply the key name from Info.plist — the raw key name, not the English-like name. So the English InfoPlist.strings should look like this:
"CFBundleDisplayName" = "Empty Window";
The French InfoPlist.strings should look like this:
"CFBundleDisplayName" = "Fenêtre Vide";
Now let’s try it!
1. Build and run Empty Window on the iPhone Simulator.
2. In Xcode, stop the running project. In the Simulator, the home screen is revealed.
3. Examine the name of our app, as displayed in the Simulator home screen. It is Empty Window (perhaps truncated).
4. In the Simulator, launch the Settings app and change the language to French (General → International → Language → Français). Our app’s name is now displayed as Fenêtre Vide.
Is this fun or what? When you’re done marveling at your own cosmopolitanism, change the Simulator’s language back to English.
Now let’s talk about nib files. Before Xcode 4.5 and iOS 6, it was necessary to localize a copy of the entire nib. So, for example, if you wanted a French version of a nib file, you were constantly maintaining two separate nib files. If you created a button in one nib file, you had to create the same button in the other — except that in one, the title was in English, while in the other, the title was in French. And so on, for every interface object and every localization language. It doesn’t sound like much fun, does it?
Nowadays, happily, there’s a better way — base internationalization. If a project uses base internationalization, then a correspondence can be created between a nib file in a Base.lproj folder and a .strings file in a localization folder. Thus the developer has just one copy of the nib file to maintain. If the app runs on a device that’s localized for a language for which a .strings file exists, the strings in the .strings file are substituted for the strings in the nib file.
By default, our Empty Window project does use base internationalization, and its Main.storyboard file is in a Base.lproj folder. So we’re ready to localize the storyboard file for French:
1. Edit Main.storyboard and look at the File inspector. Under Localization, Base should be checked already. In addition, check French.
2. In the Project navigator, examine the listing for Main.storyboard. It now has a flippy triangle. Flip it open. Sure enough, there is now a base-localized Main.storyboard and a French-localized Main.strings.
3. Edit the French Main.strings. It has been created automatically, with keys corresponding to every interface item in Main.storyboard that has a title. You have to deduce, from comments and the key names, how this correspondence works. In our case, there’s just one interface item inMain.storyboard, and anyway it’s pretty easy to guess what interface item the key represents. It looks something like this:
4. /* Class = "IBUIButton"; normalTitle = "Howdy!"; ObjectID = "Df5-YJ-JME"; */
"Df5-YJ-JME.normalTitle" = "Howdy!";
5. In the second line, containing the key–value pair, change the value to "Bonjour!". Don’t change the key! It has been generated automatically, and correctly, so as to specify the correspondence between this value and the title of the button.
Now we’re going to run the project in the Simulator and test it under English and French localizations. Before doing that, if there’s a self.button line in ViewController.m, comment it out! That line changes the title of the button from its title in the nib — but it’s the title in the nib that we’re localizing.
Run the project. You should see that when the device is localized for English, the button’s title is “Howdy!”, but when the device is localized for French, the button’s title is “Bonjour!”
If we now modify the nib — let’s say we add another button to the view in Main.storyboard — there’s no automatic change to the corresponding .strings file(s), which must be regenerated manually. Therefore, in real life it’s a good idea not to start localizing your nib files until your interface is pretty much finished. Here’s what to do:
1. Select Main.storyboard and choose File → Show in Finder.
2. Run Terminal. Type ibtool --export-strings-file output.strings followed by a space, and drag Main.storyboard from the Finder into the Terminal window. Press Return.
The result is that a new strings file called output.strings based on Main.storyboard is generated in your home directory (or whatever the current directory is). Merging this information with the existing localized .strings files based on Main.storyboard is up to you.
For completeness, let’s talk about how to make your project use base initialization if it doesn’t already. We can use as an example our Truly Empty project, which came from the Empty Application template and had no nib file to start with. We gave it a ViewController.xib file. Let’s say we’d like to localize it. Here’s how:
1. Edit ViewController.xib and localize it for English by clicking the Localize button in the File inspector. A dialog appears asking if we want to start an .lproj file for English. We do, so click Localize.
2. Edit the project, and below the Localization table, check Use Base Internationalization.
3. A dialog appears, listing nib files that are currently localized only for English. At present, it lists just ViewController.xib, and it is checked. That’s good! Click Finish.
After that, the project is ready for you to add localizations to it, as in our earlier examples.
Finally, what about strings that appear in your app’s interface but whose value is generated in code? In the Empty Window app, an example would be the alert summoned by tapping the button. The approach is the same — a .strings file — but your code must be modified to use it explicitly. There are various ways to do this, but the simplest is to use the NSLocalizedString macro (which calls an NSBundle instance method, localizedStringForKey:table:). So, for example, we might modify our buttonPressed: method to look like this:
UIAlertView* av = [[UIAlertView alloc]
initWithTitle:NSLocalizedString(@"AlertGreeting", nil)
message:NSLocalizedString(@"YouTappedMe", nil)
delegate:nil
cancelButtonTitle:NSLocalizedString(@"Cool", nil)
otherButtonTitles:nil];
The string provided as the first argument to NSLocalizedString is intended as the key in a .strings file. (The second argument, which I’ve given as nil, would be in real life a message to your localizer explaining what the string is supposed to say.) Our code is now broken, however, as there is no corresponding .strings file! By default, the .strings file expected here is called Localizable.strings. But no such file exists. There’s no error, but these keys have no value either — so the key itself will be used when the alert appears, which is not what we want. You’ll need to create the required .strings file. Here’s how to do it:
1. Choose File → New → File.
2. The “choose a template” dialog appears. On the left, under iOS, select Resource. On the right, select Strings File. Click Next.
3. Name the file Localizable.strings. Pick an appropriate Group, and make sure this file is part of our Empty Window app target. Click Create.
4. Now we must localize the new file. In the Project navigator, select Localizable.strings. In the File inspector, under Localization, click the Localize button. In the resulting dialog, move the existing file into the English localization or the Base localization; they are the same in this project.
5. In the File inspector, you can now add localizations as desired. For example, check French.
You must now also provide our Localizable.strings files with content, in accordance with the localizable string keys specified in your code. You can do this by hand, or, just as we used the ibtool command-line tool to generate a .strings file from a nib, you can use the genstrings tool to generate a .strings file from a code file. For example, on my machine I would now say, in the Terminal:
$ genstrings /Users/matt/Desktop/Empty\ Window/Empty\ Window/ViewController.m
The result is a file Localizable.strings in the current directory, reading as follows:
/* No comment provided by engineer. */
"AlertGreeting" = "AlertGreeting";
/* No comment provided by engineer. */
"Cool" = "Cool";
/* No comment provided by engineer. */
"YouTappedMe" = "YouTappedMe";
Now you copy and paste that content into the English and French versions of our project’s Localizable.strings files, and go through those pairs, changing the value in each case so that it reads correctly for the given localization. For example, in the English Localizable.strings file:
"AlertGreeting" = "Howdy!";
And in the French Localizable.strings file:
"AlertGreeting" = "Bonjour!";
And so forth.
Archiving and Distribution
By distribution is meant providing to others who are not developers on your team your built app for running on their devices. There are two kinds of distribution:
Ad Hoc distribution
You are providing a copy of your app to a limited set of known users so that they can try it on their specific devices and report bugs, make suggestions, and so forth.
App Store distribution
You are providing the app to the App Store so that anyone can download it (possibly for a fee) and run it.
WARNING
There is a registration limit of 100 devices per year per developer (not per app), which limits your number of Ad Hoc testers. Devices used for development are counted against this limit.
To create a copy of your app for distribution, you need first to build an archive of your app. It is this archive that will subsequently be exported for Ad Hoc or App Store distribution. An archive is basically a preserved build. It has three main purposes:
Distribution
An archive will serve as the basis for an Ad Hoc distribution or an App Store distribution.
Reproduction
Every time you build, conditions can vary, so the resulting app might behave slightly differently. But an archive preserves a specific built binary; every distribution from a particular archive is guaranteed to contain an identical binary, and thus will behave the same way. This fact is important for testing: if a bug report comes in based on an app distributed from a particular archive, you can Ad Hoc distribute that archive to yourself and run it, knowing that you are testing exactly the same app.
Symbolication
The archive includes a .dSYM file which allows Xcode to accept a crash log and report the crash’s location in your code. This allows you to deal with crash reports from users.
Here’s how to build an archive of your app:
1. Set the destination in the Scheme pop-up menu in the project window toolbar to iOS Device. (Until you do this, the Product → Archive menu item will be disabled. You do not have to have a device connected; you are not building to run on a particular device, but saving an archive that will run on some device.)
2. If you like, edit the scheme to confirm that the Release build configuration will be used for the Archive action. (This is the default, but it does no harm to double-check.)
3. Choose Product → Archive. The app is compiled and built. The archive itself is stored in a date folder within your user Library/Developer/Xcode/Archives folder. Also, it is listed in the Organizer window under Archives, which may open spontaneously to show the archive you’ve just created. You can add a comment here; you can also change the archive’s name (this won’t affect the name of the app).
NOTE
In the past, I advised modifying your build project’s settings, possibly by adding a configuration, so that an archive would be signed at build time with a distribution profile. That now appears to be unnecessary! By default, an archive will be signed with a development profile; you’ll substitute a distribution profile when you export the archive later.
To perform any kind of distribution based on your archive, you will also need a distribution identity (a private key and a distribution certificate in your computer’s keychain) and a distribution profile especially for this app. If you’re doing an Ad Hoc distribution and an App Store distribution, you’ll need a separate distribution profile for each.
You can obtain a distribution identity from within Xcode in exactly the same way as I described obtaining a development identity: in the Accounts preference pane, in the View Details dialog for your team, click the Plus button and choose iOS Distribution. If that doesn’t work, obtain the certificate manually, just as I described for a development certificate.
You can’t create a distribution profile from Xcode; you have to do it at the Member Center, in your browser. Here’s how:
1. If this is to be an Ad Hoc distribution profile, collect the unique identifiers of all the devices where this build is to run, and add each of the device identifiers at the Member Center under Devices. (For an App Store distribution profile, omit this step.)
2. Make sure that the app is registered at the Member Center, as I described earlier in this chapter.
3. At the Member Center, under Provisioning Profiles, click the Plus button to ask for a new profile. In the Add iOS Provisioning Profile form, specify an Ad Hoc profile or an App Store profile. On the next screen, choose your app from the pop-up menu. On the next screen, choose your distribution certificate. On the next screen, for an Ad Hoc profile only, specify the devices you want this app to run on. On the next screen, give the profile a name.
Be careful about the profile’s name, as you will need to be able to recognize it later from within Xcode! My own practice is to assign a name containing both the name of the app and the term “AdHoc” or “AppStore”.
4. Click Generate to generate the profile. To obtain the profile, either click Download and then find the downloaded profile and double-click it to get Xcode to see it, or else open the View Details dialog in Xcode’s Accounts preference pane and click the Refresh button at the bottom left.
Ad Hoc Distribution
Apple’s docs say that an Ad Hoc distribution build should include an icon that will appear in iTunes, but my experience is that this step, though it does work, is unnecessary. If you want to include this icon, it should be a PNG or JPEG file, 512×512 pixels in size, and its name should beiTunesArtwork, with no file extension. Make sure the icon is included in the build, being present in the Copy Bundle Resources build phase.
Here are the steps for creating an Ad Hoc distribution file:
1. Build an archive of your app, as described in the previous section.
2. In the Organizer window, under Archives, select the archive and click the Distribute button at the upper right of the window. A dialog appears. Here, you are to specify a procedure; choose Save for Enterprise or Ad-Hoc Deployment. Click Next.
3. You are now asked to code-sign the app. You should see a list of distribution profiles. Choose the Ad Hoc distribution profile for this app — you see now the value of creating a meaningful name for the distribution profile!
4. After a while, a Save dialog appears. Give the file a useful name; this won’t affect the name of the app. Save the file to disk. It will have the suffix .ipa (“iPhone app”).
5. Locate in the Finder the file you just saved. Provide this file to your users with instructions.
A user should copy the .ipa file to a safe location, such as the Desktop, and then launch iTunes and drag the .ipa file from the Finder onto the iTunes icon in the Dock. Then the user should connect the device to the computer, make certain the app is present in the list of apps for this device and that it will be installed on the next sync, and finally sync the device to cause the app to be copied to it. (If this isn’t the first version of your app that you’ve distributed to your Ad Hoc testers, the user might need to delete the current version from the device beforehand; otherwise, the new version might not be copied to the device when syncing.)
If you listed your own device as one of the devices for which this Ad Hoc distribution profile was to be enabled, you can obey these instructions yourself to make sure the Ad Hoc distribution is working as expected. First, remove from your device any previous copies of this app (such as development copies) and any profiles that might be associated with this app (in the Settings app, under General → Profiles). Then copy the app onto your device by syncing with iTunes as just described. The app should run on your device, and you should see the Ad Hoc distribution profile on your device (in the Settings app). Because you are not privileged over your other Ad Hoc testers, what works for you should work for them.
Final App Preparations
As the big day approaches when you’re thinking of submitting your app to the App Store, don’t let the prospect of huge fame and massive profits hasten you past the all-important final stages of app preparation. Apple has a lot of requirements for your app, such as icons and launch images, and failure to meet them can cause your app to be rejected. Take your time. Make a checklist and go through it carefully. See the “App-Related Resources” chapter of Apple’s iOS App Programming Guide for full details.
At various stages, you can obtain validation of your app to confirm that you haven’t omitted certain requirements. For example, by default, a new project’s Release build configuration has the Validate Build Product build setting set to Yes. Thus, when I do a build of the Empty Window app we’ve developed in previous chapters, if that build uses the Release build configuration, Xcode warns that the app has no icon. When you submit your app to the App Store, it will be subjected to even more rigorous validation.
Fortunately, Xcode 5 (unlike earlier versions) provides some decent information on the icon and launch image sizes you’ll need. If you’re not using an asset catalog, the sizes are listed when you edit the app target, in the General tab (Figure 9-18). Add PNG images of the correct sizes to the project and click the folder button at the right end of a line to select that image in a dialog.
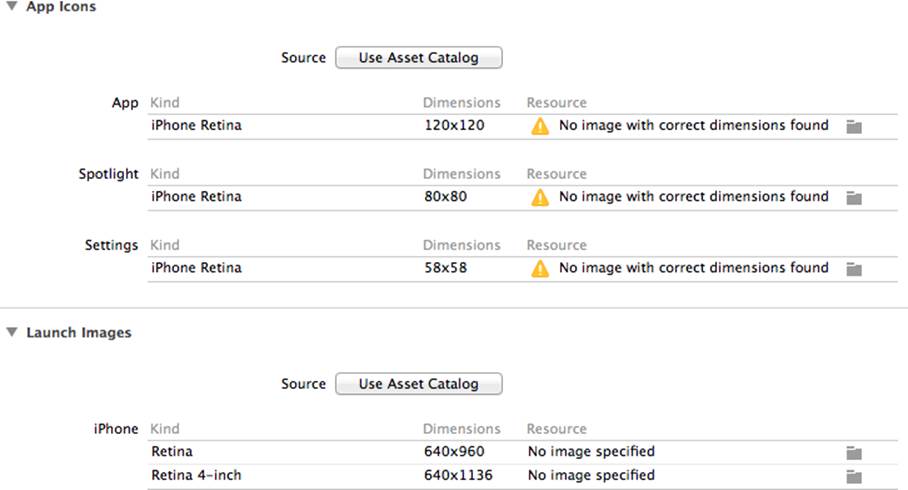
Figure 9-18. Icons and launch images, no asset catalog
If you’re not using an asset catalog for icons or launch images and you’d like to switch to using one, click the Use Asset Catalog button (Figure 9-18). The Use Asset Catalog button then changes to a pop-up menu listing the asset catalog’s name and the name of the image set within the catalog to be used for icons or launch images.
If you are using an asset catalog, the image sizes needed are listed in the asset catalog itself. Select an image slot and look in the Attributes inspector, under Expected Size. (Confusingly, “2x” means that the image should be double the listed dimensions for an icon, but not for a launch image.) You determine which slots should be displayed with checkboxes in the Attributes inspector when you select an icon set or launch image set (Figure 9-19). To add an image, drag it from the Finder into the appropriate slot.
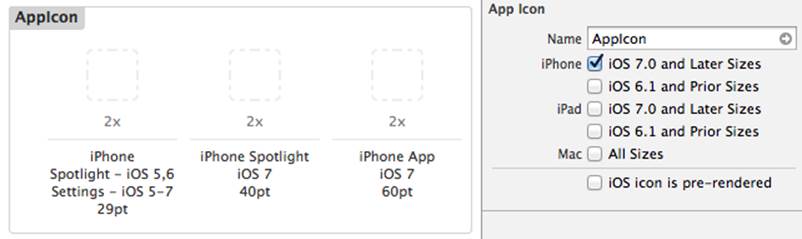
Figure 9-19. Icon slots in the asset catalog
I recommend using an asset catalog! It makes configuring your icons and launch images ridiculously simple, taking care of naming issues and correctly setting up your Info.plist at build time. I’ll give examples in the next sections.
Icons in the App
An icon file must be a PNG file, without alpha transparency. It should be a full square; the rounding of the corners will be added for you. For iOS 7, Apple seems to prefer simple, cartoony images with a few bright colors and possibly a gentle gradient background. Icon files must live at the top level of the app bundle.
On a device, the system uses the “Icon files” key (CFBundleIcons) in your app’s Info.plist file to locate your icons, and it decides which icon to use under what circumstances by examining their sizes. Therefore, these sizes must be exactly correct. The structure and details for the “Icon files” entry in the Info.plist can be elaborate and confusing, especially if your app is to run on multiple device types, and even more so if it is to run on multiple systems. Moreover, there are naming rules: the double-resolution variant of an icon (that is, an icon intended for a device with a double-resolution screen) should have @2x appended to its name.
Fortunately, the asset catalog (or the app target General tab if you’re not using an asset catalog) will take care of everything for you. When you provide an icon file, Xcode will balk if the file isn’t the right size. At build time, Xcode will write the icons out from the asset catalog to the top level of the app bundle, it will give them correct names, and it will configure the built app’s Info.plist to point to them correctly.
For example, let’s take the simplest case: an iPhone-only, iOS 7-only app. This requires a single 120×120 double-resolution icon — there is no need for a single-resolution variant, because iOS 7 doesn’t run on any single-resolution iPhone-type devices. Suppose I’ve dragged such an image from the Finder into the appropriate slot in my asset catalog, as shown in Figure 9-20.
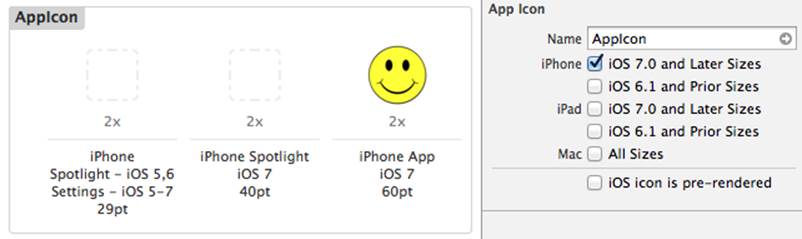
Figure 9-20. An icon in the asset catalog
Then, at build time, Xcode will write this image out to the top level of the app bundle, giving it the name AppIcon60x60@2x.png (the prefix “AppIcon” comes from the name of this image set in the catalog), and will insert the appropriate material into the Info.plist file, pointing to that image file so that the system on the device can find it:
<key>CFBundleIcons~iphone</key>
<dict>
<key>CFBundlePrimaryIcon</key>
<dict>
<key>CFBundleIconFiles</key>
<array>
<string>AppIcon60x60</string>
</array>
</dict>
</dict>
It seems pointless to summarize the required icon sizes for various systems and devices, because the Xcode 5 interface summarizes them so well. The key requirements are these:
For an iPhone app to run under iOS 7
One 120×120 double-resolution icon. iOS 7 doesn’t run on any single-resolution iPhone-type devices.
For an iPhone app to run under iOS 6 or earlier
A 57×57 icon and its 114×114 double-resolution variant.
For an iPad app to run under iOS 7
A 76×76 icon and its 152×152 double-resolution variant.
For an iPad app to run under iOS 6 or earlier
A 72×72 icon and its 144×144 double-resolution variant.
An app that is to run on multiple device types or on multiple systems (or both) will need all appropriate icons listed above. You can see why the asset catalog is a lifesaver!
Optionally, you may elect to include smaller versions of your icon to appear when the user does a search on the device (as well as in the Settings app if you include a settings bundle). The iOS 7 smaller icon sizes are 29×29 (58×58 double-resolution) for the Settings bundle, and 40×40 (80×80 double-resolution) for search results. However, I never include these icons.
Other Icons
When you submit an app to the App Store, you will be asked to supply a 1024×1024 PNG, JPEG, or TIFF icon to be displayed at the App Store. Have this icon ready before submission. Apple’s guidelines say that it should not merely be a scaled-up version of your app’s icon; but it must not differ perceptibly from your app’s icon, either, or your app will be rejected (I know this from bitter experience).
The App Store icon does not need to be built into your app; indeed, it should not be, as it will merely swell the built app’s size unnecessarily. On the other hand, you will probably want to keep it in your project (and in your project folder) so that you can find and maintain it easily. So I recommend that you import it into your project and copy it into your project folder, but do not add it to any target.
If you created an iTunesArtwork icon for Ad Hoc distribution, you may wish to delete it from the Copy Bundle Resources build phase now.
Launch Images
There is a delay between the moment when the user taps your app’s icon to launch it and the moment when your app is up and running and displaying its initial window. To cover this delay and give the user a visible indication that something is happening, you must provide a launch image, a PNG file, to be displayed during that interval.
The launch image might be just a blank depiction of the main elements or regions of the interface that will be present when the app has finished launching. In this way, when the app does finish launching, the transition from the launch image to the real app will be a matter of those elements or regions being filled in. The best way to create such a launch image is to start with a screenshot of your app’s actual initial interface. Typically, I insert some temporary code into my app such that it will launch into a blank version of its normal interface; I then take a screenshot of that, and remove the temporary code. Taking screenshots is covered in the next section.
In iOS 7, a launch image needs to be the full size of the screen. For an iPhone app, the height of the image should be the height of the screen, even if the app launches into landscape orientation (in that case, the launch image should be turned sideways to match the initial orientation). For an iPad app, you will usually supply a launch image for portrait orientation and another for landscape orientation (in both single and double resolution sizes).
In iOS 6 and before, an iPad launch image needs to have the status bar region trimmed off the top, unless the app launches into fullscreen mode with no status bar showing. The status bar region is the width of the image and 20 pixels high, meaning 40 pixels for a double-resolution image. (I use the shareware GraphicConverter, http://www.lemkesoft.com, to perform this trimming operation easily and precisely.)
Starting with the advent of the iPhone 5 (and fifth-generation iPod touch), whose screen has a taller height dimension than earlier devices, the launch image has a second purpose: it tells the system whether your app is to run “natively” on these devices. The rule is that if your app contains a launch image specifically targeted to this elongated screen size, your app will occupy the entire screen; if not, it will be displayed letterboxed, at the size of the iPhone 4 screen, with black bars at the top and bottom. This taller screen is what the asset catalog refers to as “R4”.
(That’s why, by default, as I mentioned in Chapter 6, the asset catalog generates a black launch image called LaunchImage-700-568h@2x~iphone.png at build time: if it didn’t, your app would be letterboxed on the taller screen.)
The base name of a launch image file can be either Default or else some other name specified in the Info.plist, and there are various additional name qualifiers that must be applied: -568h for a taller iPhone image, @2x for a double resolution image, and ~iphone or ~ipad for a device type. Moreover, in iOS 7, there’s a new UILaunchImages Info.plist key with a complex structure (see Apple’s Information Property List Key Reference for the gory details). As with app icons, the simplest solution is to use the asset catalog and let it take care of the file naming and the Info.plistsetup at build time.
Here are the pixel screen sizes for the current device types:
iPhone 4S and before
640×960 (double-resolution; iOS 7 doesn’t run on a single-resolution iPhone)
iPhone 5 and later
640×1136 (double-resolution; there is no single-resolution iPhone 5)
iPad
1024×768 and 2048×1536
Screenshots
When you submit the app to the App Store, you will be asked for one or more screenshots of your app in action to be displayed at the App Store. You should take these screenshots beforehand and be prepared to provide them during the app submission process.
The required screenshot sizes are listed in Apple’s iTunes Connect Developer Guide, under “Adding New Apps”; look for the table, “Upload file sizes and format descriptions”. The dimensions of a screenshot depend on its orientation and the screen size. You must provide at least one screenshot corresponding to the screen size of every device on which your app can run, except that all screenshots must be double-resolution — not because the target device will necessarily be double-resolution, but because there’s a chance that this screenshot will be viewed on a double-resolution device.
In iOS 6 and before, unless an app hid the status bar so as to run fullscreen, it was required to trim the status bar region off a screenshot before submitting it (as with iPad launch images, discussed in the previous section). In iOS 7 this isn’t necessary, since all apps are fullscreen apps.
You can obtain screenshots either from the Simulator or from a device connected to the computer:
Simulator
Run the app in the Simulator, using the destination (and, if necessary, the Simulator’s Hardware menu) to get the desired device type and resolution. Choose File → Save Screen Shot.
Device
In Xcode, in the Organizer window, locate your connected device under Devices and click Screenshots. Click New Screenshot, at the lower right of the window. The screenshot is then available in the Organizer window, and you can click Export to get it to the desktop and make it available for upload to the App Store.
You can alternatively take a screenshot on the device by clicking the screen lock button and the Home button simultaneously. Now the screenshot is in the Camera Roll in the Photos app, and you can communicate it to your computer in any convenient way (such as by emailing it to yourself).
If a screenshot is listed in the Organizer window, you can turn it directly into a launch image (see the previous section): select it and click Save as Launch Image. A dialog will ask what name to assign to it and what open project to add it to.
Property List Settings
A number of settings in the Info.plist are crucial to the proper behavior of your app. You should peruse Apple’s Information Property List Key Reference for full information. Most of the required keys are created as part of the template, and are given reasonable default values, but you should check them anyway. The following are particularly worthy of attention:
Bundle display name (CFBundleDisplayName)
The name that appears under your app’s icon on the device screen; this name needs to be short in order to avoid truncation.
Supported interface orientations (UISupportedInterfaceOrientations)
This key designates the totality of orientations in which the app is ever permitted to appear. You can perform this setting with checkboxes in the General tab of the target editor. But you may also need to edit the Info.plist manually to rearrange the order of possible orientations, because on an iPhone the first orientation listed is the one into which the app will actually launch.
Required device capabilities (UIRequiredDeviceCapabilities)
You should set this key if the app requires capabilities that are not present on all devices. Be sure to look over the list of possible values. Don’t use this key unless it makes no sense for your app to run at all on a device lacking the specified capabilities.
Bundle version (CFBundleVersion)
Your app needs a version number. The best place to set it is the General tab of the target editor. Things are a little confusing here because there is both a Version field and a Build field; the former corresponds in the Info.plist to “Bundle versions string, short” (CFBundleShortVersionString), while the latter corresponds to “Bundle version” (CFBundleVersion). As far as I can determine, Apple will pay attention to the former if it is set, and otherwise will fall back on the latter. In general I play it safe and set both to the same value when submitting to the App Store. The value needs to be a version string, such as “1.0”. This version number will appear at the App Store. Failure to increment the version string when submitting an update will cause the update to be rejected.
Status bar style (UIStatusBarStyle)
Over the years, Apple has changed its policy on the status bar more often than Liberace changes costume. We’ve had the “grey or black” policy, the “automatic color” policy, the “basic black on iPad” policy, and so forth. The new policy for iOS 7 is simple in itself, but it also reflects the ruined wreck of those earlier accretions.
Basically, on iOS 7, all apps are fullscreen apps, on both iPhone and iPad, and the status bar, if visible, is a transparent overlay. There are just two status bar styles: UIStatusBarStyleDefault, meaning the status bar text is black, and UIStatusBarStyleLightContent, meaning the status bar text is white. And the way you set the status bar style has changed in iOS 7; instead of setting it at application level, you set it at view controller level: your app’s view controllers, if they don’t want UIStatusBarStyleDefault, are expected to set the status bar style by implementing the preferredStatusBarStyle method.
Thus, the modern approach is not to set the status bar style in your Info.plist, but to let your view controllers do it at runtime.
Nonetheless, you still might want to set the status bar style in the Info.plist, typically for backwards compatibility, because your app also runs on iOS 6 or earlier, or because you have old code that you can’t adapt for iOS 7. In this case, continue to use the Info.plist status bar style setting as you did in the past; by default, this setting will be ignored on iOS 7.
It is also possible to ask that this setting not be ignored on iOS 7. To do so, set the Info.plist “View controller–based status bar appearance” key (UIViewControllerBasedStatusBarAppearance) to NO. This means that your app will not use view controller calls such aspreferredStatusBarStyle to determine the status bar style; instead, it will set the shared UIApplication’s statusBarStyle property, as in iOS 6 and before. Now your UIStatusBarStyle setting in the Info.plist will not be ignored on iOS 7; the old Black Translucent (“Transparent black style”, UIStatusBarStyleBlackTranslucent) and Black Opaque (“Opaque black style”, UIStatusBarStyleBlackOpaque) settings will both be treated as equivalent to the new UIStatusBarStyleLightContent. You can make these settings conveniently with the Status Bar Style pop-up menu in the General pane of the target editor.
Status bar is initially hidden (UIStatusBarHidden)
This is parallel to the status bar style. In iOS 7, you are expected to show and hide the status bar at the level of your individual view controllers, by implementing the prefersStatusBarHidden method. So this Info.plist setting will be ignored on iOS 7, unless you’ve also set theInfo.plist “View controller–based status bar appearance” key (UIViewControllerBasedStatusBarAppearance) to NO. The UIStatusBarHidden key can be conveniently set, if you still need it, with the “Hide during application launch” checkbox in the General pane of the target editor.
NOTE
Property list settings can adopt different values depending on what device type you’re running on. To specify that a property list setting applies only on a particular type of device, you add to its key the suffix ~iphone, ~ipod, or ~ipad. This feature is typically useful in a universal app, as I described earlier in this chapter.
Submission to the App Store
Before submitting your app to the App Store, it’s a good idea to build it as an archive, as described earlier in this chapter, and test it one last time as an Ad Hoc build. The archived build that appears in the Organizer window can be used to generate either an Ad Hoc build or an App Store build. You can’t test an App Store build, so you use this archived build to generate an Ad Hoc build and test with that. When you generate the App Store build, you use this same archived build; it is the exact same binary, so you are guaranteed that its behavior will be exactly the same as the build you tested.
When you’re satisfied that your app works well, and you’ve installed or collected all the necessary resources, you’re ready to submit your app to the App Store for distribution. To do so, you’ll need to make preparations at the iTunes Connect web site. You can find a link to it on the iOS developer pages when you’ve logged in at Apple’s site. You can go directly to http://itunesconnect.apple.com, but you’ll still need to log in with your iOS Developer username and password.
NOTE
The first time you visit iTunes Connect, you should go to the Contracts section and complete submission of your contract. You can’t offer any apps for sale until you do, and even free apps require completion of a contractual form.
I’m not going to recite all the steps you have to go through to tell iTunes Connect about your app, as these are described thoroughly in Apple’s iTunes Connect Developer Guide, which is the final word on such matters. But I’ll just mention the main pieces of information you will have to supply:
Your app’s name
This is the name that will appear at the App Store; it need not be identical to the short name that will appear under the app’s icon on the device, dictated by the “Bundle display name” setting in your Info.plist file. This name can be up to 255 characters long, though Apple recommends that you limit it to fewer than 70 and ideally to fewer than 35 characters. You can get a rude shock when you submit your app’s information to iTunes Connect and discover that the name you wanted is already taken. There is no reliable way to learn this in advance, and such a discovery can necessitate a certain amount of last-minute scrambling on your part.
Description
You must supply a description of fewer than 4,000 characters; Apple recommends fewer than 580 characters, and the first paragraph is the most important, because this may be all that users see at first when they visit the App Store. It must be pure text, without HTML and without character styling.
Keywords
This is a comma-separated list shorter than 100 characters. These keywords will be used, in addition to your app’s name, to help users discover your app through the Search feature of the App Store.
Support
This the URL of a web site where users can find more information about your app; it’s good to have the site ready in advance.
Copyright
Do not include a copyright symbol in this string; it will be added for you at the App Store.
SKU number
This is unimportant, so don’t get nervous about it. It’s just a unique identifier, unique within the world of your own apps. It’s convenient if it has something to do with your app’s name. It needn’t be a number; it can actually be any string.
Price
You don’t get to make up a price. You have to choose from a list of pricing “tiers.”
Availability Date
There’s an option to make the app available as soon as it is approved, and this will typically be your choice. Alternatively, Apple will send you an email when the app is approved, and you can then return to iTunes Connect and make the app available manually.
NOTE
You cannot validate or upload your app until you’ve formally told iTunes Connect that you have finished your preparations. You do this by clicking Ready to Upload Binary at the top right corner of the iTunes Connect web page. Omitting this step and then wondering why you can’t validate or submit is a common mistake.
When you’ve finished supplying the information for your app, you can do a final validation check: return to the Organizer window, select the archived build, and click Validate. (This feature has not worked well for me in the past, however.)
Finally, when you’re ready to upload the app for which you’ve already submitted the information at iTunes Connect, and when the iTunes Connect status for your app is “Waiting for Upload,” you can perform the upload using Xcode. Select the archived build in the Organizer and click Distribute. In the dialog, choose “Submit to the iOS App Store.” The upload will be performed, and the app will be validated at the far end.
Alternatively, you can use Application Loader. Export the archive as an .ipa file, as for an Ad Hoc distribution, but use the App Store distribution profile. Launch Application Loader by choosing Xcode → Open Developer Tool → Application Loader, and hand it the .ipa file.
You will subsequently receive emails from Apple informing you of your app’s status as it passes through various stages: “Waiting For Review,” “In Review,” and finally, if all has gone well, “Ready For Sale” (even if it’s a free app). Your app will then appear at the App Store.